Advanced MRA rendering techniques: A pictorial review

Applied Radiology — Vol. 31 , Issue 5 , pp. 18 -28

DOI: 10.37549/AR1094

Published: May 1, 2002

Lawrence N. Tanenbaum, MD

Categories

article Article ar

Magnetic resonance angiography (MRA) is typically rendered with whole volume maximum intensity projection (MIP) techniques. While ubiquitously available, user-friendly, and essentially automatic, MIP depiction is not ideal for all circumstances. Many of the shortcomings of MRA are attributable to conventional MIP rendering, rather than the limitations of the MR scan acquisition technique. Utilization of advanced rendering techniques, such as limited volume MIP, hard thresholded three-dimensional (3D), and volume-rendering, can improve the accuracy and acceptance of MRA in clinical practice.

Two-dimensional rendering

Advertisement

Maximum intensity projection

Two-dimensional (2D) projection and 3D rendering of MR (and computed tomography [CT]) source images are accomplished with a variety of techniques. The most commonly used is maximum intensity projection. With MIP techniques, a ray tracing is created in which the highest intensity pixels along the ray are depicted in a 2D fashion and intensities below an arbitrary threshold are eliminated. MIP algorithms determine the threshold for inclusion by considering the full range of intensities in the imaging volume, including quality signal and (interfering) noise (figure 1). All information included in the model is rendered at the same opacity—residual noise is as conspicuous as anatomy. Benefits of MIP rendering include rapid essentially automatic reconstruction with minimal operator input and dependence.
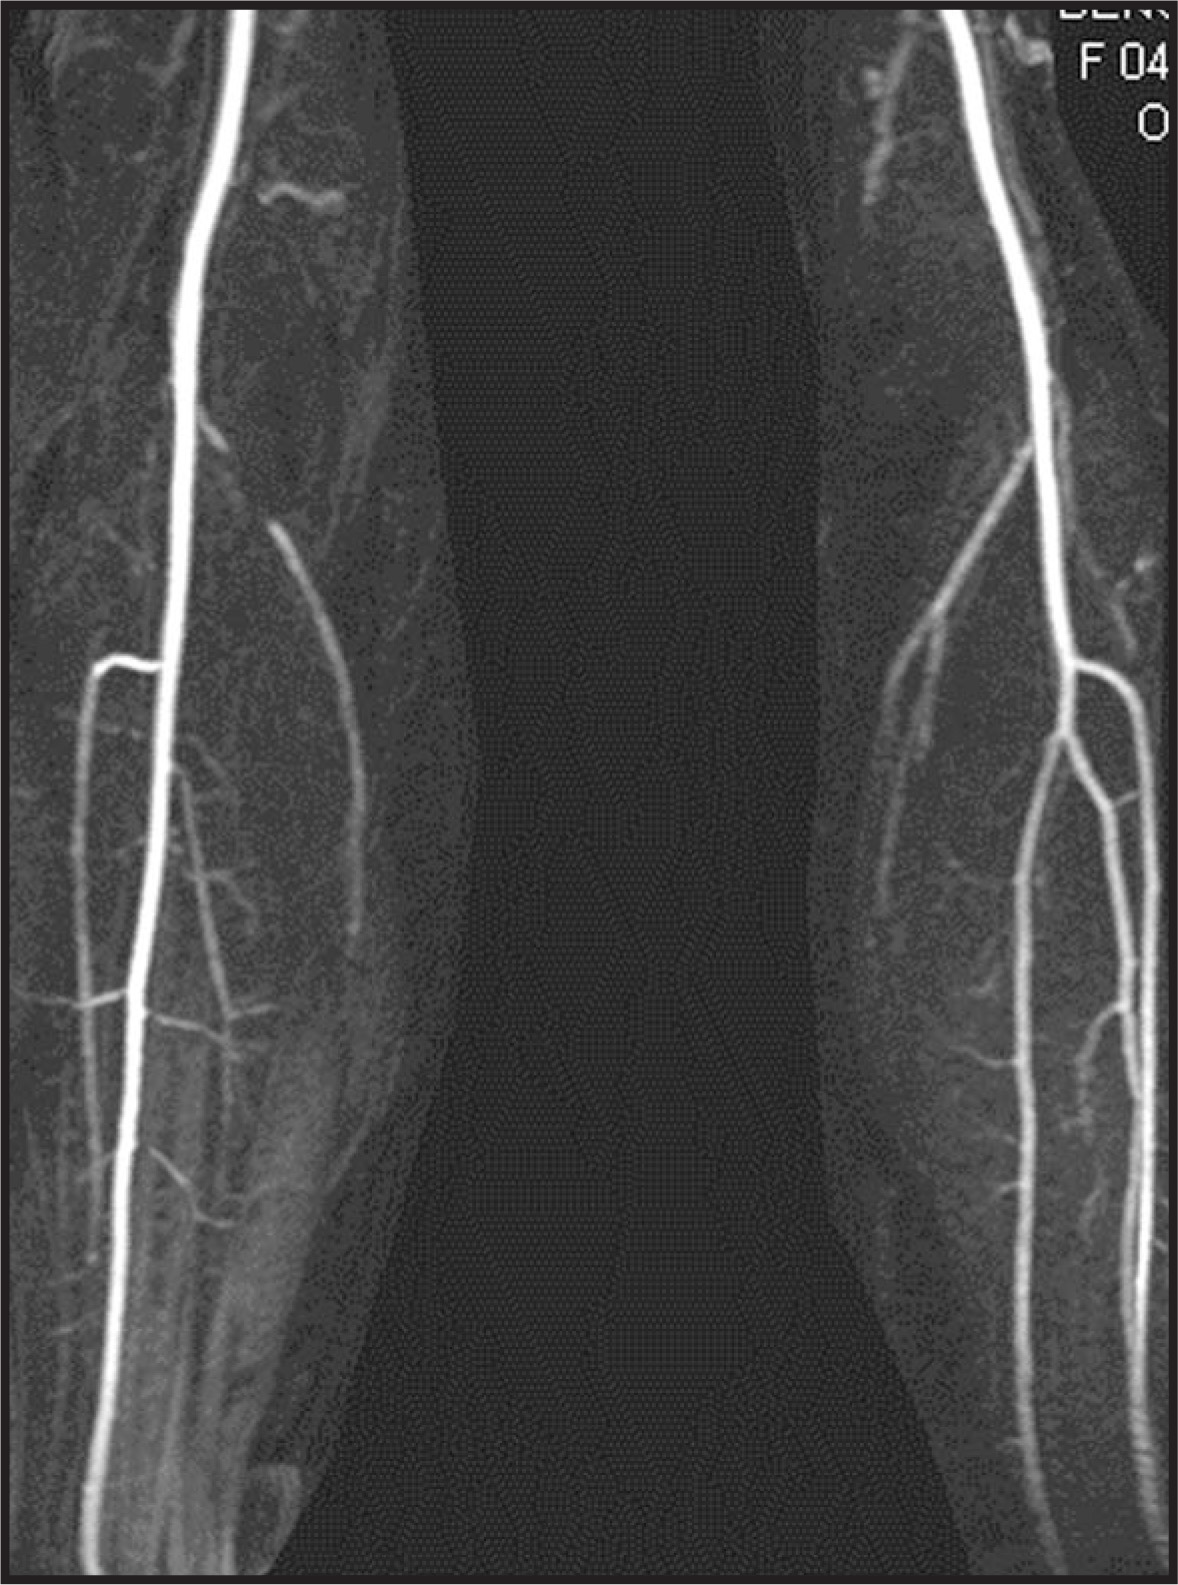
FIGURE 1.
FIGURE 1. Calf station on a contrastenhanced magnetic resonance angiography runoff study rendered with maximum intensity projection. Partially saturated background tissues are eliminated by the algorithm, which renders only the maximum intensity along the ray tracing. Note that MIP is a two-dimensional projection, so review of a full range of projections is critical to thorough interrogation.

While dynamic range is limited on MR MIP images, rendering of CT data does produce projections that reflect the inherent relative gray scale (Hounsfield units) of the source images. This allows calcified plaques to appear more intense than the contrast-opacified vessel lumen. Since MIP creates 2D depictions, projections must be created over 180° to integrate 3D information fully (figure 2).
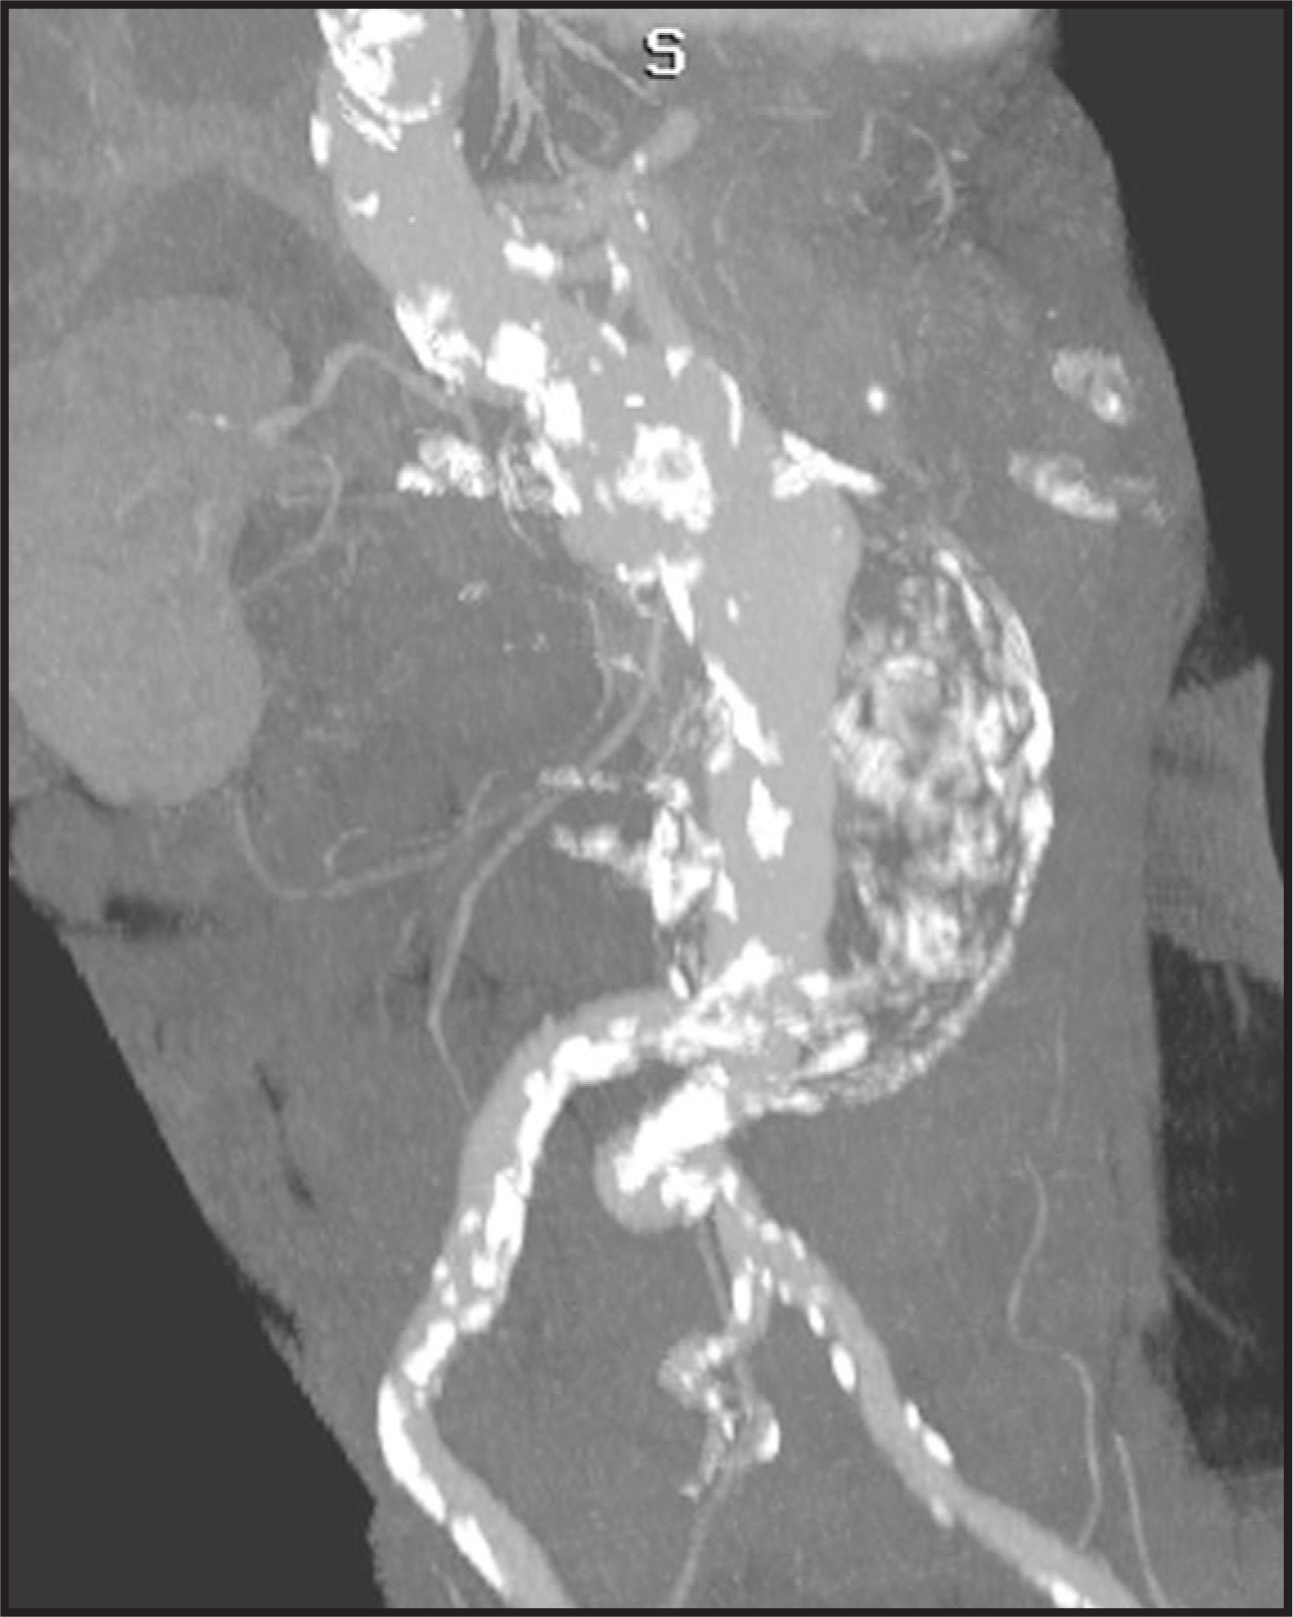
FIGURE 2.
FIGURE 2. CT angiography maximum intensity projection (MIP) of partially thrombosed abdominal aortic aneurysm. Note that CT MIP display easily differentiates calcified plaque from the contrast opacified lumen (see figure 19). Parameters critical to stent graft placement such as distance between the proximal aspect of the aneurysm and the lowest renal artery, the presence or absence of accessory renal arteries and the distance between the distal aspect of the aneurysm and the aortic bifurcation are easily gleaned. Particularly in the absence of mural calcification, review of source images remains essential for confirmation of aneurysm diameter.

MIP rendering is limited in areas of vascular overlap since there is no summation information. This potential for partial obscuration can limit evaluation of complex and tortuous anatomy, such as the circle of Willis and aortic branch vessels.

Limited volume MIP

Limiting the volume under consideration can improve pixel selection and enhance the accuracy of maximum intensity pixel projection. The ability to create a “scalpel” or freehand trace circumscribing regions of anatomy for inclusion or exclusion in the model is widely available and commonly employed. Isolating individual structures under evaluation, eg, a single carotid artery on an MRA of the neck both improves the accuracy of rendering and reduces overlap with adjacent structures (figure 3). In some circumstances with complex, overlapping, tortuous anatomy, or combined venous and arterial enhancement (as well as close proximity to bone on CT), isolation of the structures of interest in a volume may be extremely time consuming and problematic.
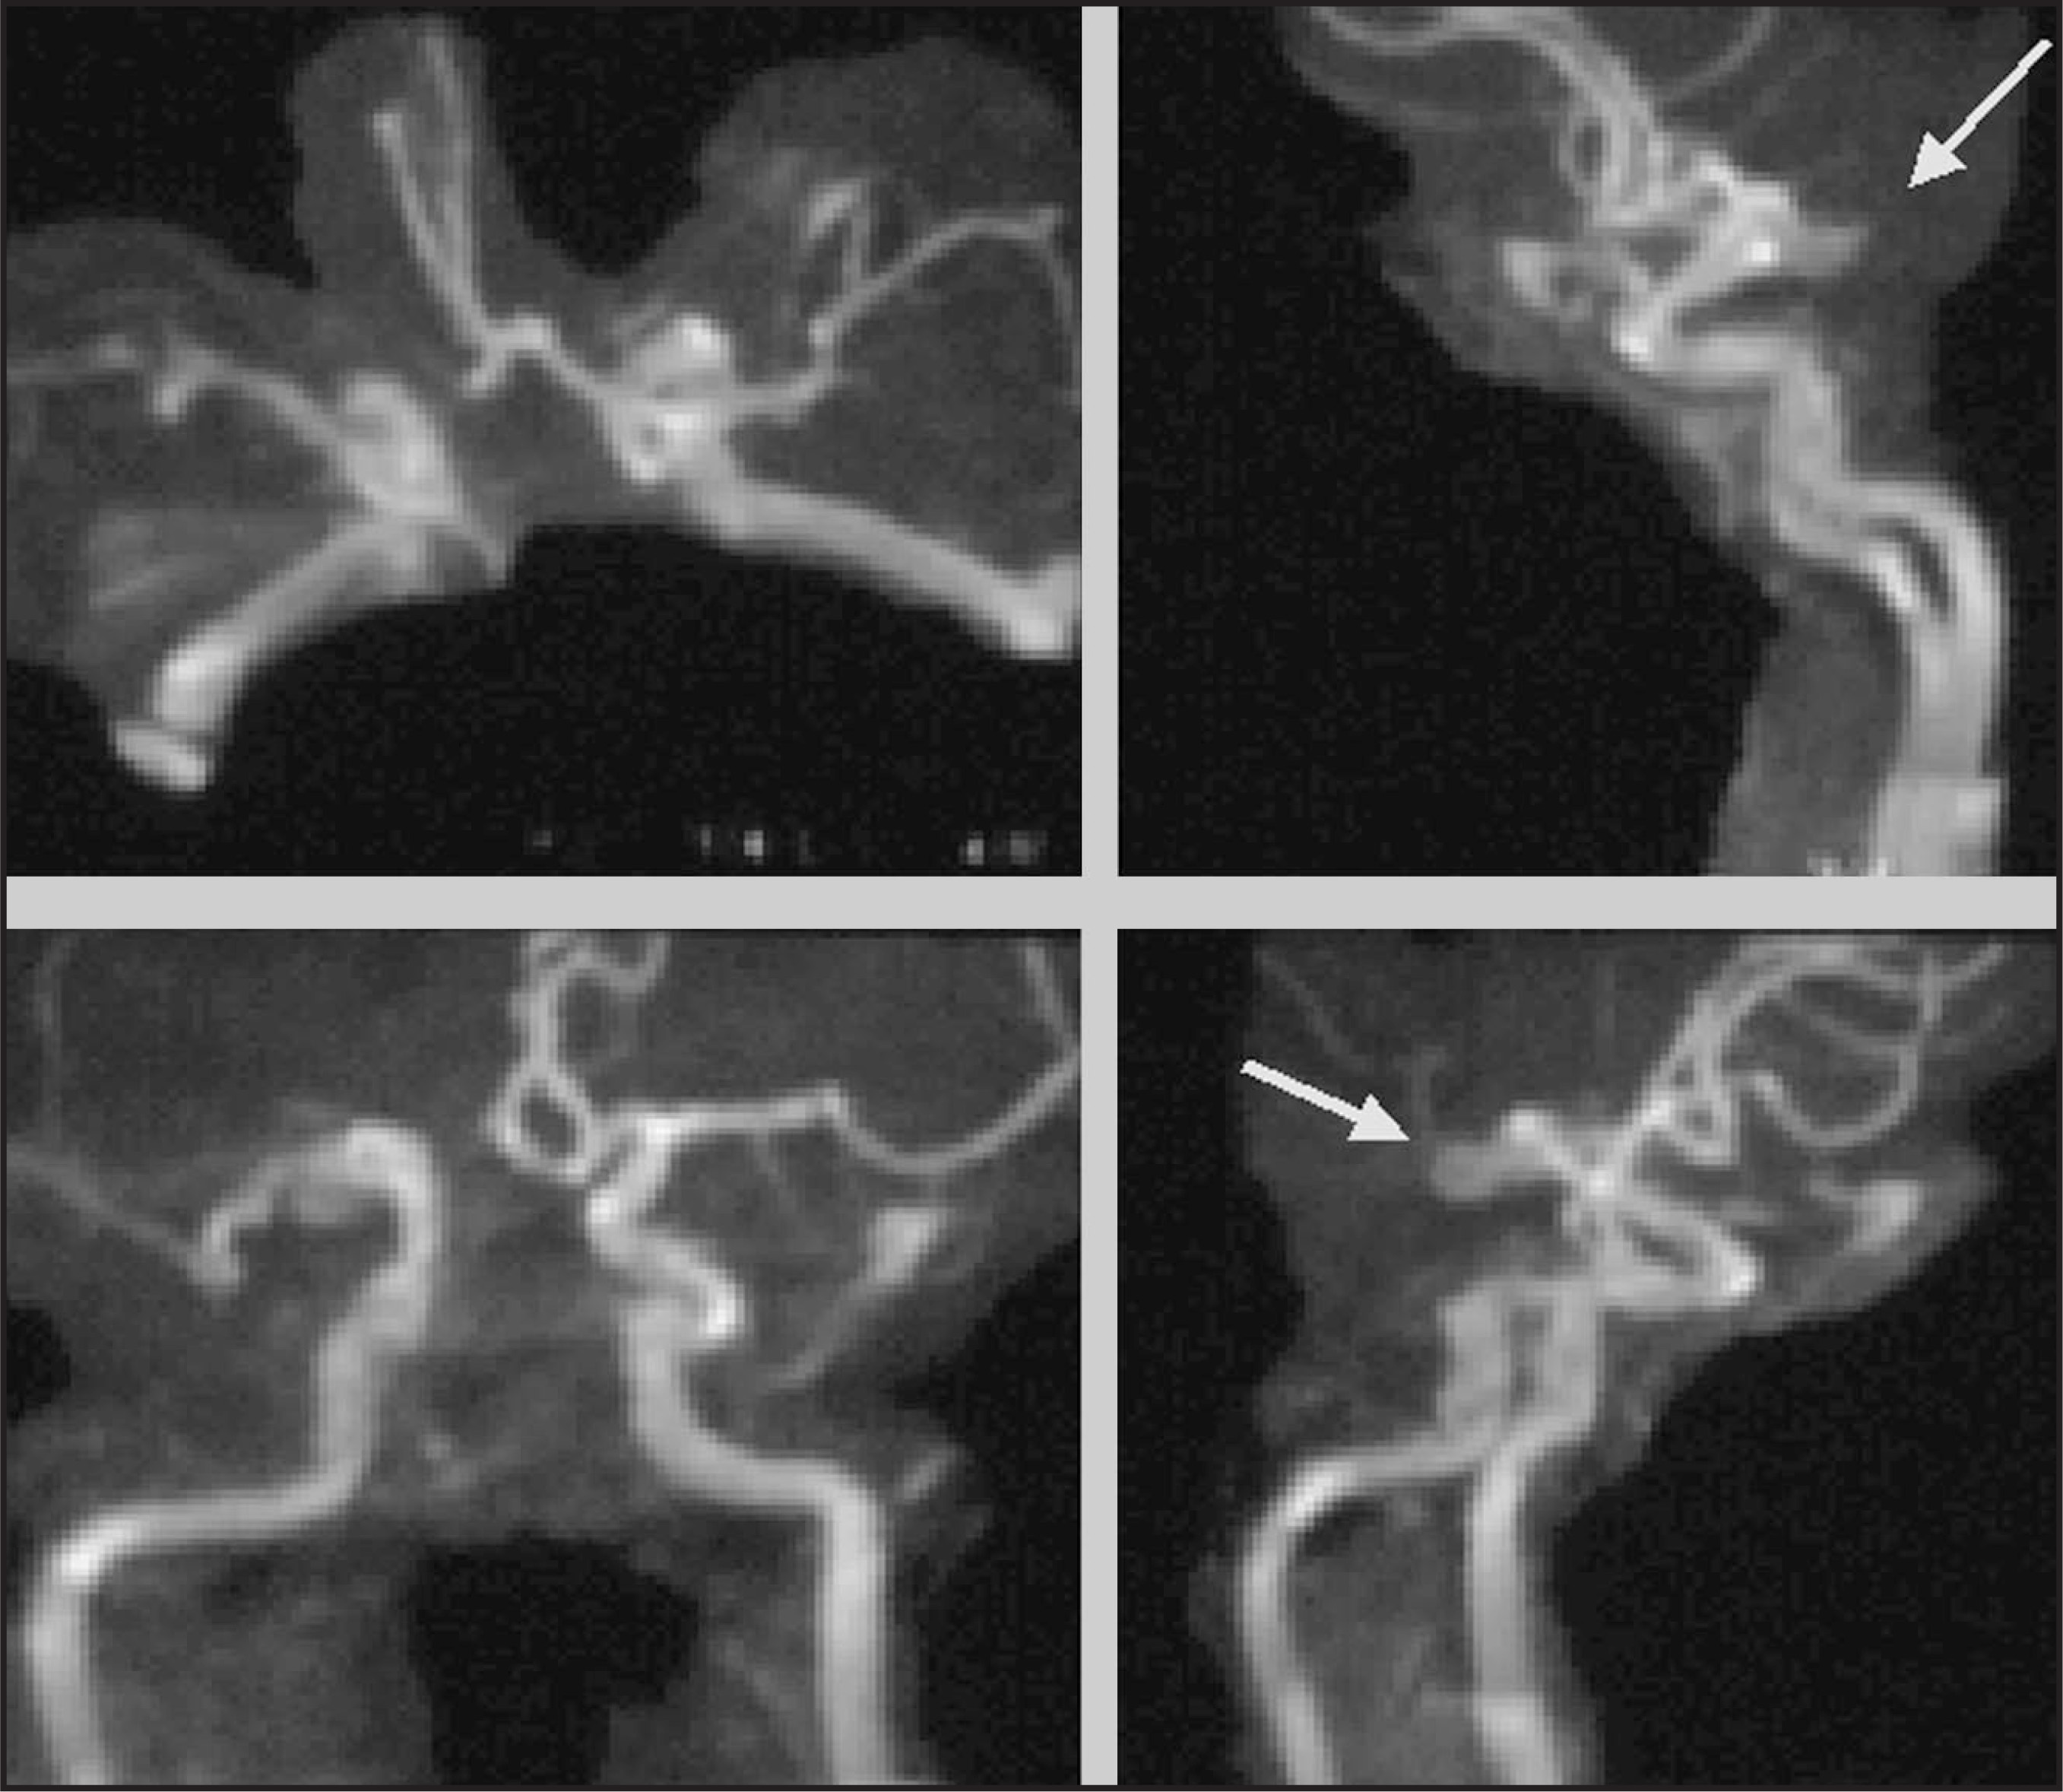
FIGURE 3.
FIGURE 3. Free-hand trace limited volume maximum intensity projection (MIP). Removing background signal and noise enhances the integrity of MIP. Elimination of the posterior circulation vascular structures permits visualization of the posterior communicating artery aneurysm in multiple projections. Note that the aneurysm is obscured on inferior projection or submentalvertex view (see figure 8).

Advertisement

OLIVE MIP

Overlapping, limited volume (OLIVE) MIP rendering can overcome many of the limitations of full-volume and regionally circumscribed MIP. These studies, also known as “sliding thin-slab MIPs” or “multiplanar volume reformations” (MPVR) are essentially a hybrid between multiplanar reformation and MIP. Limiting the volume improves the integrity of MIP and limits overlap from adjacent vascular (and on CT, bony) structures1,2 (figures 4 and 5).
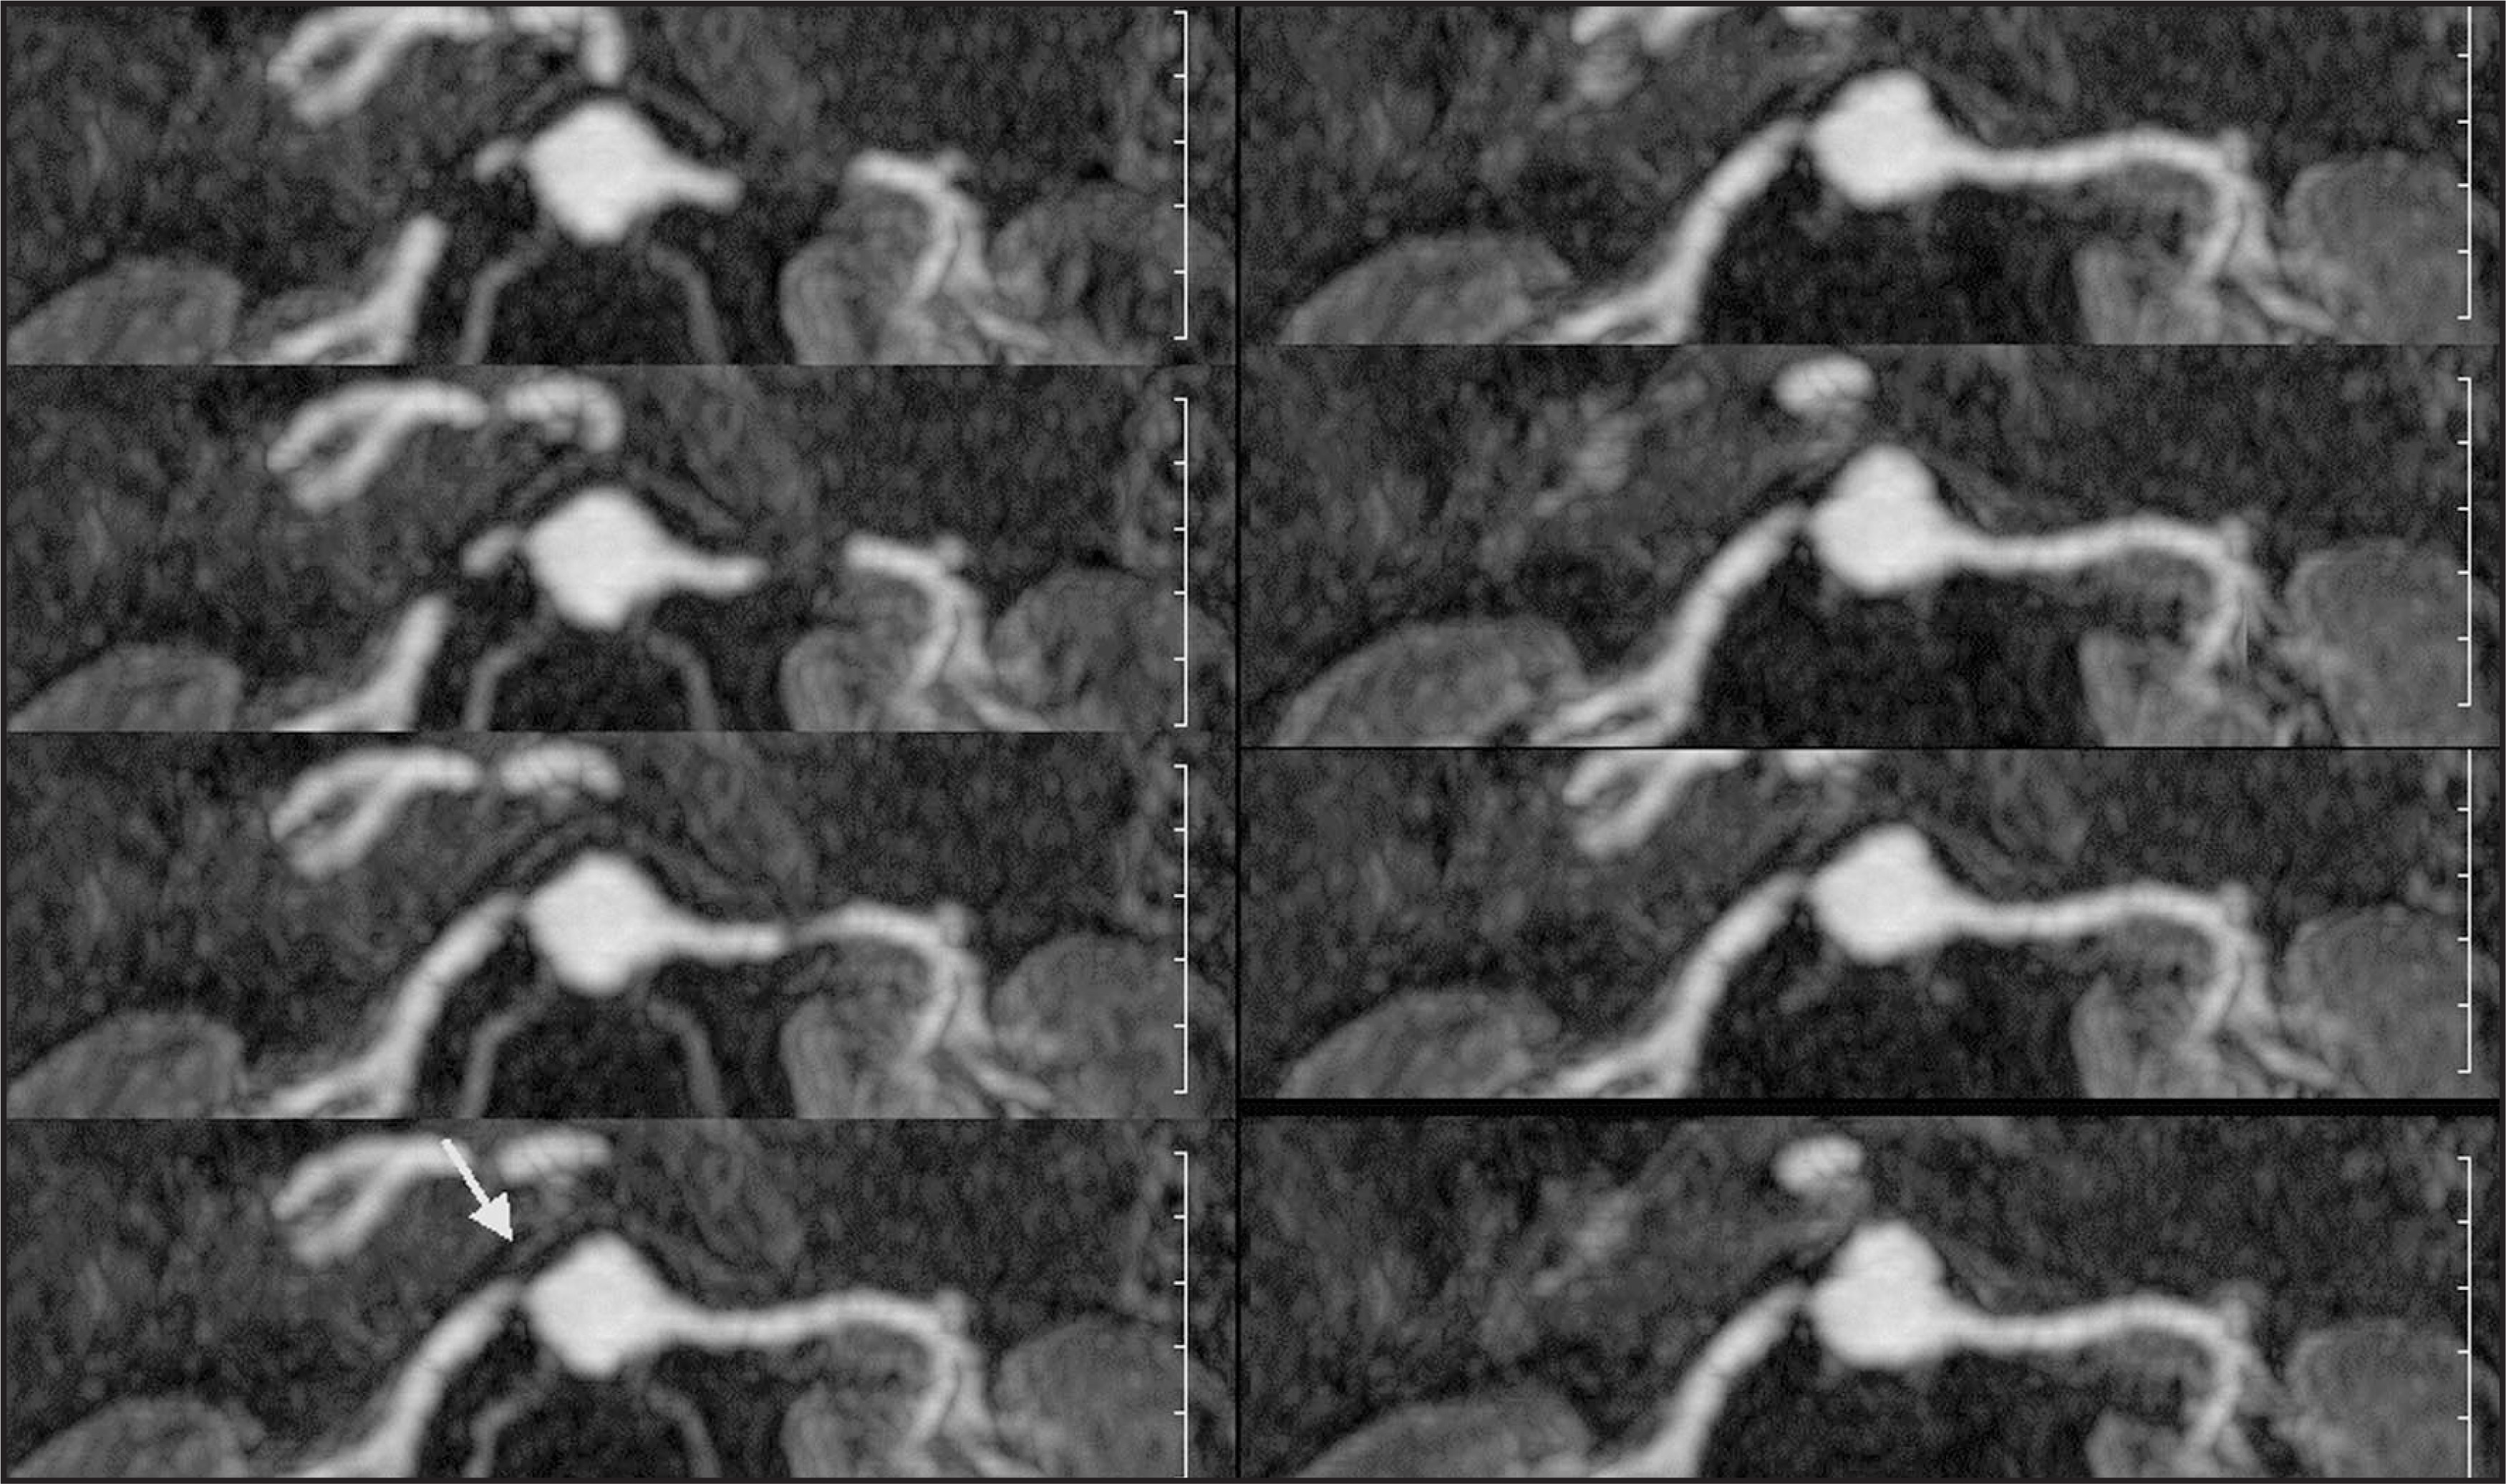
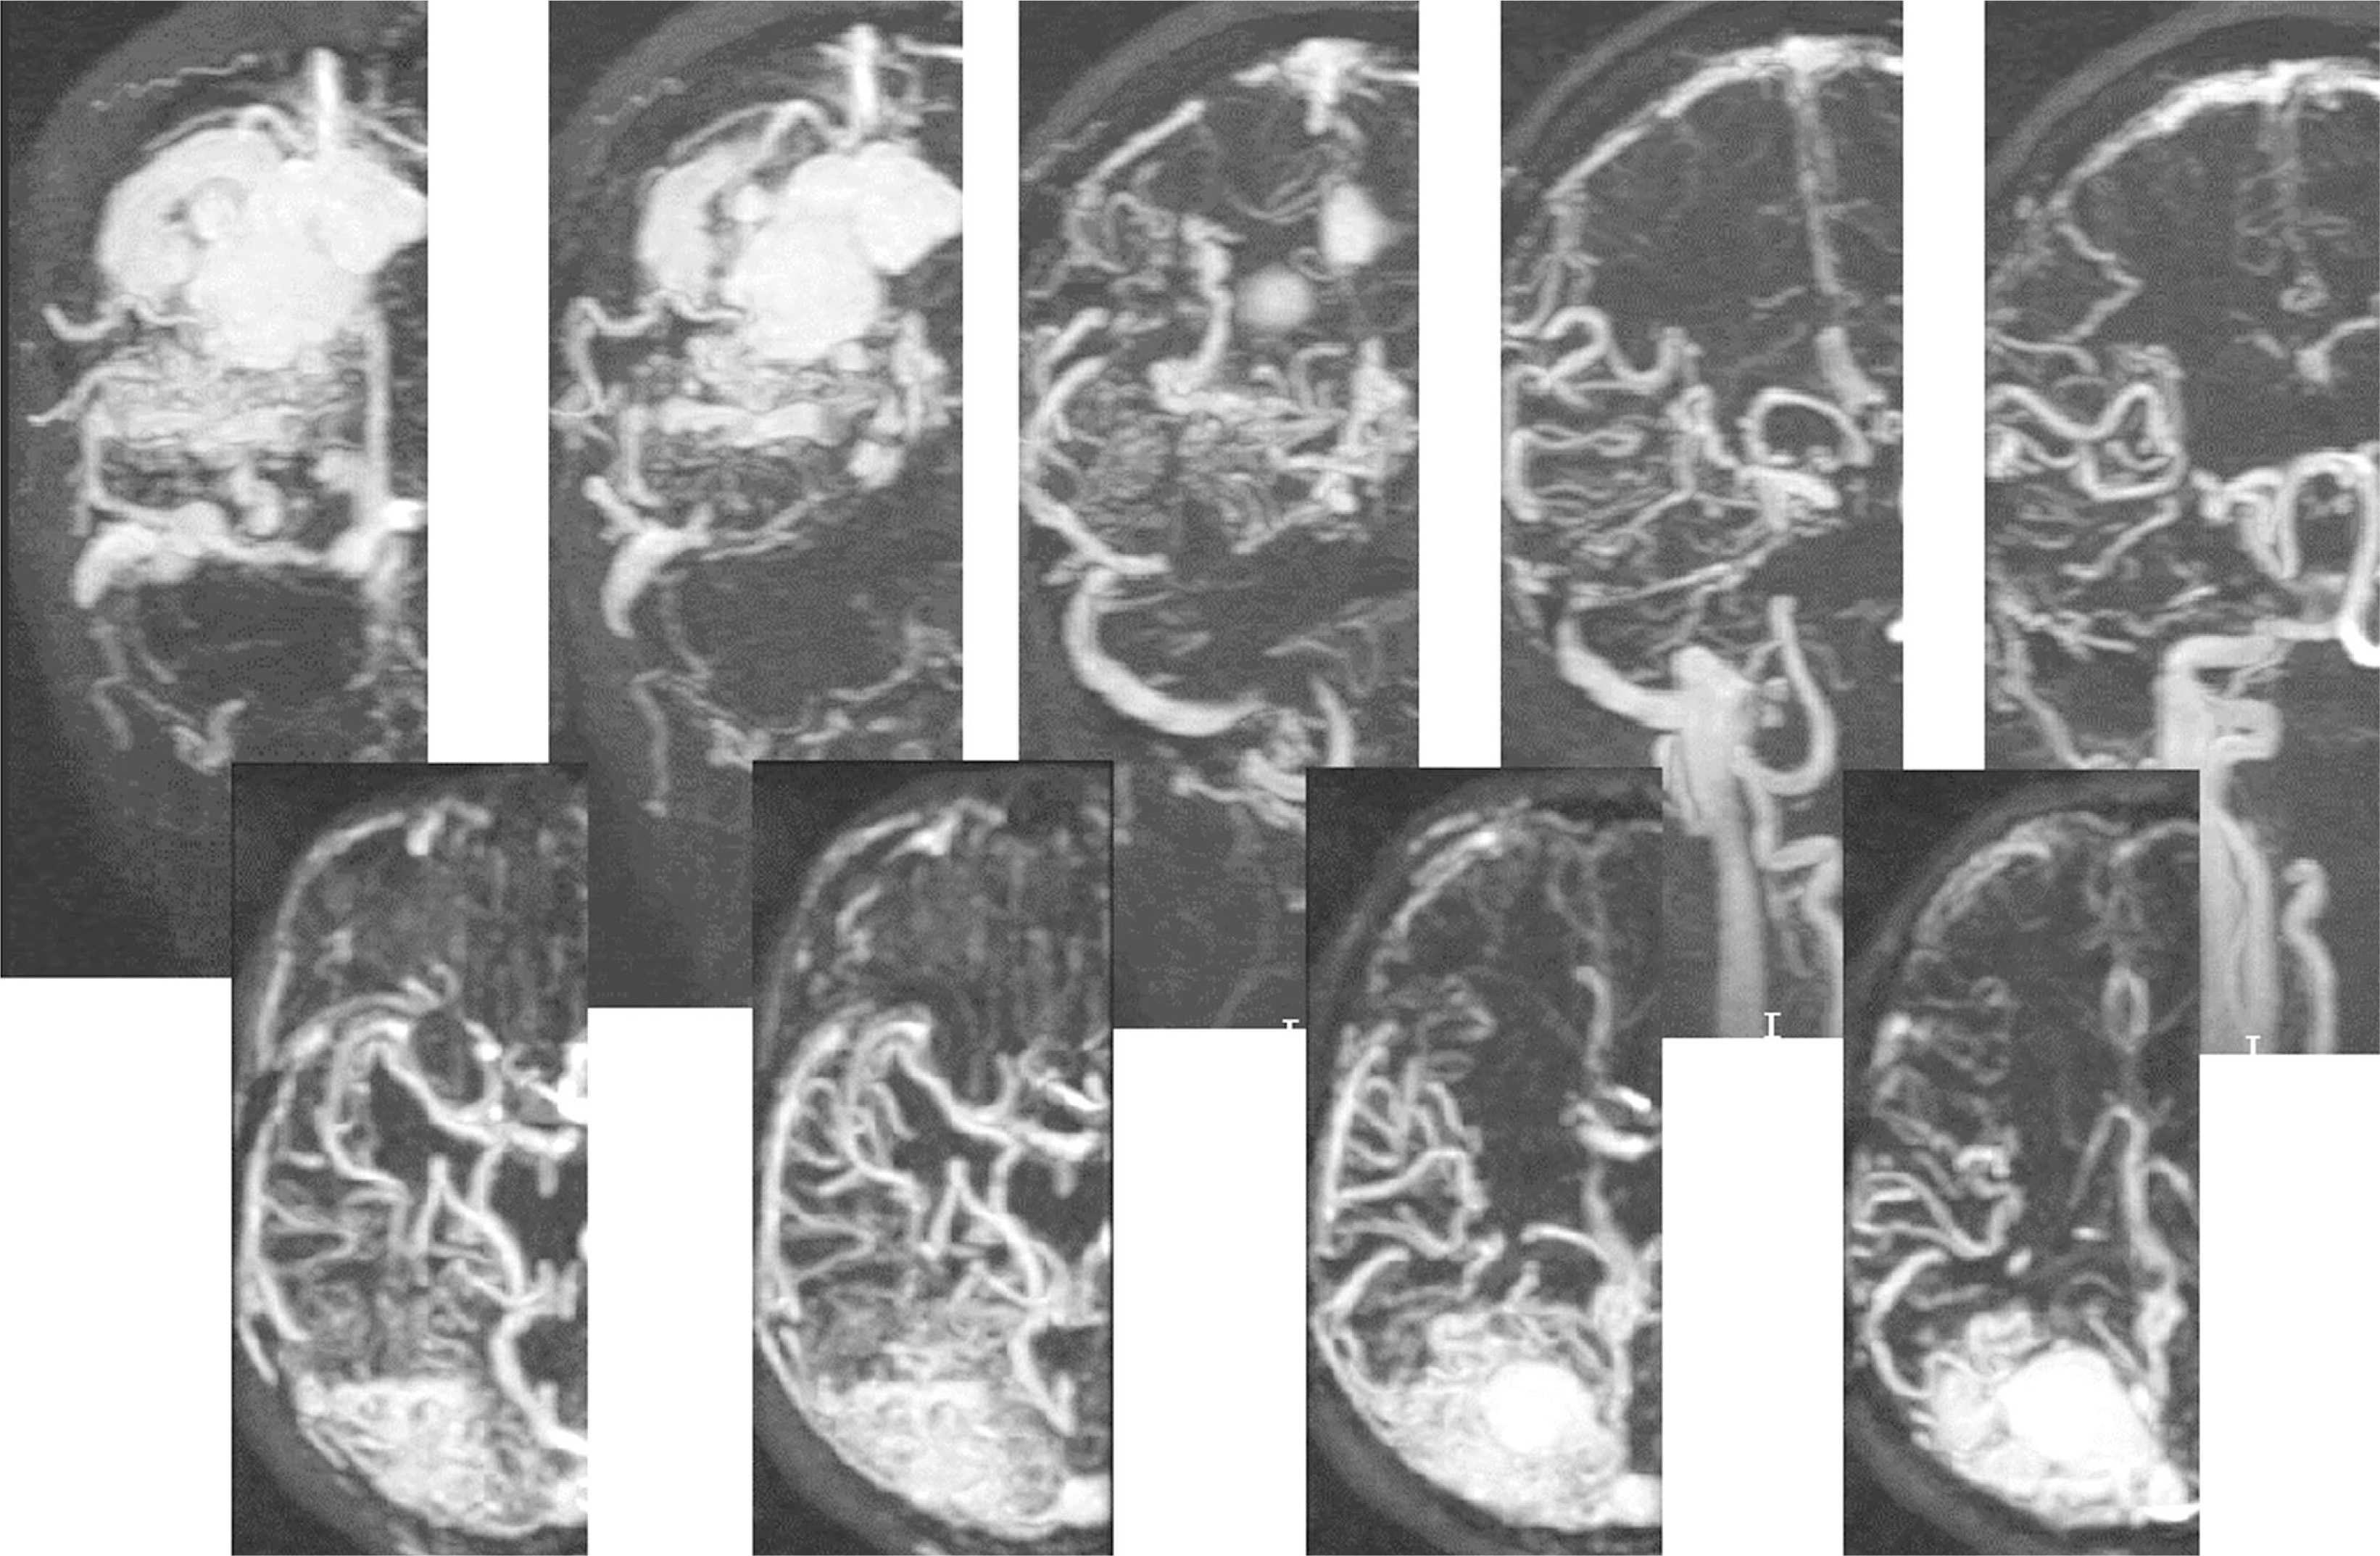
FIGURE 4.
FIGURE 4. Right renal artery stenosis due to an anteroposteriorly oriented eccentric plaque (arrow). Overlapping, limited volume maximum intensity projection rendering in at least two orthogonal planes are critical to the high-resolution interrogation of small structures such as the renal arteries, avoiding overlap and the overestimation of stenosis.
FIGURE 5.
FIGURE 5. Contrast-enhanced magnetic resonance angiography of a cerebral arteriovenous malformation (AVM). Study is performed with a fast three-dimensional gradient recalled echo sequence during administration of 0.05 mmol/kg of gadolinium contrast. Routine multiplanar overlapping, limited volume maximum intensity projection display is critical for delineation of the critical components of an AVM (arterial feeders, presence of aneurysms and varices, and venous drainage), as well for investigation of possible associated aneurysms.

Narrow interval, overlapping sub-volume MIP slabs offer a valuable tomographic assessment augmenting critical evaluation of intracranial pathology such as aneurysm, and vascular malformation as well aortic pathology such as dissection and aneurysm using both MR and CT data sets (figures 6 and 7).
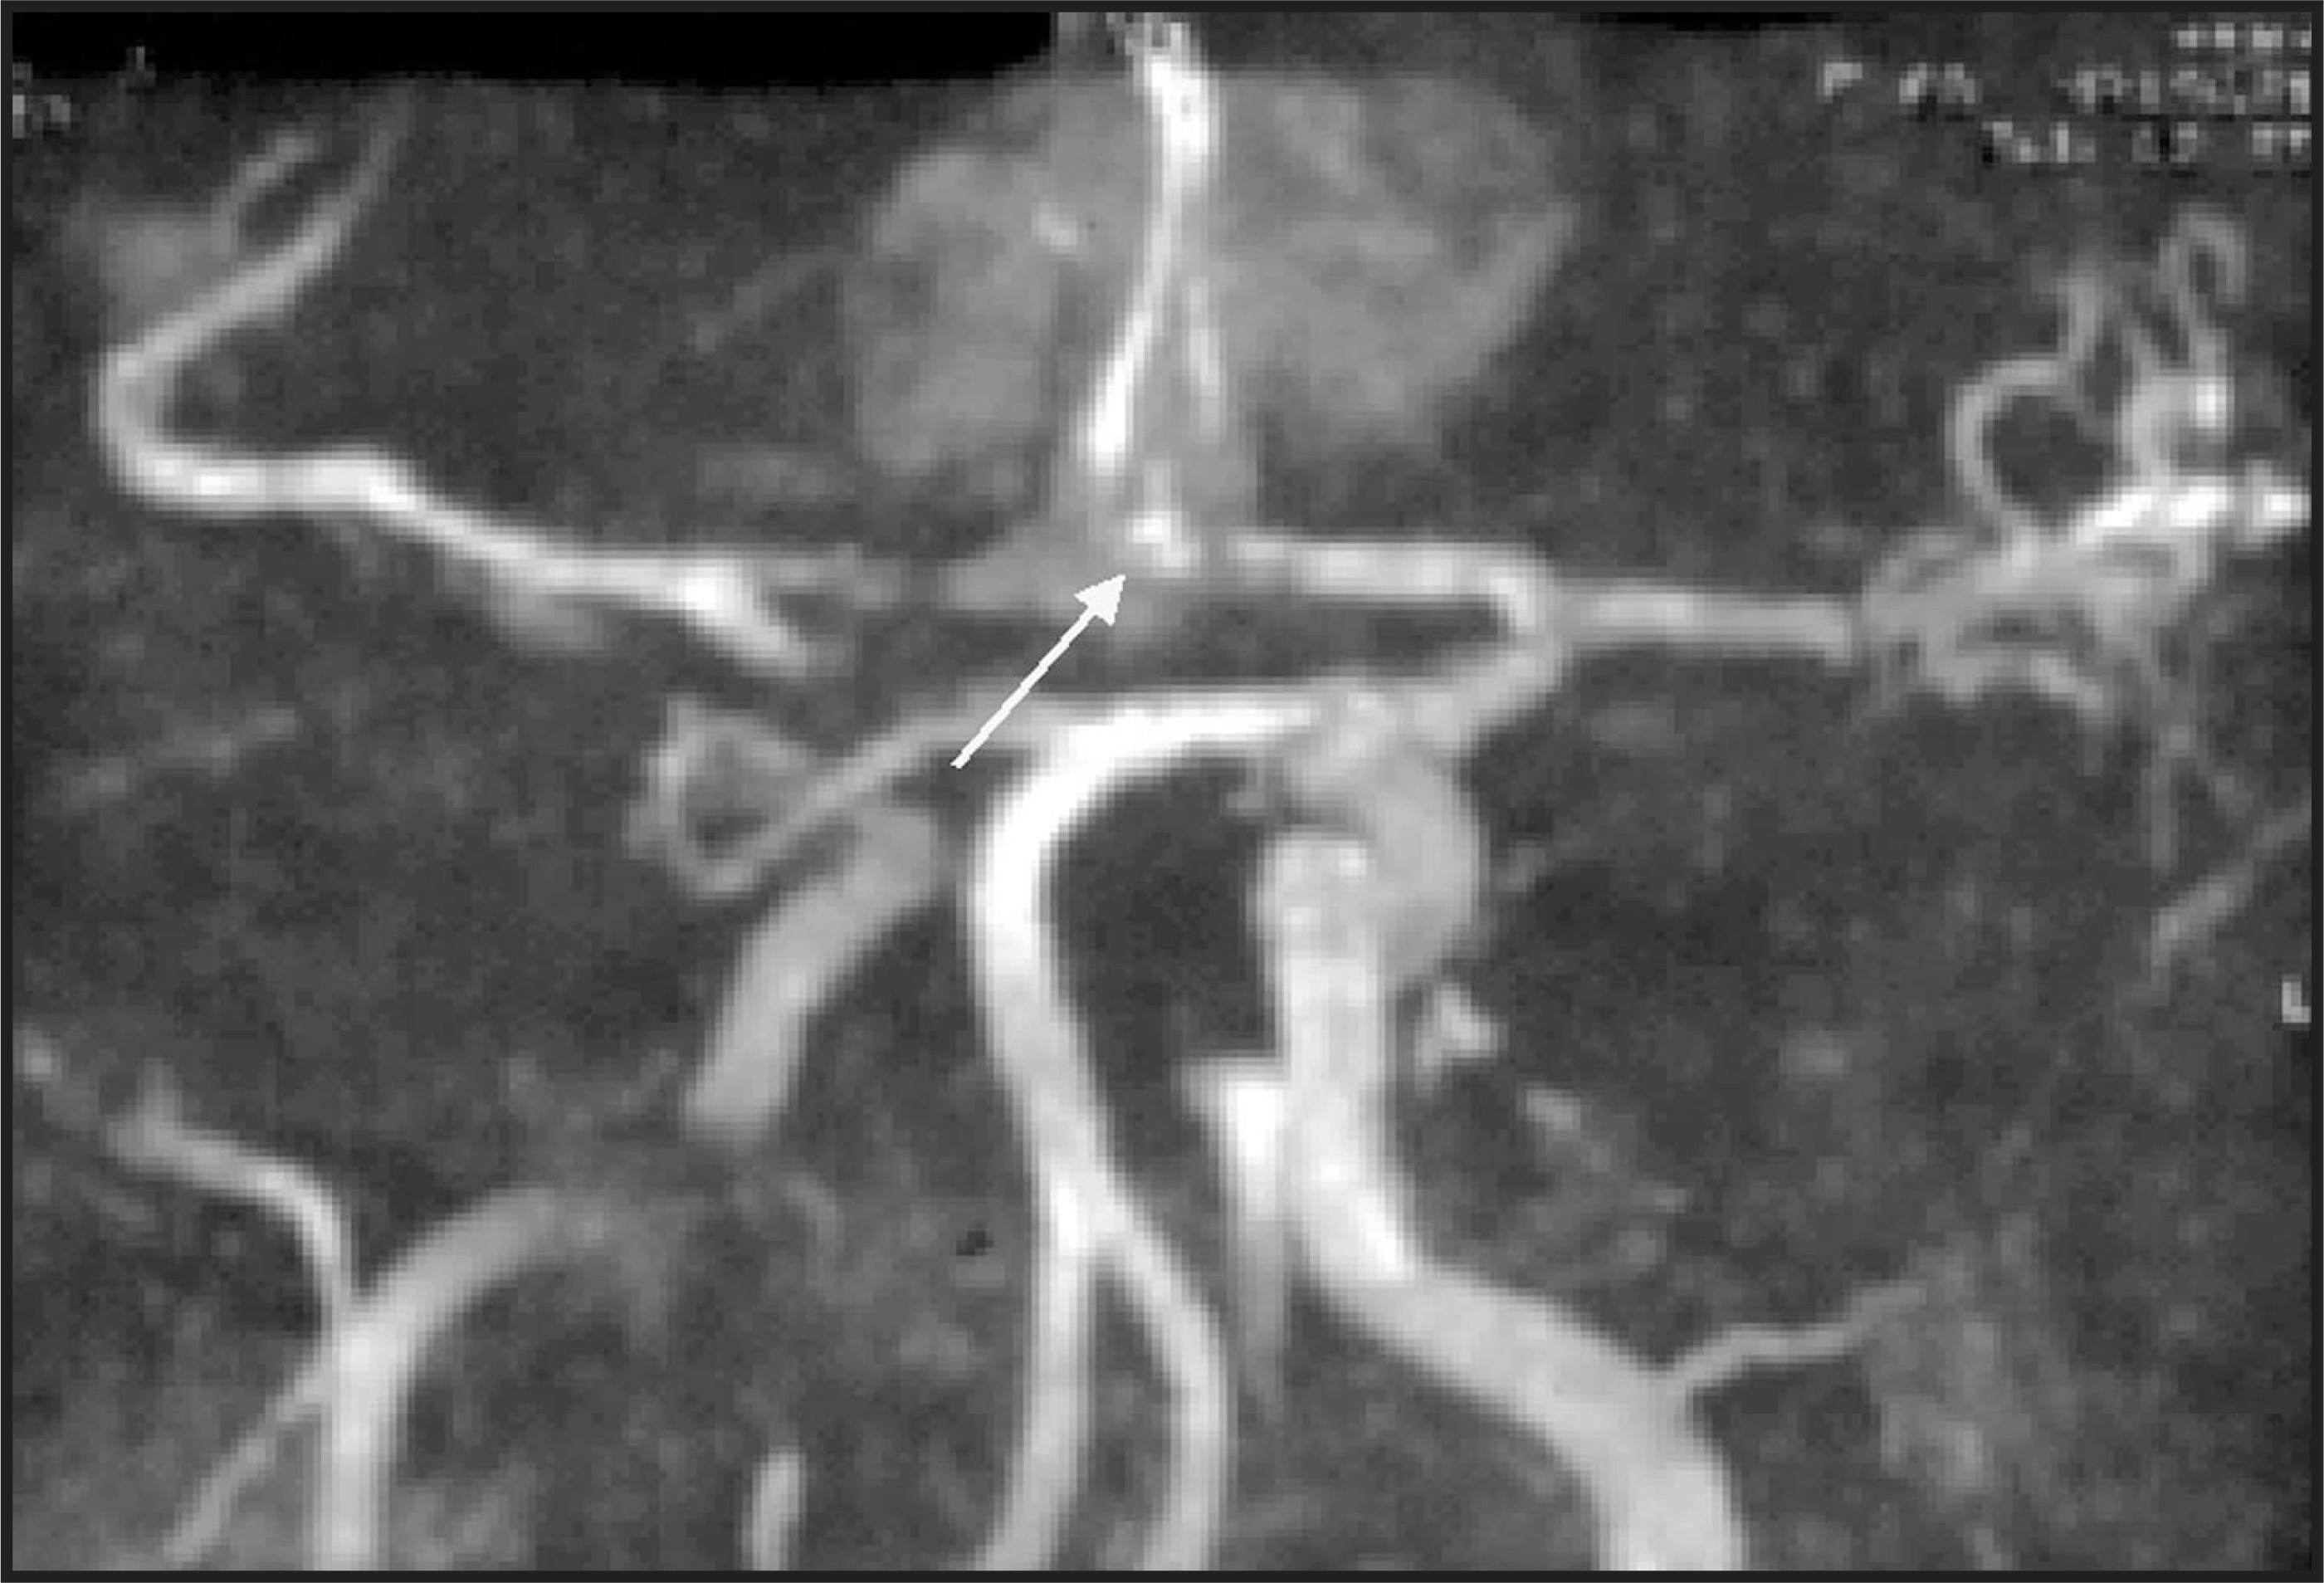
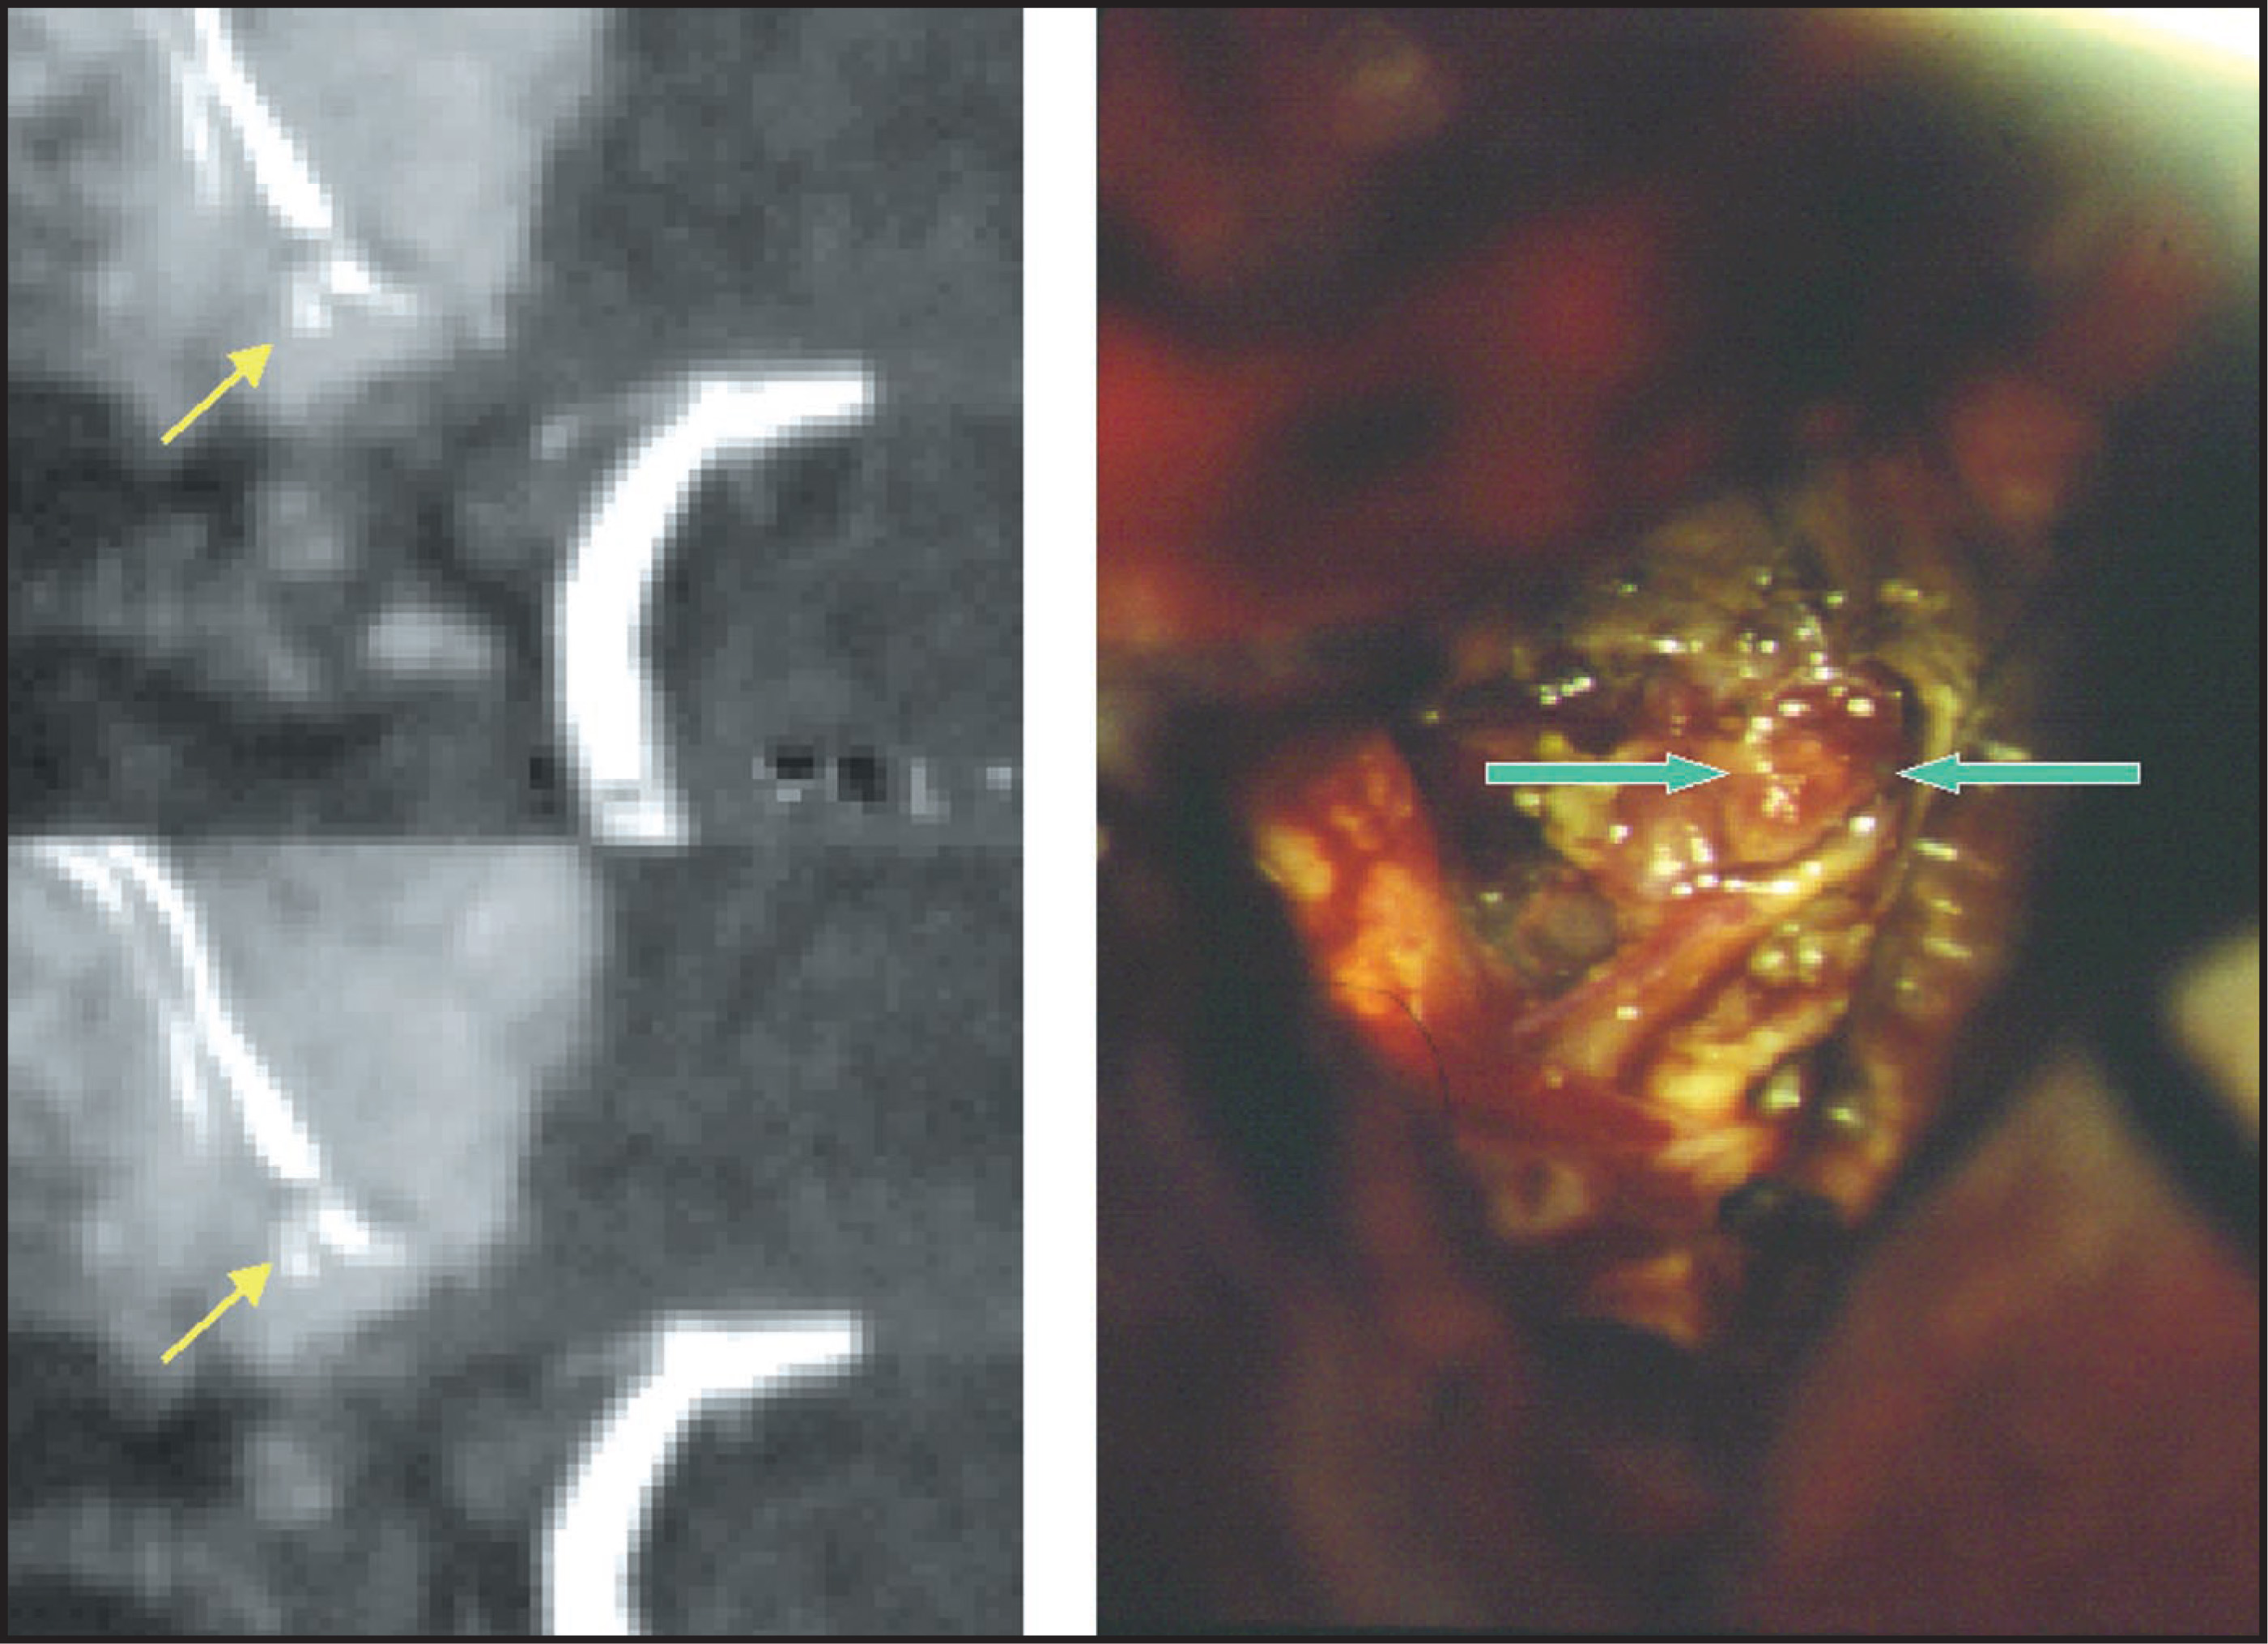
FIGURE 6.
FIGURE 6. Patient with subarachnoid hemorrhage and no detected aneurysm with conventional angiography. Full-volume maximum intensity projection (MIP) image demonstrates “shine-through” from hemorrhage methemoglobin. Anything with a short T1 (eg, hemorrhage or fat) will be evident on the MIP of a magnetic resonance angiography study. Due to the proximity of blood there was concern about a possible abnormality in the region of the anterior communicating artery (A Com) (arrow).
FIGURE 7.
FIGURE 7. Anterior communicating artery aneurysm. Overlapping, limited volume maximum intensity projection images in the oblique sagittal plane (left) indicate the presence of a blind sac (arrow) extending antero-inferiorly from the region of the anterior communicating artery. Note the large amount of methemoglobin surrounding the aneurysm. Intraoperative photograph (right) confirms the presence of an aneurysm (arrows).

While many advocate interrogation of source images for similar reasons, employing thicker slabs with MIP processing provides useful information about vascular structures in the proximity and a more realistic depiction of anatomy. As opposed to single-pixel thick source and thin section unrendered reformat images, OLIVE MIPs typically have greater appeal to referring clinicians (figure 8).
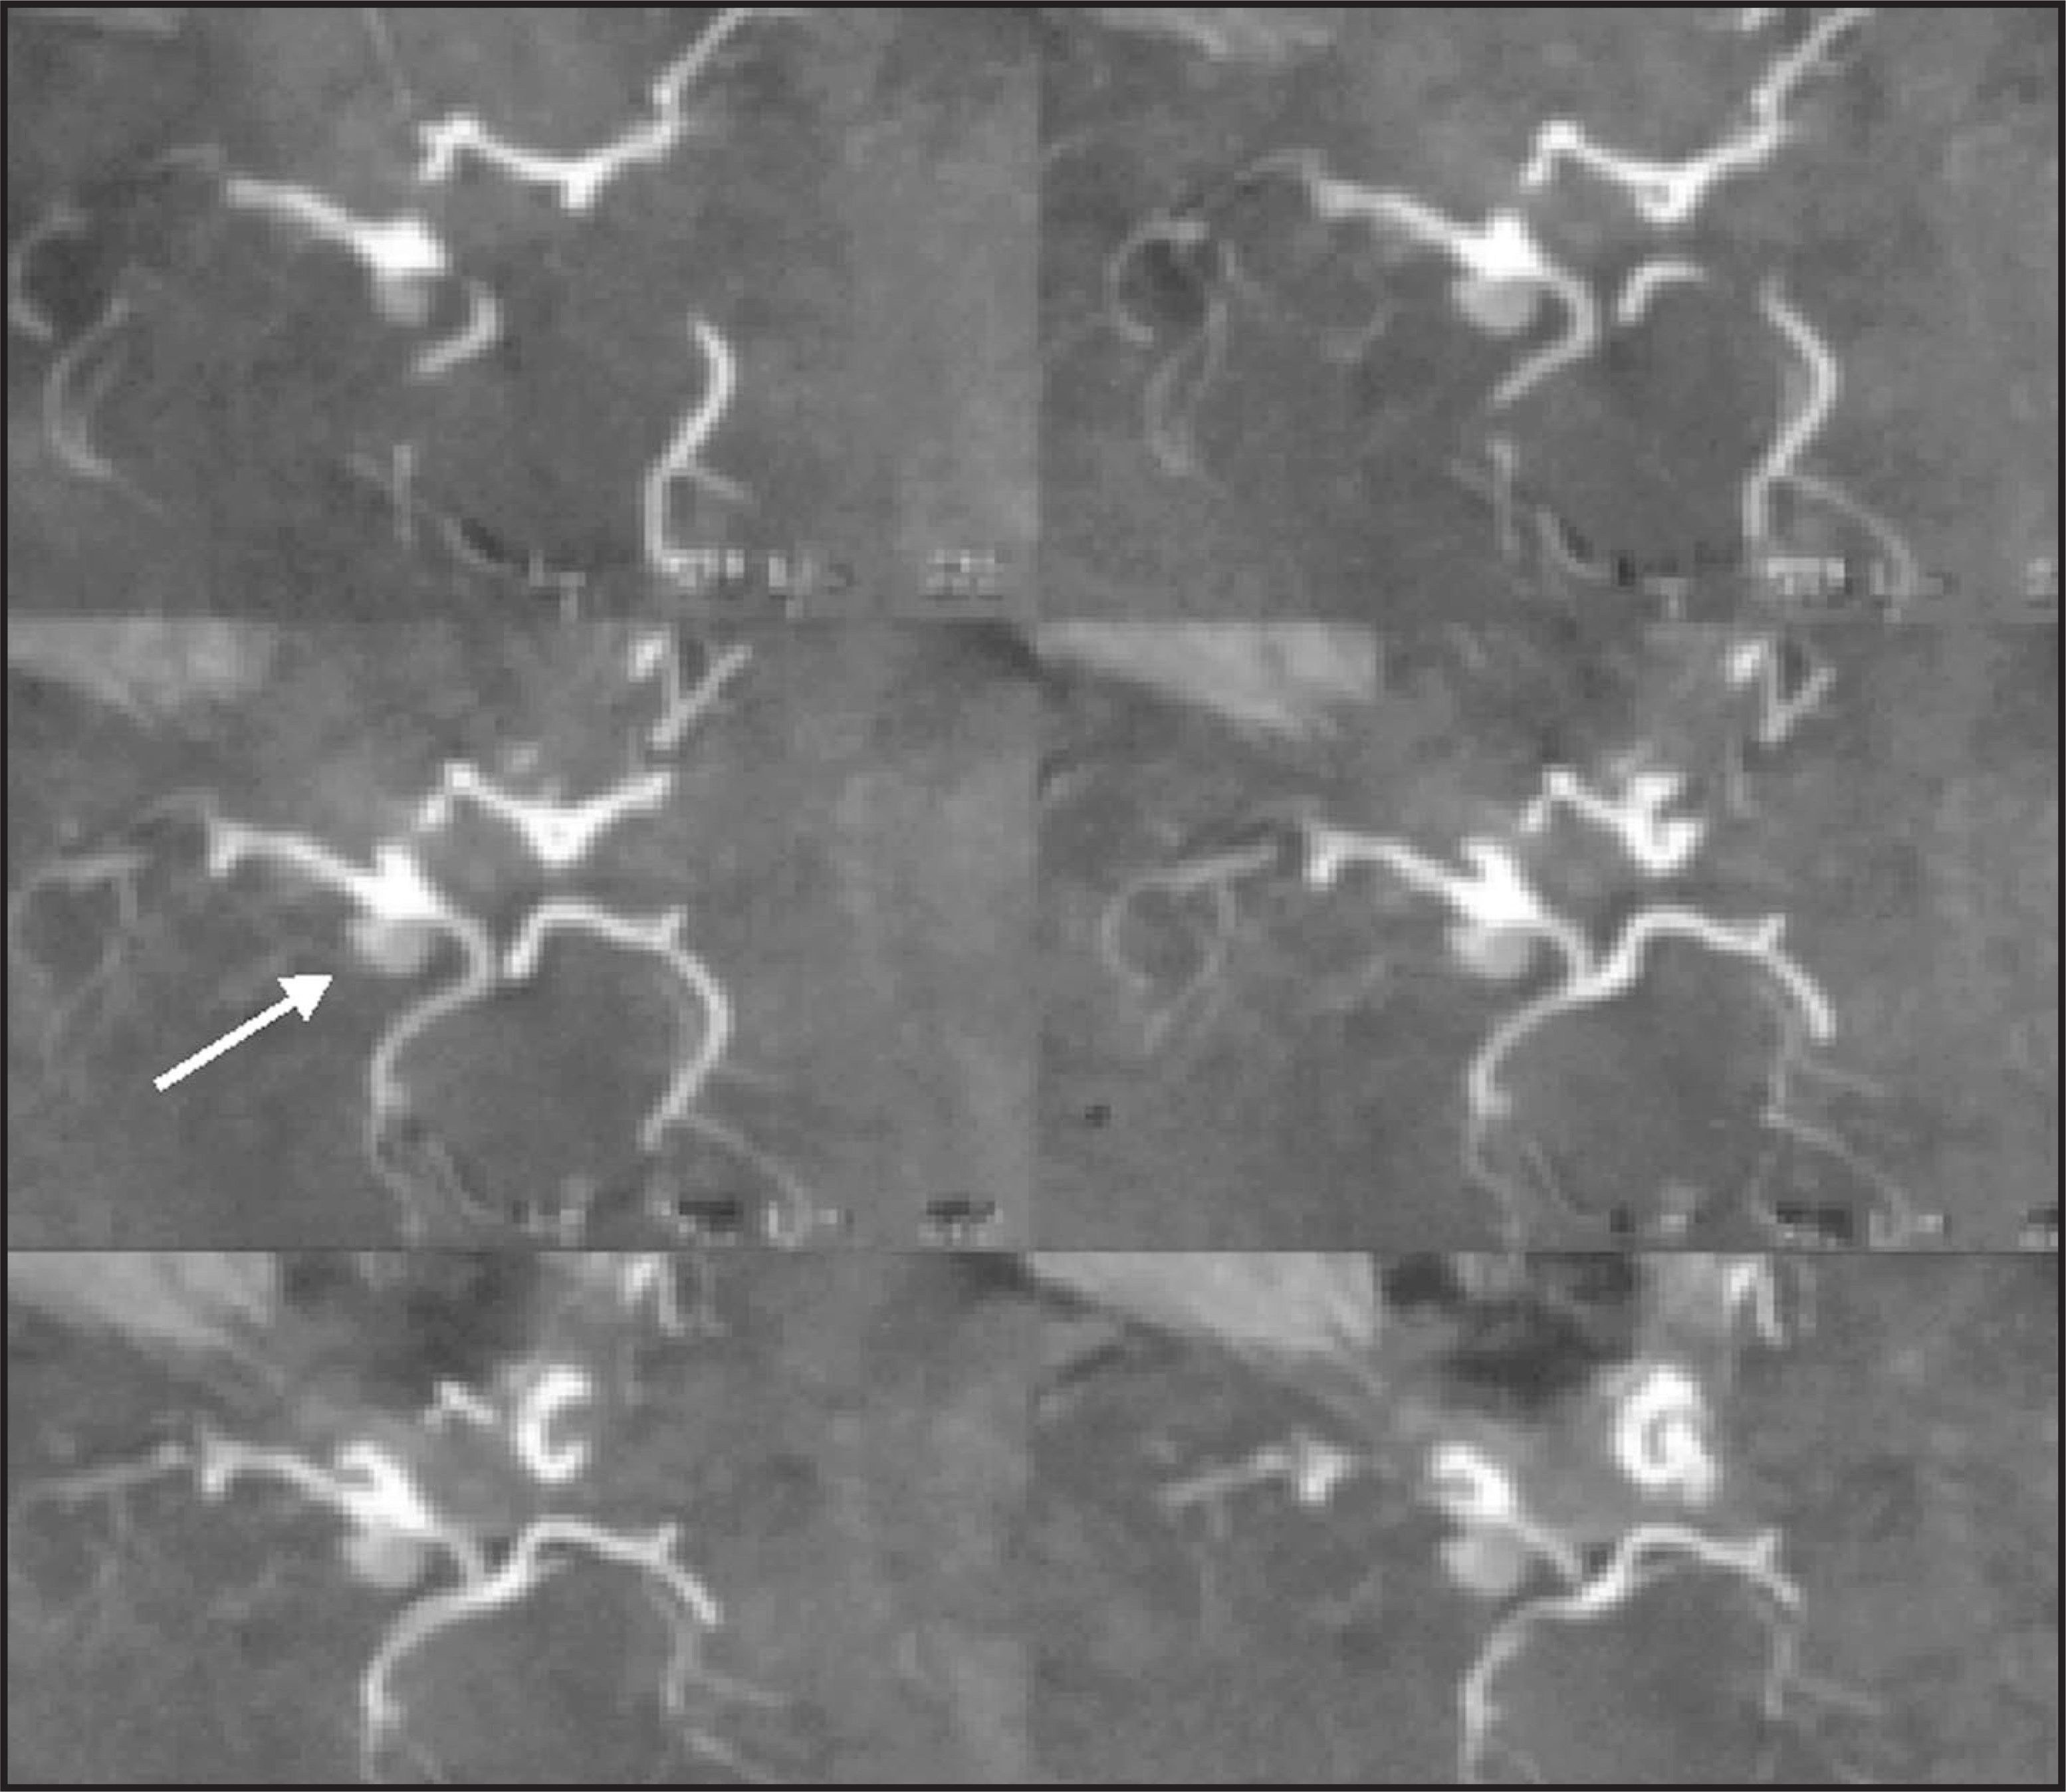
FIGURE 8.
FIGURE 8. Overlapping, limited volume maximum intensity projection (MIP) assessment of an aneurysm (arrow) at the origin of a fetal posterior communicating artery. Tomographic overlapping thin-slab MIPs depict the aneurysm as well as critical proximity structures (see figure 3) without interference from overlapping structures. In-plane source images may not provide the ideal obliquity for analysis, may suffer from low signalto-noise ratio, and may yield limited information about structures surrounding the vascular lesion.

Three-dimensional rendering

Two-dimensional MR (and CT) source data can also be rendered with 3D techniques. Three-dimensional rendering requires operator-specified determination of the range of intensities (or on CT, densities) that will contribute to or be eliminated from the model. The thresholding procedure removes undesirable information from the data set such as noise (and bone on CT) by virtue of intensity (and density on CT) and allows a greater range of rendering possibilities. Traditional 3D techniques require “hard-thresholding” in which ranges are excluded “permanently” from the data set at the onset of model manipulation. Rendering options include shaded-surface display (SSD), ray sum, and MIP.2,3

Shaded-surface display offers an extremely dynamic rendering, corresponding closely to superficial features of the anatomy under study (figure 9). This has the greatest application in the depiction of vascular disease, such as aneurysms of the intracranial vasculature and thoraco-abdominal aorta. While appropriate for the depiction of vascular stenosis with MR data, the process of thresholding can affect accuracy and the information provided should be interpreted with caution. Because calcified plaque and contrast opacified blood fall into a similar density range on CT, SSD is an inappropriate technique to depict stenosis with CTA.
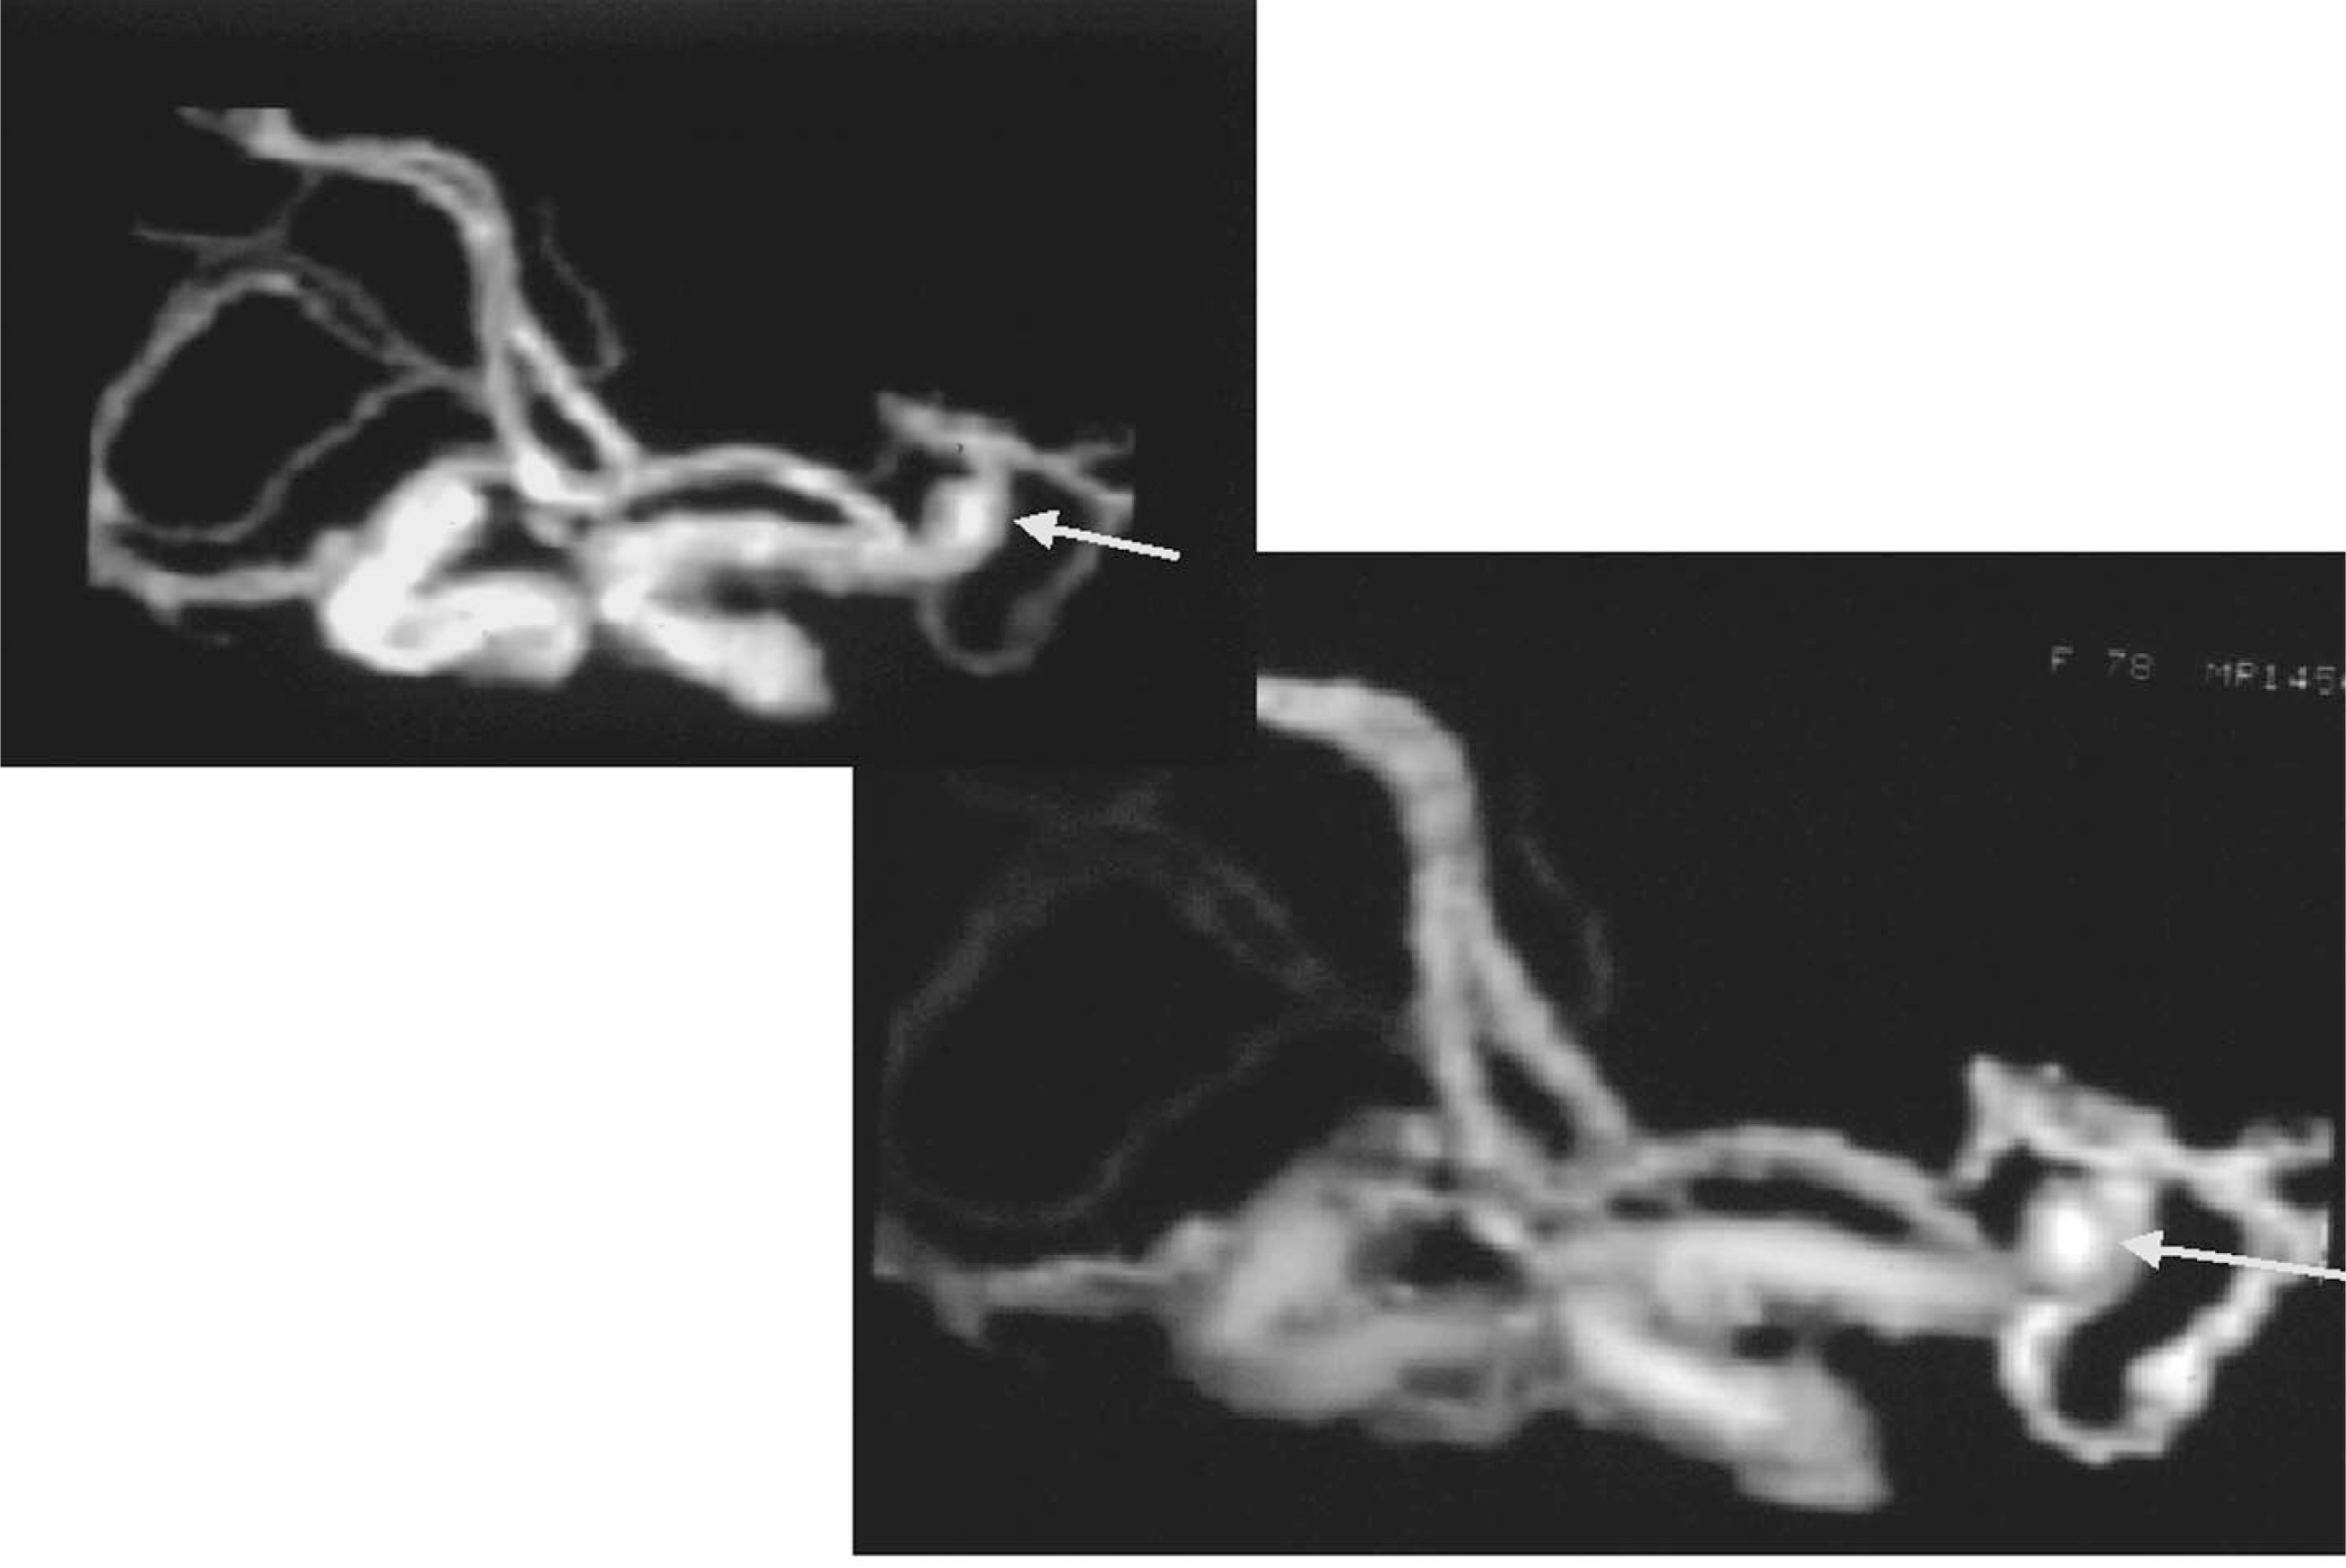
FIGURE 9.
FIGURE 9. Shaded-surface display (SSD) time-of-flight magnetic resonance angiogram (MRA) of a left middle cerebral artery aneurysm. Thresholded maximum intensity projection (upper left) and SSD of MRA data set. Note the superior SSD depiction of surface features of the left middle cerebral artery aneurysm (arrows), corresponding closely to that seen with direct inspection at surgery.

Thresholding-based removal of unwanted intensities before application of MIP algorithms has the benefit of eliminating information such as noise, hemorrhage, and fat that ordinarily may maintain sufficient intensity and manifest on projected images. The resultant MIP renderings are typically more dramatic and appealing to referring physicians (figure 10). CTA data is improved by the removal of bone that can obscure pathology in the brain, body, and extremities.
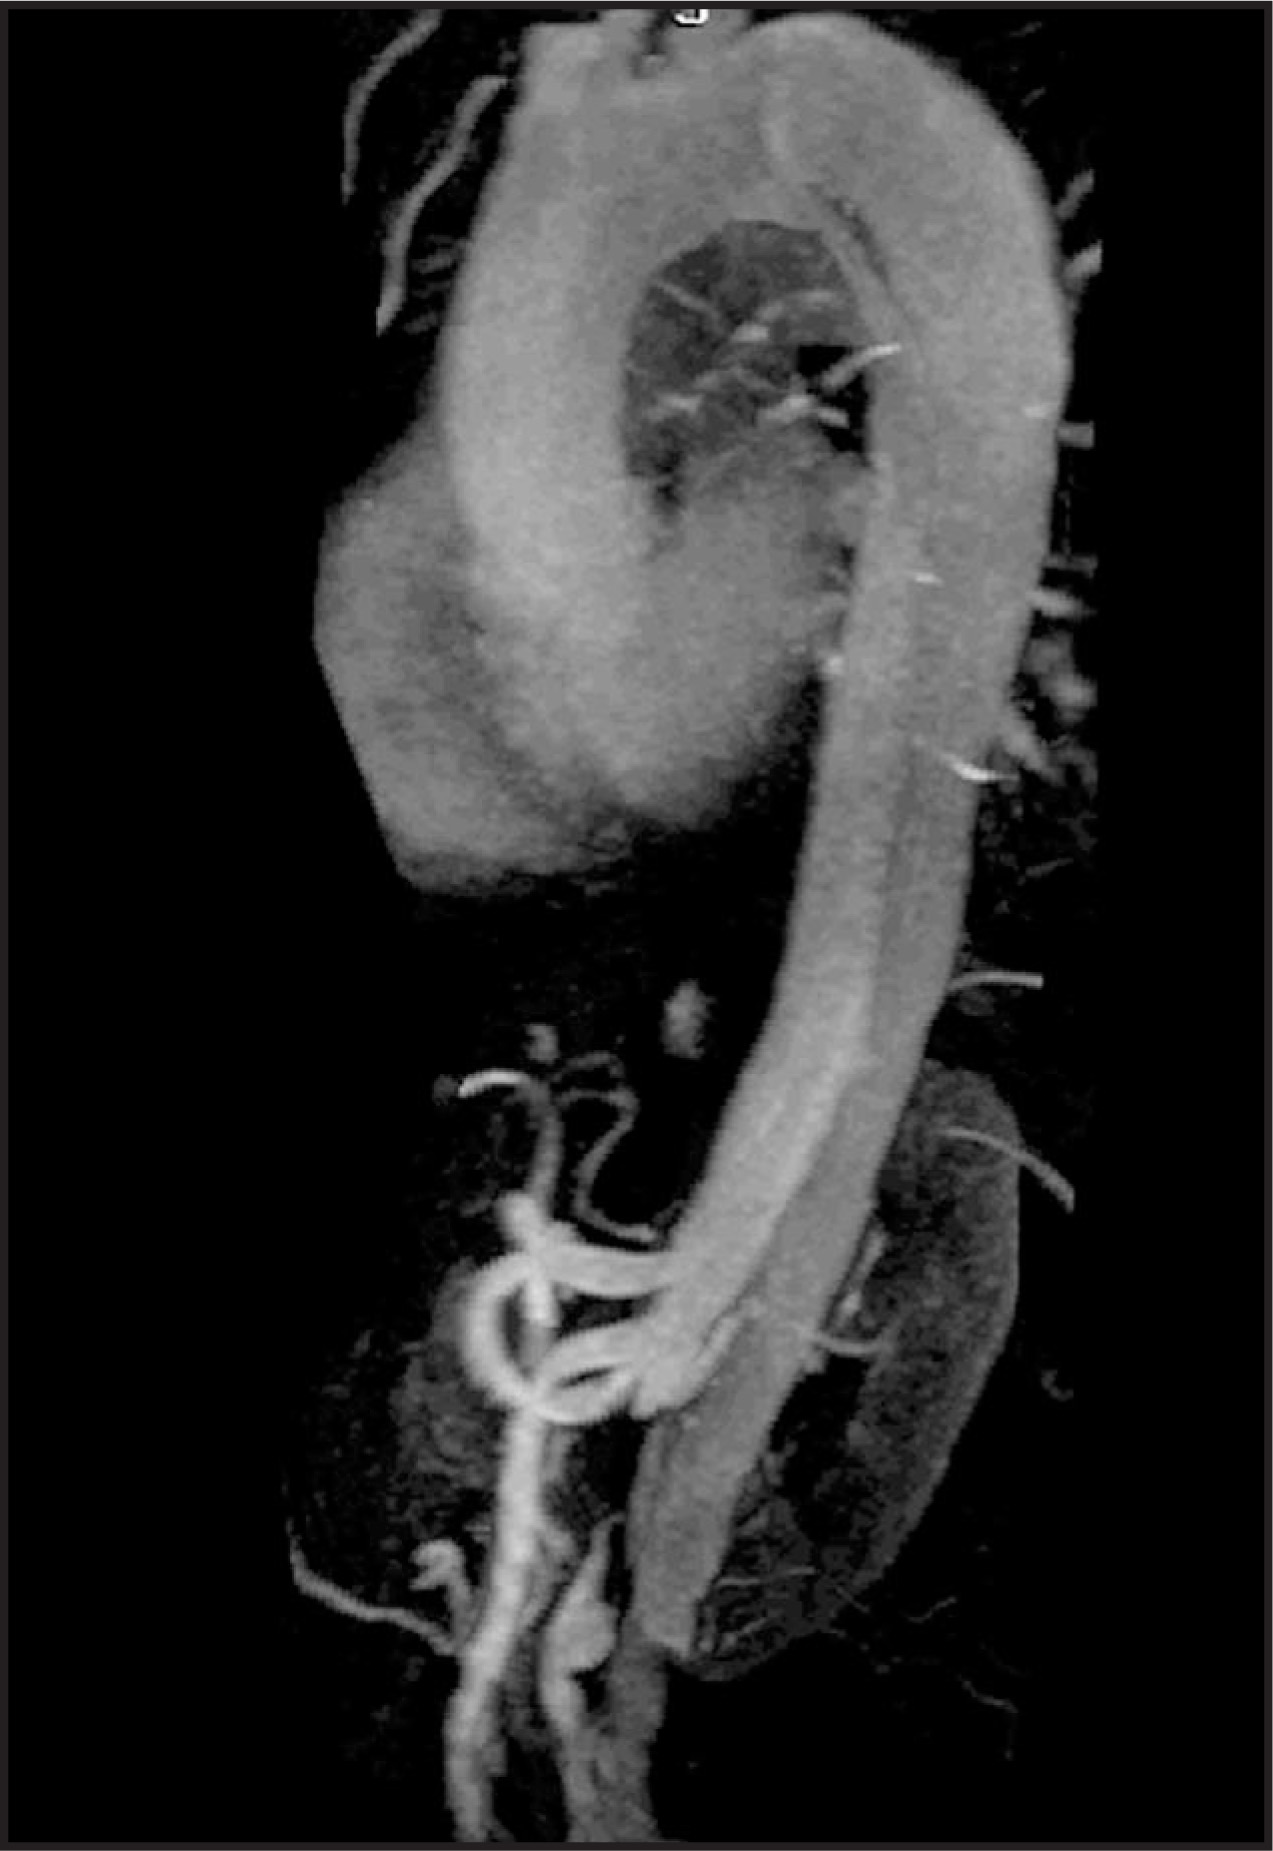
FIGURE 10.
FIGURE 10. Thresholded maximum intensity projection (MIP) of aortic dissection. Removing the signal from artifact and “shine-through” of background tissues improves the MIP display. Note the involvement of the arch and descending aorta with sparing of the arch and aortic root. Blood supply to the superior mesenteric artery and celiac axis is via the true lumen.

Thresholded data sets can be rendered with a technique that is a variation on MIP called ray sum. Similar to MIP, this 2D ray tracing also requires viewing of multiple projections to obtain a complete depiction of anatomy. Ray-sum techniques offer a summation of maximum intensities along the traced ray. As a result, when structures overlap there is an increase in depicted opacity (figures 11 and 12). This type of rendition is very similar to that provided by traditional radiographic angiography studies and is superior to MIP in depicting complex vascular anatomy and thrombus.
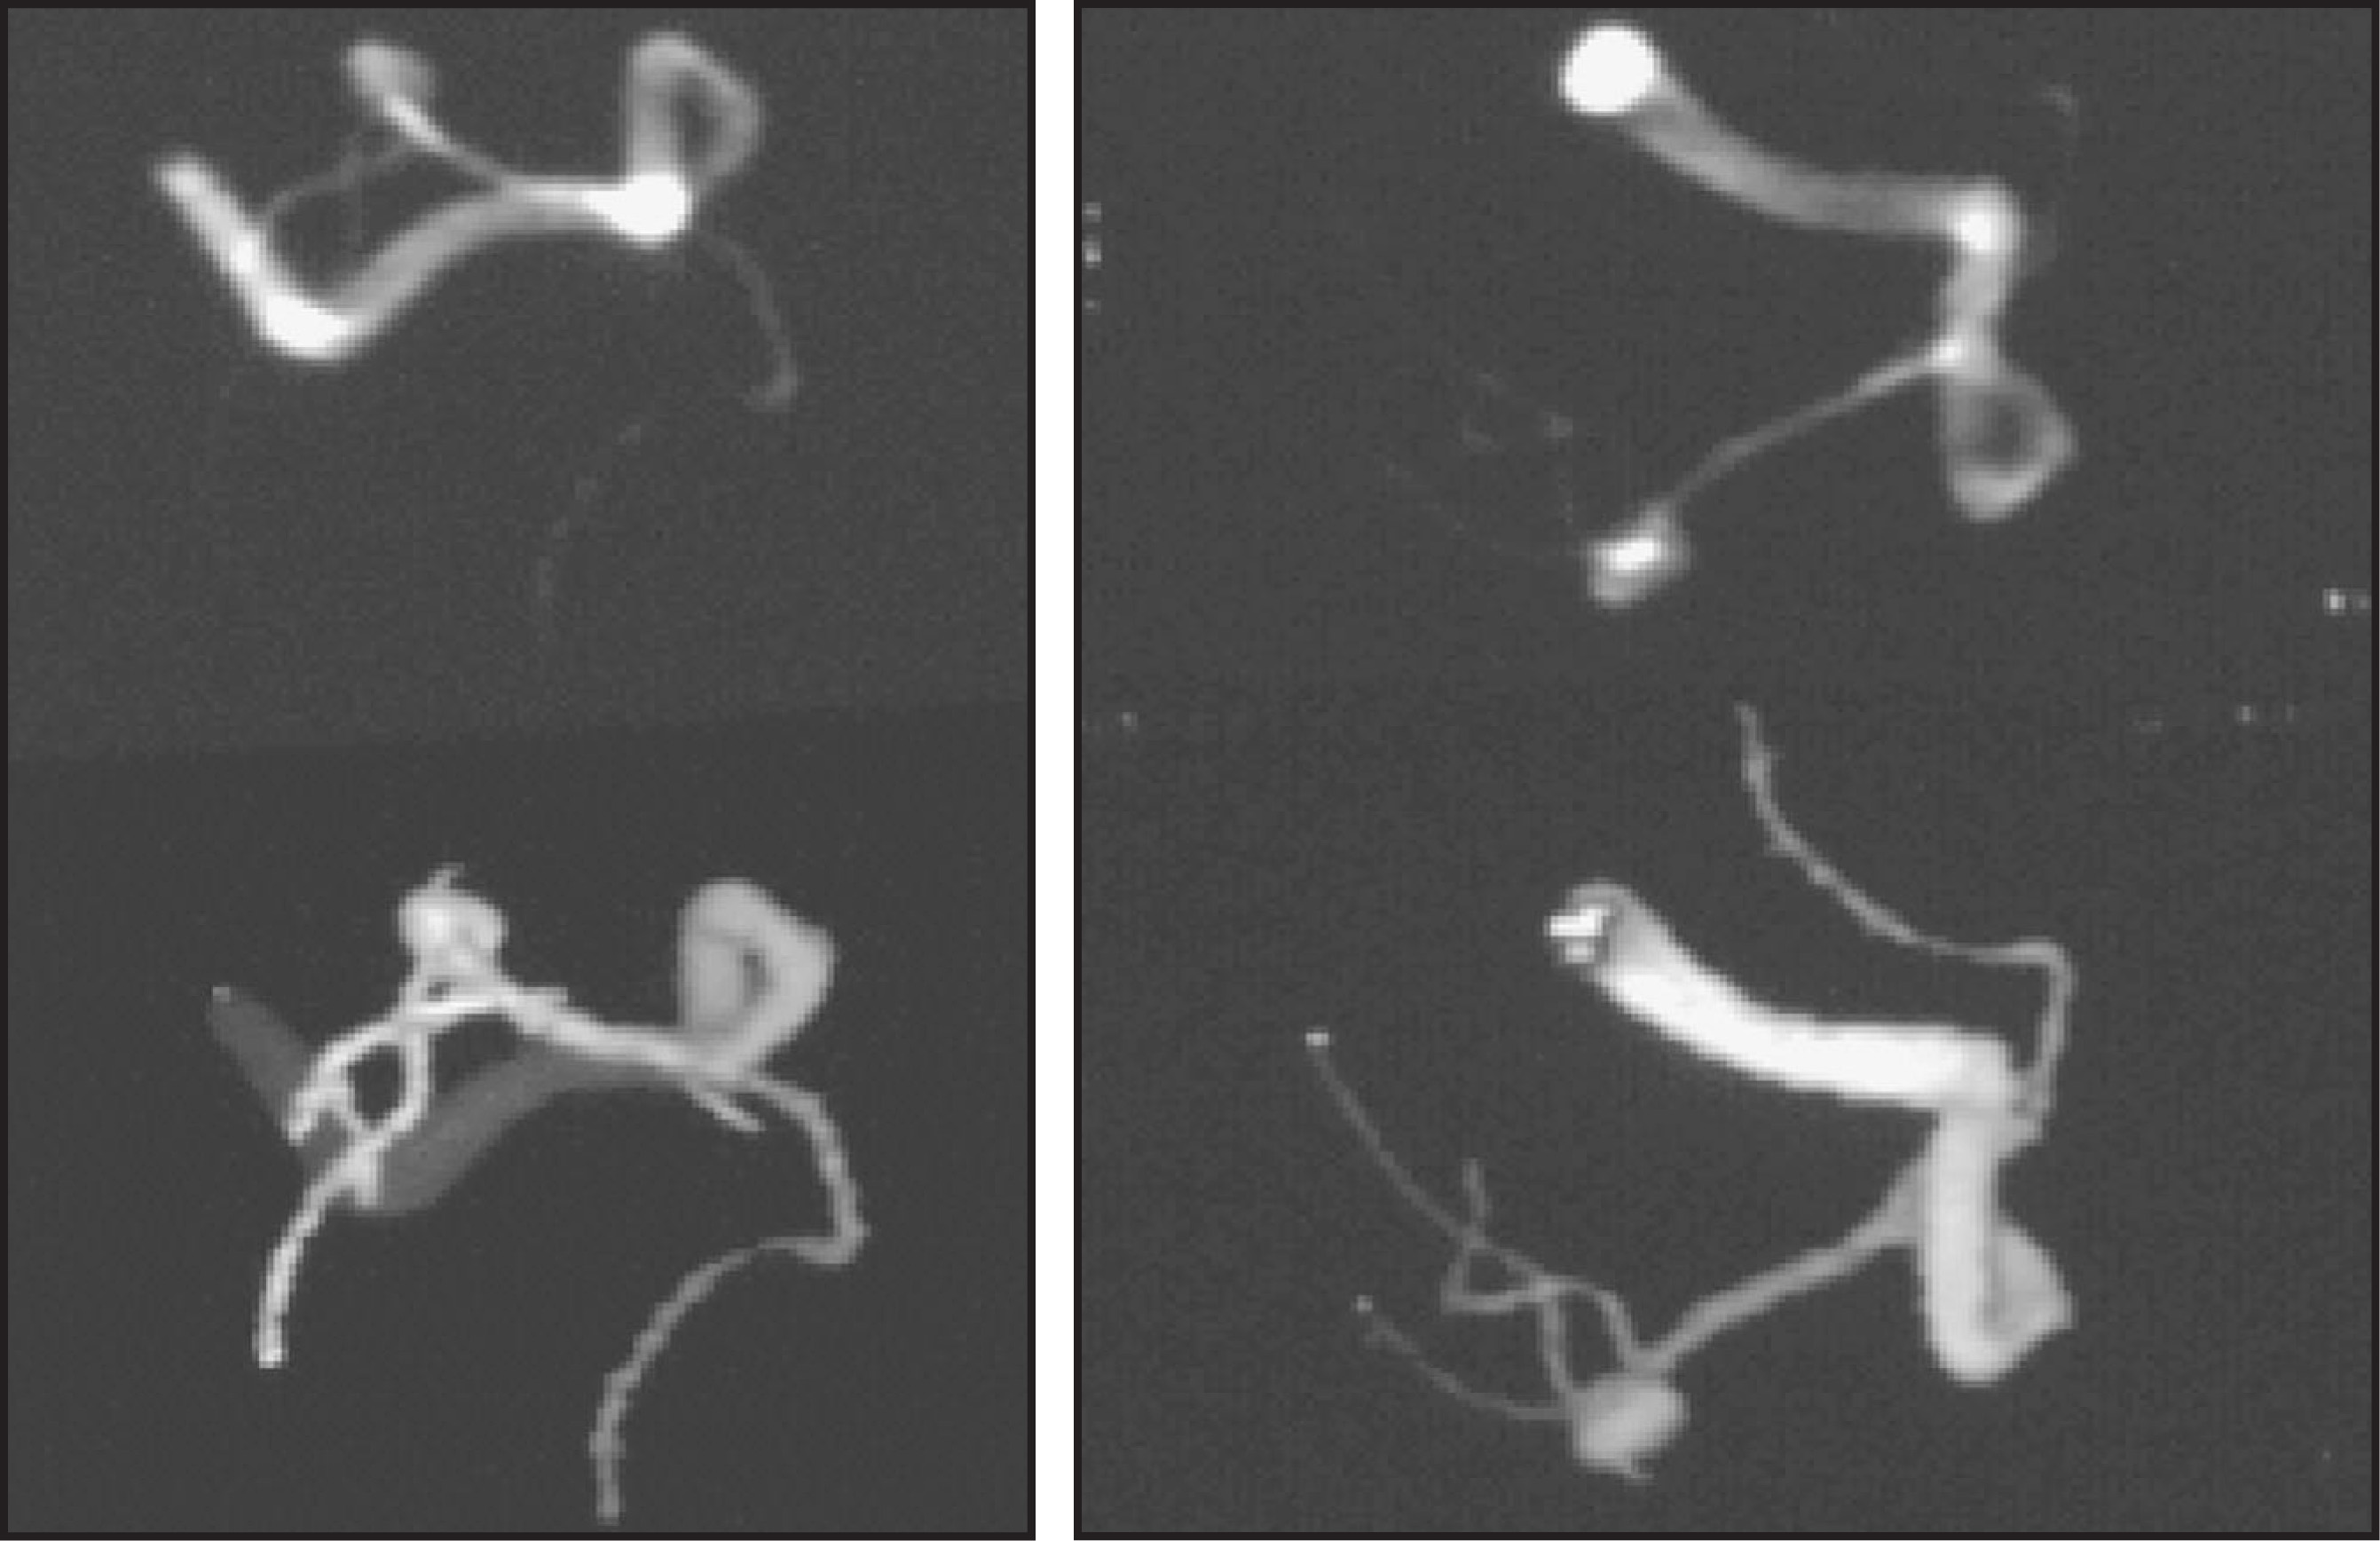
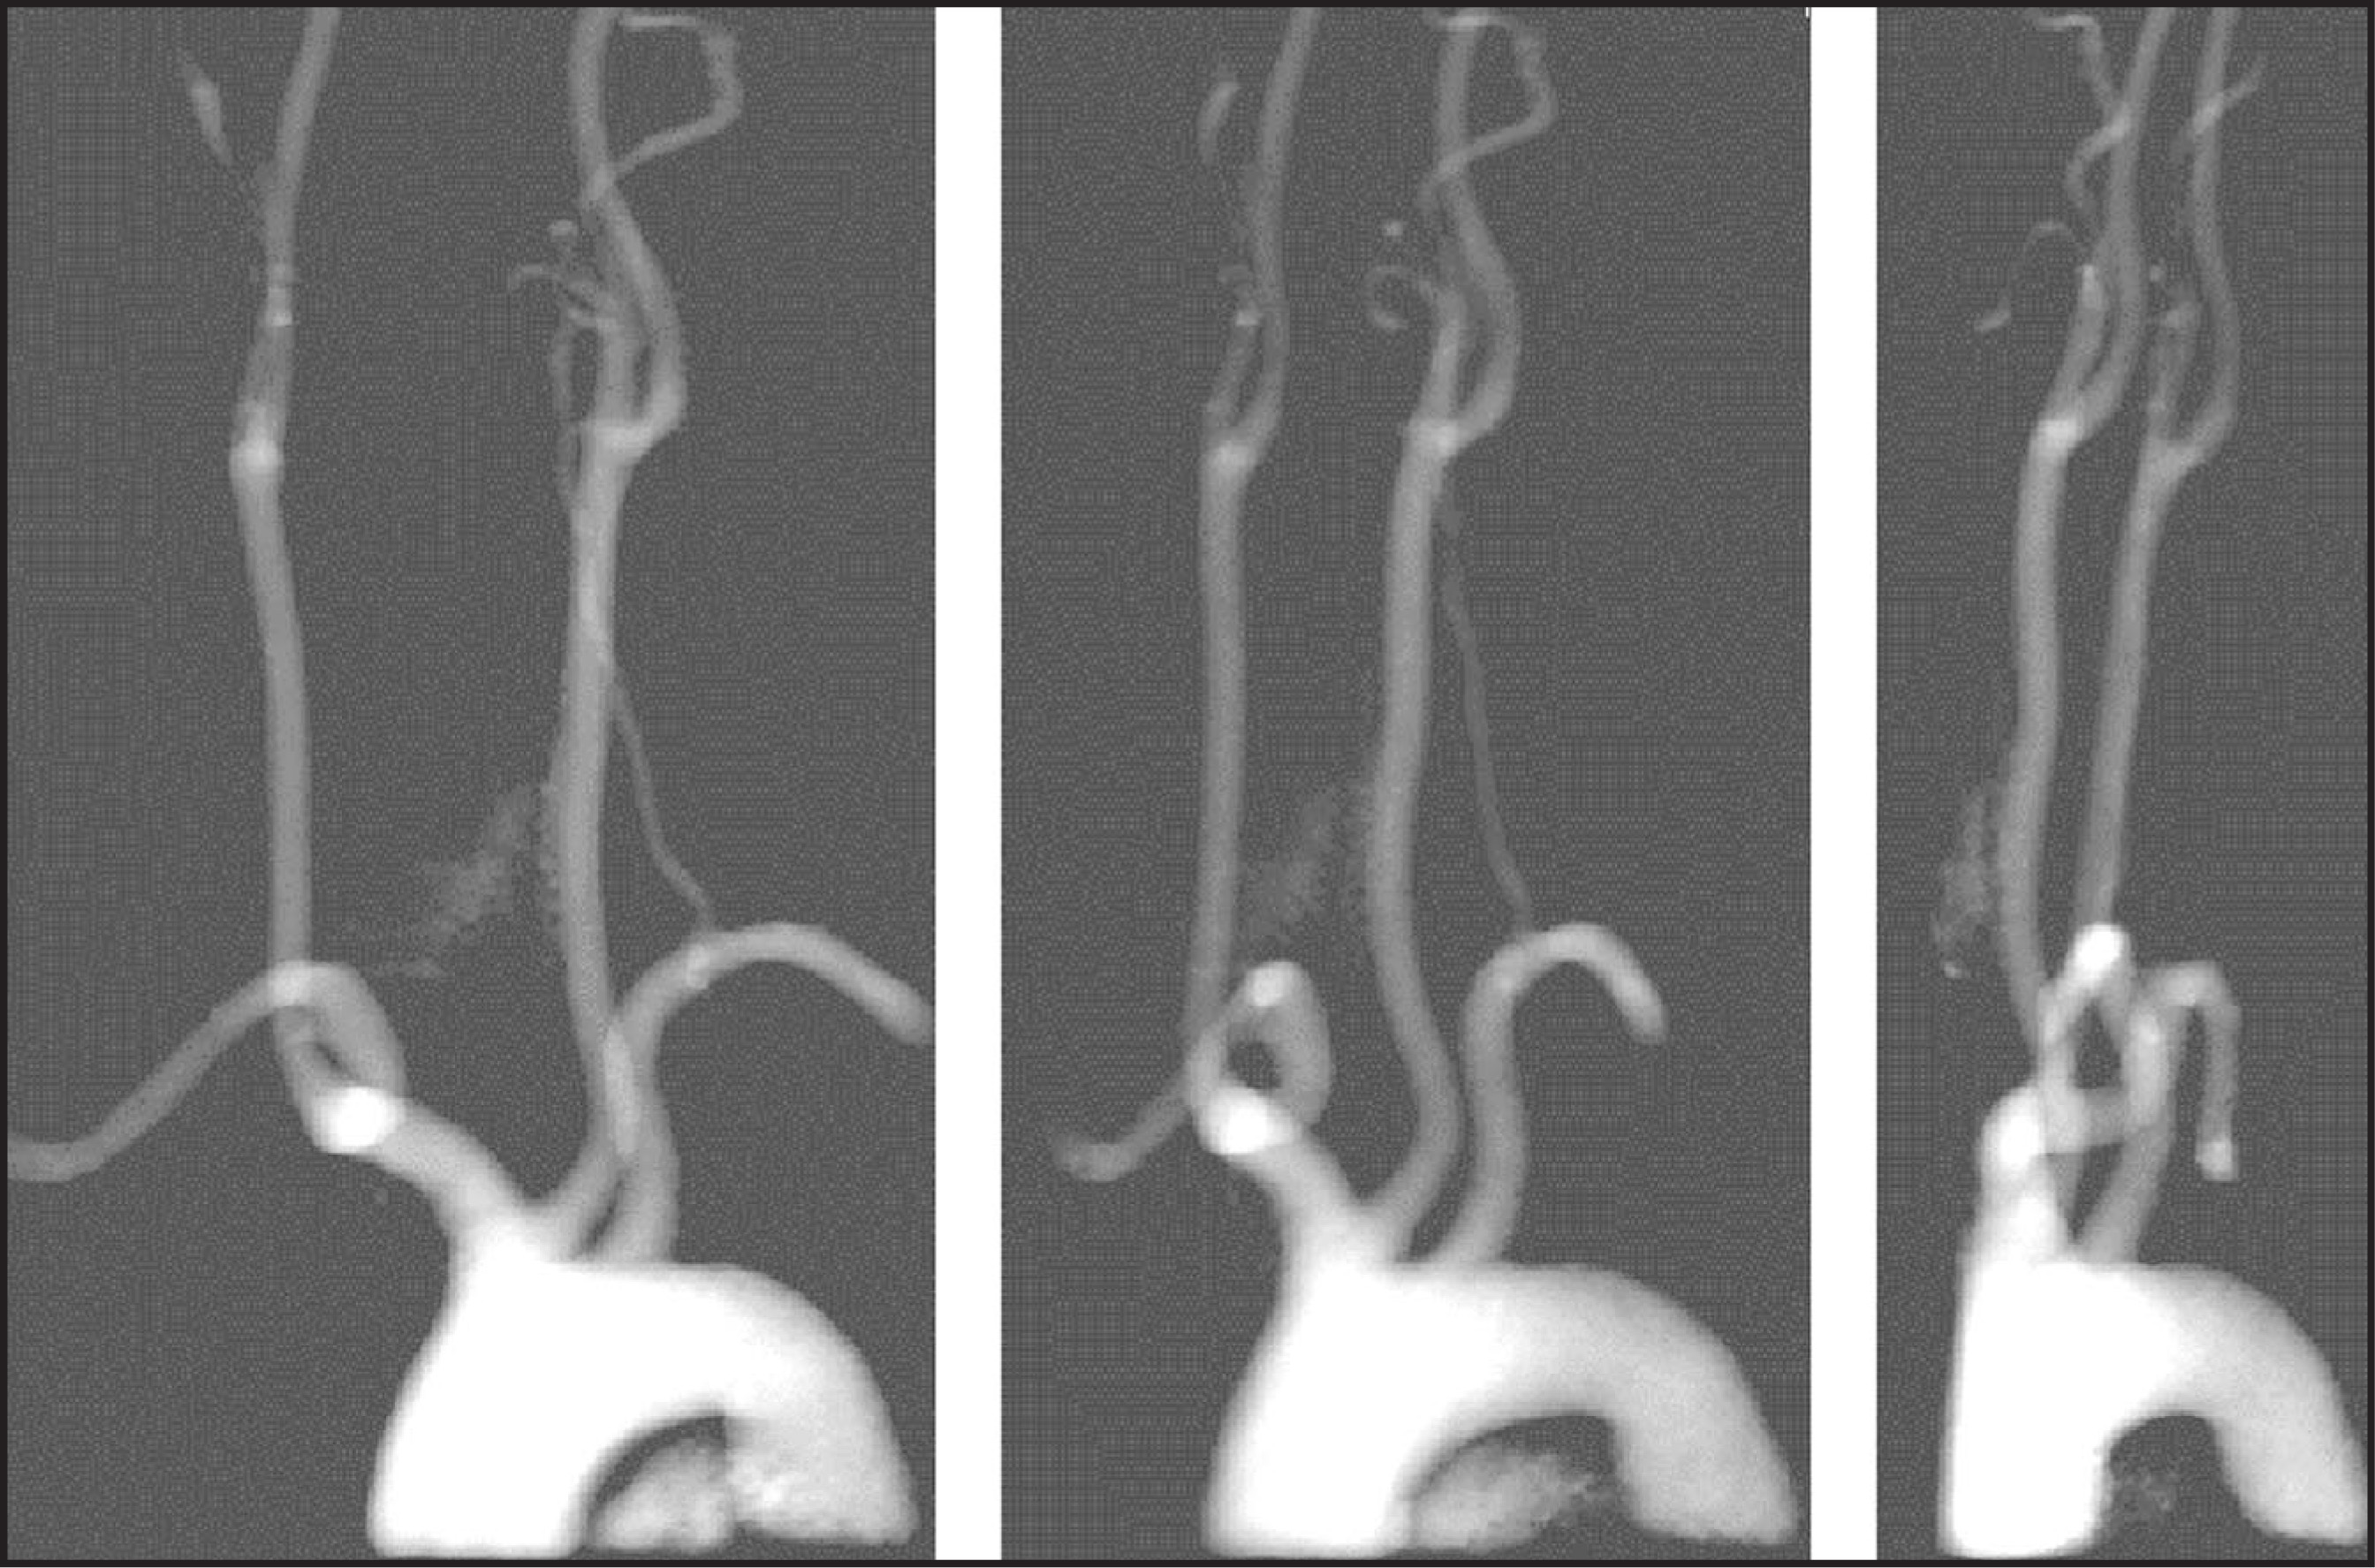
FIGURE 11.
FIGURE 11. Time-of-flight magnetic resonance angiogram of a middle cerebral artery aneurysm: ray sum (upper) and shaded-surface display (SSD). Note the changing intensity of the ray-sum display with variations in vascular structure, orientation, and overlap. Ray-sum rendering improves the depiction of complex vascular anatomy and thrombus. Note the dramatic depiction of surface anatomy and variation of display at different view perspectives with SSD rendering.
FIGURE 12.
FIGURE 12. Ray-sum rendering of contrast-enhanced magnetic resonance angiography of the neurovasculature. Study was performed after administration of 0.05 mmol/kg of gadoteridol and was acquired with a fast three-dimensional gradient recalled echo sequence and elliptical centric k-space ordering. Ray-sum renderings have an appearance similar to that of conventional X-ray angiography, which improves clinical acceptance.

Thresholding a data set before rendering introduces the very significant factor of operator dependency into the imaging process, however. Constant vigilance to avoid overzealous processing in the effort to reduce background information (or remove bone on CT) is essential to maintain model accuracy (figure 13). Because of the potential for operator error, thresholded renderings are best utilized as a supplement to, rather than a replacement for, traditional, non-thresholded MIP techniques.
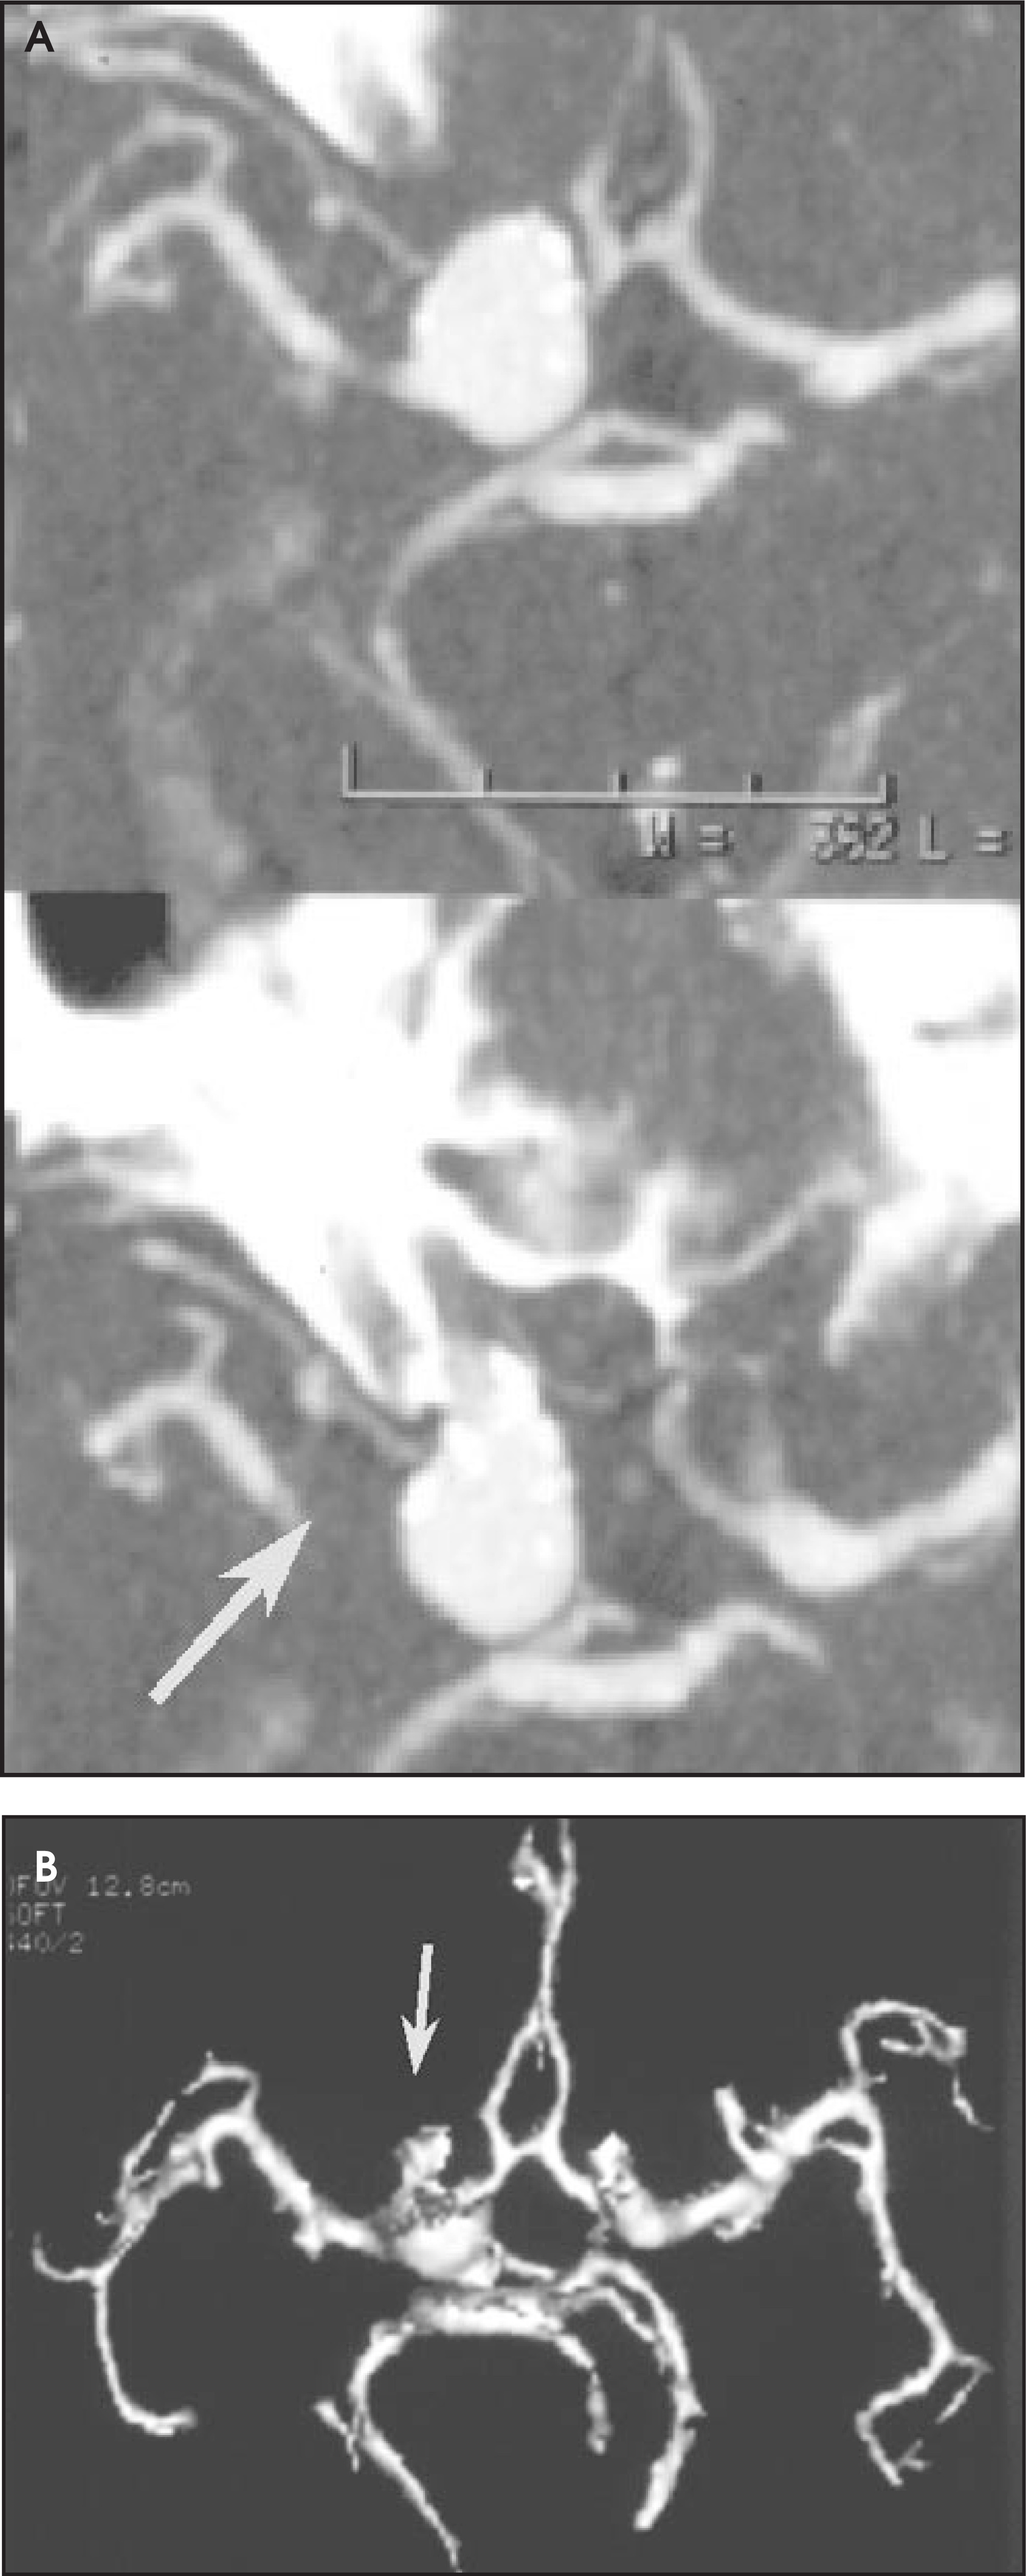
FIGURE 13.
FIGURE 13. Computed tomography angiogram of an internal carotid bifurcation aneurysm: Pitfalls of thresholding. CTA studies of the brain are performed typically with 50 mL of a 370 mg/mL concentration of iodinated contrast agent injected at 2.5 to 5 mL/sec. (A) Note the eroded, “apple-core” appearance of the right-sided aneurysm with shaded-surface display (arrow). The hard thresholding process, which assists in segmentation of the bones of the skull base, can also adversely affect anatomic accuracy of the rendered model. (B) Note the true, more “pear-shaped” morphology (arrow) depicted with nonthresholded overlapping, limited-volume maximum intensity projection techniques. Retention of bone information is useful in operative planning.

Advertisement

Volume rendering

More recently, volume-rendering techniques have become available that allow integration of the full range of image data and depiction with variable opacity. Traditional, non-thresholded, whole-volume MIP is a form of volume rendering in which only the brightest pixels have been rendered opaque. Unlike traditional “hard” thresholded 3D techniques, which require removal of unwanted ranges, volume-rendering techniques allow all ranges to remain within the model under study.4,5

The operator is presented with a menu of preset rendering options under which intensity (and density) ranges have been designated a variable opacity (figures 14 through 19).
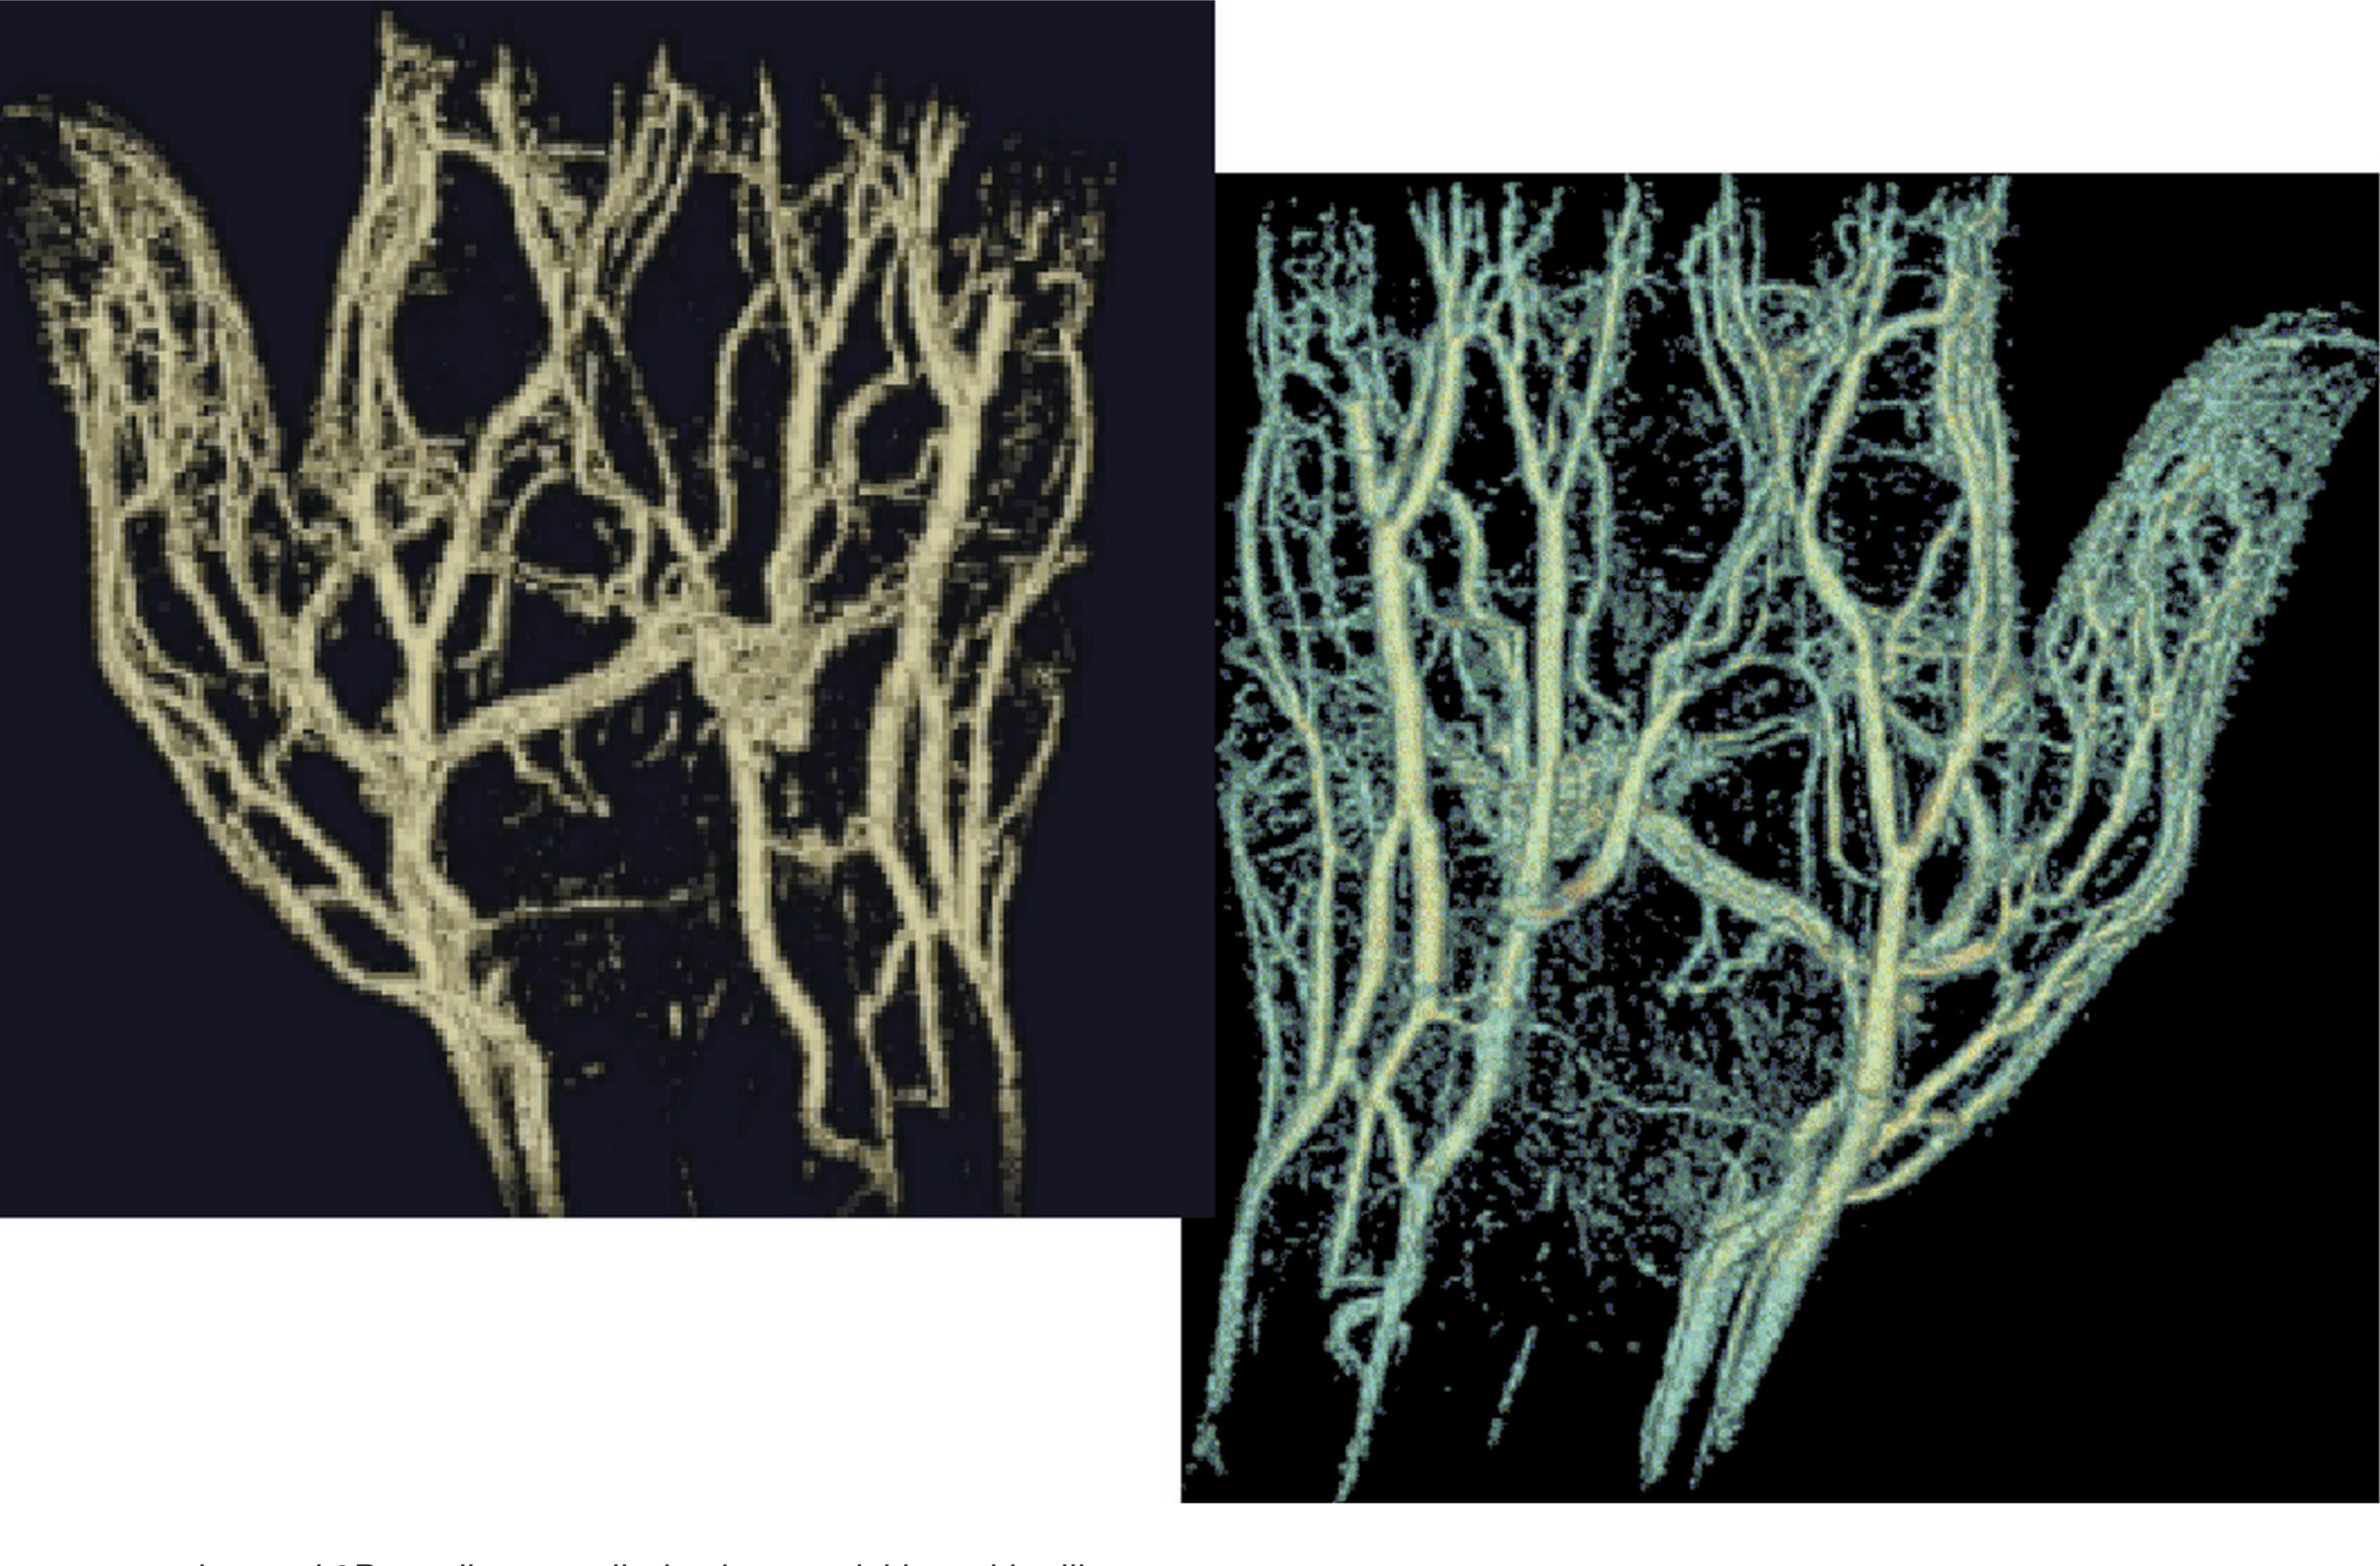
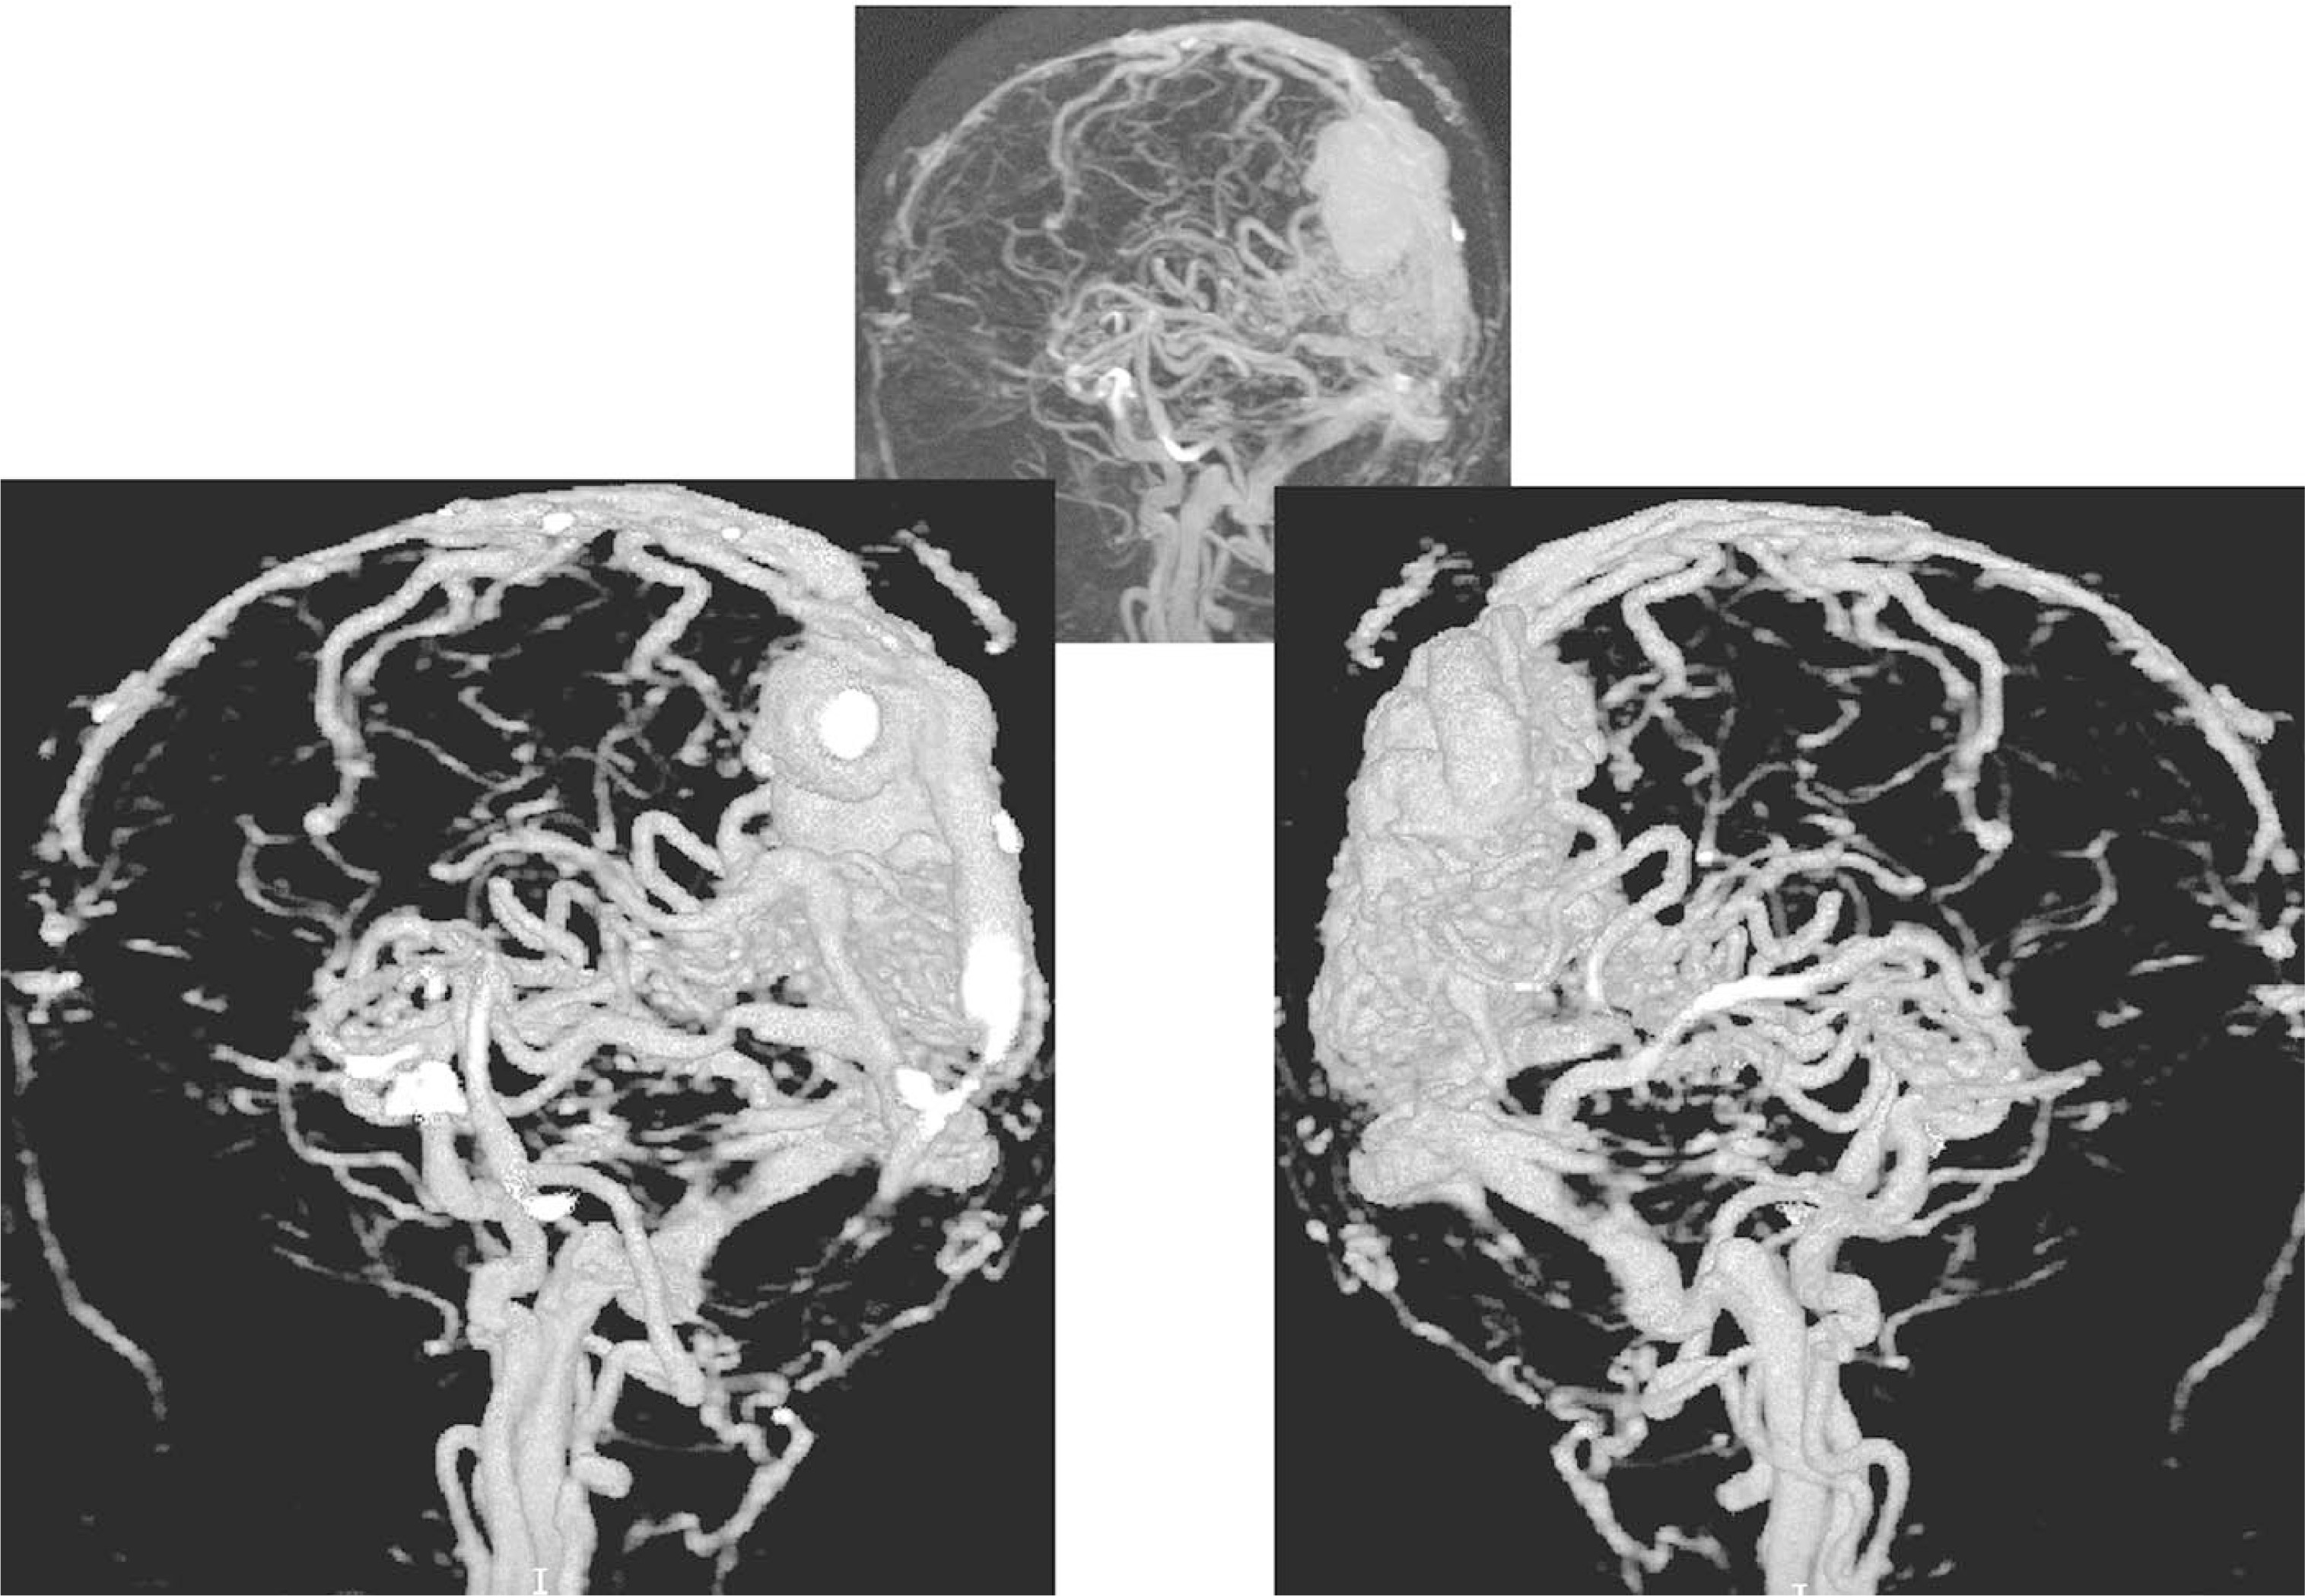
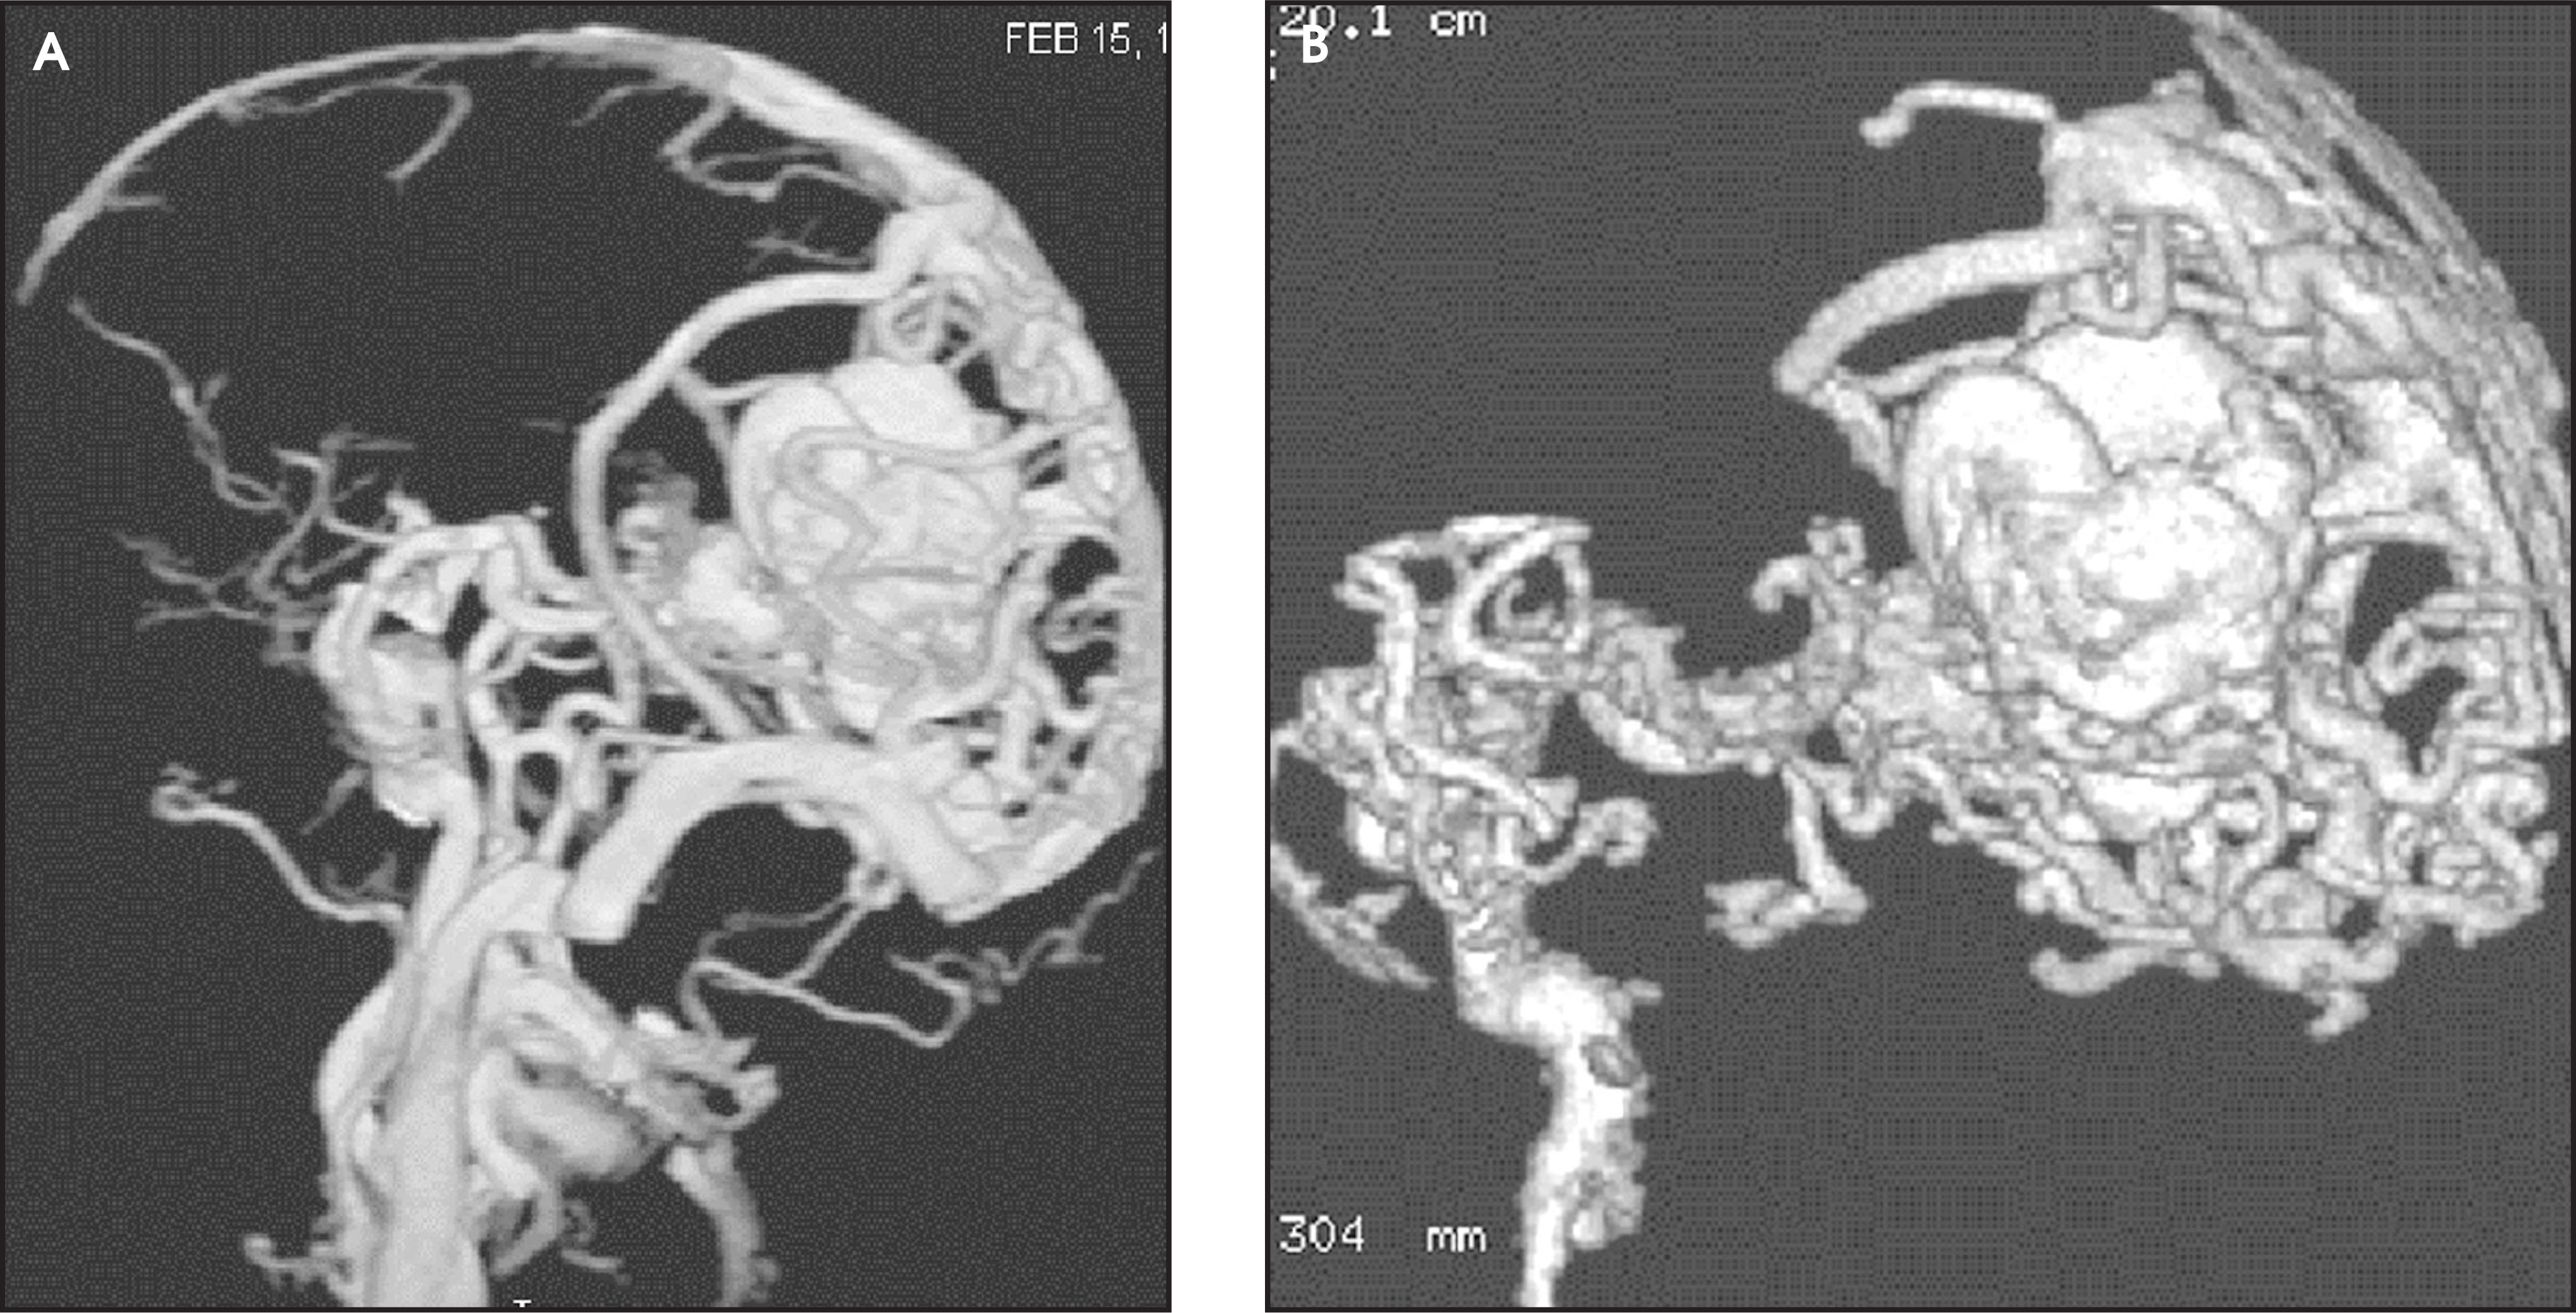
FIGURE 14.
FIGURE 14. Volume renderings of contrast-enhanced magnetic resonance angiography of the hand. Note the varied and dramatic three-dimensional (3D) appearance of the vasculature in this patient with hypothenar-hammer syndrome. The study was performed after determination of contrast transit time via a test injection timing run. After acquisition of a subtraction mask, a contrast-enhanced 3D gradient recalled echo acquisition with elliptical centric k-space ordering was performed.
FIGURE 15.
FIGURE 15. Contrast-enhanced magnetic resonance angiogram of an arteriovenous malformation. Study is fast three-dimensional gradient recalled echo image acquired with 0.05 mmol/kg of gadoteridol. Note the more dramatic depiction of anatomy with volume rendering when compared with the two-dimensional maximum intensity projection image (upper image). Note how the volume renderings, in this instance, highlight surface anatomy allowing only minimum transparency.
FIGURE 16.
FIGURE 16. Comparison of (A) volume-rendered contrast-enhanced magnetic resonance angiography and (B) three-dimensional conventional X-ray angiography studies of an arteriovenous malformation (AVM). All components of the AVM are well depicted on the “steady-state” magnetic resonance angiography study, albeit with significant overlap of arterial and venous information.
FIGURE 17.
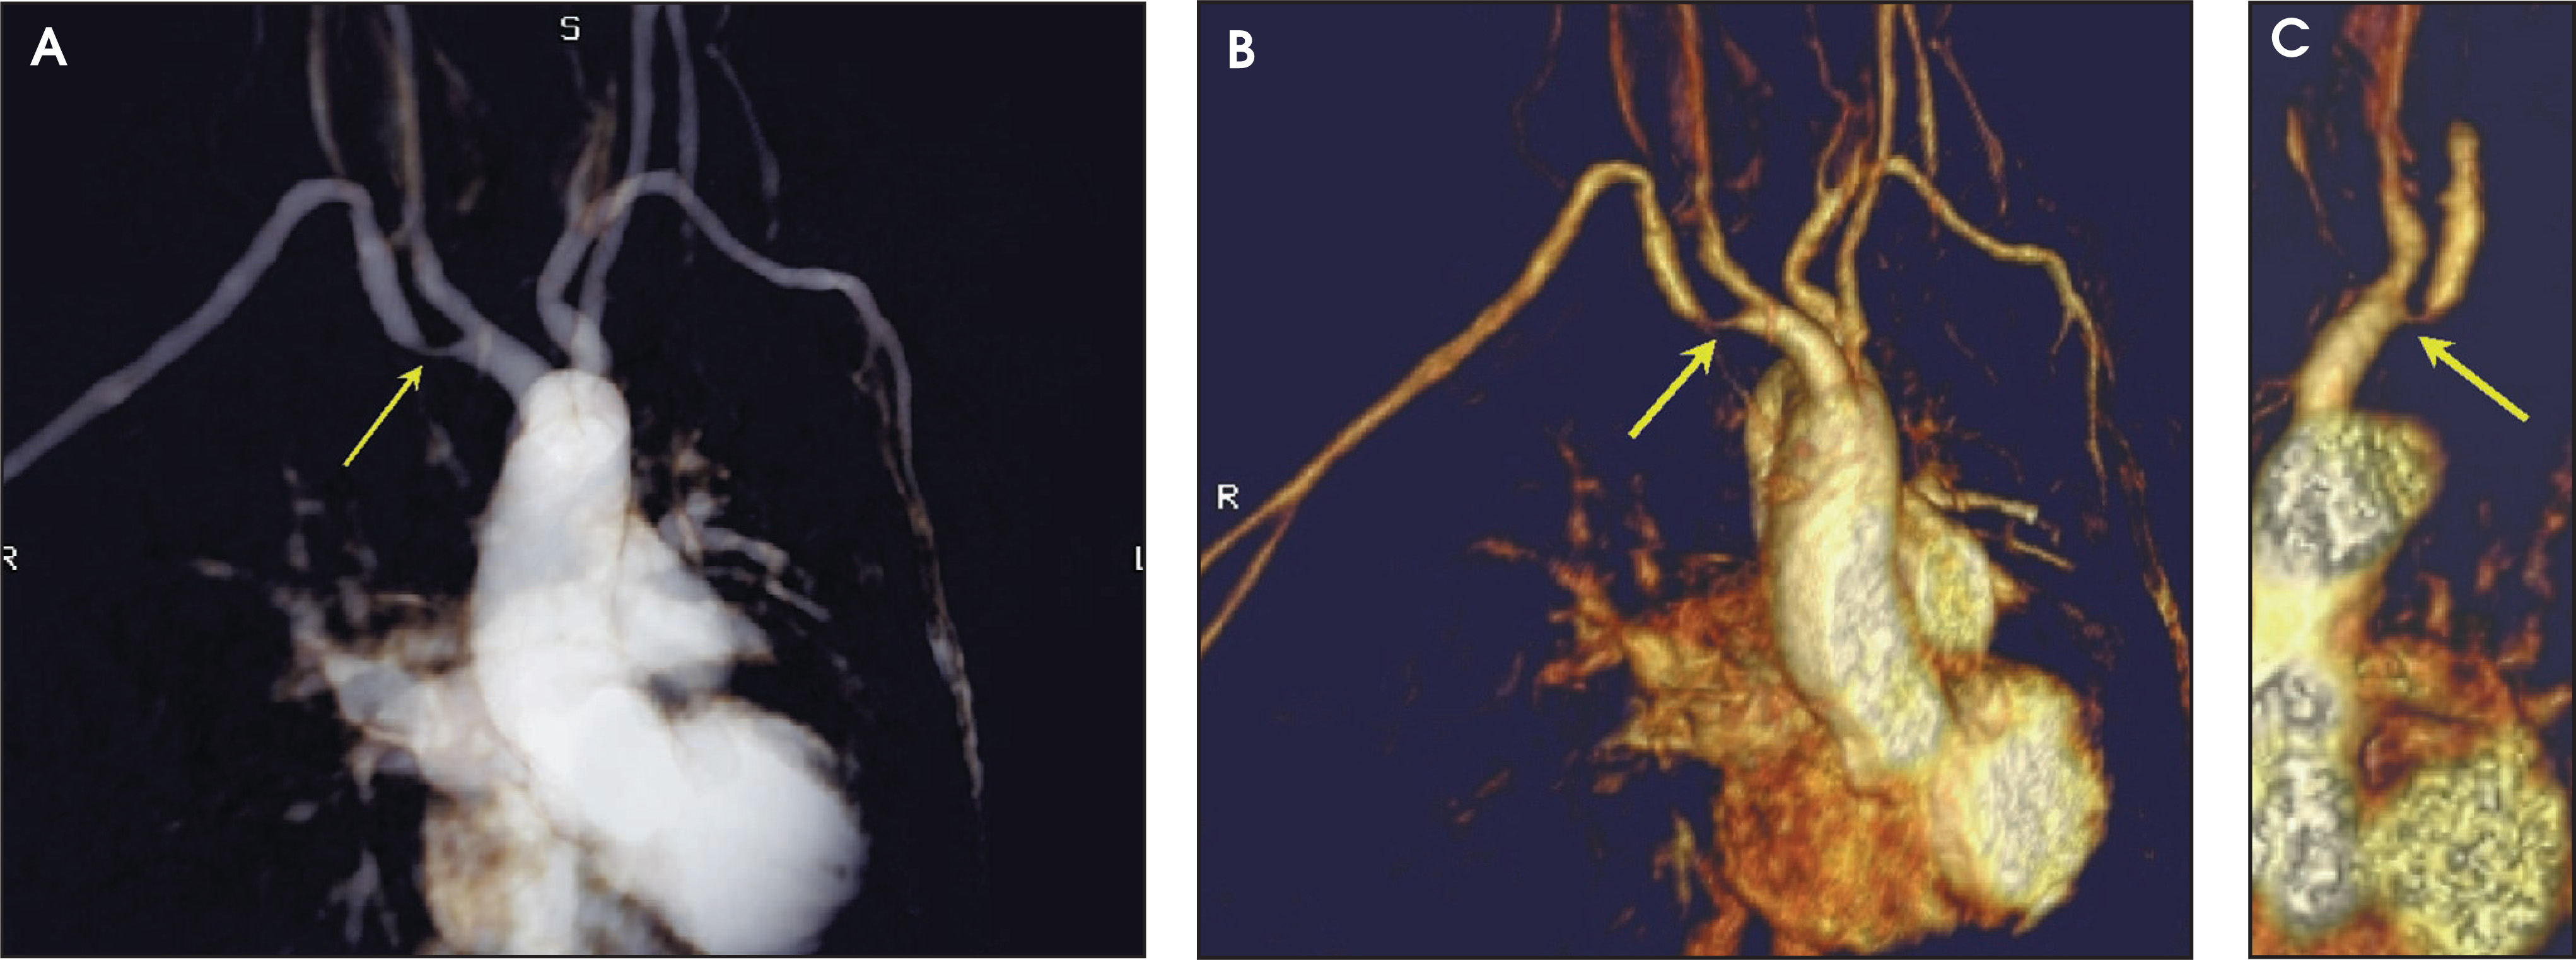
FIGURE 17. (A) Ray-sum–like volume rendering of a contrast-enhanced magnetic resonance angiogram in a patient with diminished pulses in the right upper extremity reveals a right subclavian artery stenosis (arrow). Note the partial transparency of the model with clear delineation of summation information similar to that of conventional X-ray techniques. (B and C) Shaded-surface-display (SSD)-like volume renderings assist in delineating the right subclavian artery origin stenosis (arrows). Some transparency is retained, a feature not available with SSD.
FIGURE 18.
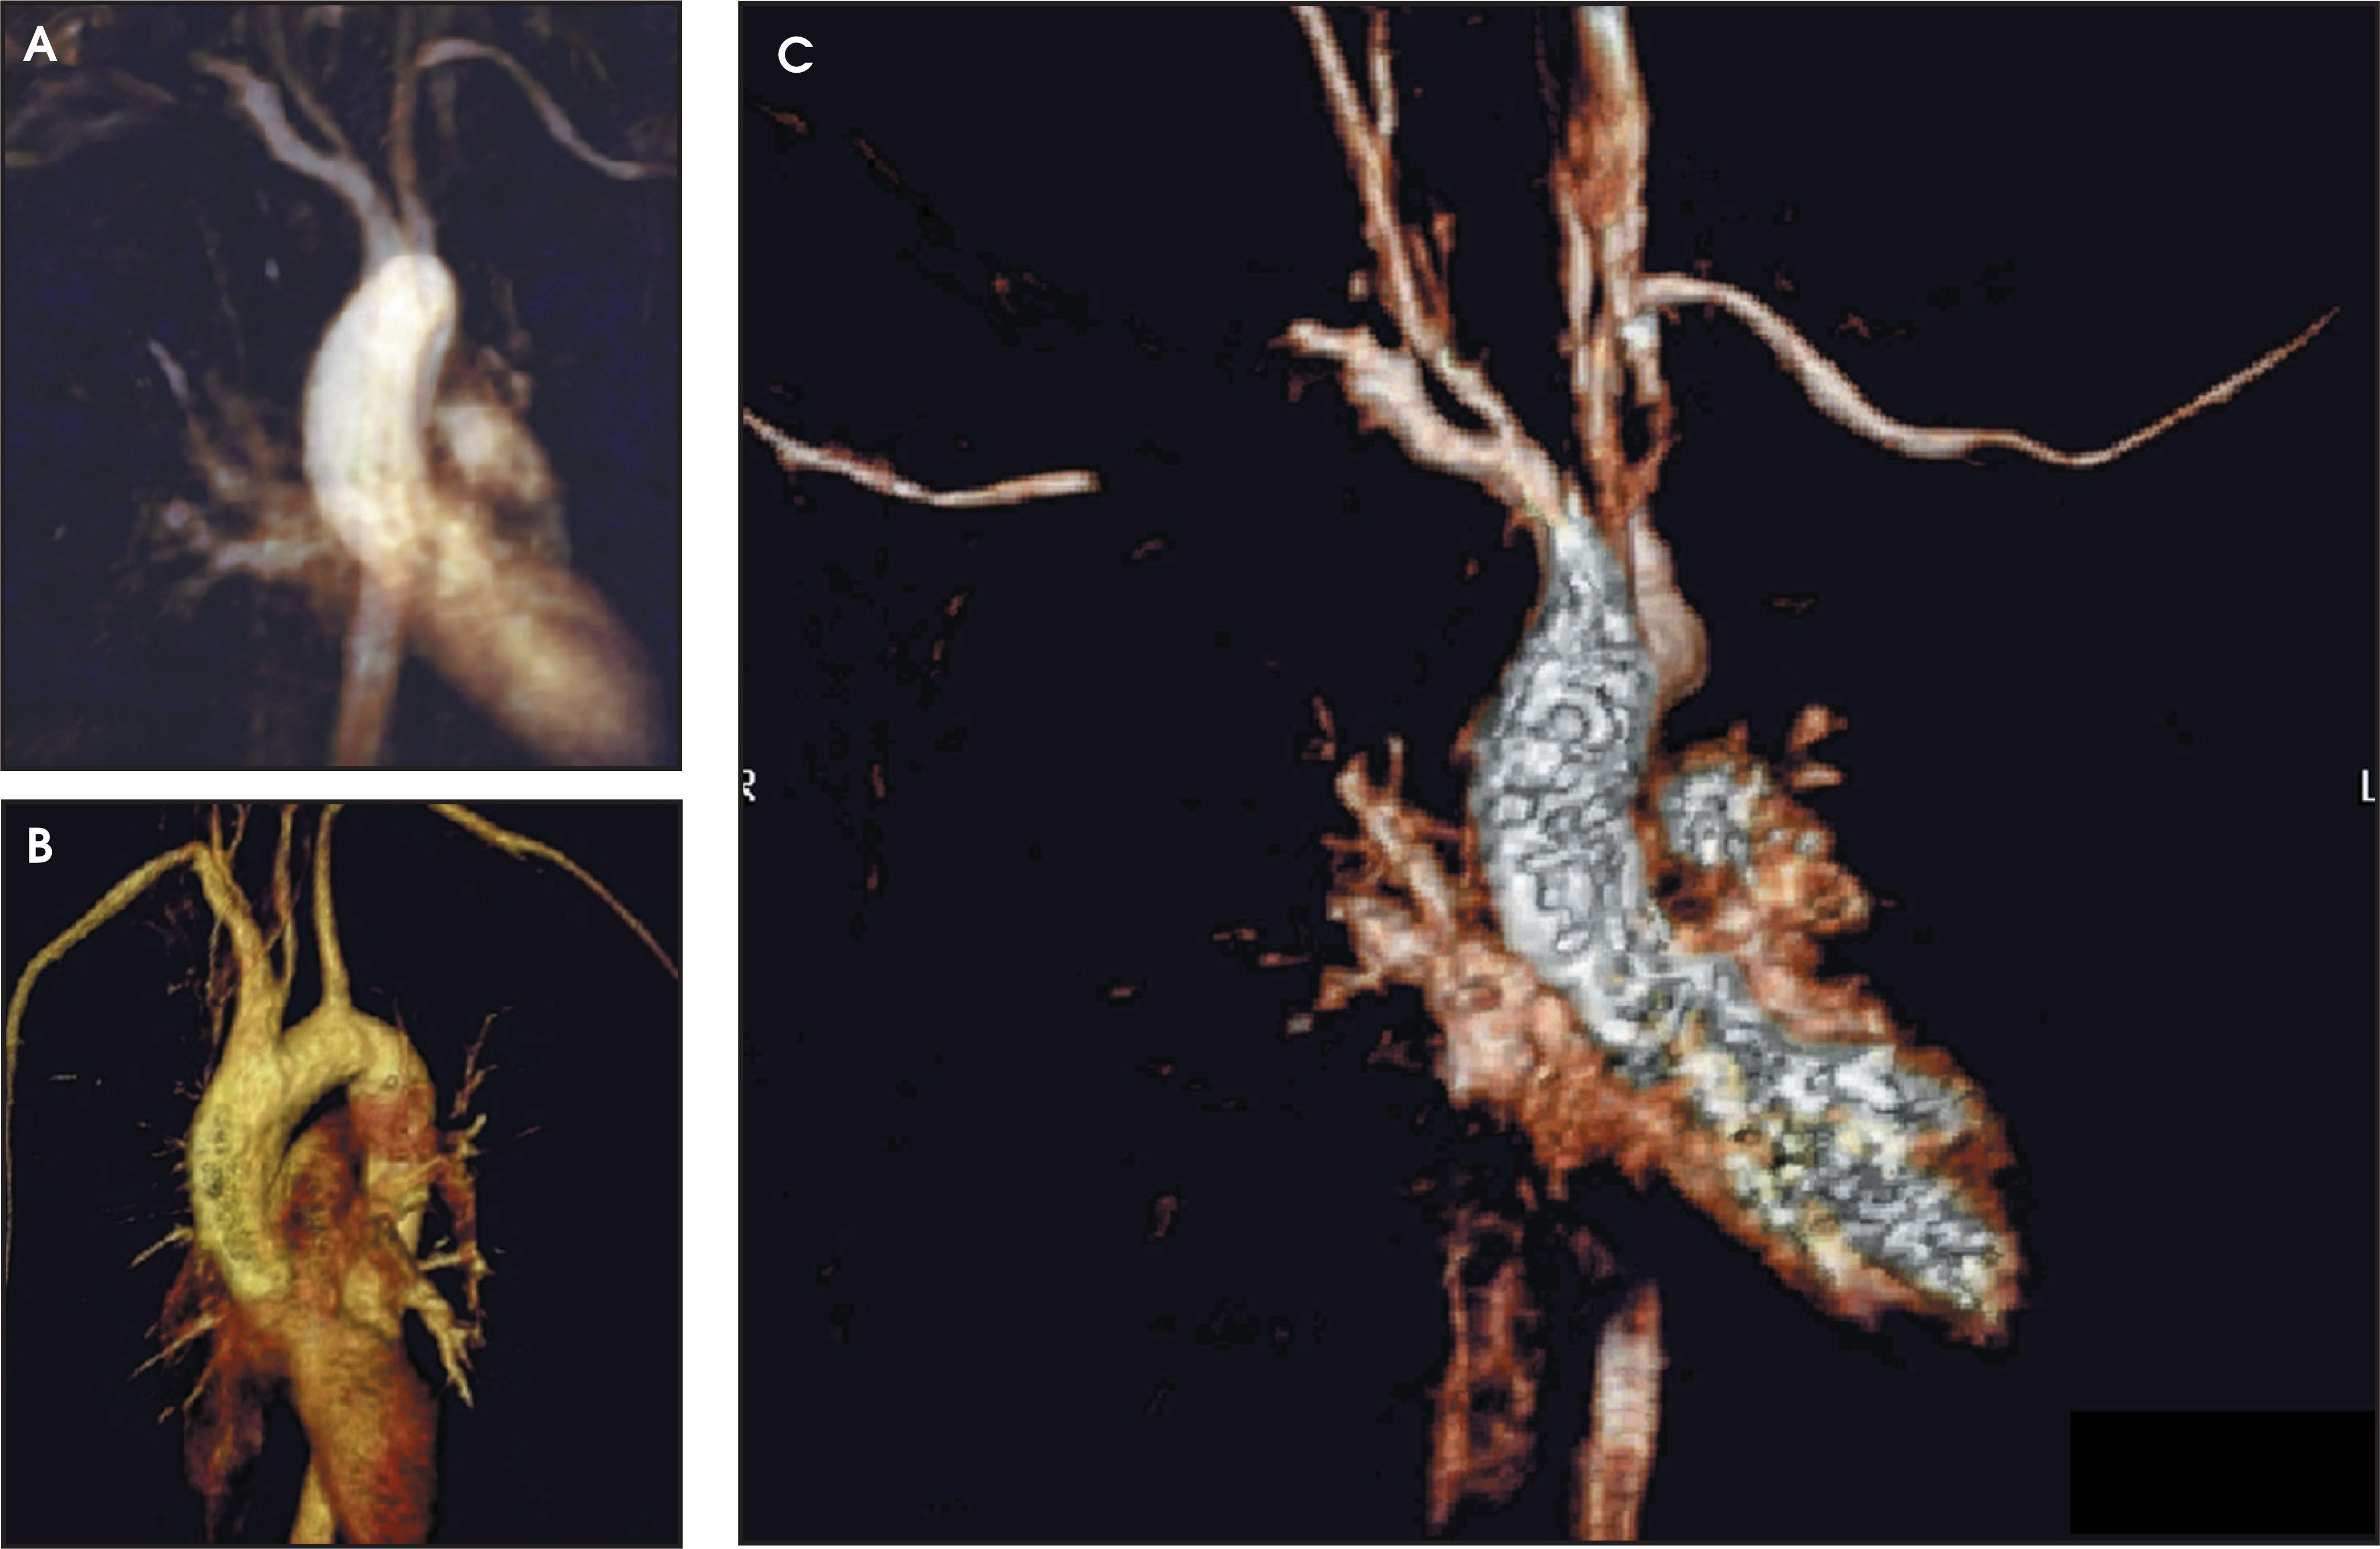
FIGURE 18. Magnetic resonance angiography (MRA) of thoracic outlet syndrome. (A and B) Study obtained with arms down (volume renderings) is unrevealing. (C) Volume rendering of contrast-enhanced MRA study acquired with arms elevated over the head (Adson’s maneuver) demonstrates right subclavian artery impingement. One of the strengths of MRA over computed tomography angiography and conventional angiography is the ability to repeat exams in multiple phases or conditions due to the absence of ionizing radiation and an extremely well tolerated contrast agent.
FIGURE 19.
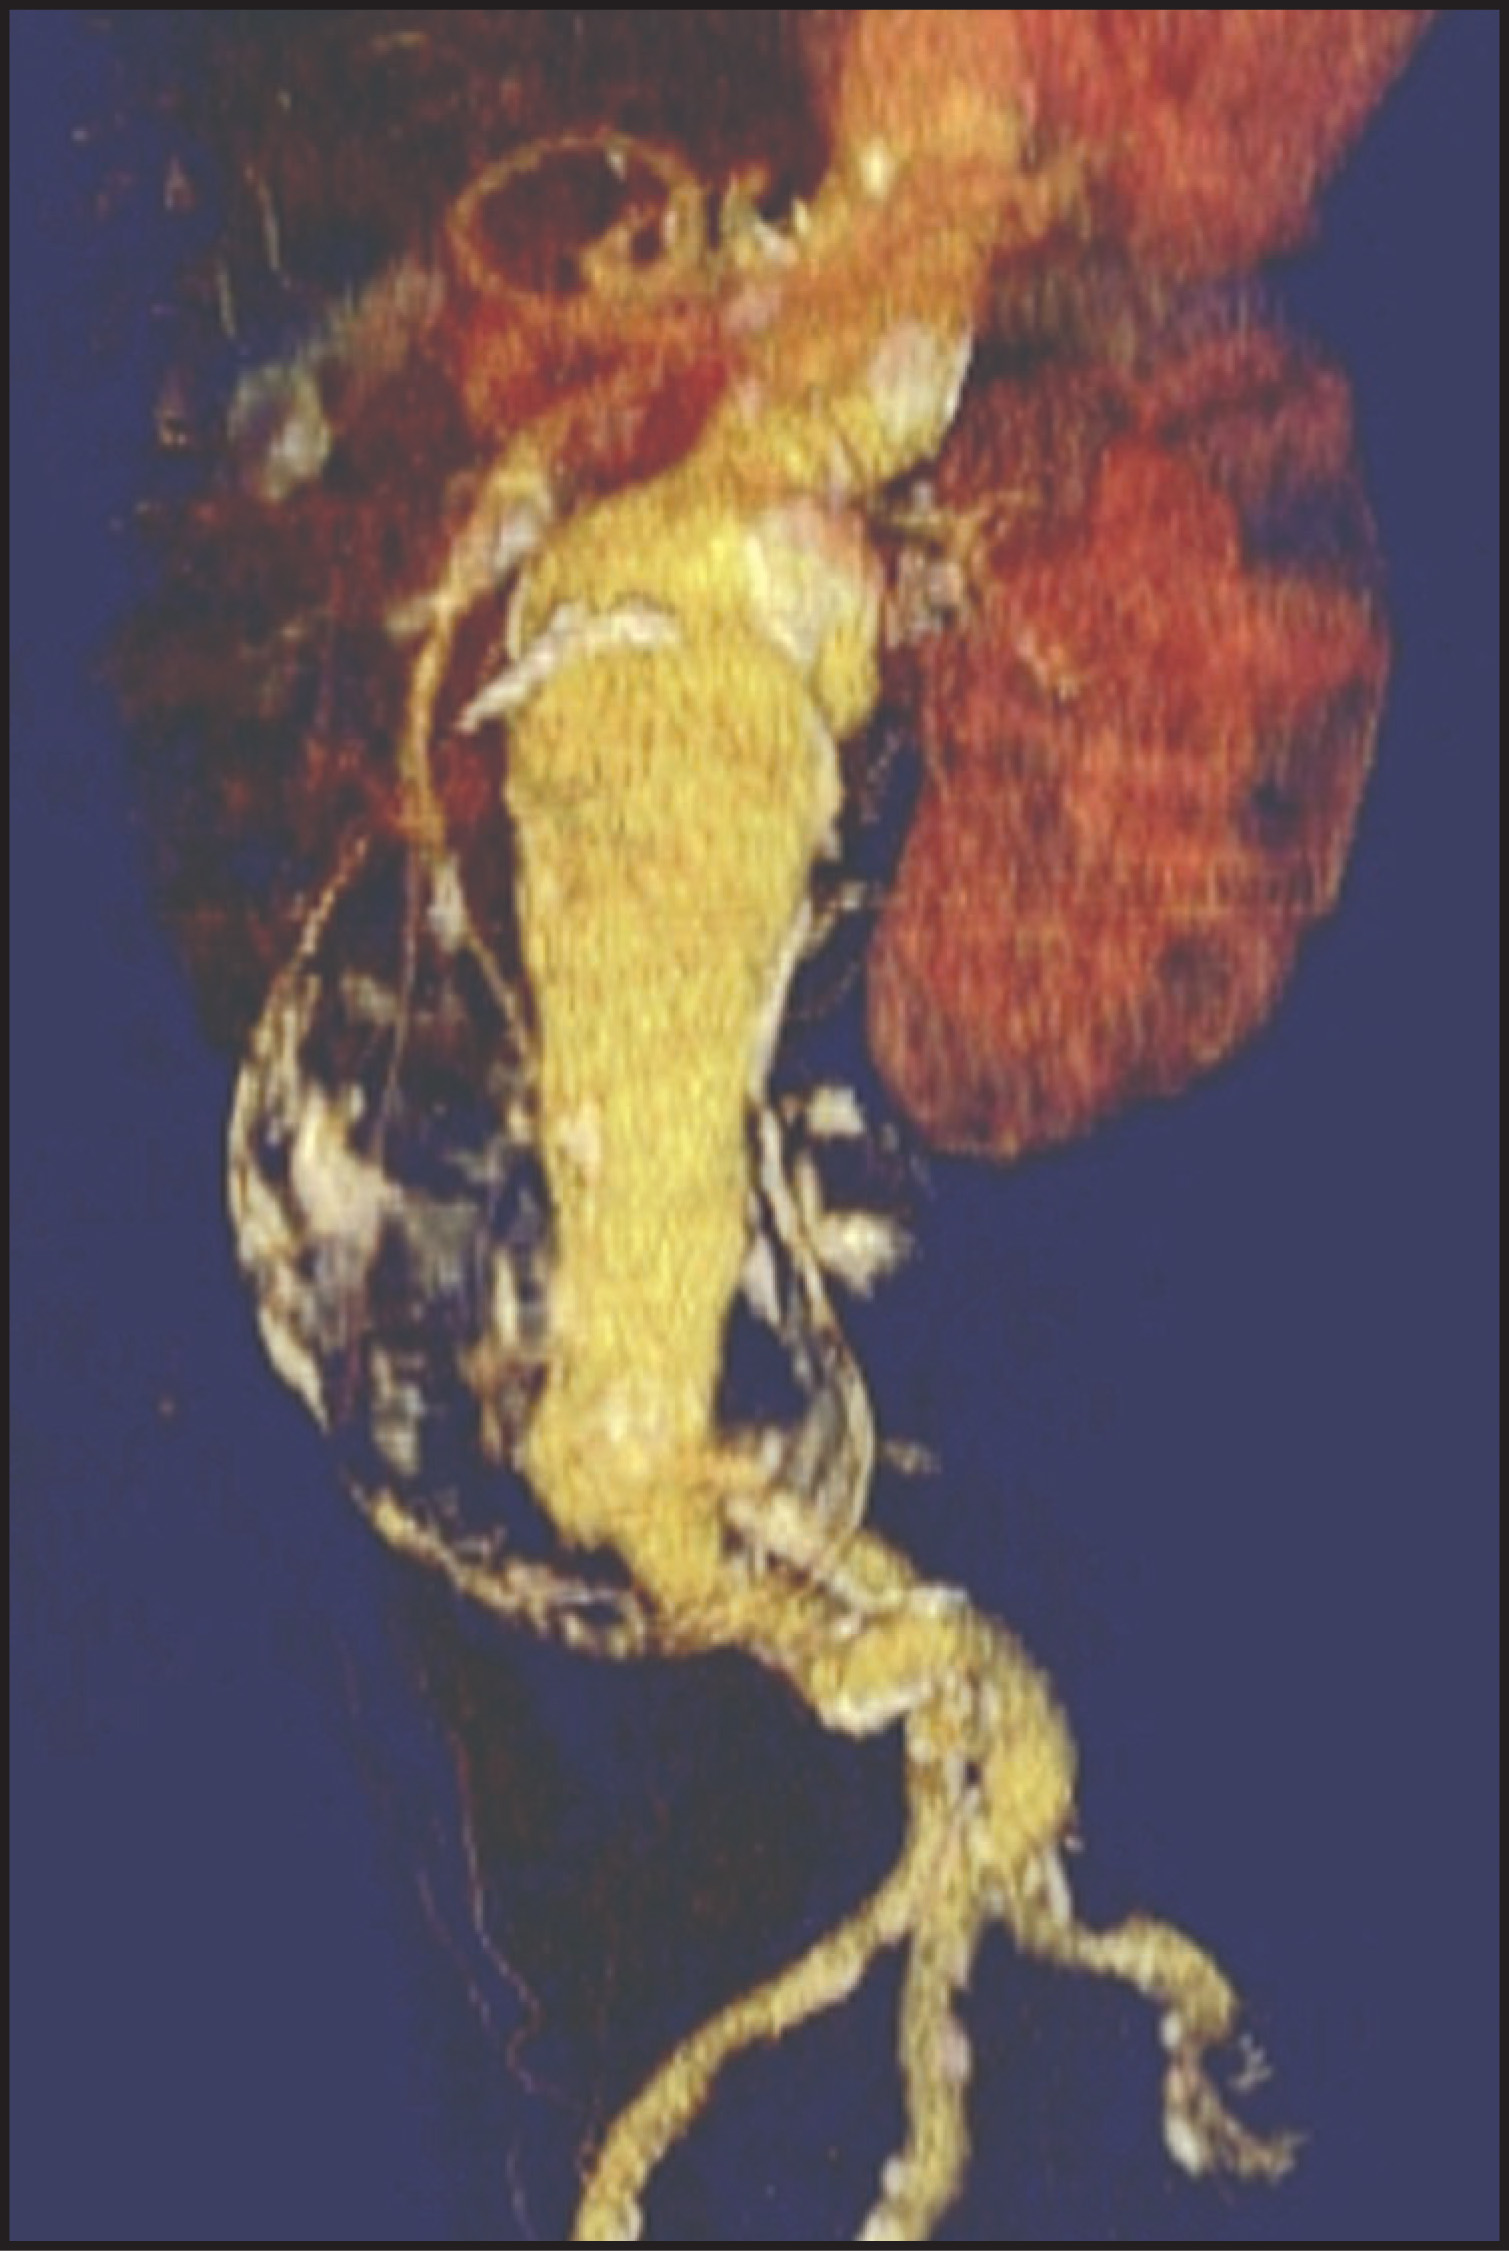
FIGURE 19. Volume-rendered computed tomography angiogram of an abdominal aortic aneurysm. Note the excellent depiction of surface features with retained partial transparency as well as differentiation of calcified wall, thrombus, and patent opacified lumen combining features of shaded-surface display, ray-sum, and maximum intensity projection.

Since thresholding is “soft,” creative model manipulation is rapid and interactive, providing the best possible dynamic display of pathology and anatomy.

Initially advocated for CTA data, these techniques offer significant benefits when rendering MRA. Renderings with features of hard-thresholded SSD, MIP, and ray sum can be created separately or in combination on a free-standing workstation (figures 19 and 20). Hard- and soft-thresholding techniques can also be used in combination to facilitate display.
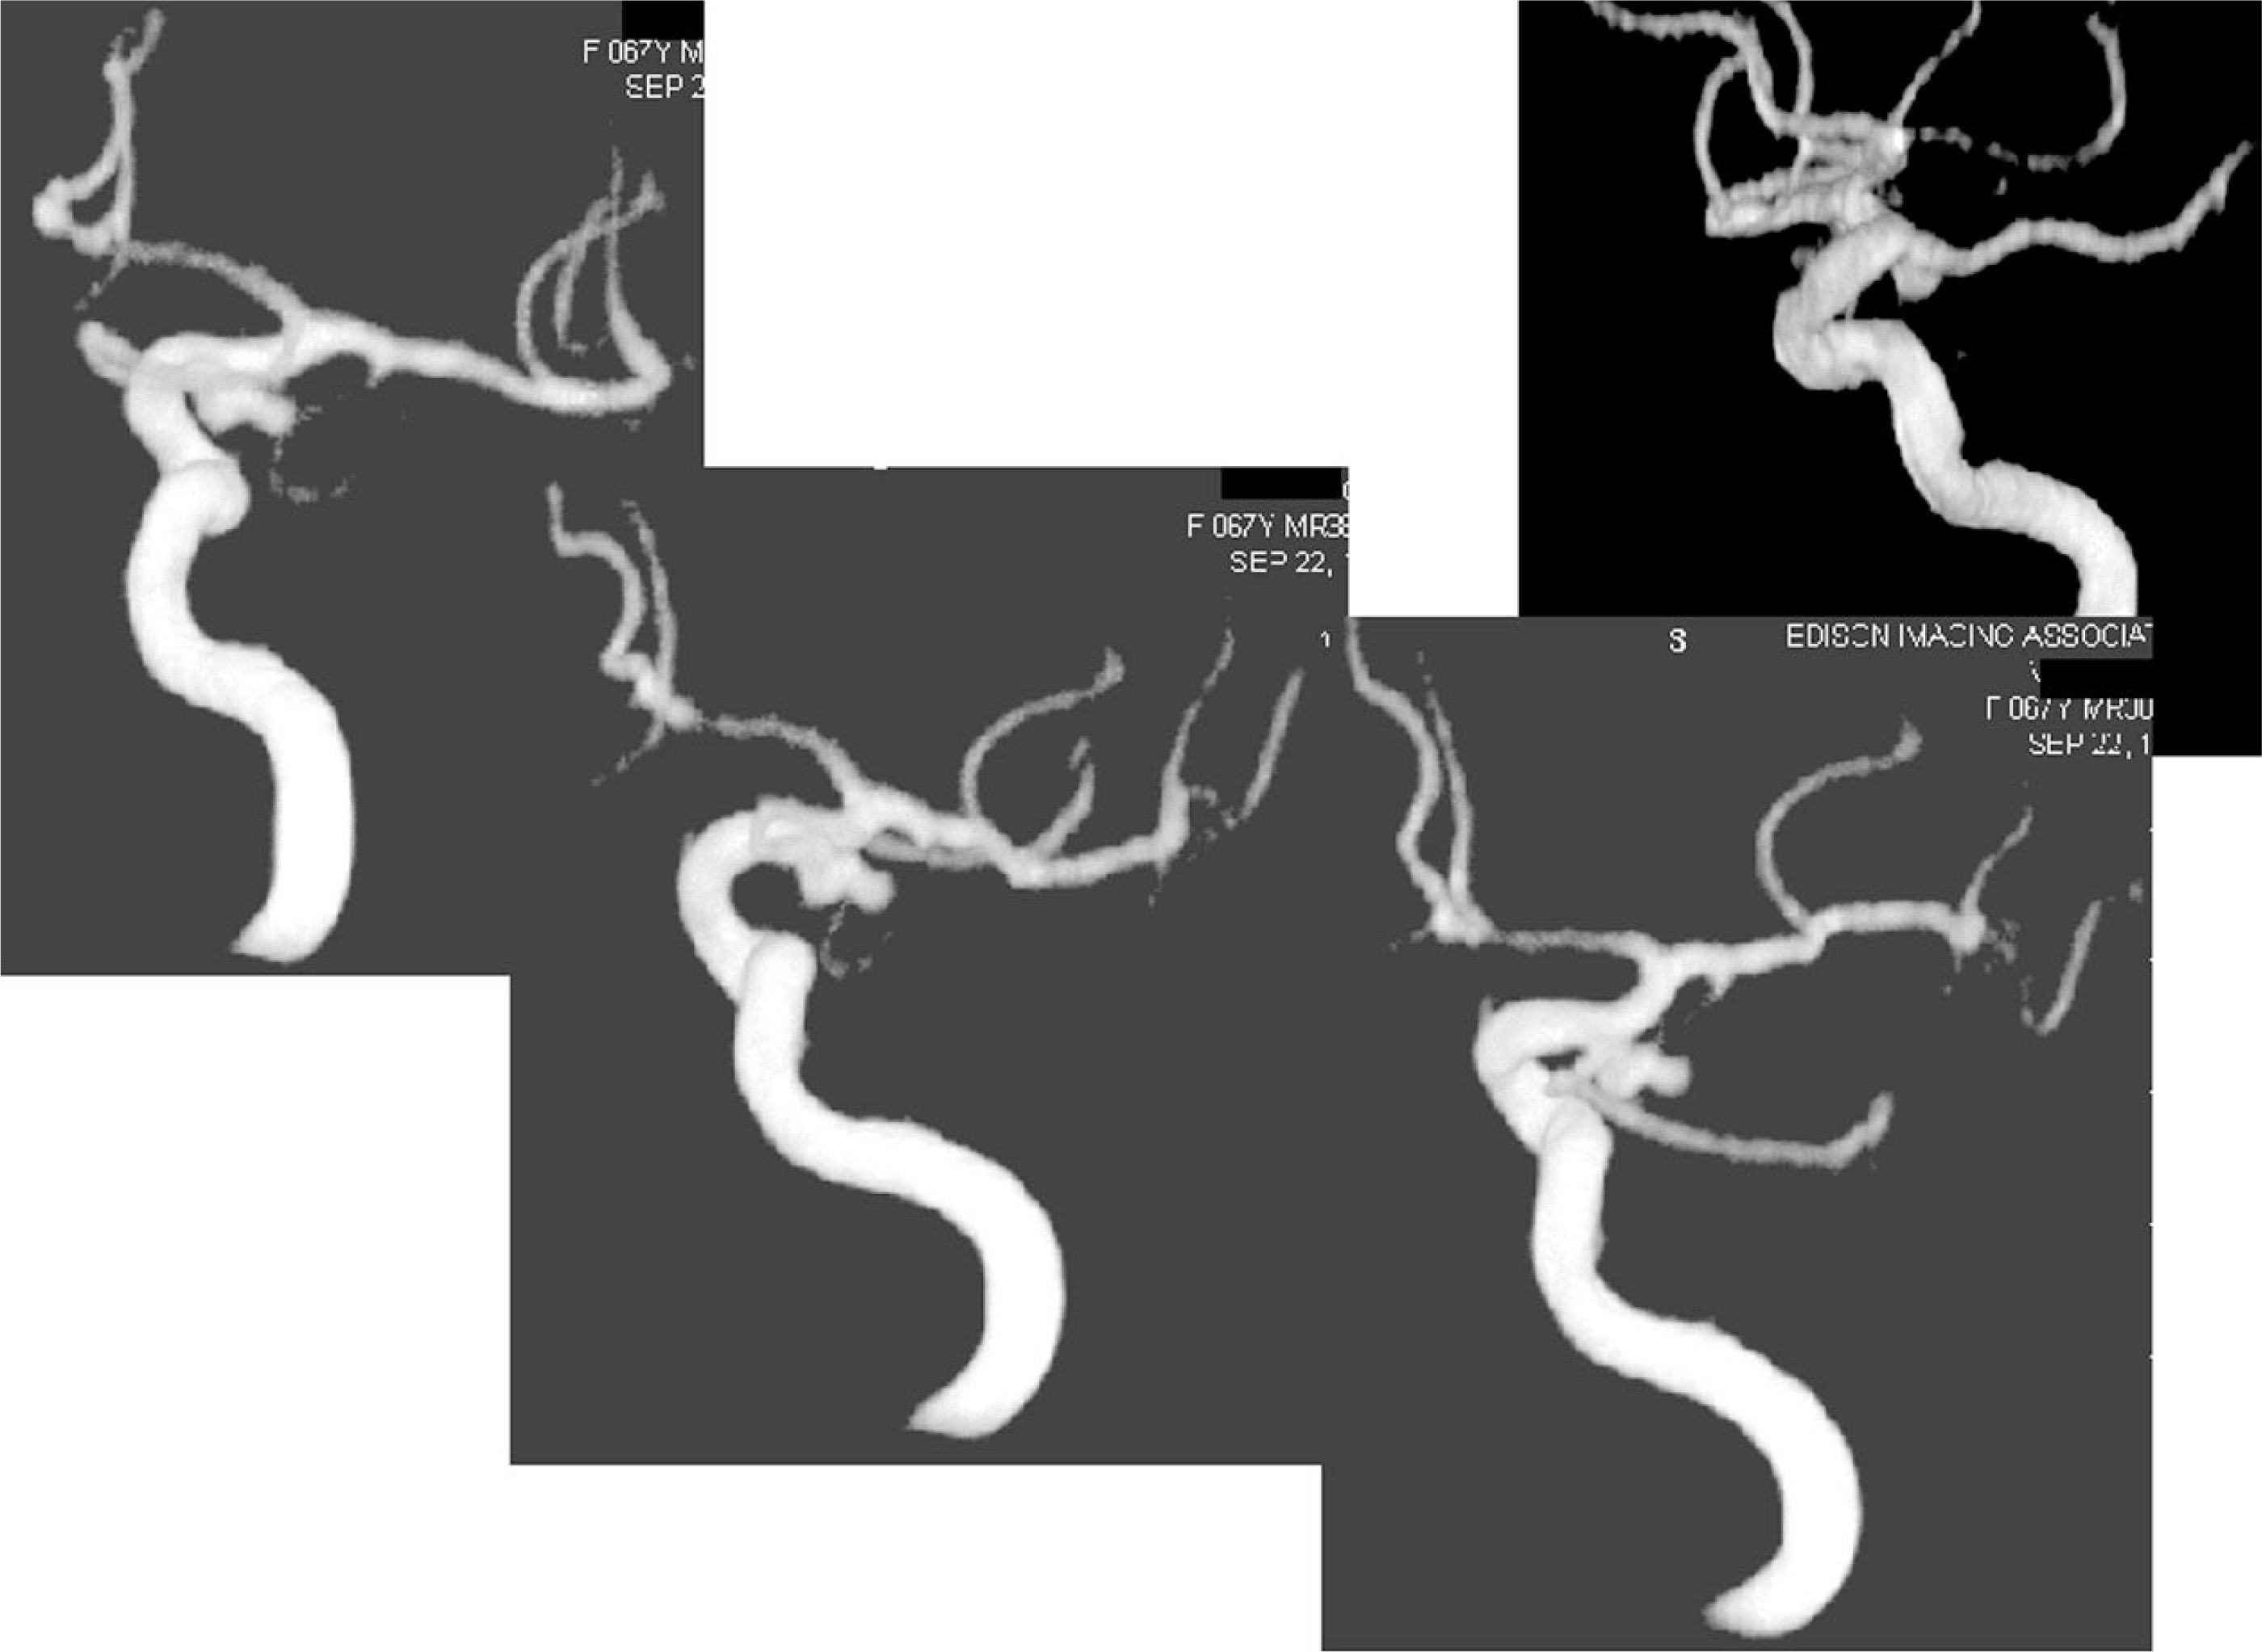
FIGURE 20.
FIGURE 20. Three-dimensional time-off-light magnetic resonance angiography of a bilobed aneurysm at the origin of a fetal posterior cerebral artery. Hard thresholding removes signal from background tissues, allowing more flexibility in application of volume-rendering algorithms. Here the rendering has many of the features of shaded-surface display.

Recently, automated bone segmentation algorithms have become available that facilitate bone removal. Alternatively, bone information can be superimposed on the completed vascular model to provide useful localization information (figure 21).
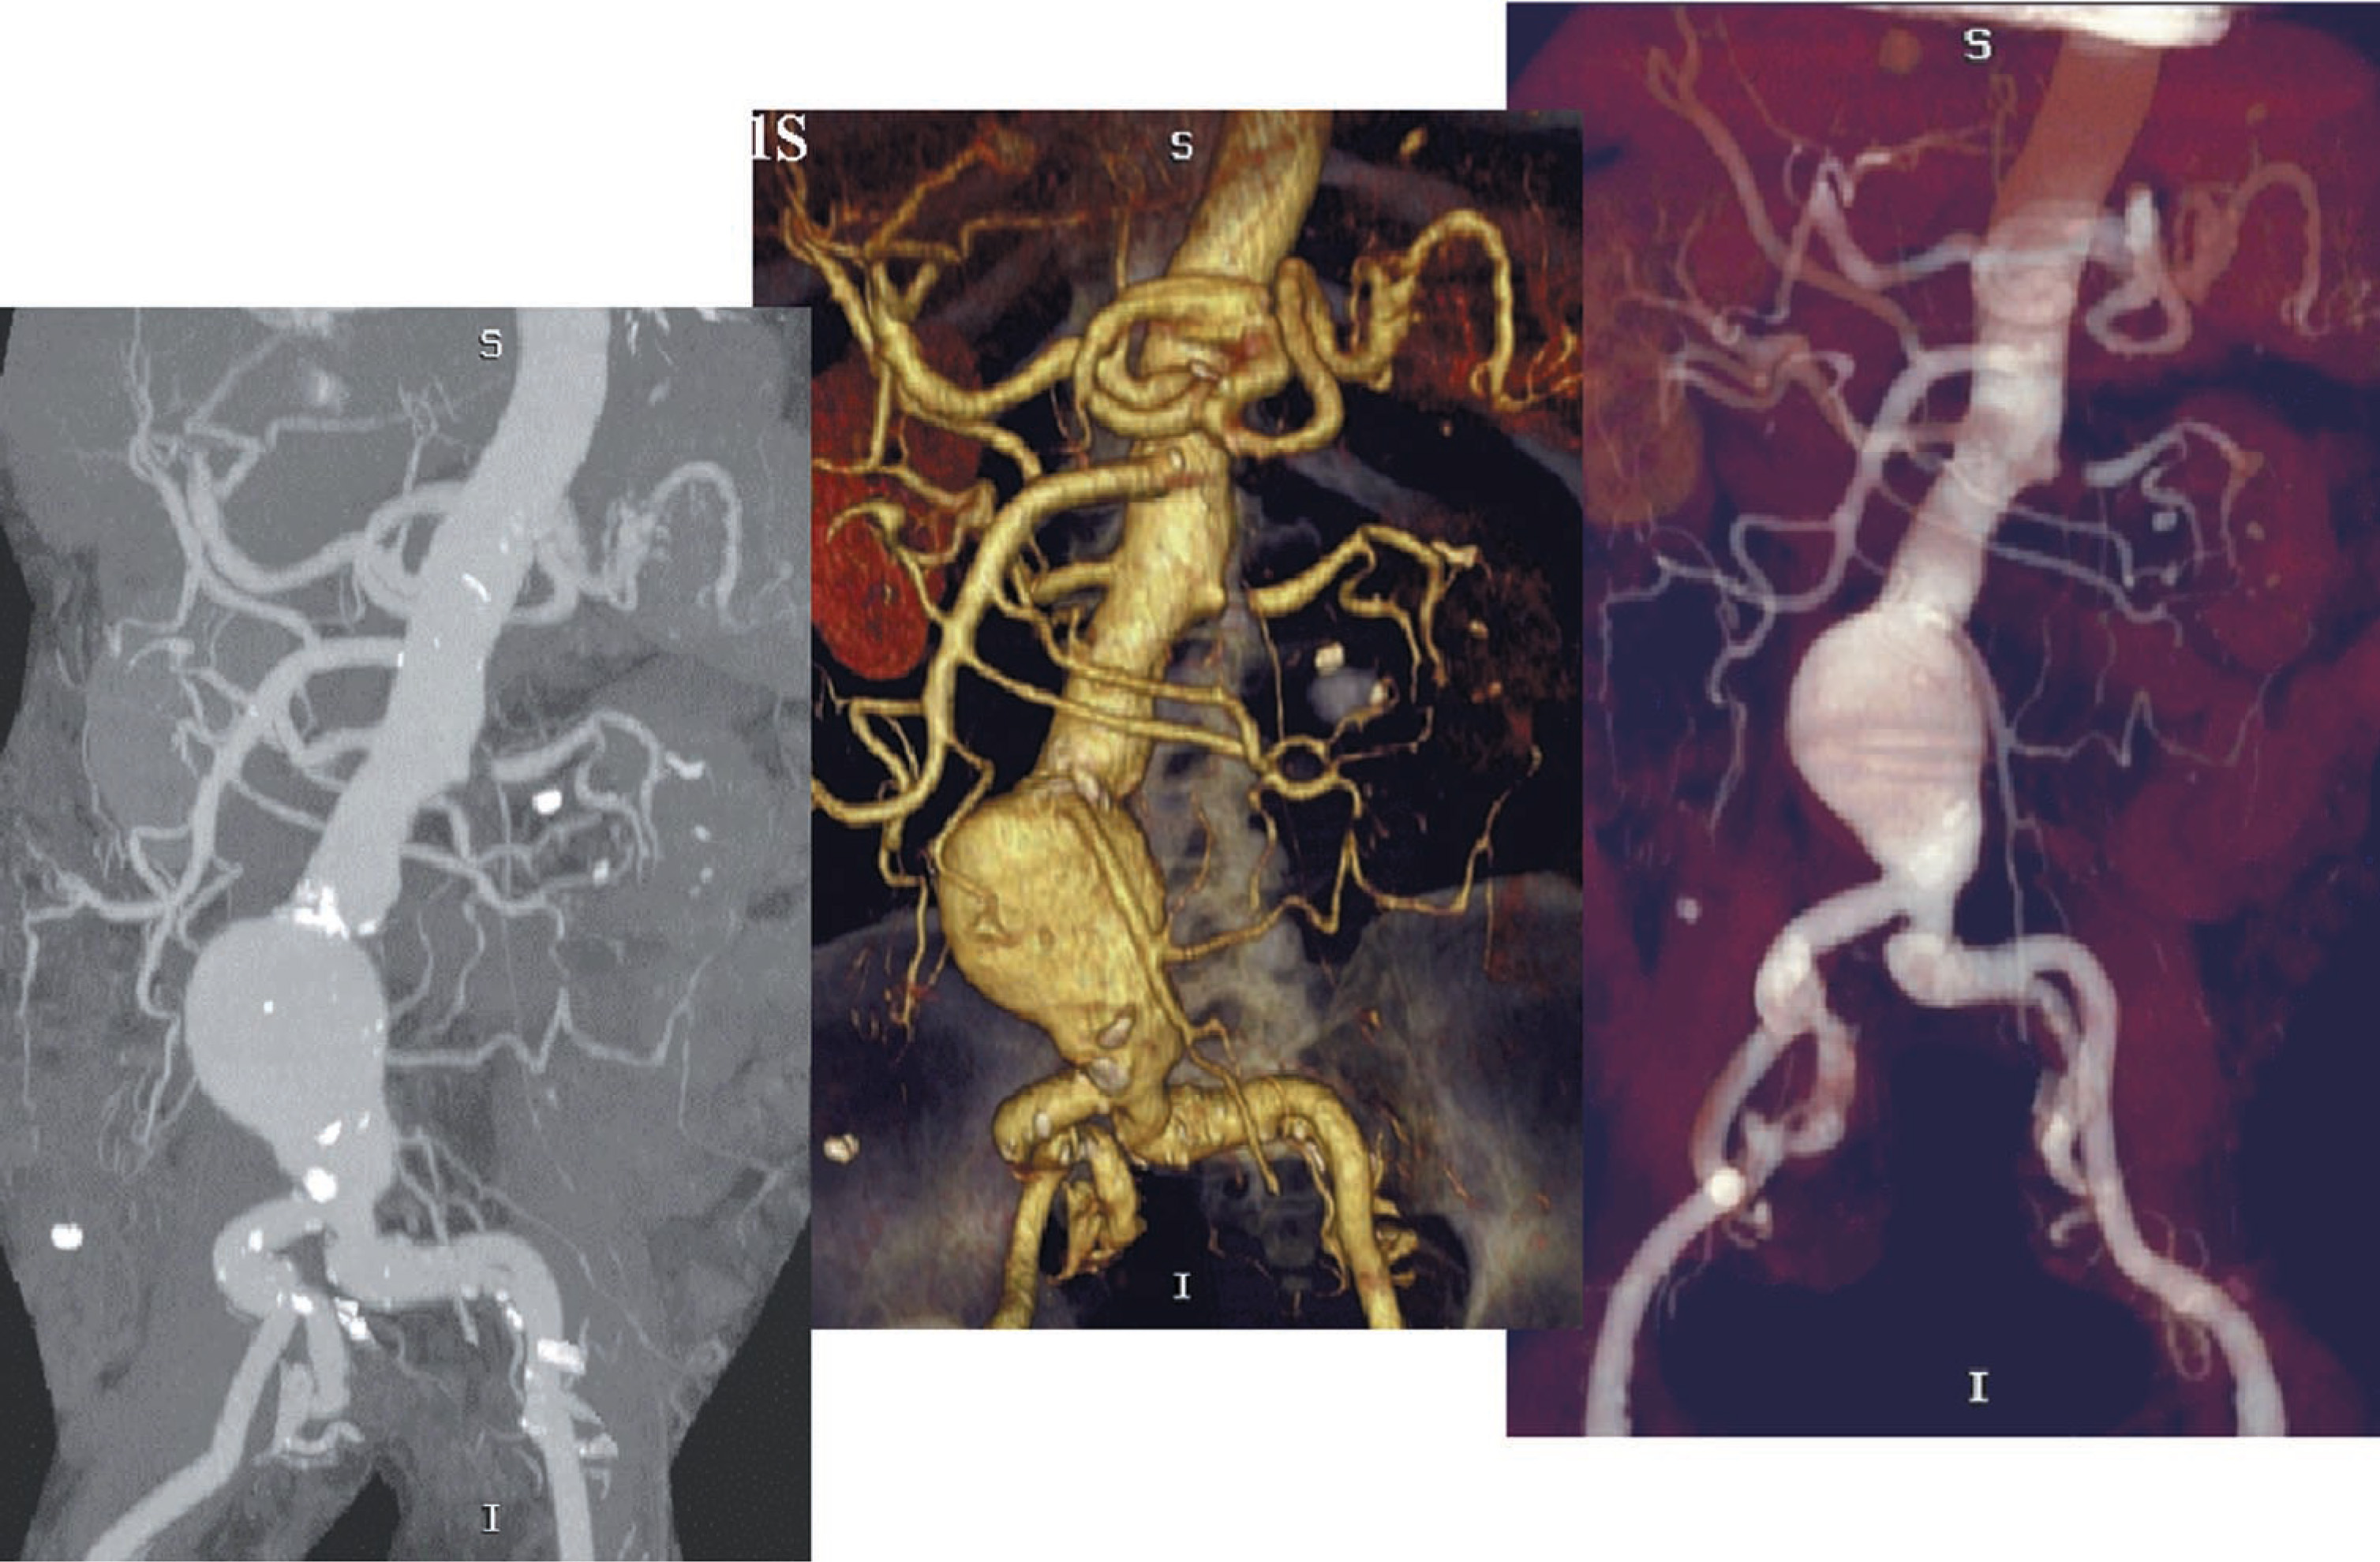
FIGURE 21.
FIGURE 21. Maximum intensity projection (left), partially transparent volume rendering (right), and combination of bone and vascular volume rendering (center) of computed tomography angiography-depicted left renal artery stenosis. Automated bone segmentation algorithms augment bone removal and replacement enhancing display. A combination of rendering techniques is often employed to best demonstrate the features of a lesion.

Conclusion

Utilization of advanced rendering techniques can overcome many of the limitations of traditional, full-volume MIP techniques. Enriching the display of MRA (and CTA) improves clinical acceptance and increases utilization. Employed appropriately, with awareness of their strengths and weaknesses, advanced rendering techniques can improve quality and accuracy.  AR

References

  1. Napel S, Rubin G, Jeffrey R. STS-MIP: A new reconstruction technique for CT of the chest.. J Comput Assist Tomogr. 1993;17:832-838.
  2. Remy-Jardin M, Bonnel F, Mason P, Remy J. Reconstruction techniques in spiral CT angiography.. J Radiol.. 1999:988-997.
  3. Huber A, Matzko M, Wintersperger B, Reiser M. Reconstruction methods in postprocessing of CT- and MR-angiography of the aorta.. Radiologe.. 2001;41:689-694.
  4. Verhoek G, Costello P, Khoo E. Carotid bifurcation CT angiography: Assessment of interactive volume rendering.. J Comput Assist Tomogr.. 1999;3:590-596.
  5. Tsuchiya K, Katase S, Yoshino A. Preliminary evaluation of volume rendered three-dimensional display of time-of-flight angiography in the diagnosis of intracranial aneurysms.. Neuroradiology. 2001;43:633-636.

Citation

Tanenbaum LN. Advanced MRA rendering techniques: A pictorial review. Applied Radiology. 2002;31(5):18-28. doi:10.37549/AR1094.