Advances in high-field MR imaging of the spine
Applied Radiology — Vol. 38 , Issue 6 , pp. 18 -27
DOI: 10.37549/AR1701
Published: June 1, 2009
Categories
Magnetic resonance imaging (MRI) of the spine is currently one of the most frequently requested MR examinations. The demand for this exam will probably increase with the advancing age of the patient population coupled with the prevalence of degenerative spine disease and lower back pain. There is a great need, therefore, to optimize imaging protocols and to minimize imaging time, while obtaining clinically relevant information.
The traditional approach to spinal MRI has relied upon imaging in both axial and sagittal planes to adequately evaluate the central canal and neural foramina. Application of 3-dimensional imaging with multiplanar reconstruction could obviate the need for obtaining images in 2 planes, decreasing the examination time and associated patient discomfort and motion artifact.1 This article reviews several advances in image acquisition and processing, combined with the clinical introduction of 3 Tesla (3T) magnets, which permit the application of 3-dimensional spinal MRIfor routine clinical practice.
Two different approaches to 3-dimensional imaging of the spine are gradient echo (GRE)-based and fast spin echo (FSE)-based imaging.1 Previous attempts at 3-dimensional spinal imaging had been unsuccessful: GRE-based imaging was susceptibile to artifacts and had inadequate delineation of spinal cord abnormalities;2,3 FSE-based imaging had relatively long imaging times.4 The inherent sensitivity of GRE sequences to susceptibility artifact is further exacerbated at 3T field strength, rendering this technique of limited value in spine imaging at high field strengths. Therefore, FSE-based imaging remains the most promising approach for obtaining clinically relevant volumetric imaging.
In the past, clinical application of FSE-based 3-dimensional imaging was limited by long acquisition times. Cerebrospinal fluid (CSF) pulsation artifacts were also problematic, resulting in CSF heterogeneity.
Initial solutions to the long acquisition times for 3-dimensional FSE imaging focused on obtaining more echoes per magnetization pulse (i.e., increasing the echo train length, ETL) and reducing the time between successive magnetization pulses (decreasing repetition time, TR).4,5 However, decreasing the TR lowers the time for protons to regain their longitudinal magnetization, resulting in a lower steady-state value of longitudinal magnetization and decreased signal. The new steady-state value of magnetization depends on the efficiency of the proton to give up its energy (characterized by the T1 relaxation time). Consequently, CSF will demonstrate relative signal loss compared with the spinal cord because of its longer T1 with the end result being a loss of “myelographic effect.” Additionally, increasing the ETL amplifies the inherent blurring of FSE MR imaging related to T2 decay-induced modulation in the amplitude of the echo within k-space.1,6 Another way of reducing long acquisition times is to decrease the phase-encoding steps; however, this would result in decreased spatial resolution if other parameters, such as the field-of-view, are not changed.
The following will provide a brief overview of new imaging solutions including driven equilibrium, SPACE (Sampling Perfection with Application optimized Contrasts using flip-angle Evolutions) readout and parallel imaging which have, in part, remedied the problems ofdecreased CSF signal; increased blurring and decreased spatial resolution related to decreased TR; and, increased the ETL and decreased the number of phase-encoding steps, respectively (Table 1). These new imaging solutions combined with relatively increased signal-to-noise at 3T, compared with 1.5T, now permit clinically relevant 3-dimensional volumetric FSE imaging of the spine.
Driven equilibrium
Driven equilibrium pulse is a novel approach to the decreased CSF signal associated with imaging with a shorter TR.7 This technique involves the application of a resonant 90 degree radiofrequency (RF) pulse at the time when the transverse magnetization is refocused by the last 180 degree RF pulse. The residual transverse magnetization, which is relatively high in the case of CSF and characterized by its long T2 relaxation time, is converted to longitudinal magnetization (Figure 1).
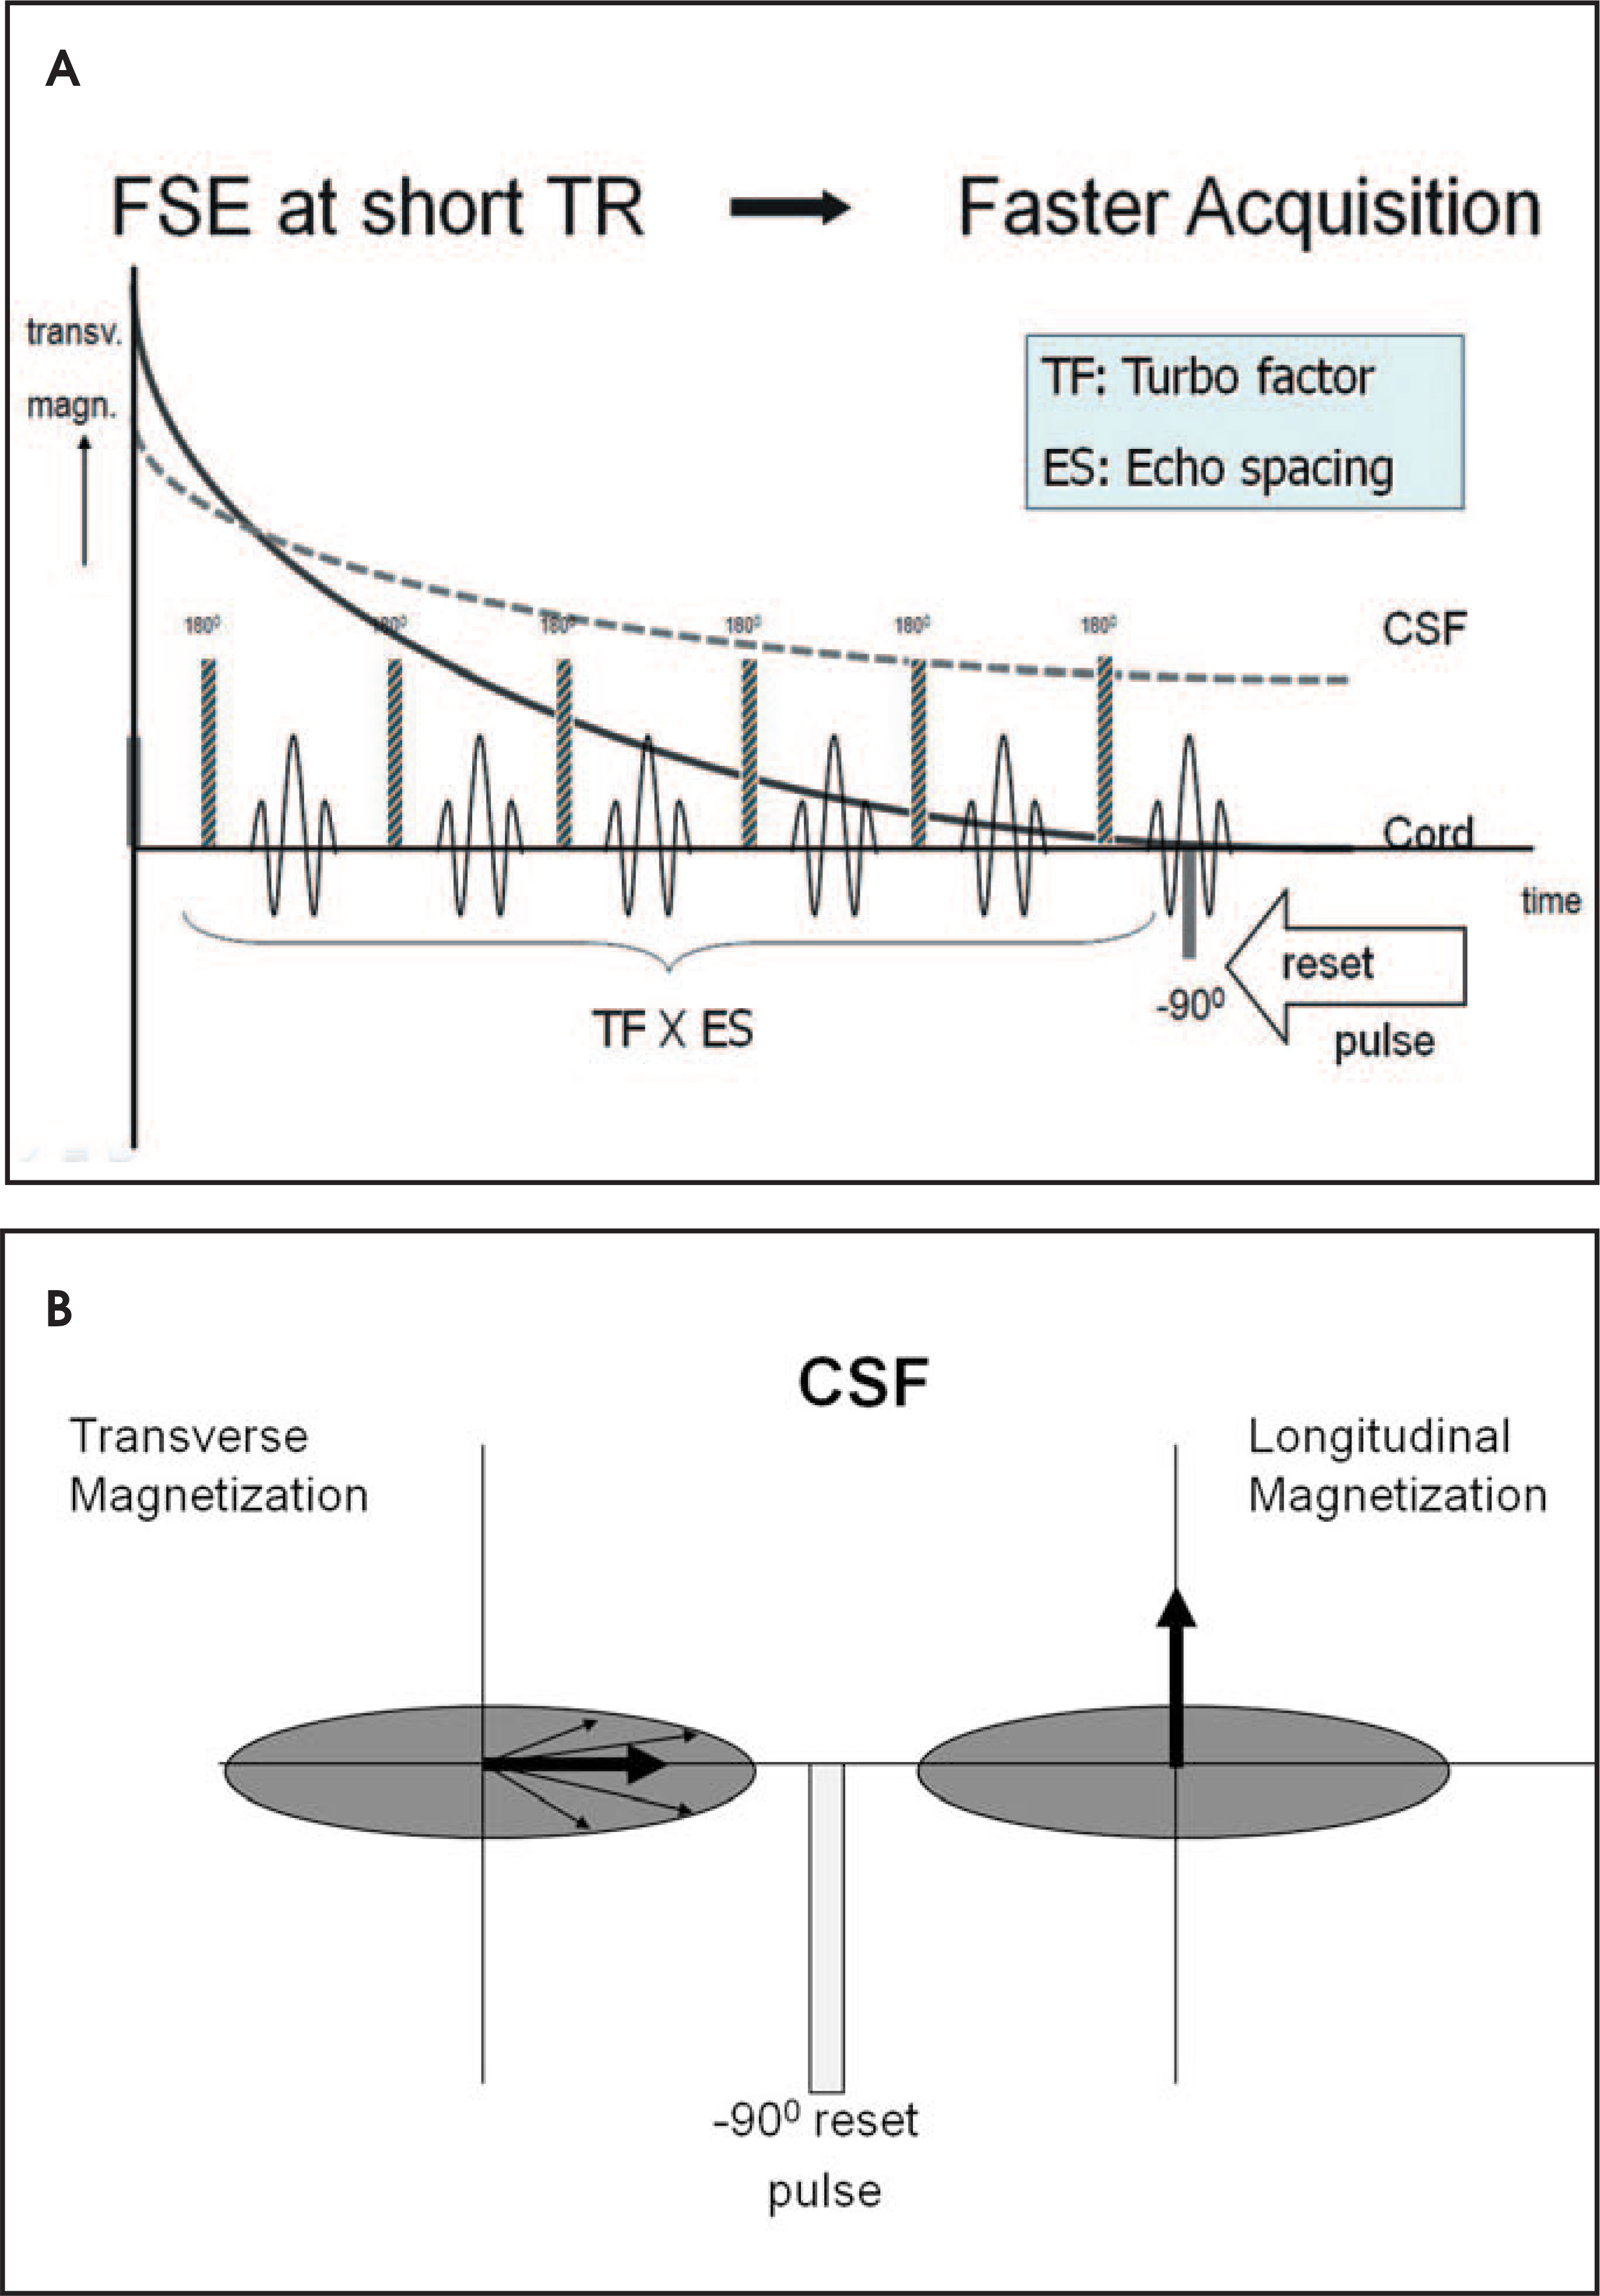
This pulse-induced artificial recovery of longitudinal magnetization effectively compensates for the relative loss of CSF signal associated with shorter TR and restores the myelographic effect. Ultimately, the combination of a traditional FSE technique and driven equilibrium pulse results in faster imaging by eliminating the need for long TR while maintaining relative CSF signal.
The driven equilibrium pulse is critical at higher field strength and increasing ETL, as T1 relaxation time prolongs with increasing fieldstrength (it is approximately 15% to 20% greater at 3T vs. 1.5T) and recovery of longitudinal magnetization is halted by every refocusing 180 degree RF pulse. Therefore, relying on the natural recovery of the longitudinal magnetization in order to maintain the myelographic effect would require significantly prolonged TR and thus an increase of the imaging time.8
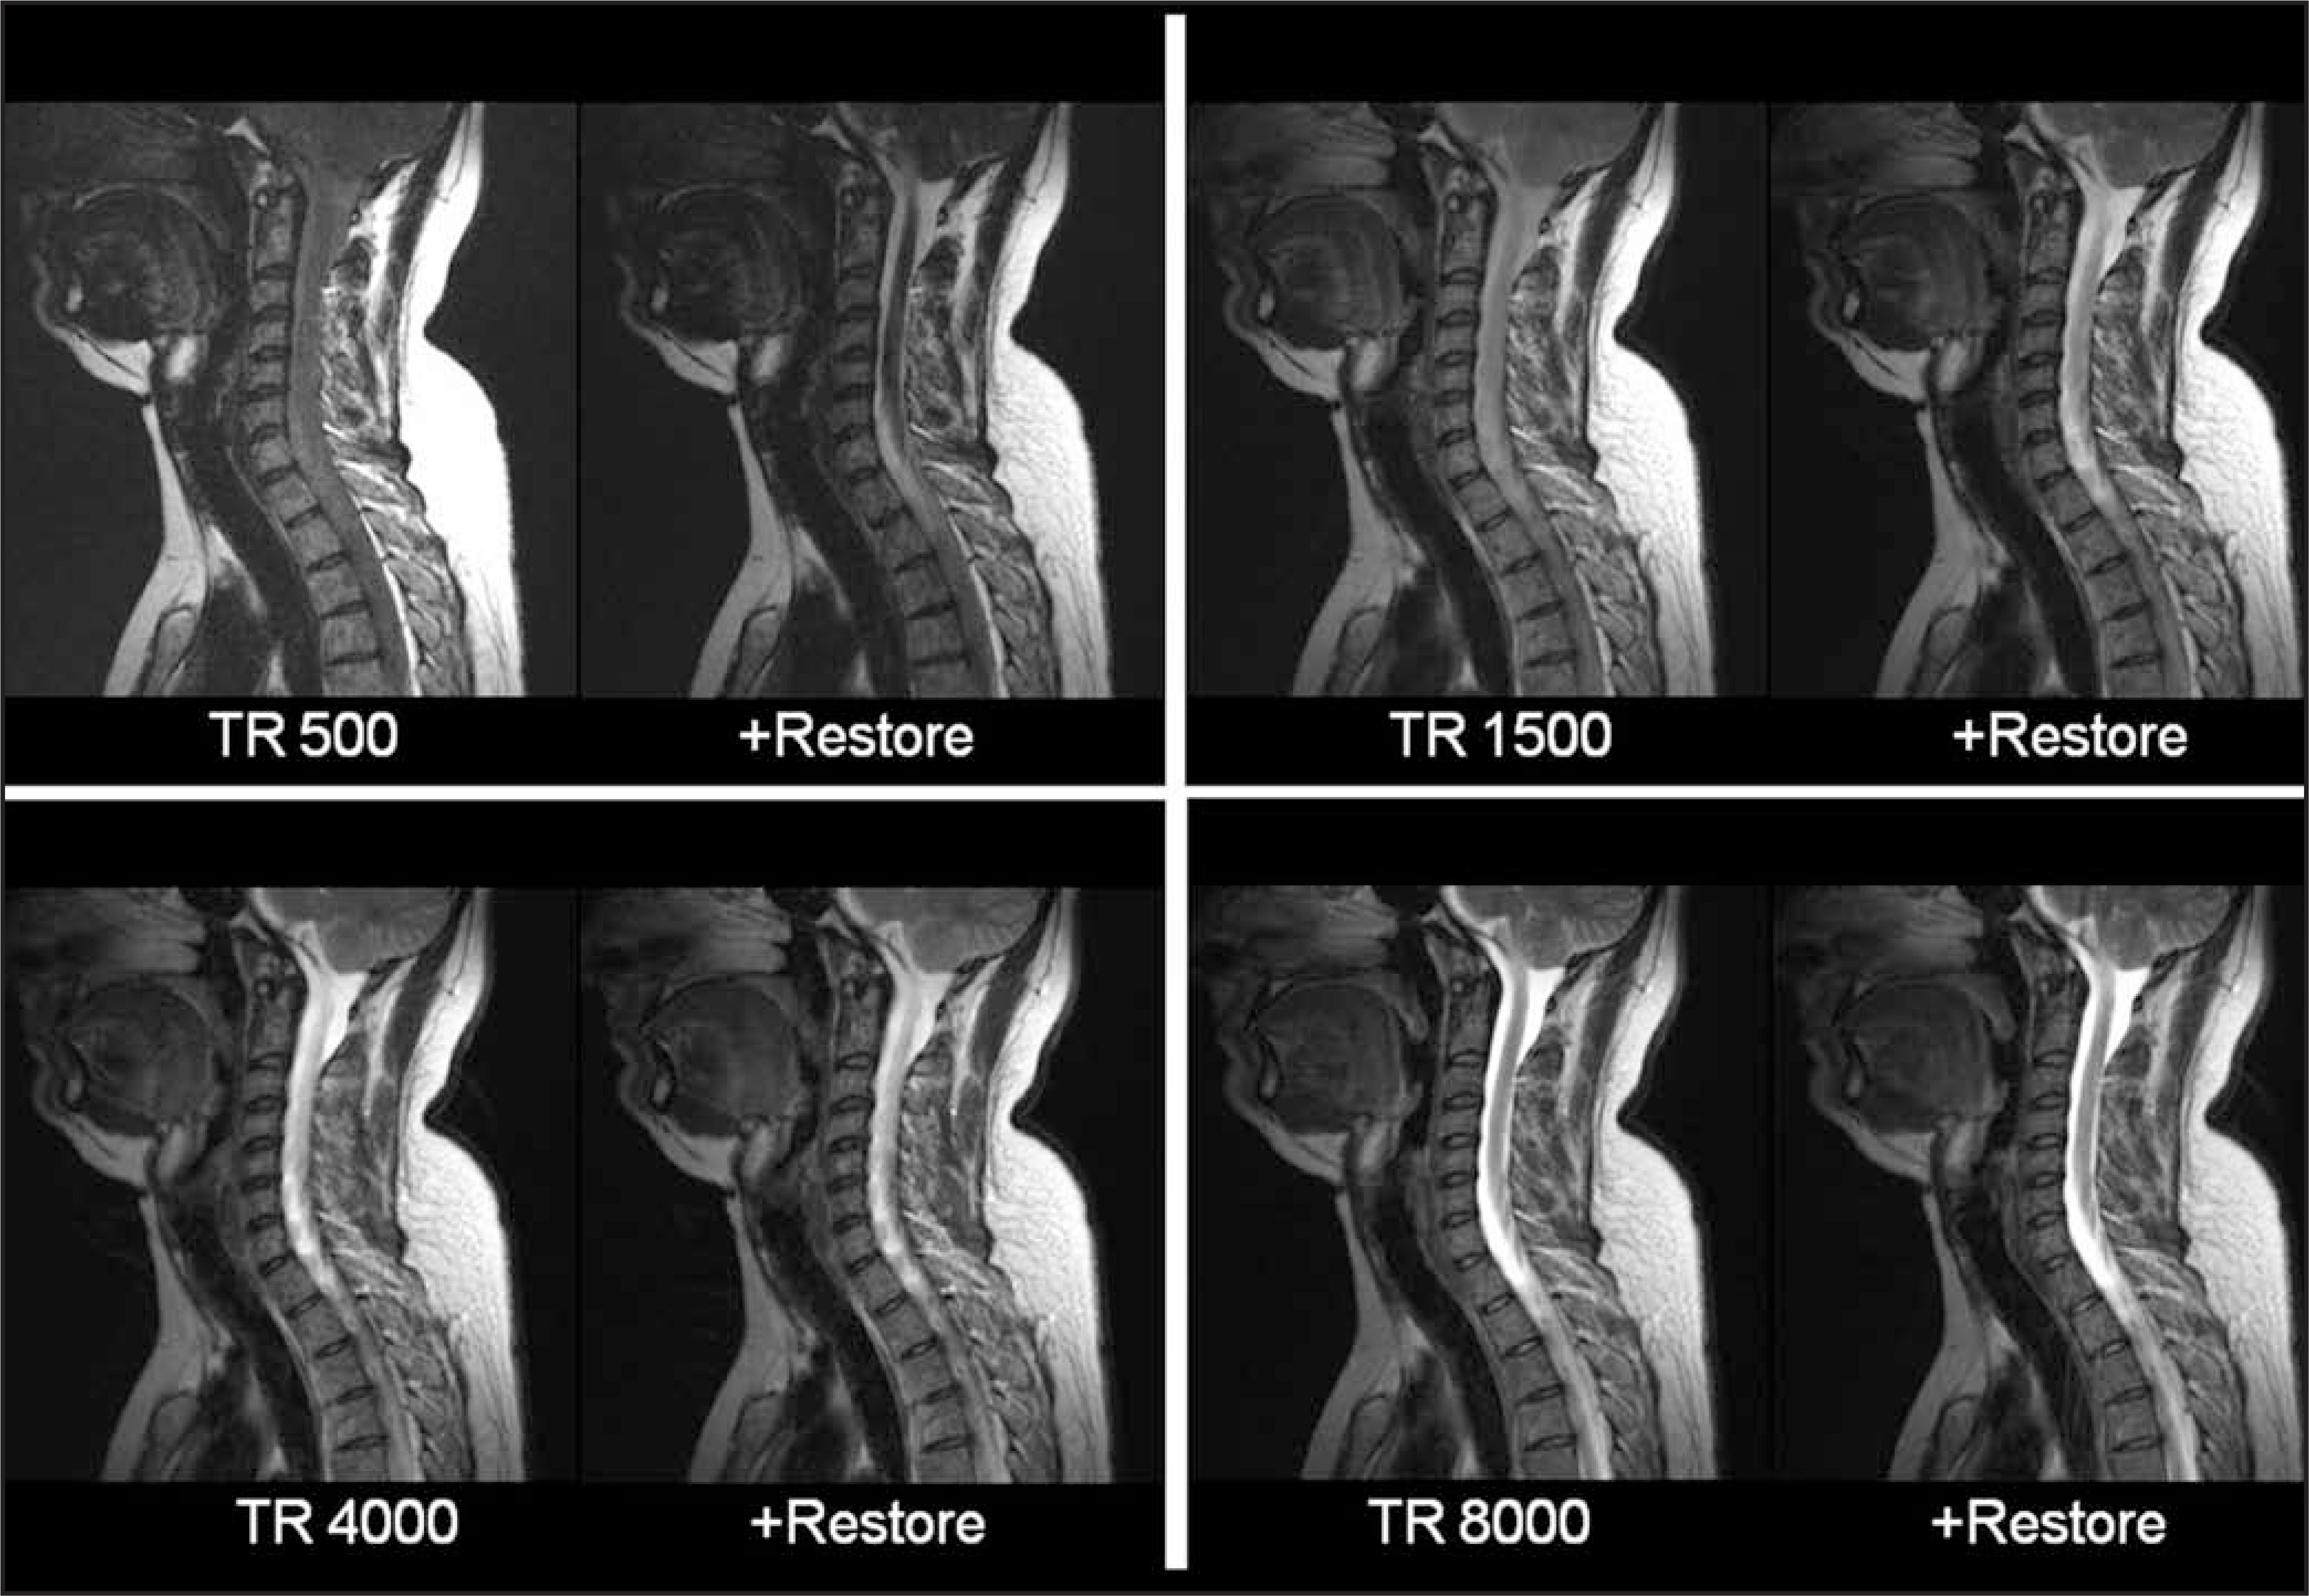
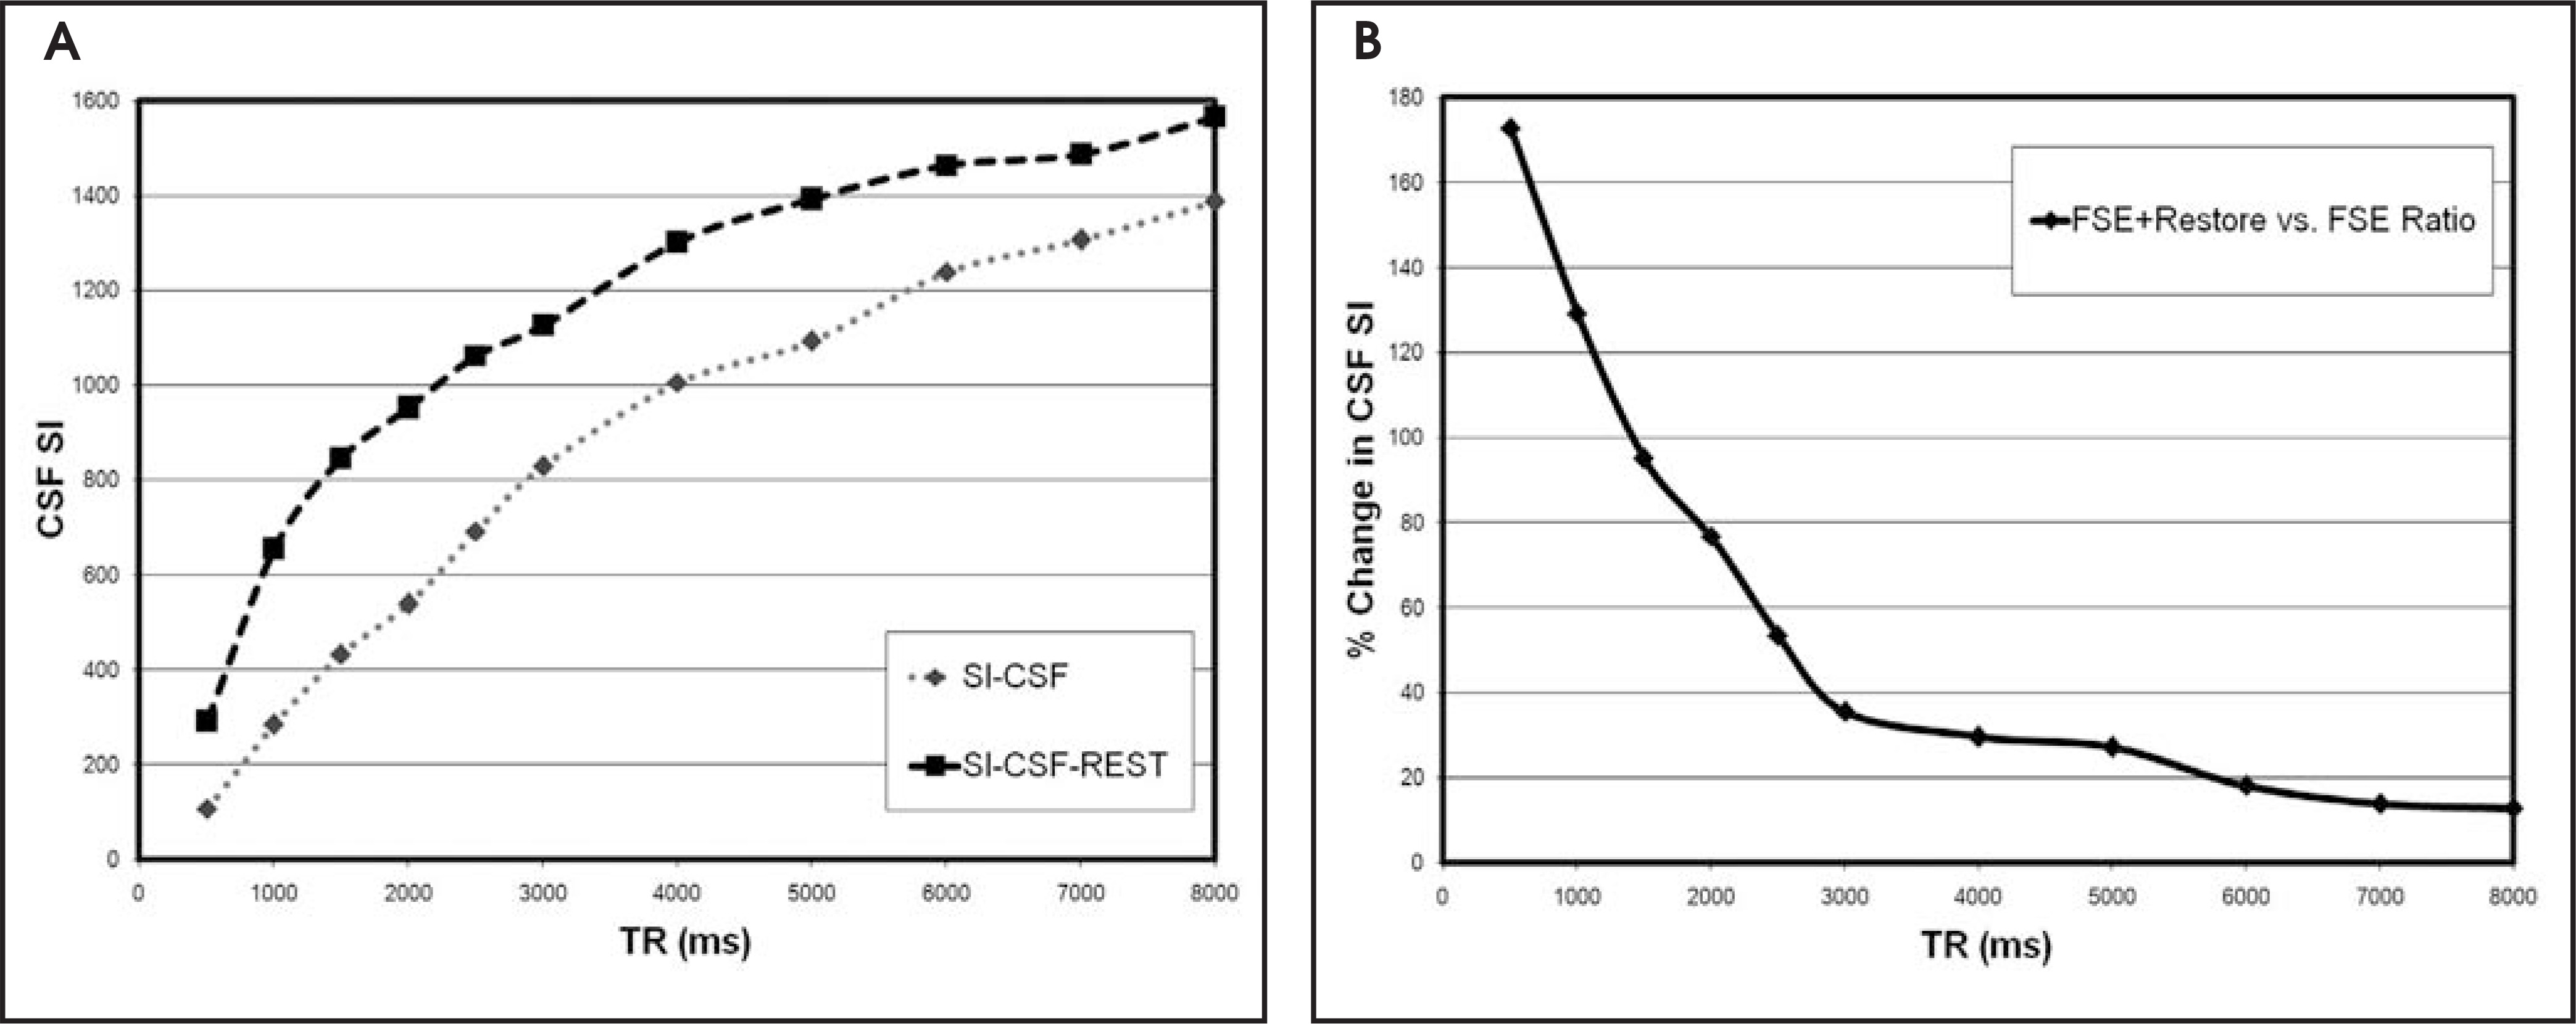
Experiments conducted at 3T comparing traditional FSE with FSE/driven equilibrium (RESTORE, Siemens Healthcare, Malvern, PA) demonstrate the impact of this pulse sequence on myelographic effect at various TR values (Figure 2). As expected, the driven equilibrium pulse results in higher CSF signal intensity compared with traditional FSE throughout the range of clinically relevant TR values (Figure 3A). There is a dramatic increase in the relative CSF signal intensity with decreasing TR values, particularly at the lowerTR values (Figure 3B), which would be used in 3-dimensional FSE imaging.
For example, clinically relevant images of the cervical spine can be obtained by combining 3-dimensional FSE and driven equilibrium imaging of the cervical spine utilizing a single sagittal 3-dimensional FSE slab with 70 partitions. By reducing the TR to 210 ms,a 1 mm3isotropic voxel size can be achieved in a total imaging time of 2:40 min. (Figure 4).8
It is important, however, to keep in mind that images obtained with driven equilibrium pulse are not equivalent to standard T2-weighted images. While driven equilibrium is able to restore the myelographic effect of a standard T2 sequence by augmenting CSF signal, its ability to depict intrinsic cord lesions with prolonged T2 relaxation is diminished, particularly at low TR. Preliminary work suggests that application of longer TR when assessing intrinsic cord lesions on the order of 2000 ms would yield adequate contrast to allow for detection and characterization of more subtle cord lesions.
SPACE readout
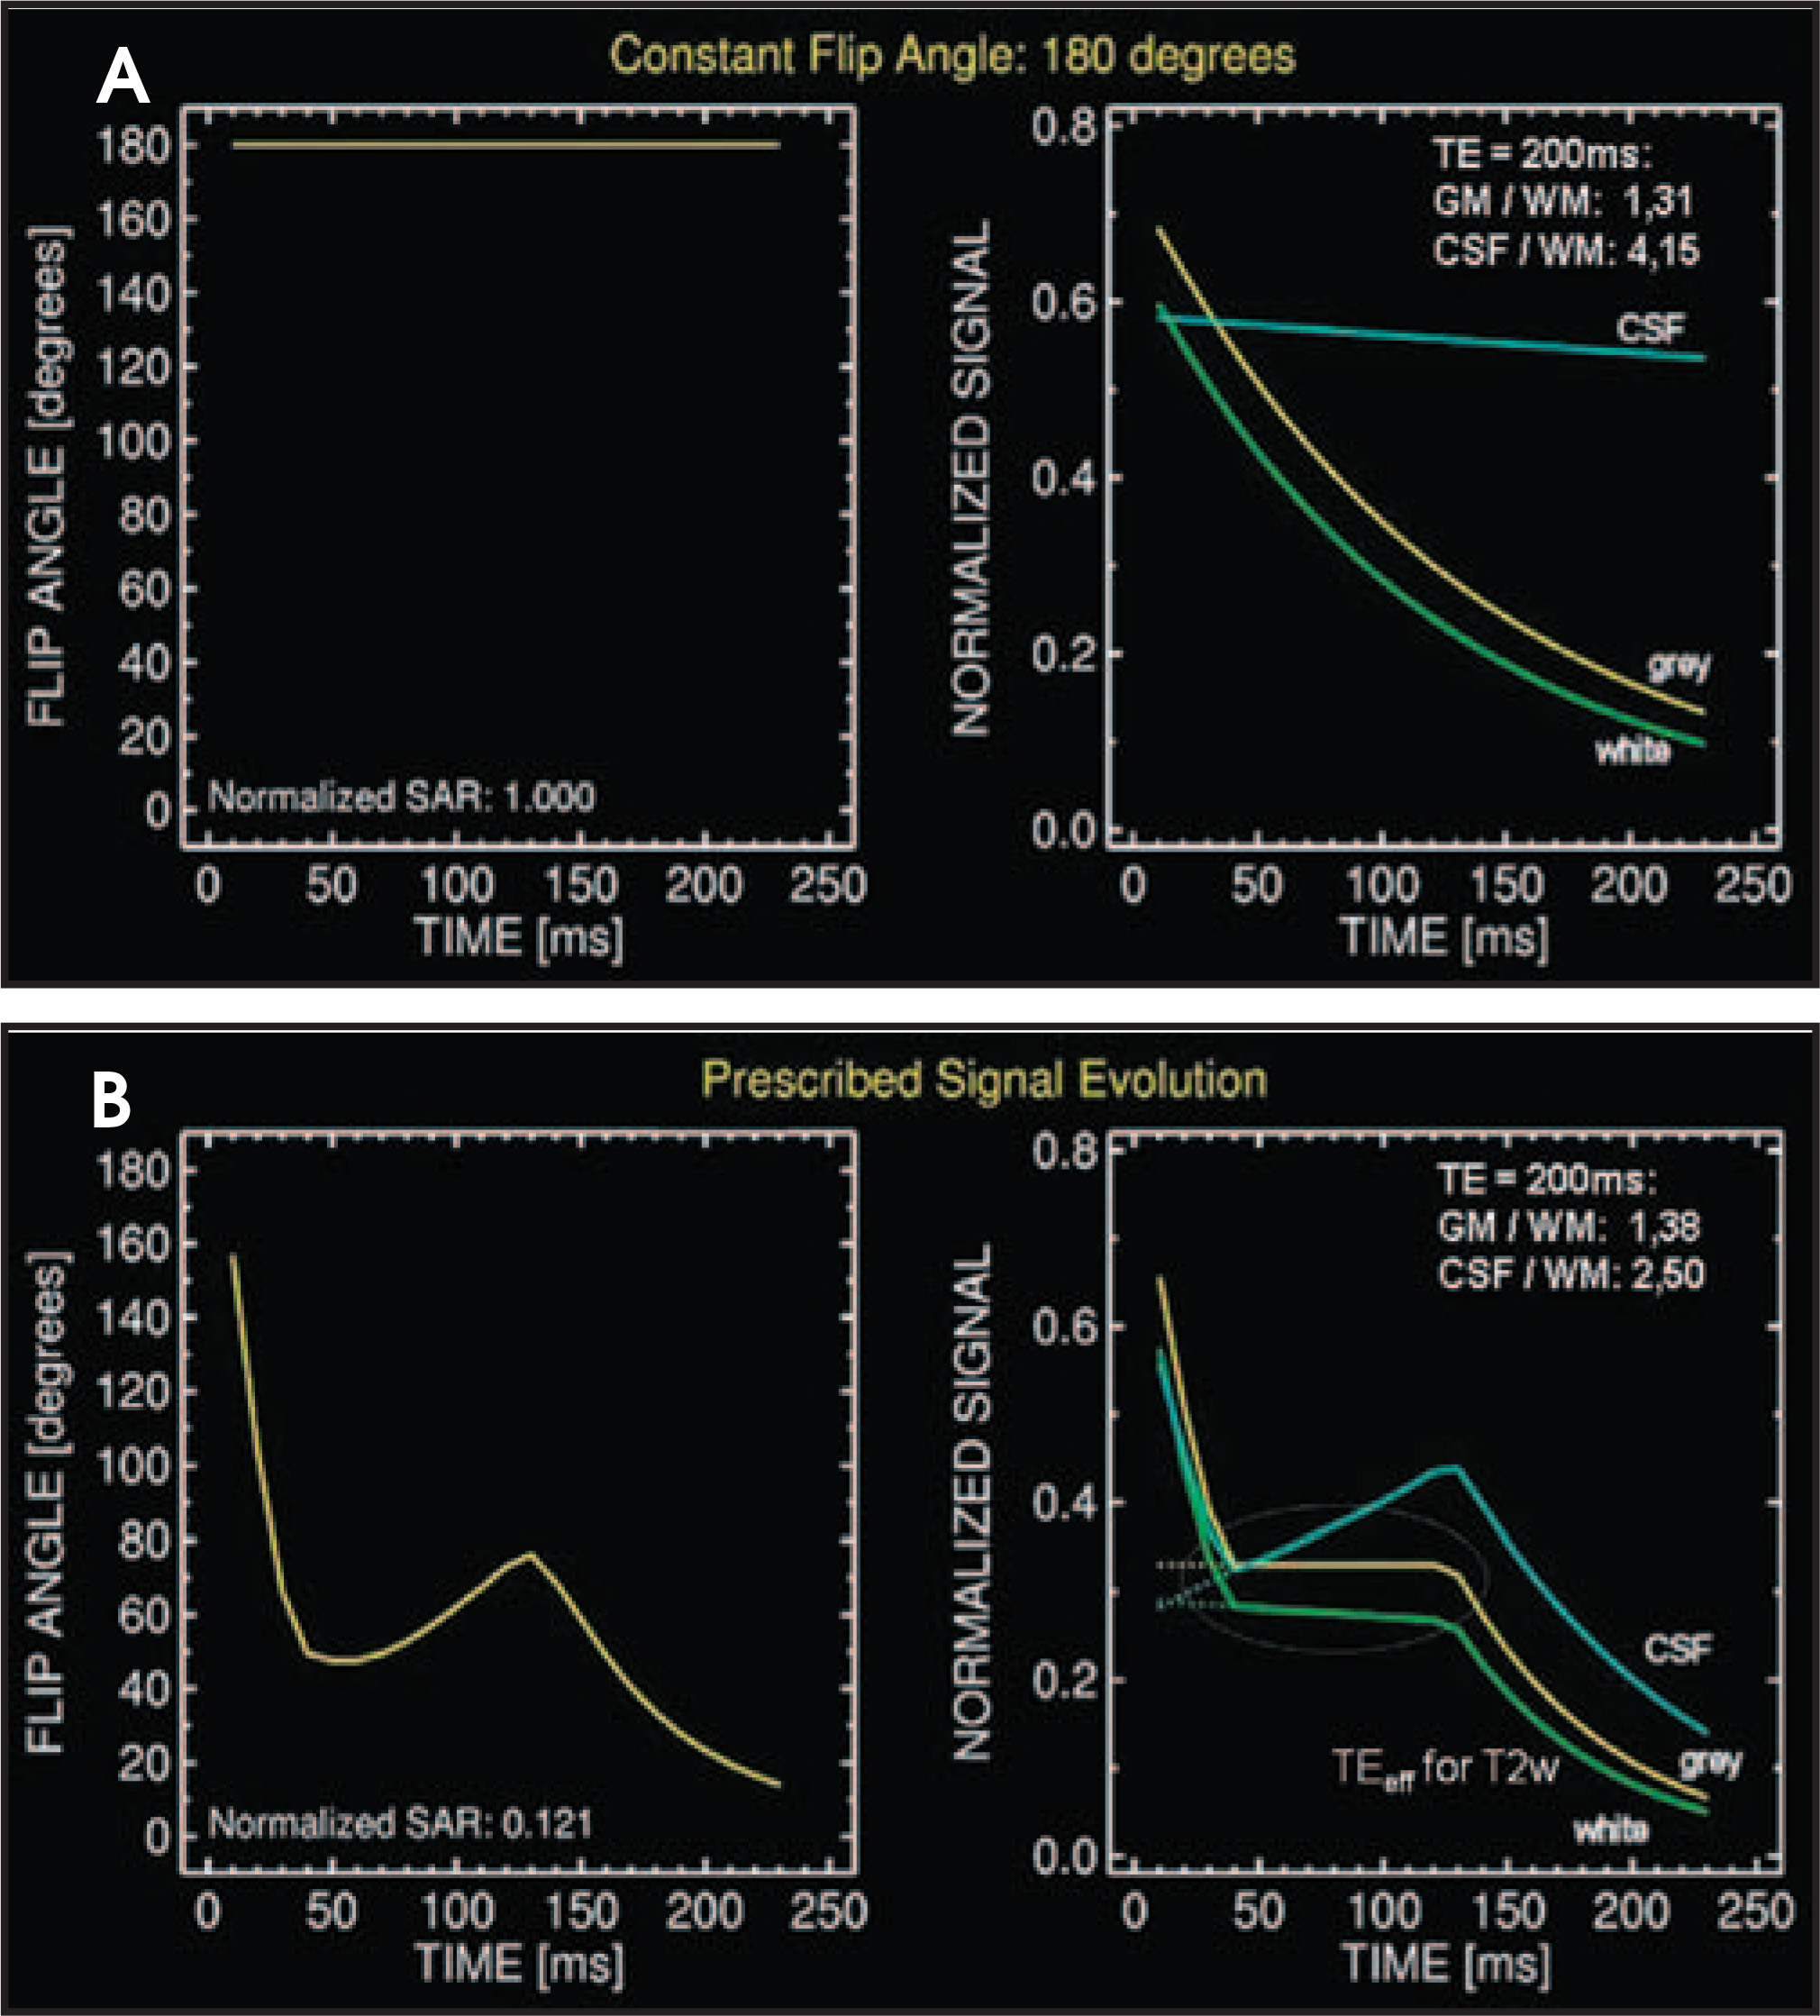
Another critical component of clinically viable imaging is the application of SPACE readout.9 This modification of FSE involves applying variable flip-angle RF pulses. The nonselective RF pulse permits ultra-short echo spacing and the variable flip angle results in a pseudo steady-state with maintained relative tissue contrast (Figure 5) as well as a reduction of blurring associated with high ETL. Anotheradvantage of SPACE readout is a reduction in specific absorption rate (SAR) as a consequence of the application of lower flip angles. This is critical at 3T, as FSE pulse sequences are inherently SAR intensive and SAR is proportional to the square of the magnetic field.Therefore, SAR becomes a limiting factor, as it quadruples with the doubling of the magnetic field and increases along with increasing ETL and decreasing TR.
Parallel imaging
Parallel imaging allows for faster image acquisition and potentially improved image quality by undersampling k-space. By using the inherent spatial sensitivity information that is present in phased-array RF receiver coils, only a fraction of phase-encoding steps need to be acquired for image construction while maintaining image contrast and spatial resolution.10,11
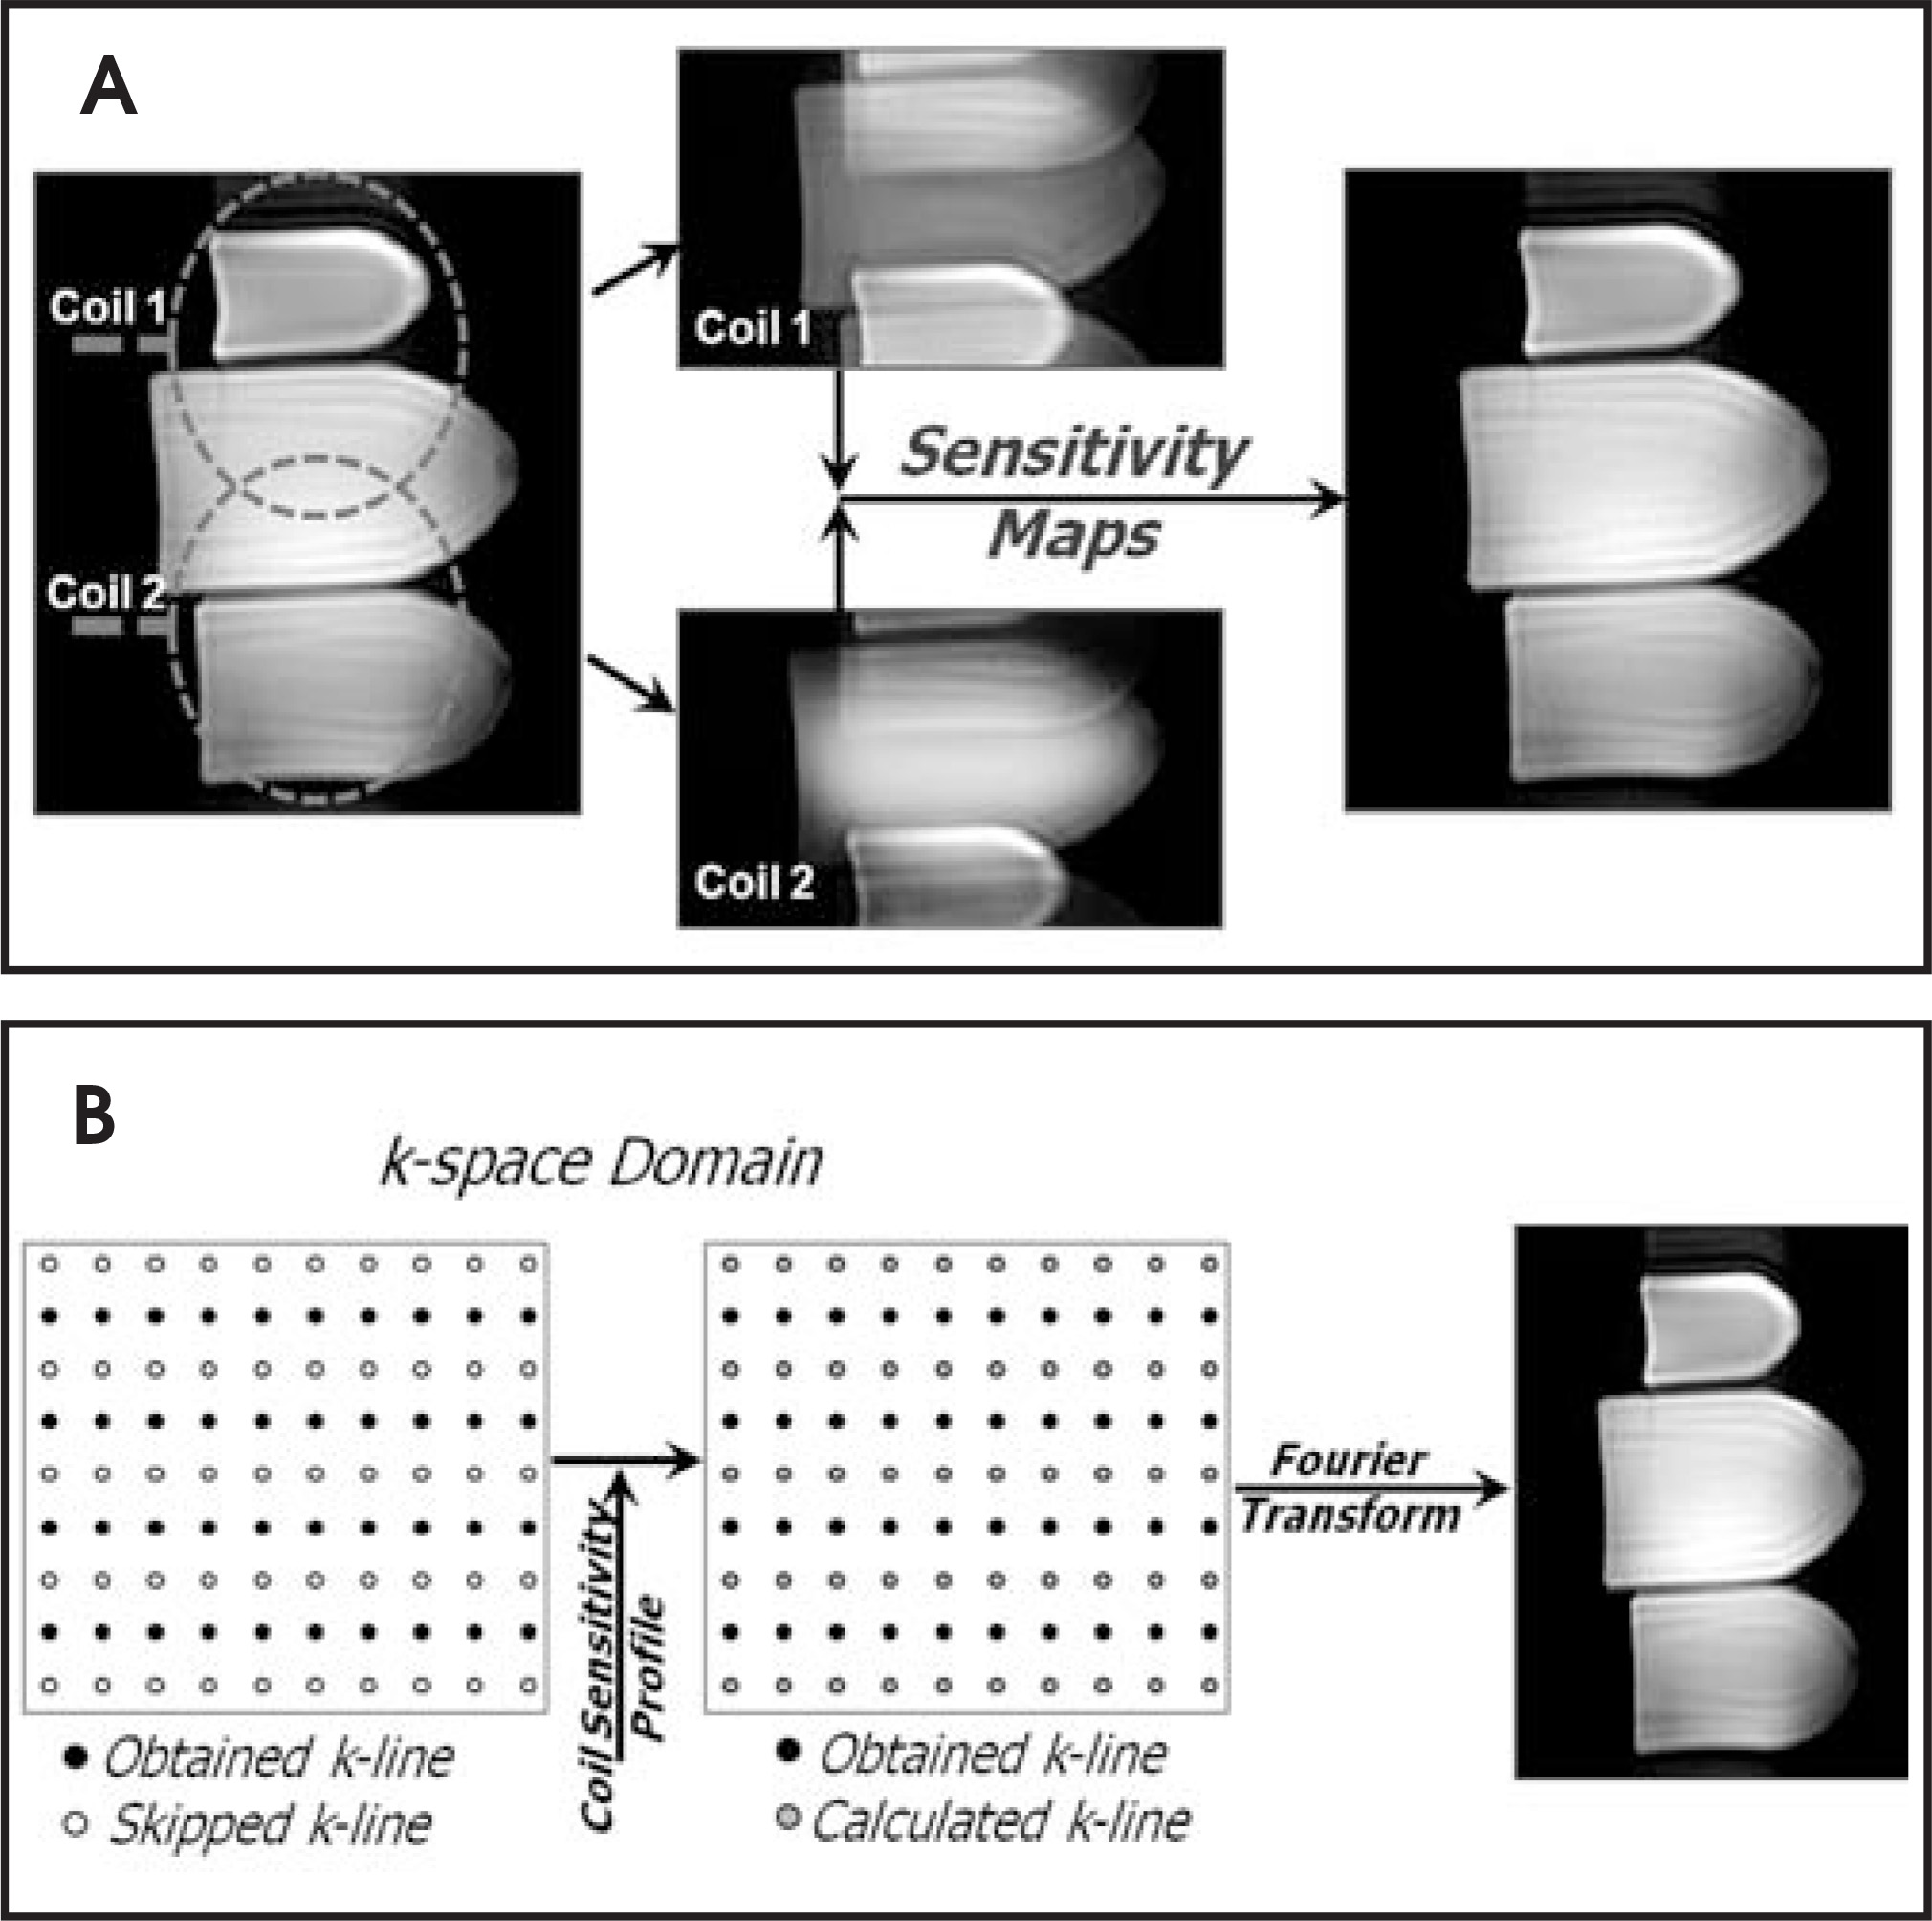
The coil sensitivity information can be obtained either through a prescan calibration during initial patient setup, resembling a low-resolution image, or through “auto calibration” by obtaining additional lines of k-space with each sequence.10,11 Subsequently, image reconstruction can be performed either in the space domain (SENSE)12 or in the spatial frequency domain with simultaneous acquisition of spatial harmonics (SMASH).13 With SENSE, images obtained from each independent receiver coil/channel are combined to unfold the final image (Figure 6A). With SMASH, information from each independent receiver coil/channel is used to calculate the missing k-space data and then to generate the final image (Figure 6B).
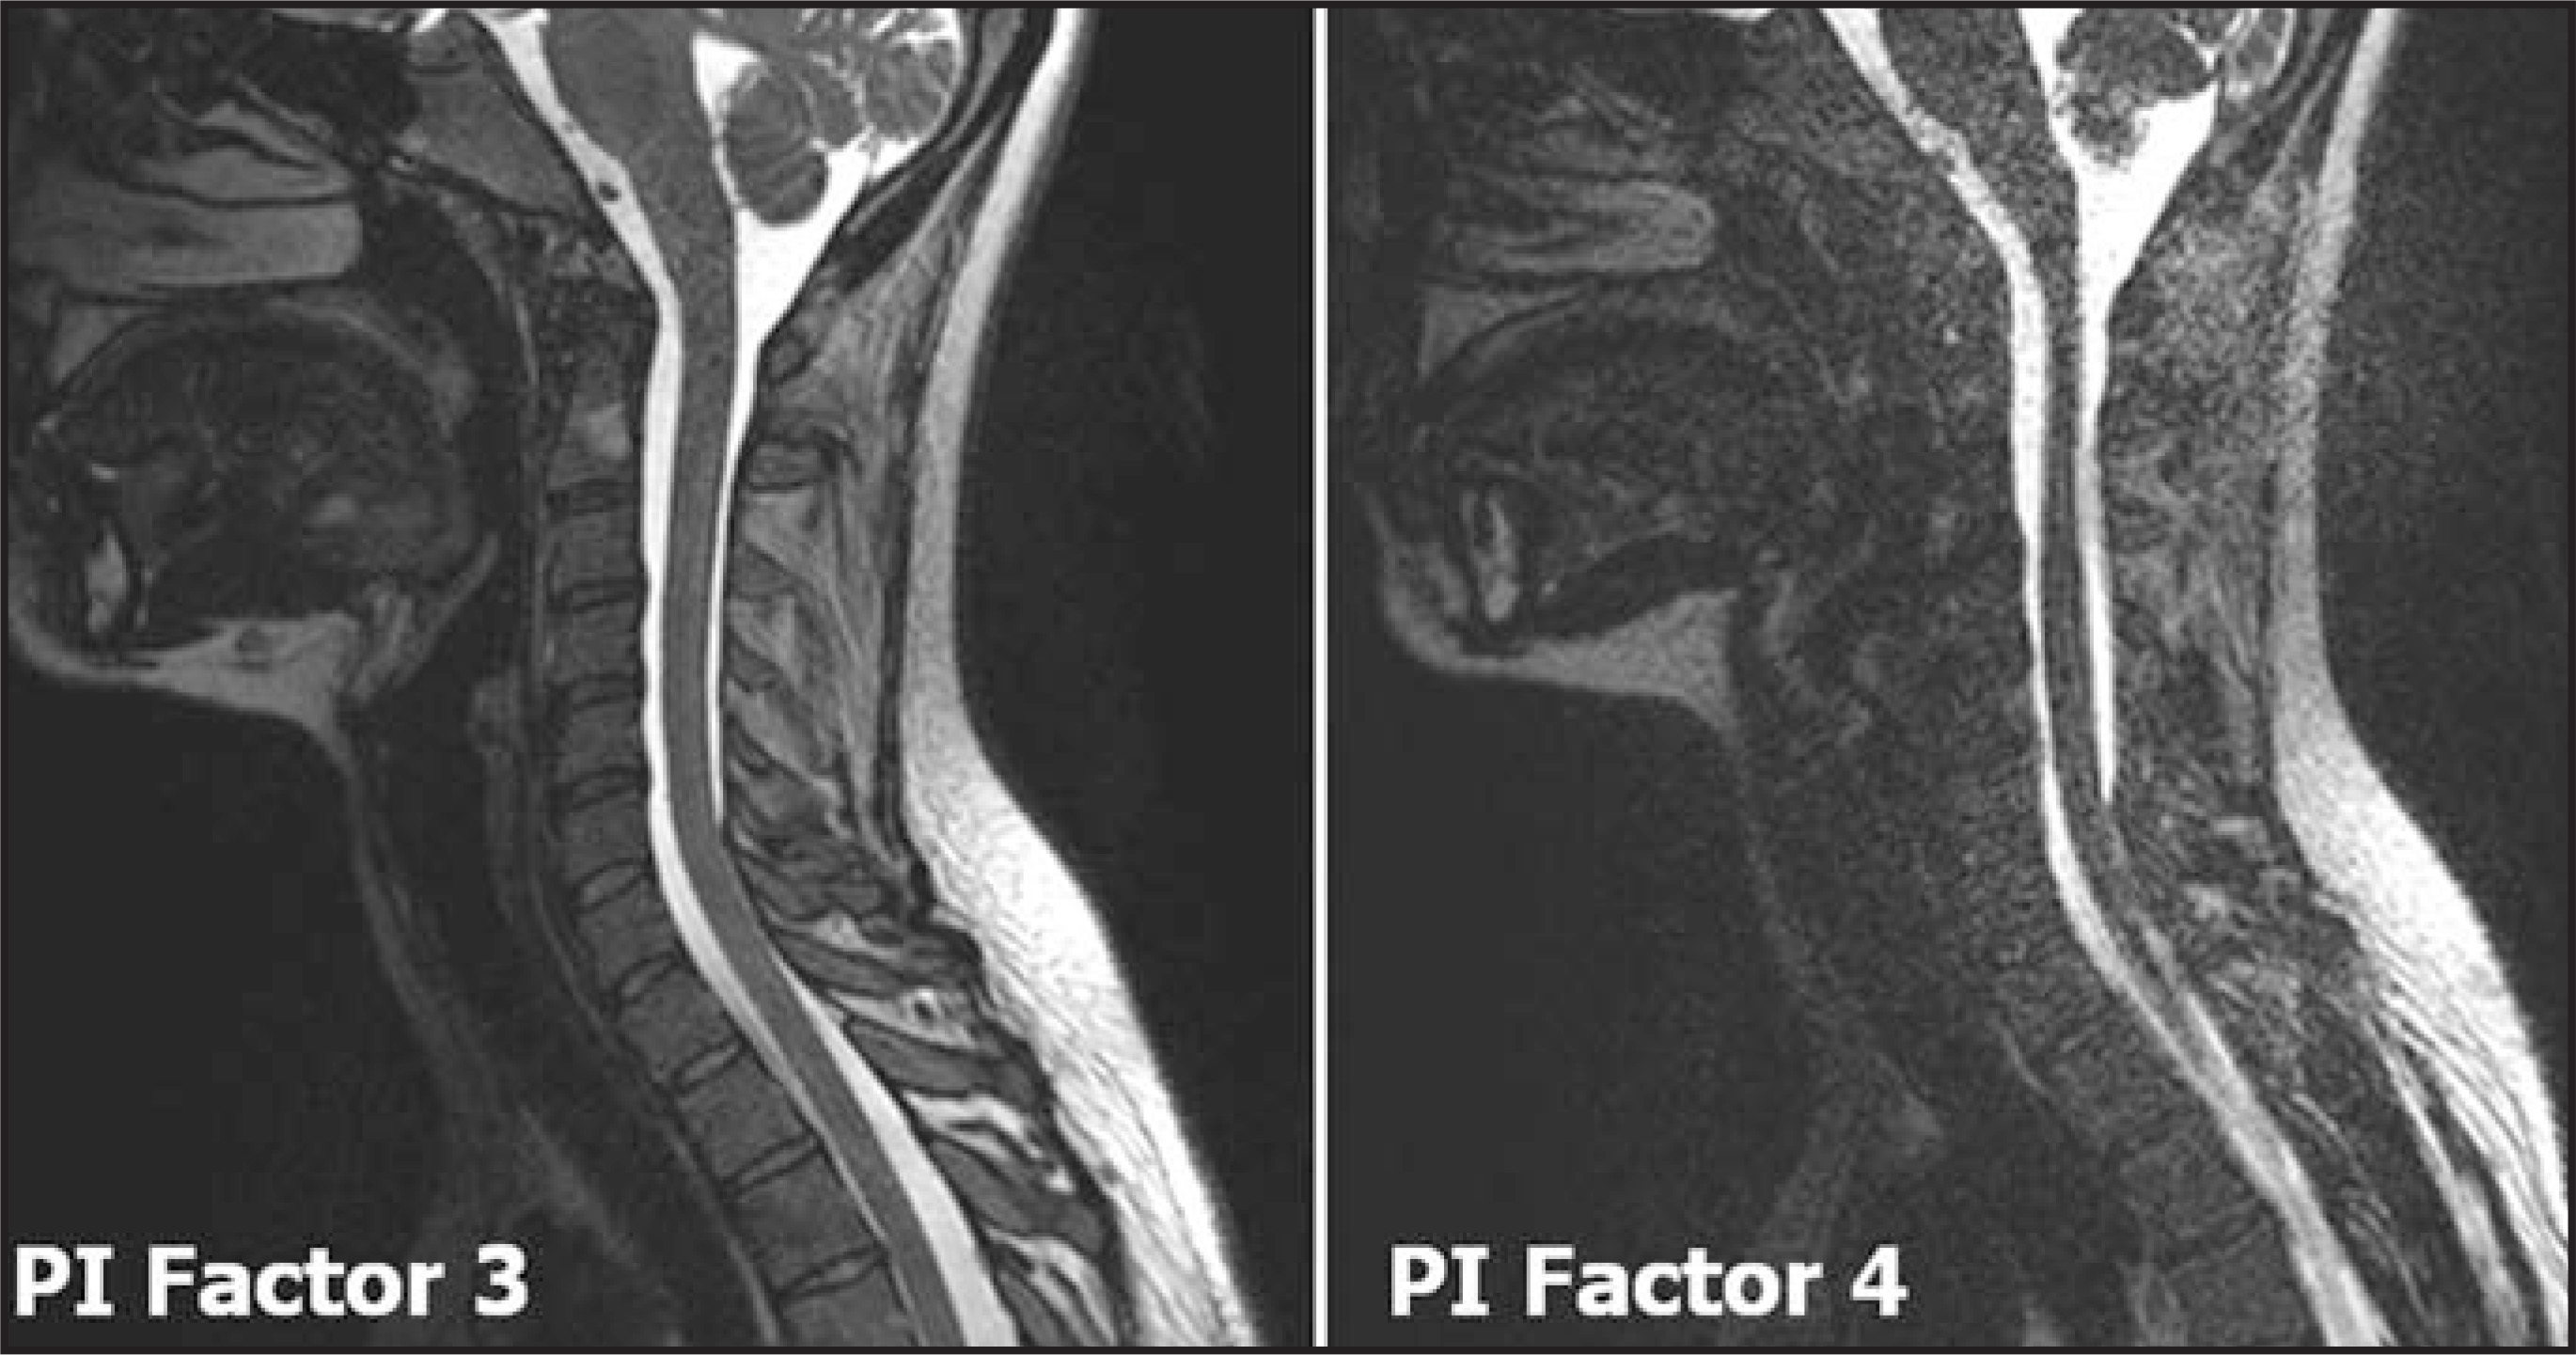
Shorter imaging times can be achieved by reducing the number of phase-encoding steps needed to generate the final image. The maximum parallel imaging factor, reflecting a reduction in imaging time, is 2 to 3 in each phase-encoding direction. The amplification of spatially dependent noise associated with the undersampling of the phase-encoding steps currently prohibits the use of a parallel imaging factor >3(Figure 7). In 3-dimensional imaging, the phase-encoding steps can be reduced in 2 spatial dimensions allowing for a maximum parallel imaging factor of 6 to 9.10
The increased signal-to-noise ratio at 3T14 partially counterbalances the reduction in signal-to-noise ratio associated with higher parallel imaging factors which would not be otherwise practical at 1.5T.15
Clinical application
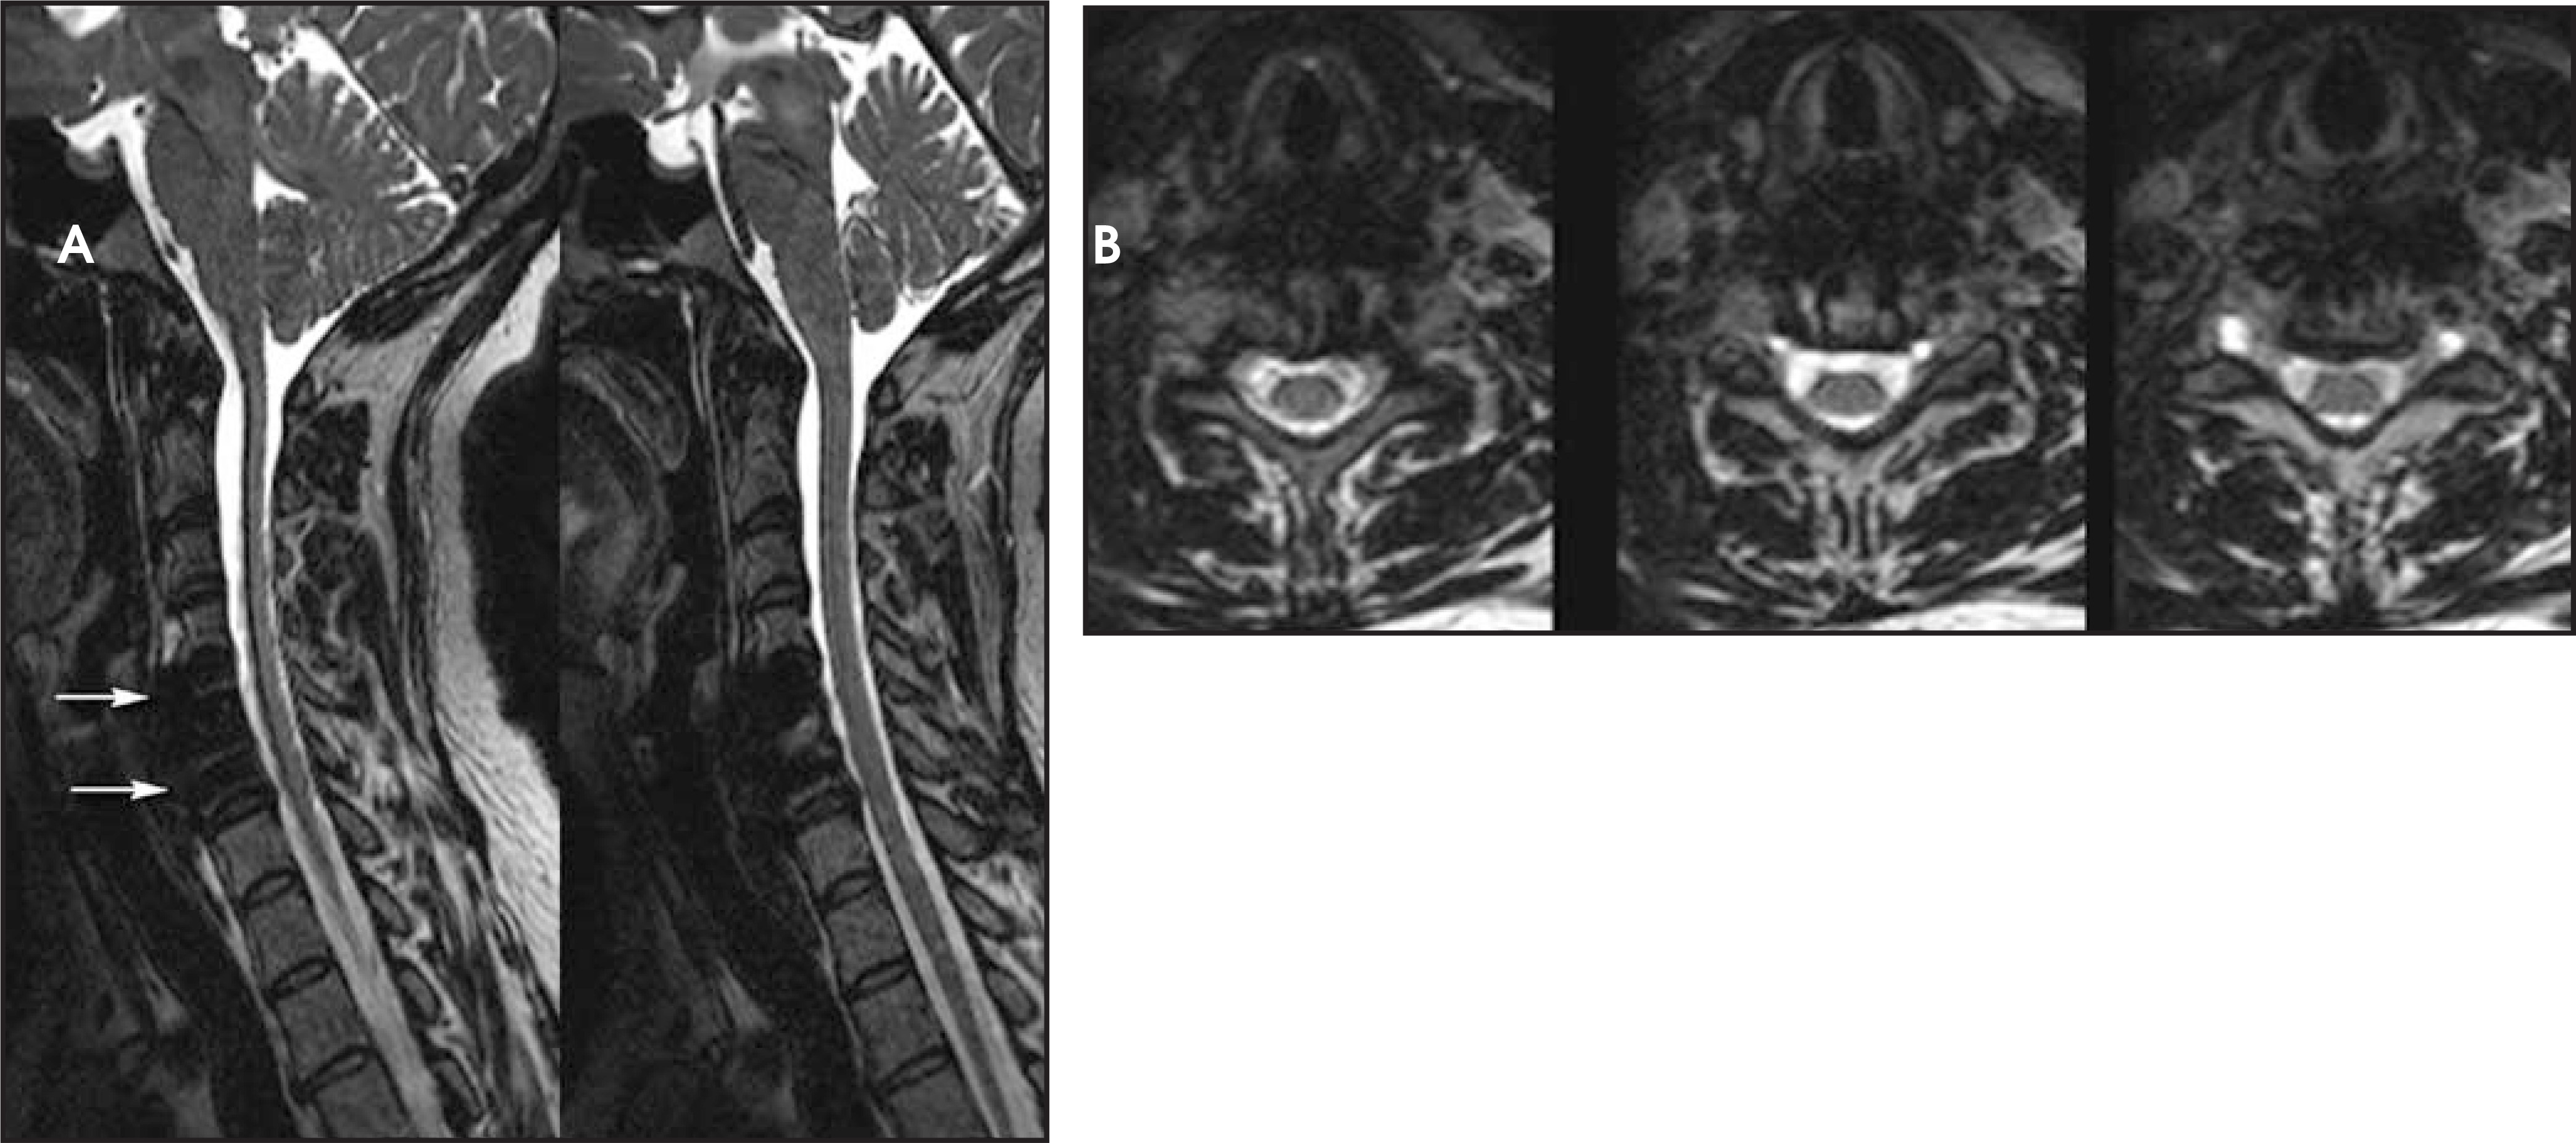
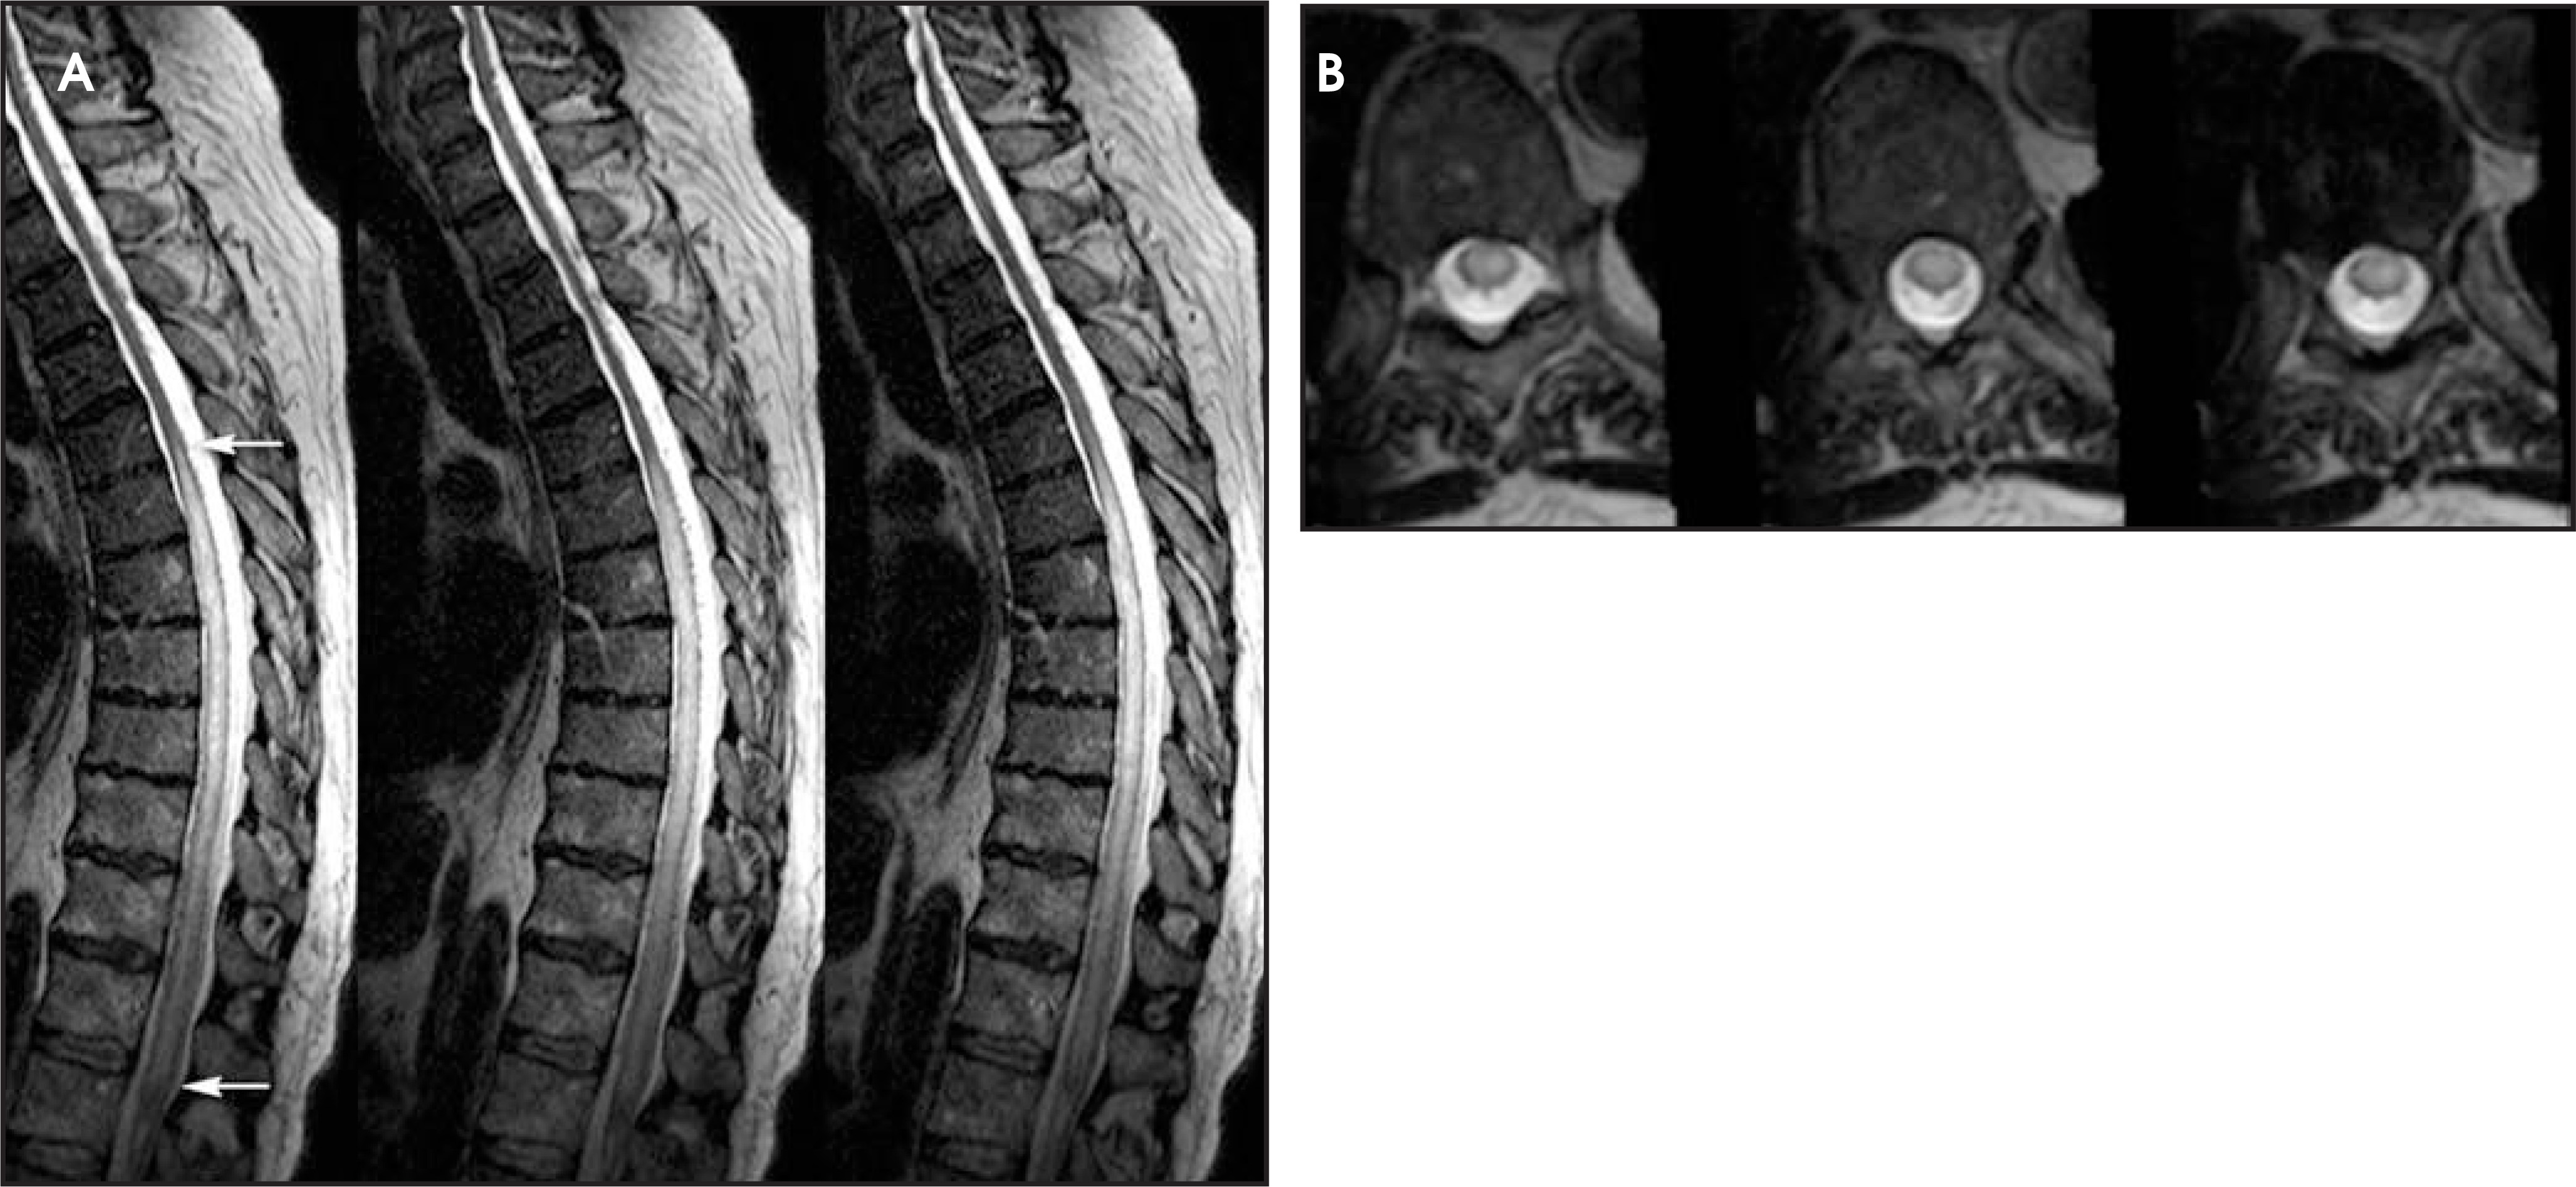
This imaging protocol, incorporating driven equilibrium, SPACE readout and parallel imaging, has demonstrated its effectiveness inevaluating degenerative disease in the cervical, thoracic and lumbar spine (Figures 8, 9 and 10). The combination of high contrast and improved spatial resolution allows the radiologist to characterize disc pathology, assess for presence of cord and nerve root impingement, and evaluate neural foraminal patency. Additionally, the ability to obtain coronal reconstructions (Figure 9B) without added imaging time provides the radiologist the opportunity to examine degenerative pathology in a new way. Coronal reconstructions may be particularly helpful in the evaluation of patients with scoliosis or pronounced extra-foraminal disease by providing a quick global overview. Whether the additional imaging plane will improve the radiologist’s ability to detect disease or better characterize it still needs to be determined. Also, the volumetric nature of 3-dimensional images lends itself to theoretical future integration of computer-aided diagnosis (CAD) software to assist the radiologist in assessing central canal and foraminal narrowing.
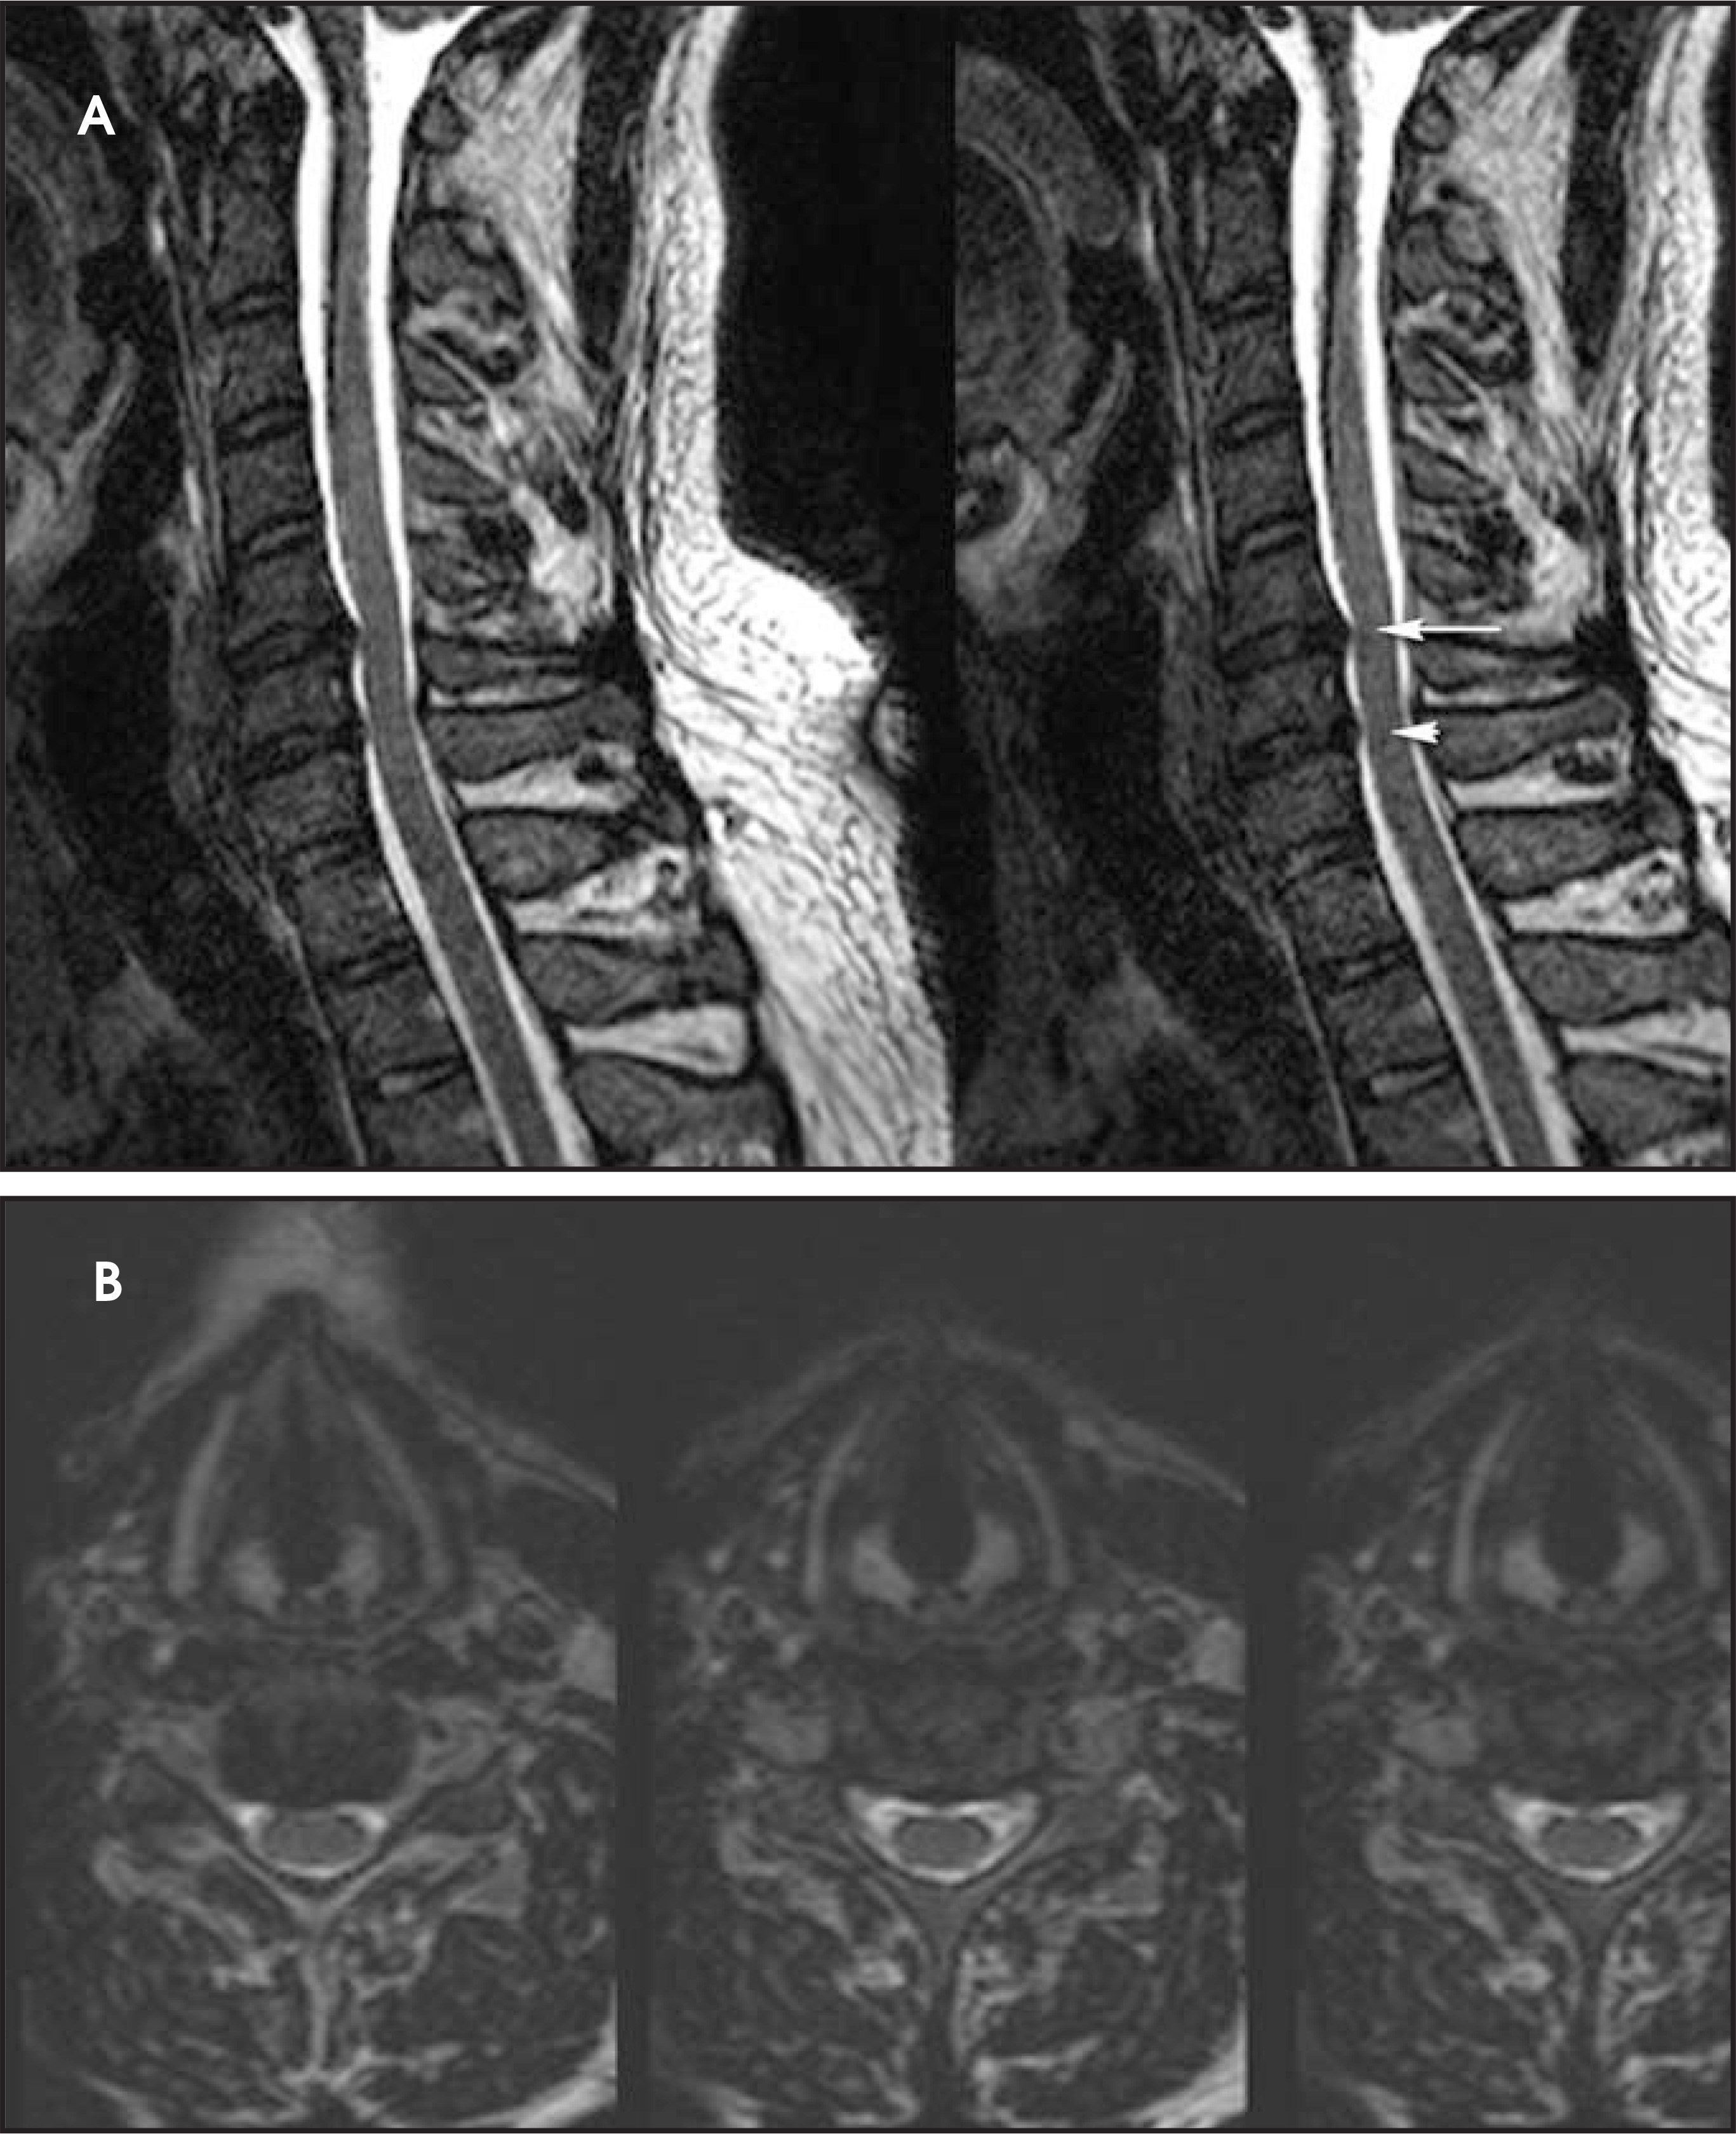
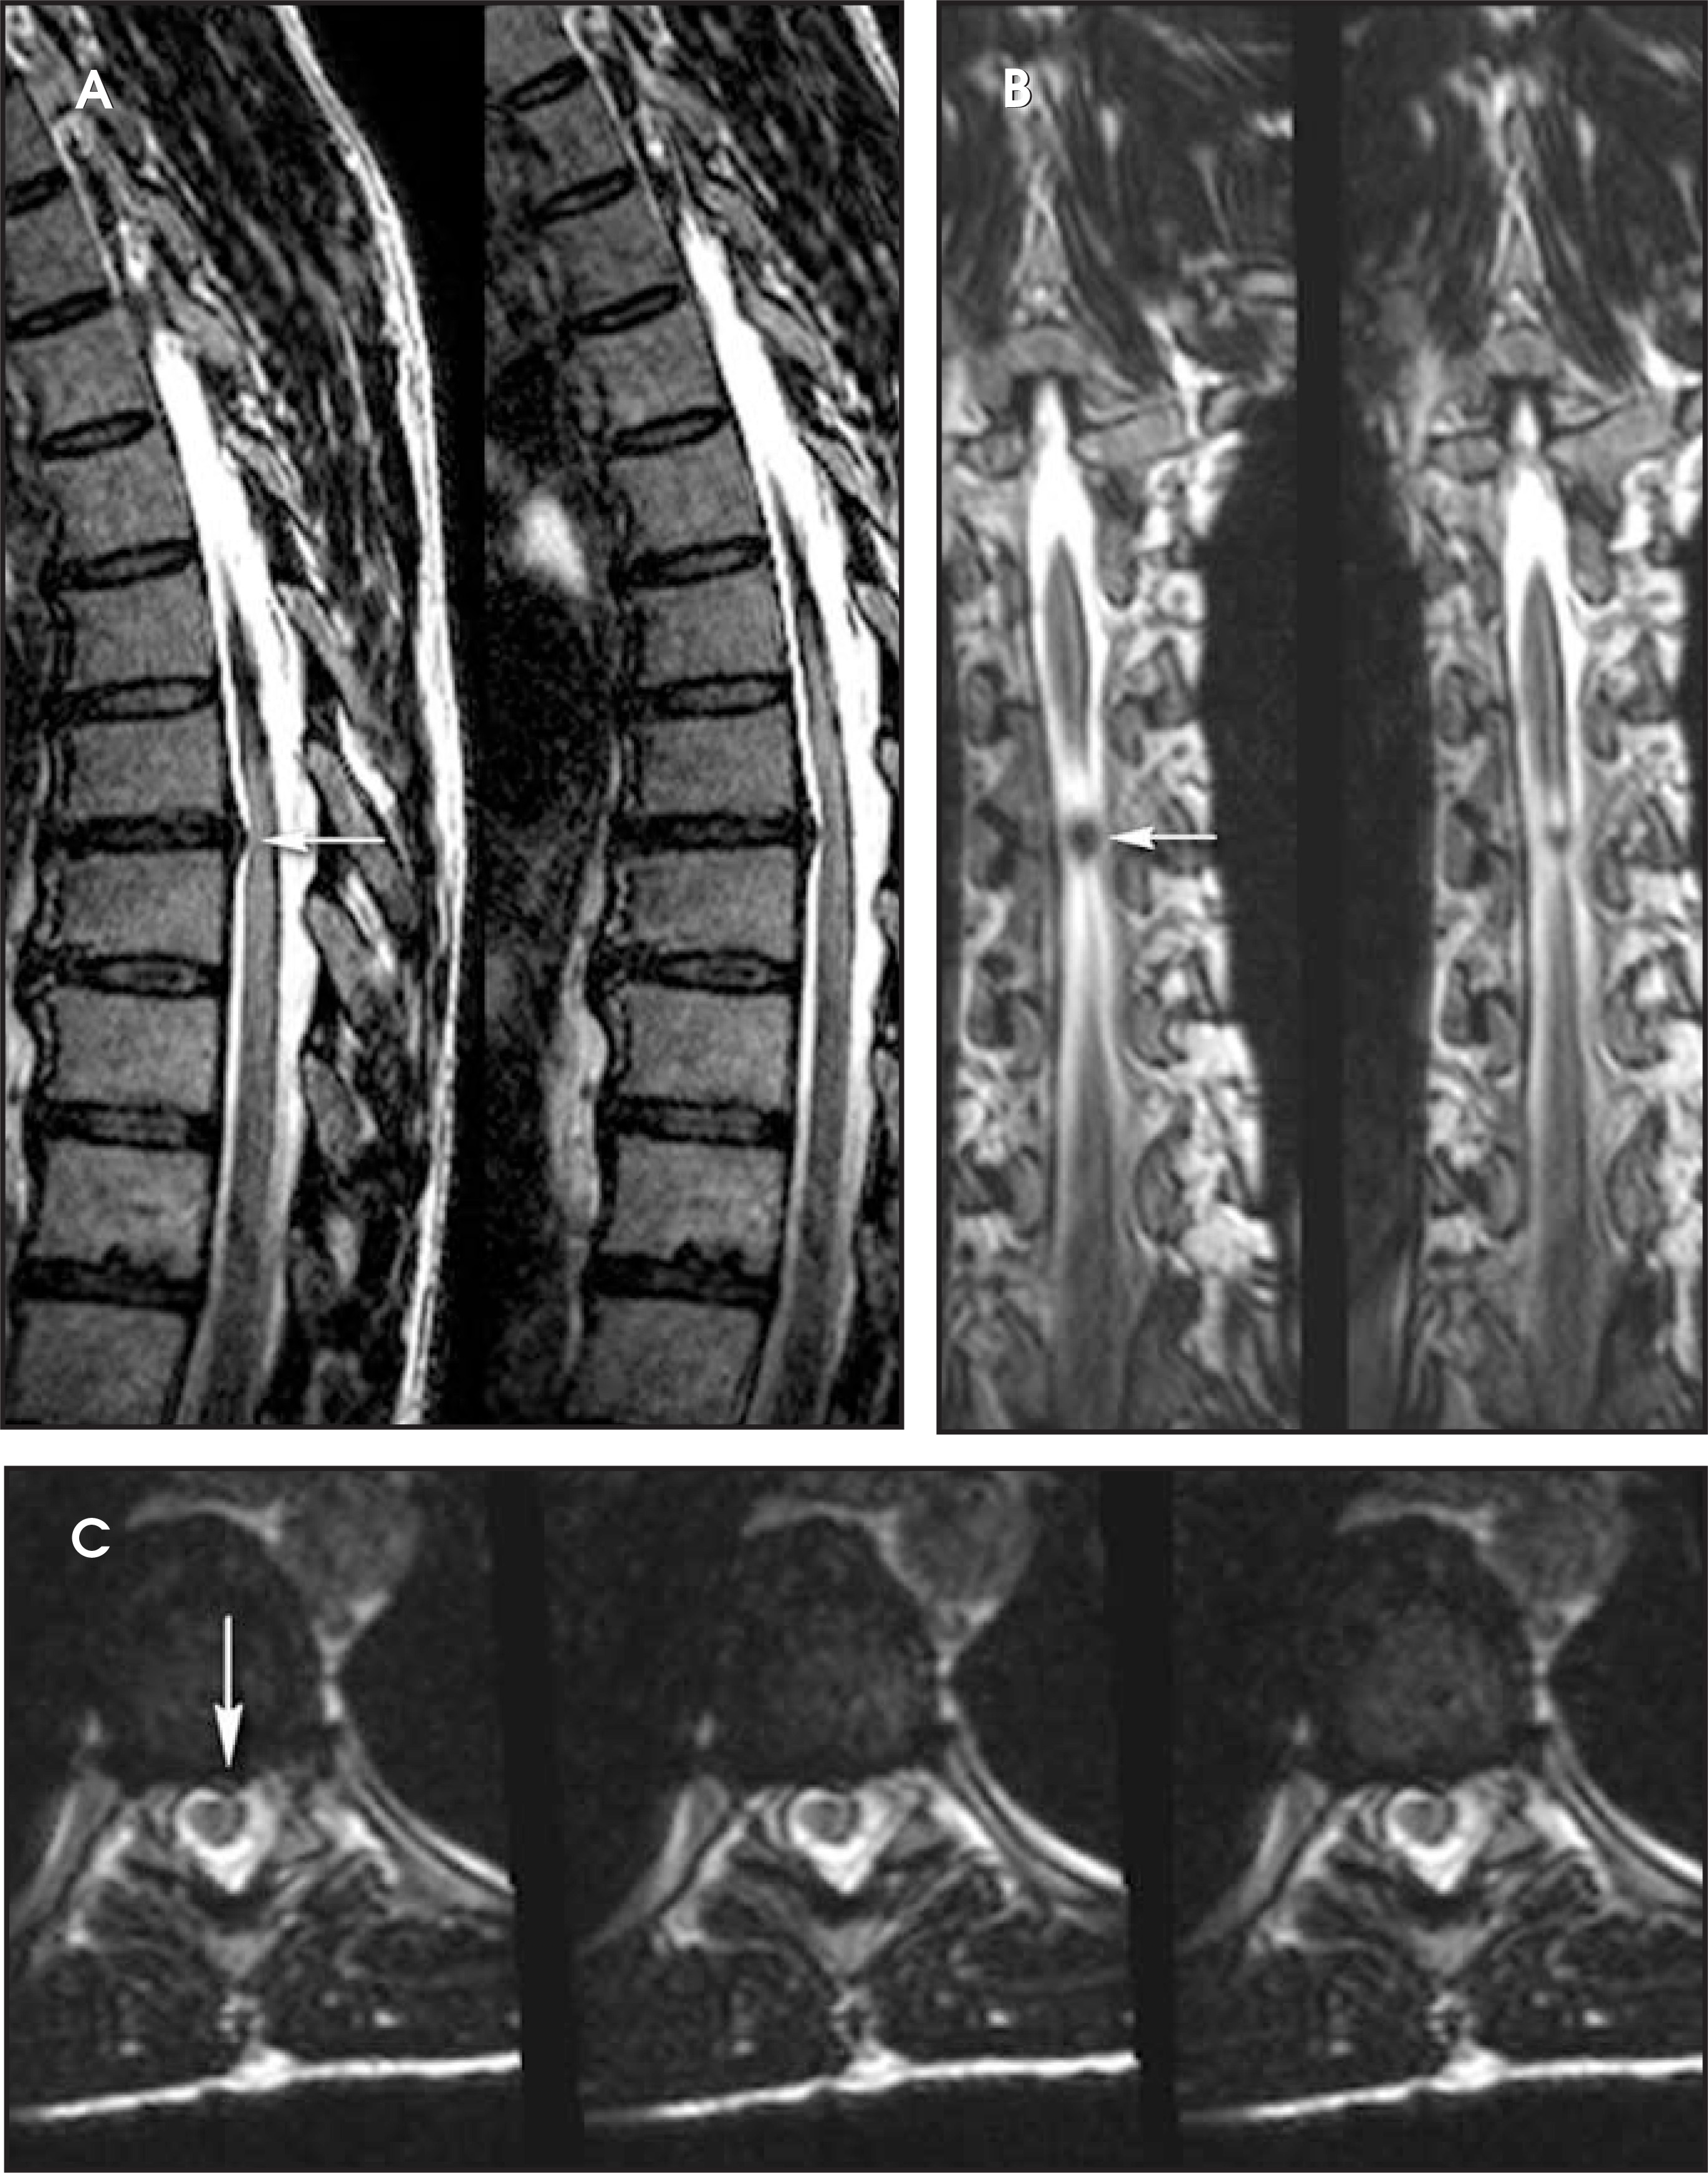
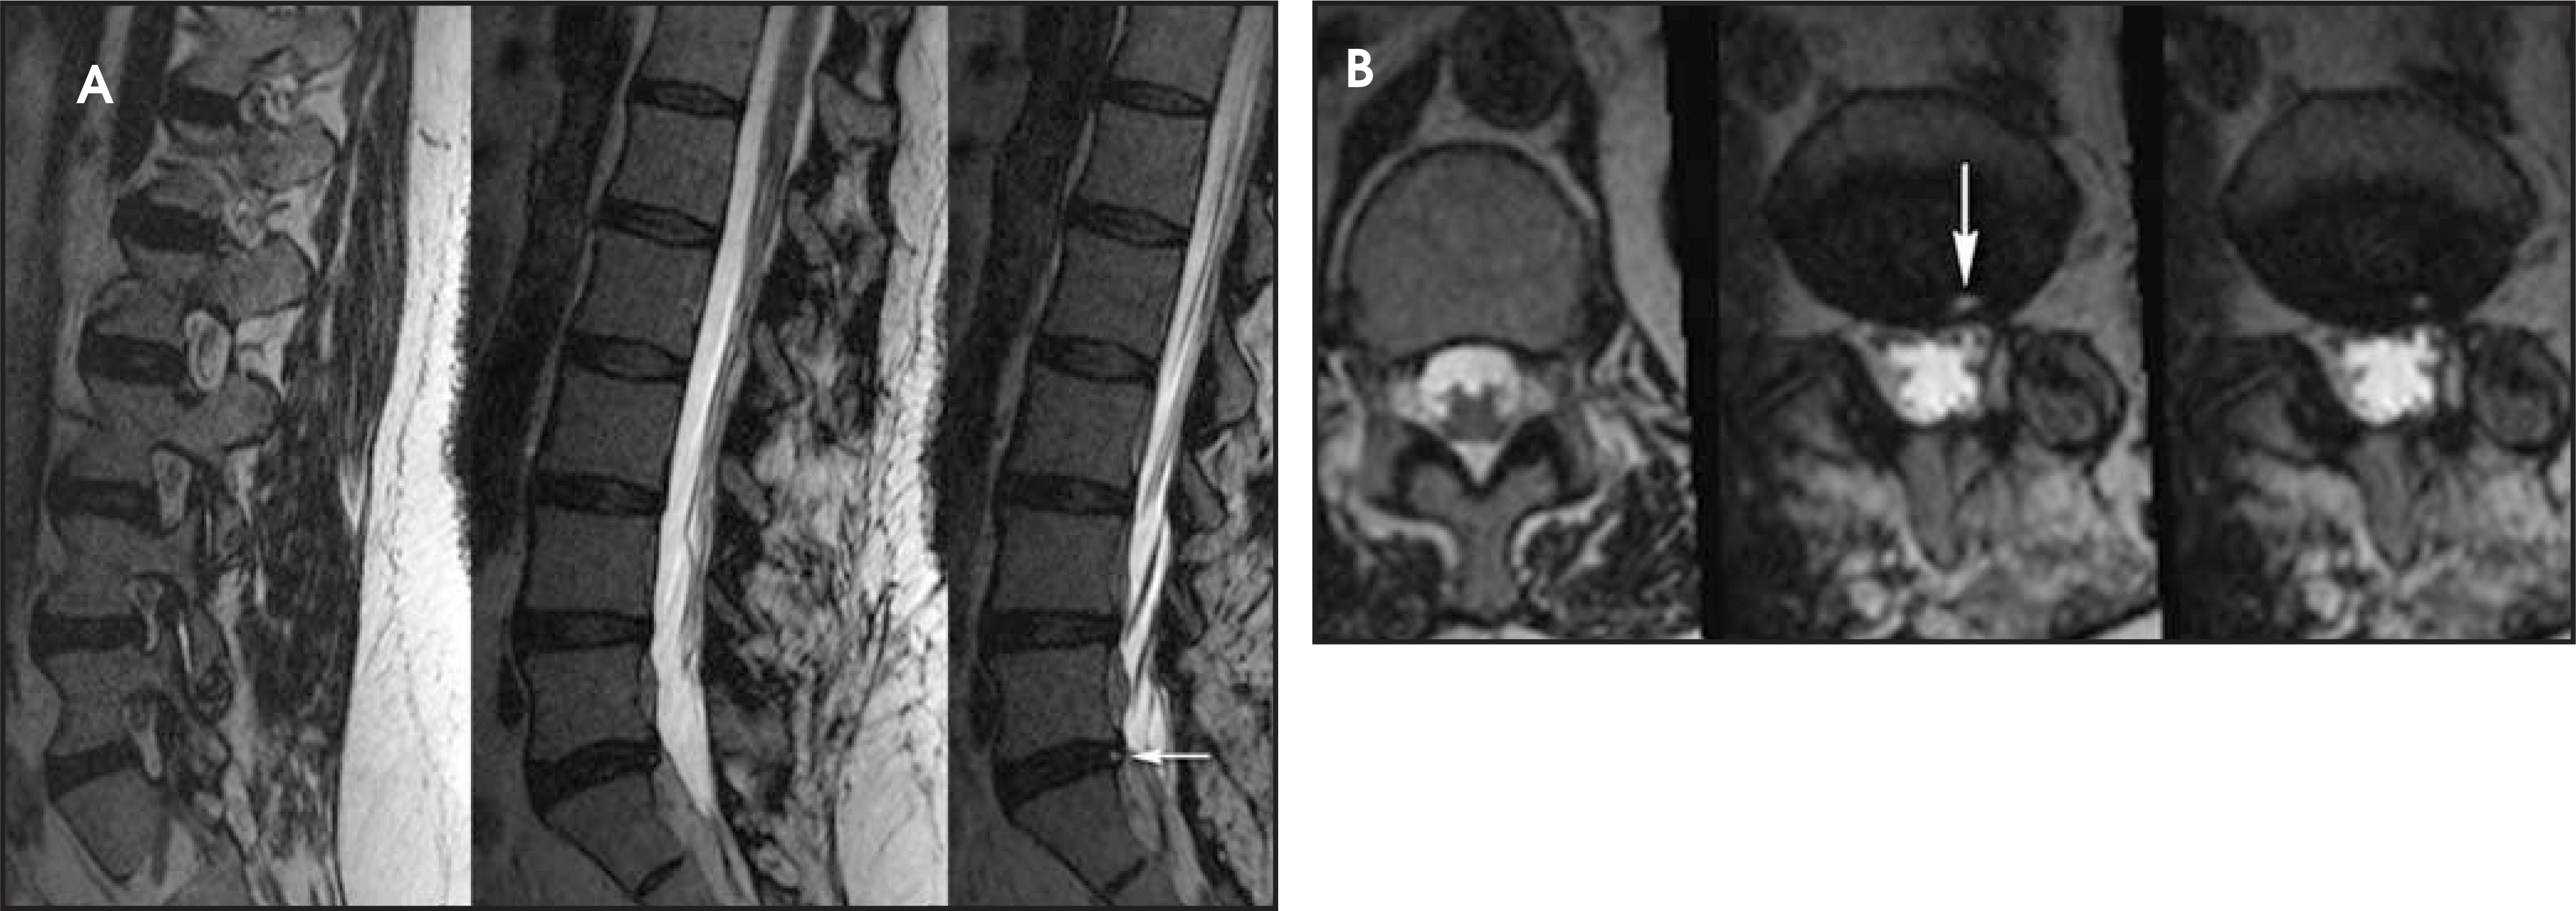
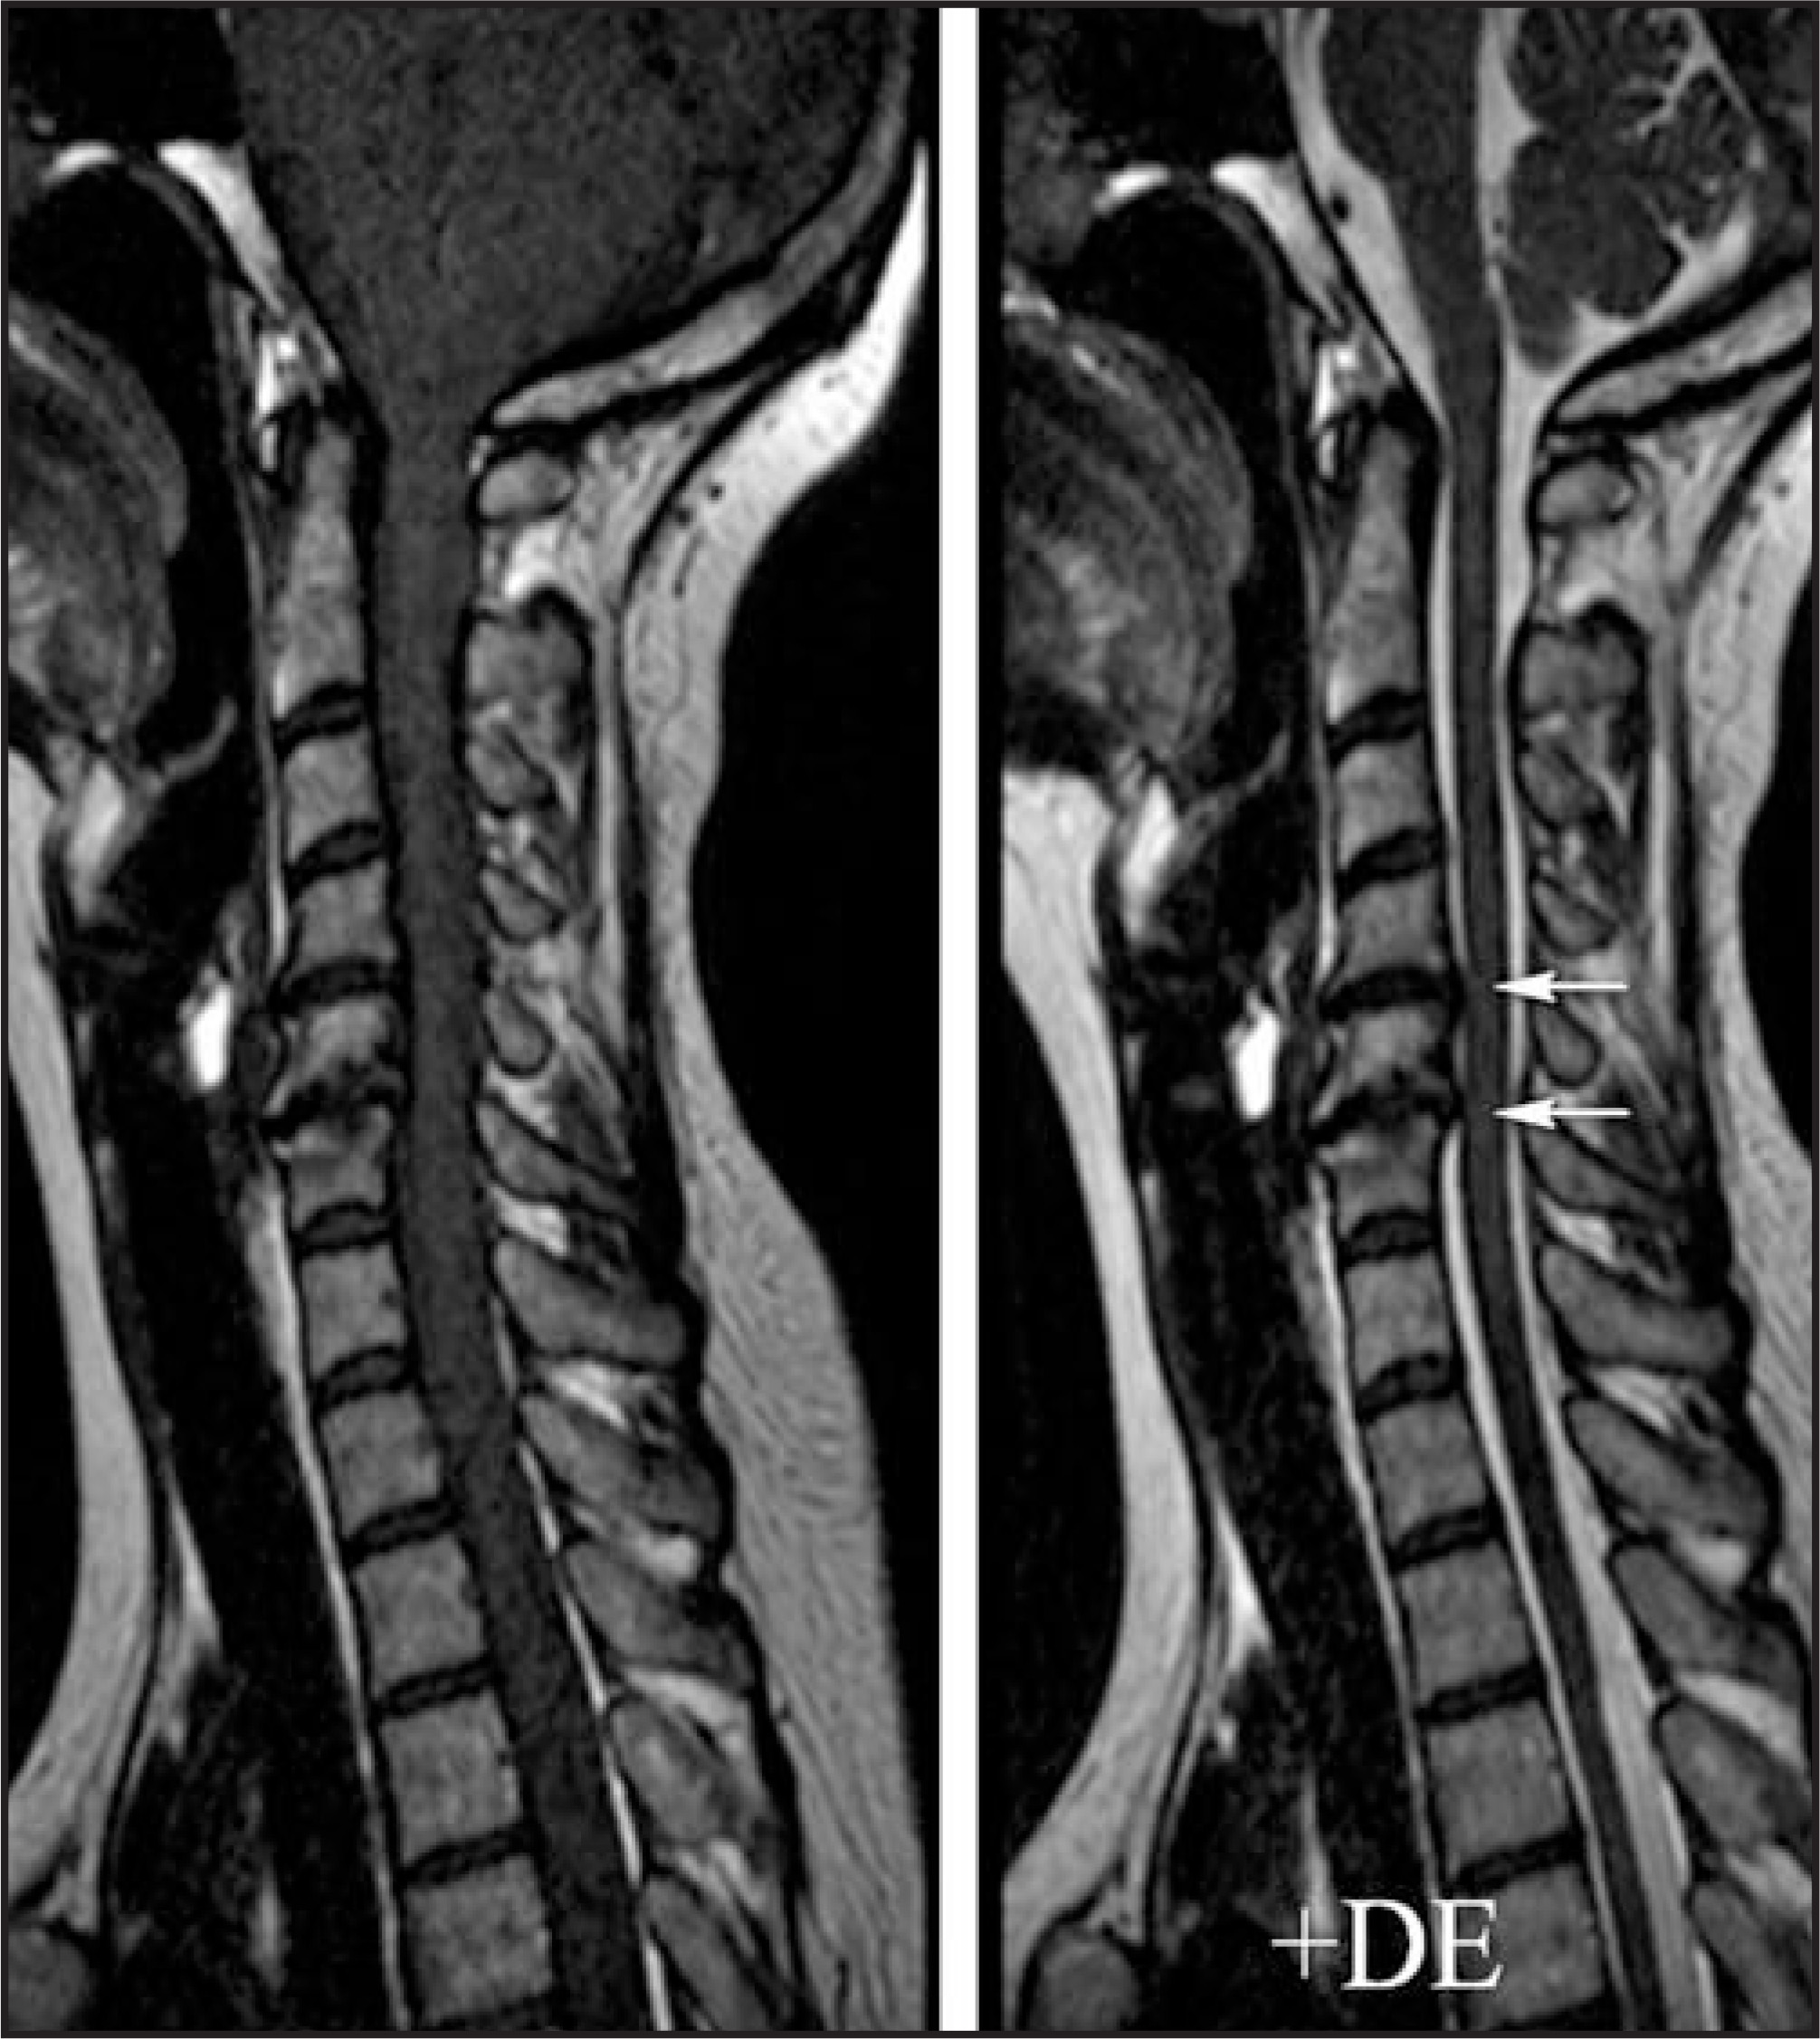
Moreover, the 3-dimensional imaging protocol can significantly improve the radiologist’s ability to evaluate the postoperative spine. The susceptibility artifact related to metallic hardware is minimized through the application of ultrashort echo spacing achieved with nonselective RF pulses used in SPACE readout (Figure 11), which otherwise would severely limit the diagnostic value of traditional imaging sequences. Furthermore, some of the more frequently seen intrinsic cord lesions, such as syringomyelia and transverse myelitis (Figure 12), are easily detectable on these sequences as well.
Conclusion
The combination of higher signal-to-noise ratio at high-field imaging, faster image acquisition with parallel imaging, effective T2 with SPACE readout and elimination of CSF pulsation artifacts with driven equilibrium make 3-dimensional FSE spinal MRI feasiblefor routine clinical practice. Further investigation of these novel techniques may focus on assessing the ability to detect and characterize more subtle cord lesions.
References
- Melhem E. Technical challenges in MR imaging of the cervical spine and cord. Magn Reson Imaging Clin N Am. 2000;8:435-452.
- Czervionke L, Daniels K, Wehrli F. Magnetic susceptibility artifacts in gradient-recalled echo MR imaging. AJNR Am J Neuroradiol. 1988;9:1149-1155.
- Tsuruda J, Remley K. Effects of magnetic susceptibility artifacts and motion in evaluating the cervical neural foramina on 3-dimensional FT gradient-echo MR imaging. AJNR Am J Neuroradiol. 1991;12:237-241.
- Yuan C, Schmiedl U, Weinberger E. Three-dimensional fast spin-echo imaging: Pulse sequence and in vivo image evaluation. J Magn Reson Imaging. 1993;3(6):894-899.
- Yousem D, Atlas S, Goldberg H, Grossman R. Degenerative narrowing of the cervical spine neural foramina: Evaluation with high-resolution 3-dimensional FT gradi-ent-echo MR imaging. AJNR Am J Neuroradiol. 1991;12(2):229-236.
- Sze G, Kawamura Y, Negishi C. Fast spin-echo MR imaging of the cervical spine: Influence of echo train length and echo spacing on image contrast and quality. AJNR Am J Neuroradiol. 1993;14(5):1203-1213.
- van Uijen C, den Boef J. Driven-equilibrium radiofrequency pulses in NMR imaging. Magn Reson Med. 1984;1(4):502-507.
- Melhem E, Itoh R, Folkers P. Cervical spine: three-dimensional fast spin-echo MR imaging – Improved recovery of longitudinal magnetization with driven equilibriumpulse. Radiology. 2001;218(1):283-288.
- Lichy M, Wietek B, Mugler J. Magnetic resonance imaging of the body trunk using a single-slab, 3-dimensional, T2-weighted turbo-spin-echo sequence with high sampling efficiency (SPACE) for high spatial resolution imaging: Initial clinical experiences. Invest Radiol. 2005;40(12):754-760.
- Blaimer M, Breuer F, Mueller M. SMASH, SENSE, PILS, GRAPPA: How to choose the optimal method. Top Magn Reson Imaging. 2004;15(4):223-236.
- Glockner J, Hu H, Stanley D. Parallel MR imaging: A user's guide. Radiographics. 2005;25(5):1279-1297.
- Pruessmann K, Weiger M, Scheidegger M. SENSE: Sensitivity encoding for fast MRI. Magn Reson Med. 1999;42(5):952-962.
- Sodickson D, Manning W. Simultaneous acquisition of spatial harmonics (SMASH): Fast imaging with radiofrequency coil arrays. Magn Reson Med. 1997;38(4):591-603.
- Ocali O, Atalar E. Ultimate intrinsic signal-to-noise ratio in MRI. Magn Reson Med. 1998;39(3):462-473.
- McGee K, Debbins J, Boskamp E. Cardiac magnetic resonance parallel imaging at 3.0 Tesla: Technical feasibility and advantages. J Magn Reson Imaging. 2004;19(3):291-297.
Citation
. Advances in high-field MR imaging of the spine. Applied Radiology. 2009;38(6):18-27. doi:10.37549/AR1701.