Applications of diffusion tensor imaging and fiber tractography
Applied Radiology — Vol. 36 , Issue 5 , pp. 36 -37
DOI: 10.37549/AR1509
Published: May 1, 2007
Categories
Since the introduction of its use in the clinical setting, diffusion-weighted imaging (DWI) has been proven to be a valuable tool in clinical neuroradiology. Although the recognized diagnostic value of DWI in the early detection of ischemia has not diminished with time, many new clinical applications of DWI have also emerged, including, for example, differentiation of pyogenic abscess from necrotic tumor. Diffusion tensor imaging (DTI) has more recently been introduced, allowing quantification of the magnitude and direction of diffusion along 3 principle eigenvectors. The information provided by DTI acquisitions allows the quantification of various metrics as well as the generation of 3-dimensional (3D) white matter fiber tractography; these measures provide unique information about central nervous system (CNS) tissue microstructure. Diffusion tensor imaging and fiber tractography may prove useful in clinical neuroradiology practice, with application to several categories of disease. In this review, the authors describe some of the applications of DTI in neuroradiology (which are listed below). This is a short subset of a long list of potential applications:
-
Normal brain development and aging;
-
Congenital anomalies, leukodystrophies;
-
Demyelinating and neurodegenerative diseases
-
Tumors and preoperative planning;
-
Epilepsy;
-
Ischemia and stroke;
-
Encephalopathies (toxic, metabolic, infectious);
-
Traumatic brain injury;
-
Psychiatric disorders, dementia, depression;
-
Functional connectivity mapping, cognitive neuroscience; and
-
Spinal cord evaluation.
The appreciation of the clinical application of DTI requires an understanding of its basic underlying principles as well as potential imaging pitfalls.
Principles of DTI
Diffusion, apparent diffusion, and anisotropy
Water molecules undergo random diffusion over time because of differences in concentration according to Fick’s law. Diffusion in a given volume of tissue may be quantified as the diffusion coefficient, D, which is normalized for observation time according to the Einstein equation, and expressed in mm2/sec. Diffusion of watermolecules may also occur in response to differences in pressure or temperature, due to ionion interactions or in response to other factors; in DWI, the apparent diffusion of water molecule protons is detected as a combination of true diffusion and these other mechanisms, and is quantified as the apparent diffusion coefficient (ADC). Although diffusion is a random process, directional preference may result from local barriers; for example, barriers to diffusion in white matter tracts include axonal proteins and myelin. Diffusion is considered isotropic if it shows no directional dependence (eg, in gray matter) or anisotropic if directional dependence is present (eg, in white matter).
Diffusion-weighted imaging
A DWI sequence may be generated by the application of paired diffusion-weighted gradient pulses before and after the 180° refocusing pulse of a T2-weighted (T2W) spin-echo sequence. Utilizing this sequence, signal loss will occur compared with a baseline T2W (non–diffusion-weighted) image, according to
SI = SI0 exp(-b × ADC)
where SI0 represents the baseline signal intensity and b represents the diffusion sensitivity factor, which depends on the gyromagnetic ratio, the magnitude and width of the diffusion-weighted gradient pulses, and the time between the 2 diffusion-weighted gradient pulses. If anisotropic diffusion is present, the degree of signal loss will be dependent on the direction of the diffusion-weighted gradient pulses; to negate this effect, 3 diffusion-weighted images with diffusion-weighted gradient pulses in orthogonal directions may be obtained and ADC calculated as an average.
Diffusion tensor imaging
Obtaining the diffusion tensor
Anisotropic diffusion may be described in terms of an ellipsoid tensor. The tensor consists of 3 vectors: a major eigenvector (or principal eigenvector) and 2 minor eigenvectors, with magnitudes being the major eigenvalue and minor eigenvalues, respectively. Since the eigenvectors are by definition orthogonal to each other, the diffusion tensor has 6 degrees of freedom and may be expressed in terms of a symmetric 3 × 3 matrix:
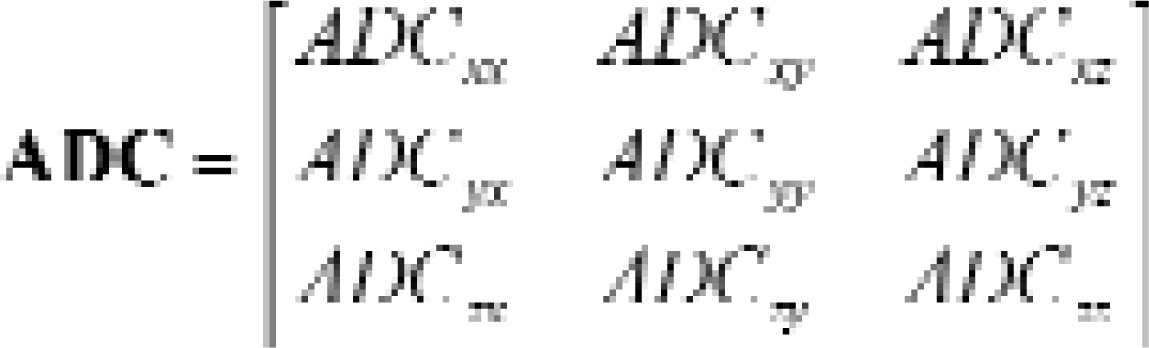
where ADCxy = ADCyx, ADCxz = ADCzx, and ADCyz = ADCzy. In DTI, the scalar elements of this diffusion tensor matrix may be calculated on a voxel-by-voxel basis from data obtained by performing multiple DWI sequences, applying the diffusion-weighted gradient along ≥6 noncollinear directions, with an additional, non–diffusion-weighted (b = 0) sequence. The elements along the diagonal of the diffusion tensor matrix correspond to the directional ADC along the x, y, and z axes, respectively, referenced to the scanner; the off-diagonal elements provide information as to the correlation of the directional ADCs from pairs of axes.
Utilizing the eigen decomposition theorem, the diffusion tensor matrix may be expressed as:
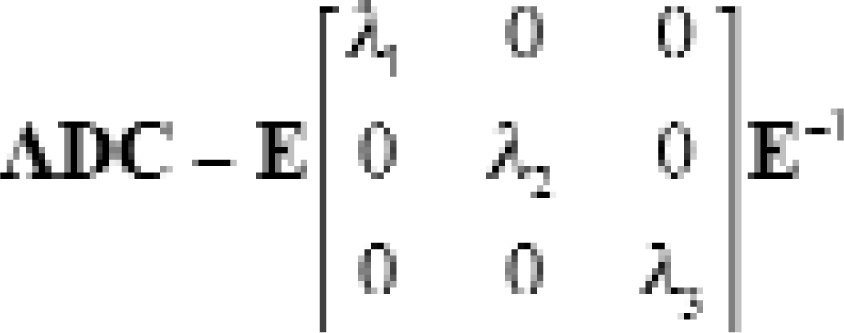
where λ1 is the major eigenvalue, and λ2 and λ3 are the minor eigenvalues; by definition, λ1 ≥ λ2 ≥ λ3. The 3 × 3 matrix E contains the 3 eigenvectors.
DTI metrics
From the diffusion tensor matrix, several scalar metrics may be calculated. These commonly include fractional anisotropy (FA) and mean diffusivity (MD). A measure of the degree of anisotropy, FA is calculated as:

FA varies from 0 to 1, with FA = 0 representing isotropic diffusion (λ1 = λ2 = λ3) and FA = 1 (λ1 = 1, λ2 = λ3 = 0) representing 100% directional preference along the major eigenvector. Relative anisotropy, a similar measure, is less commonly used.
MD is the trace of the diffusion tensor matrix, and may be calculated as:

MD is analogous to the scalar ADC that is used in routine DWI.
Display of the DTI data
Tensor maps and maps of metrics
Several methods are used to visualize the large amount of data obtained at DTI. Diffusion tensor maps may be generated using a workstation with 3D display capability. In addition, the metrics FA, relative anisotropy (RA), or MD may be calculated on a voxel-by-voxel basis and displayed as 2-dimensional (2D) color or grayscale images; the major and minor eigenvalues may also be displayed in this fashion. From these images, the average metric values within user-defined regions of interest (ROIs) may be calculated. In addition, the maps may be interrogated using methods such as histogram analysis.
3D tractography
In white matter, the direction of the major eigenvector tends to be parallel to the orientation of axonal fibers. Using this observation, algorithms have been developed that may generate 3D representations of axonal fibers, or 3D fiber tractography. These algorithms in effect attempt to “string together” adjacent voxels based on similarity in the direction of their major eigenvectors.
Although useful in tract visualization, white matter fiber tractography represents a more postprocessed representation of DTI data (than do visualization of tensor maps and maps of metrics) and is, therefore, prone to the addition of error. In voxels that contain crossing fiber tracts from ≥2 directions, the association between the diffusion tensor measurement and the axonal fiber direction is less direct; algorithms have been developed to mitigate this problem, which arises commonly in CNS structures (such as the brainstem and in areas with complex crossing association fibers). Various data smoothing and interpolation techniques have also been employed to minimize the propagation of noise error. In addition, fiber tractography algorithms require user-defined ROIs and threshold values, which will affect the number of fibers tracked and the degree of noise effects. All of these differences potentially limit reproducibility and may limit the comparison of various investigations.
Fiber tractography algorithms may be grouped into single-ROI and multiple-ROI techniques. Single-ROI techniques will attempt to trace all fibers that pass through the user-defined ROI. Multiple-ROI techniques will attempt to trace the fibers that pass through all of the user-defined ROIs, ignoring any tracking patterns that track to other locations. The multiple-ROI method allows discrete visualization of known anatomic tracts that pass through high-branching areas, such as the corticospinal tract as it passes through the brainstem, at the expense of non-visualization of any associated branching tracts.
Applications of DTI in neuroradiology
DTI in normal human brain development and normal spinal cord
Diffusion tensor imaging tractography applied in normal volunteers is able to resolve normal supratentorial fiber tracts (including various association fibers, projection fibers, and commissural fibers).1-3 Normal fiber tracts are also seen in the brainstem (including the corticospinal tracts, medial lemnisci, and superior, middle and inferior cerebellar peduncles).4,5 Wakana et al4 have applied DTI to normal volunteers and have generated 2D and 3D atlases of white matter architecture in the normal brain. With improved technique and near-millimeter or submillimeter voxel sizes, DTI is also becoming increasingly able to resolve fiber tracts in the spinal cord.6
Diffusion tensor imaging has been used to evaluate the brain in neonates7 and throughout childhood.8,9 This use of DTI to detect normal maturational changes may give insight into the effects of myelination and other factors on DTI metrics. Images from the NIH (National Institutes of Health) MRI Study of Normal Brain Development—a multicenter, prospective, combined cross-sectional and longitudinal investigation in progress to map brain-behavior in normal children—are available and described in a publication from Mukherjee and McKinstry.10
Congenital anomalies and leukodystrophies
The holoprosencephalies are a group of developmental disorders caused by both genetic and environmental insults that result in incomplete development and septation of the midline structures during the first 5 weeks of embryonic development. The clinical severity depends on the degree of developmental inhibition, which ranges from complete failure of division and rapid death to mild symptoms (such as a single maxillary central incisor). Diffusion tensor imaging has been used to qualitatively evaluate white matter tract abnormalities in the brainstems of patients with holoprosencephaly.11 Cases were identified in which the pyramidal tract did not extend into the spinal cord and the medial lemniscal tracts did not separate. Thus, DTI revealed white matter tract abnormalities in the brainstem that were not visible on conventional MR images. Further studies may provide insight into the wide clinical variability seen in the holoprosencephalies.
Globoid cell leukodystrophy, also known as Krabbe’s disease, is an autosomal recessive white matter disorder caused by the deficiency of ß-galactocerebrosidase. Normally, the toxic galacto-lipids that are formed during white matter myelination are hydrolyzed by ß-galactocerebrosidase. However, in Krabbe’s disease, these substances accumulate and are lethal to the myelin-forming oligodendroglia. In early-onset Krabbe’s disease, this leads to the failure of normal myelin production in infants and the subsequent development of severe neurological deficits. These children typically deteriorate neurologically until they reach a vegetative state and ultimately die within 2 to 4 years. Although hematopoietic stem cell transplantation has been suggested as a treatment for asymptomatic infantile Krabbe’s disease, there are currently no proven therapeutic options for symptomatic patients with the infantile form of Krabbe’s disease. Therefore, early diagnosis of the disease is critical for any treatment to be effective.
The traditional radiologic approach to the diagnosis of Krabbe’s disease relies on T2W conventional MRI to display ongoing myelination as hypointense signal within white matter. However, conventional MR images lack any identifiable myelination milestones in the newborn. In addition, they are not quantitative and, therefore, are susceptible to interobserver variability. Diffusion tensor imaging offers a quantitative and reproducible way to assess white matter integrity in the form of anisotropy maps. One study compared the sensitivity of diffusion anisotropy maps with T2W MR images in patients with Krabbe’s disease. Within multiple white matter tracts in the brain, the statistical comparison of RA differences between Krabbe’s and control patients yielded a lower P-value using anisotropy maps than did T2W images.12 This finding, along with the fact that the white matter tracts correspond to known areas affected in Krabbe’s disease, suggests that anisotropy indices have an improved sensitivity compared with conventional MR images.
Serial DTI scans, including pre- and posttransplantation imaging, have also been performed to prospectively compare the anisotropy measurements of white matter regions in Krabbe’s disease patients treated with early (0 to 1 month) and late (1 to 12 months) stem cell transplantation.13 Pretransplantation FA ratios were shown to be decreased in the late transplantation group only, suggesting Krabbe’s disease infants may have relatively normal white matter in the first month of life. At 1-year follow-up in the early transplantation group, most white matter regions showed substantial increases in anisotropy values, with measurements at least 85% of those in age-matched controls. On the other hand, at 1-year follow-up, the late transplantation group had no change or a decrease in anisotropy values in most sites, with the exception of a moderate increase in the internal capsule. These results support stem cell transplantation as a viable treatment for Krabbe’s disease patients and indicate that very early treatment may yield a larger benefit.
Demyelinating and neurodegenerative diseases
Multiple sclerosis (MS) is an inflammatory demyelinating disease of the CNS that is the most common cause of chronic disability in young adults in the United States.14 Neuropathologic findings in MS include a T-cell–mediated inflammatory process, associated with destruction of myelin sheaths.15 Axonal injury is also a prominent feature of MS, found to occur in both acute inflammatory and chronic MS lesions.15 Clinical features vary and may involve the motor, sensory, cognitive, and visual pathways. Although the pathologic mechanisms underlying different disease subtypes are still not well known, there are several phenotypes of MS with regard to distinct clinical manifestations of the disease, including relapsing-remitting (RR), secondary progressive (SP), and primary progressive (PP) MS.16
In recent years, MRI has been established as an important paraclinical tool for the assessment of clinical diagnosis, natural history, and treatment effects in MS.17,18 There are many advantages to having a sensitive and reliable in vivo method for characterizing the pathologic changes of white matter and its integrity. As a consequence, in the past decade, the application of MRI in the study of MS has been investigated, from conventional MRI to new advanced quantitative techniques with greater pathological specificity and sensitivity.19,20 Diffusion tensor imaging is one of these new techniques used to study MS.
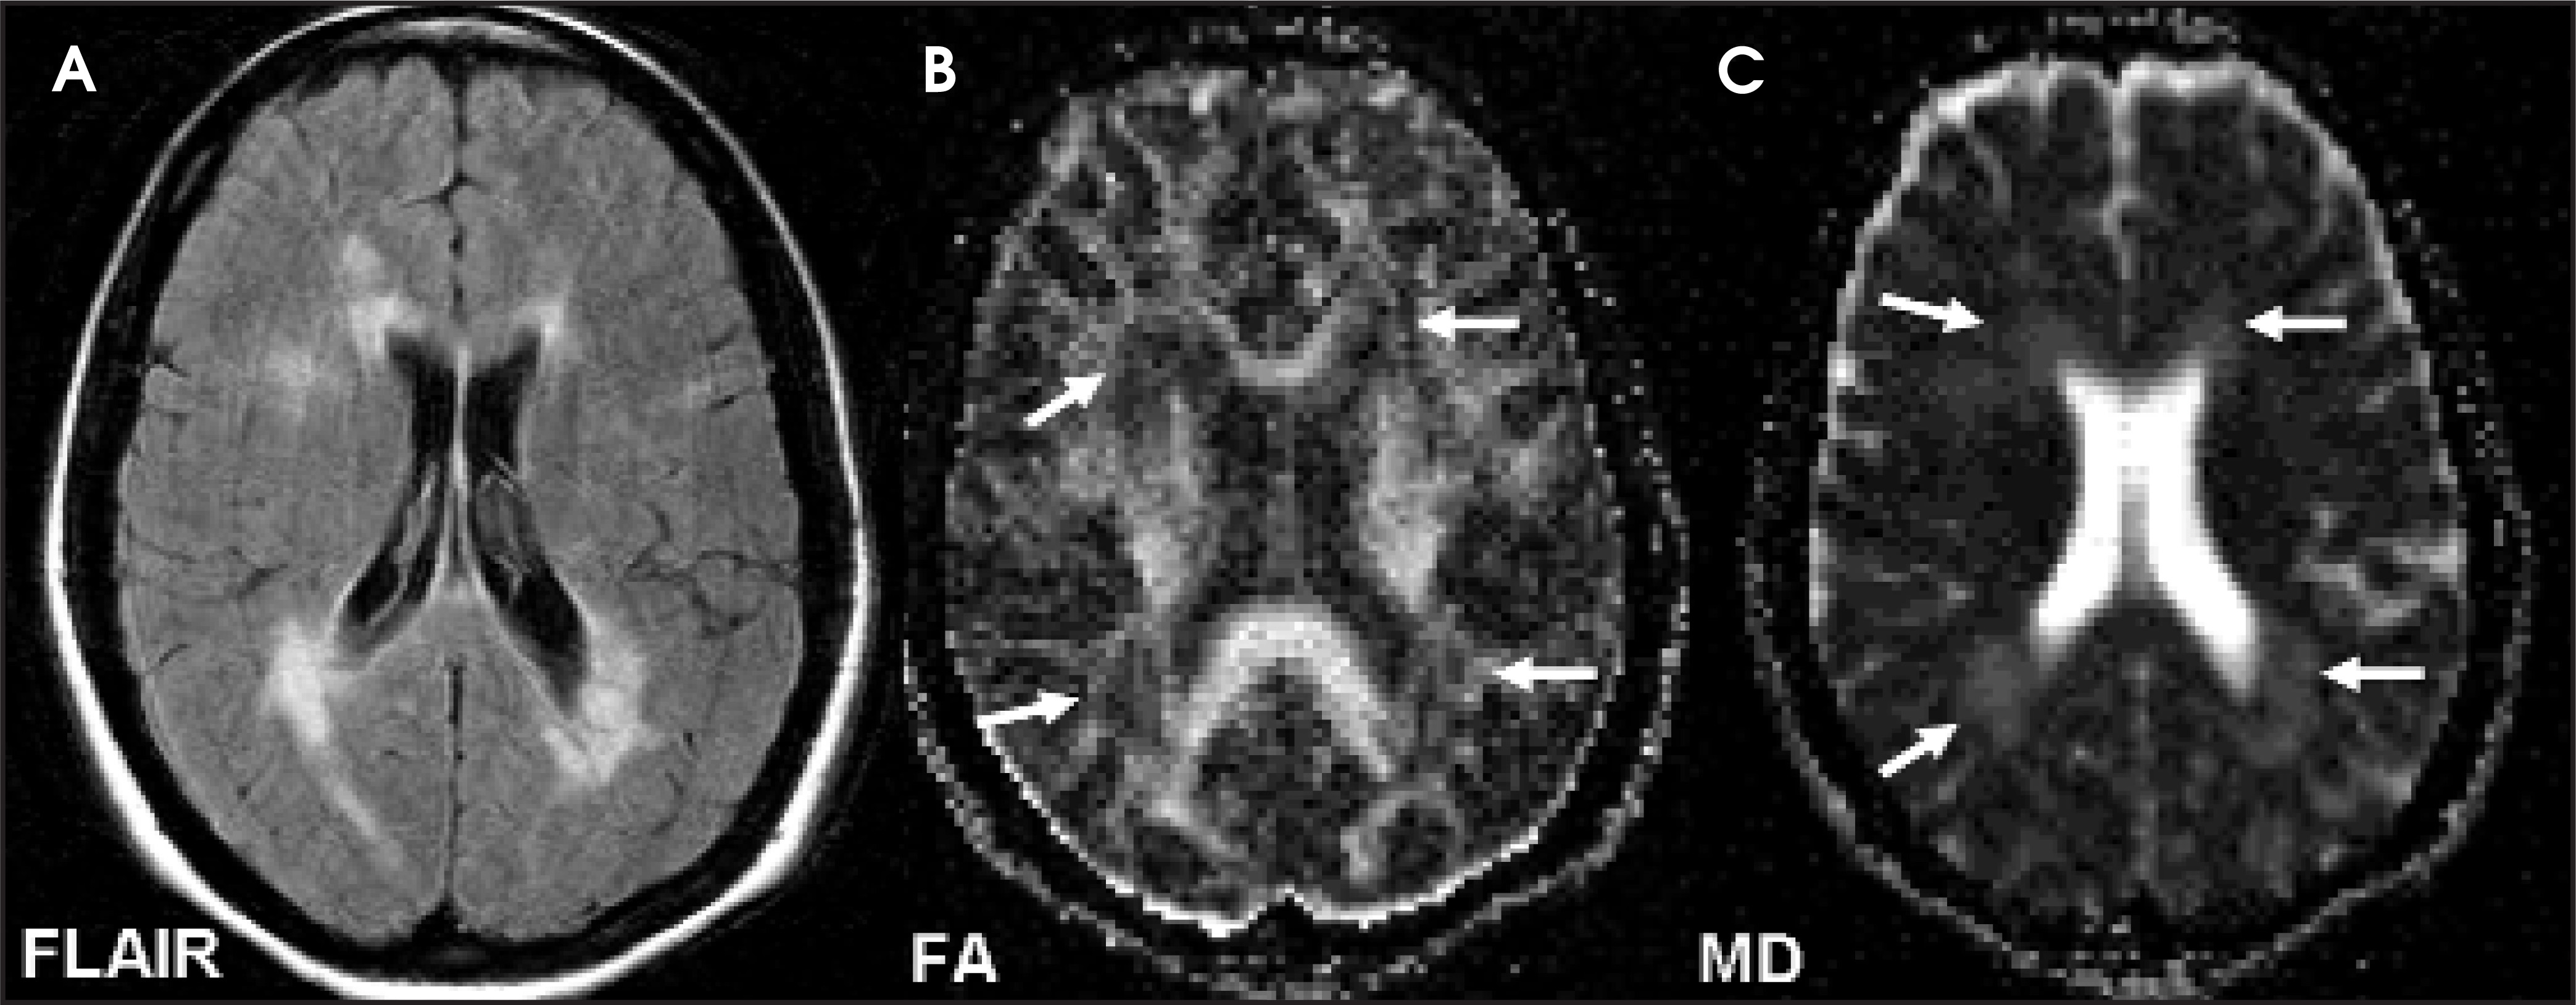
DTI studies in MS lesions—MS lesions are pathologically heterogeneous and show different imaging patterns on MRI, with variable sizes and appearances; some undergo acute inflammatory changes, while others may show extensive tissue destruction. Larsson et al21 first applied DWI in 1992 in a study of MS; this and subsequent studies have shown increased MD in lesions of MS patients when compared with the normal white matter of healthy controls. The higher values of MD in MS lesions are consistent with the findings in studies22,23 of experimental allergic encephalomyelitis (EAE) (an animal model of MS), in which water diffusion was found to be increased in the experimental pathology, suggesting that inflammatory demyelination in MS can result in changes on DTI (Figure 1).
In MS lesions, the highest diffusion values appear to be found in nonenhancing T1-hypointense lesions as compared with enhancing lesions and nonenhancing T1-isointense lesions.24-26 This may be due to long-standing destructive damage in hypointense lesions or so-called “black holes,”27 in which water diffusion is most mobile or least restricted; thus, DWI seems to be useful in assessing the severity of tissue damage in MS and holds promise as a surrogate marker of clinical disability. Some studies have shown that enhancing plaques, which represent early active areas of blood-brain barrier breakdown, can be differentiated from nonenhancing lesions by measuring their MD values,24,26 but others have failed to show this utility.25,28 This discrepancy may be due to the variable degree of tissue damage during the period the lesion is active, as reflected by their variable appearance on MRI. Contrast enhancement in MS lesions may vary in terms of shape, size, and age and usually disappears within 6 weeks. Although DWI cannot differentiate between enhancing and nonenhancing lesions by measuring their MD, DTI studies have shown that FA is always lower in enhancing than in nonenhancing lesions, indicating that anisotropy is more sensitive in differentiating pathological substrates of MS lesions.20,29,30
It is now generally agreed that both MD and FA metrics should be estimated to maximize the yield from DTI. This is because diffusion is inherently a 3D process; in highly organized tissue, such as white matter, the diffusion may vary greatly between perpendicular and parallel direction of the major axis of axonal fibers.31 Newly formed and visualized enhancing lesions are usually small and nodular, while old and reactive lesions may appear larger, some with ring enhancement. The FA is generally markedly reduced in ring-enhancing lesions,28 suggesting pronounced tissue destruction of the white matter miscrostructure at the site of enhancement. Studies have also shown significantly increased MD values26,28,32,33 in ring-enhancing lesions when compared with homogenously enhancing lesions. This is likely due to extracellular vasogenic edema at the enhancing rim, which is more profound than that in the centrally enhancing nodules. These underlying pathologic features are not seen on conventional MRI. Since lesions in SP-MS are often old and chronic with extensive tissue destruction, larger degrees of changes in MD and FA were also reported in these lesions as compared with those in RR-MS.27
DTI studies in normal-appearing white matter in MS—It has become increasingly evident that MS is a disease that affects the brain globally and that normal-appearing white matter (NAWM) on conventional MRI is microscopically abnormal.17 This may be part of the reason that correlations have not been found between the presence of T2 or T1 lesions (lesion load) on MRI and clinical status/outcome since the disease burden in NAWM beyond lesions is not usually determined.19 Several nonconventional MRI techniques have been developed to quantify pathologic changes not identifiable with routine MR sequences. Diffusion tensor imaging is one of these new advanced MRI techniques that is frequently used to detect microscopic structural and architectural changes in normal-appearing brain tissue.
Studies of DTI in NAWM have revealed decreased FA and increased MD in different regions that appear normal on conventional MRI,19,20,25,34-39 suggesting the presence of microscopic pathology beyond the resolution of conventional MRI. Although the DTI abnormalities seem to be quite widespread in NAWM, they tend to be more severe in the periplaque regions.38 Anisotropy measurements seem likely to be potentially more sensitive than diffusivity measurements for the detection of MS pathology.38 The pathologic features in the NAWM of MS patients may relate to a low-grade inflammatory and demyelinating process with resultant edema, demyelination, cellular infiltration, gliosis, and axonal loss.40 Among these discrete abnormalities, myelin and axonal loss is considered to contribute most to the DTI changes. Recent evidence from a quantitative postmortem study41 has shown a significant reduction of axonal density (ie, the total number of axons passing through the areas of corpus callosum) that grossly appears normal in MS patients. It is possible that significant DTI changes in the NAWM are due to a subtle net loss of structural barriers to water molecular motion within the tissues.
The corpus callosum is the largest white matter fiber tract in the brain that connects a large volume of subcortical white matter from the 2 hemispheres and is commonly involved in MS. A recent study39 showed significant water diffusion changes in the normal-appearing corpus callosum (NACC) in a group of patients with early MS; however, such significant abnormalities of DTI were not observed in frontal and occipital NAWM regions. The degree of diffusion abnormalities in the corpus callosum also correlates with the cerebral lesion load in these patients, suggesting a preferential occult injury of the corpus callosum in early MS. This is likely due to the accumulative bridging effects of the corpus callosum that result from wallerian degeneration injury from distal lesion plaques or from an underlying low-grade inflammatory vasculitic/ ischemic process. Furthermore, the diffusion abnormalities can be detected in the corpus callosum at the earliest stage of clinically isolated syndrome that is suggestive of MS, before any atrophy or lesions are detected.42 The effects of focal occult pathology in the corpus callosum and wallerian degeneration from distal lesions or underlying ischemia may be more severe as compared with other NAWM regions. On the other hand, since the corpus callosum is also a very well-organized and densely packed fiber structure, it is likely to have much higher FA in the normal state, and changes may also be more markedly manifested once pathology occurs. Thus, corpus callosum occult injury measured by DTI is potentially useful in the early stages of MS or even can serve as an early marker of primary demyelination in patients presenting with a clinically isolated syndrome.
Studies in which diffusion changes measured on DTI in NAWM have been used to precede new lesion formation indicate another clinical application of DTI in terms of studying lesion pathogenesis and natural history.36,43 In a longitudinal study, Werring et al43 found a steady and moderate increase of MD in prelesional NAWM area followed by a rapid and marked increase at the time of contrast enhancement of the lesion. Although this new pathologic activity may develop for many months prior to focal lesion formation,43-45 a pre-existing pathologic process must occur in the NAWM, which can be detected by DTI. Therefore, the degree of diffusion changes in NAWM measured by DTI may have predictive value of the subsequent lesion activity and evolution.
DTI studies in different phenotypes of MS—Previous studies have suggested that DTI may enable differentiation of more specific distinction of clinical subgroups than conventional MRI. There is a negative correlation between MD and the degree of hypointensity of lesions on T1-weighted (T1W) images27,32 and diffusivity is found significantly higher in SP-MS lesions than in RR-MS lesions,27 suggesting that the severity of microstructural damage of lesions in these 2 phenotypes may be different. This is in agreement with the findings of more hypointense lesions and more severe disability in SP-MS as compared with RR-MS. In histogram analysis studies, the whole-brain MD histogram in SP-MS patients was shifted to higher abnormal values compared with those in RR-MS patients.33 Although patients with early RR-MS may not differ from those in normal controls of DTI-derived measurements in normal-appearing brain tissues,32,39,46 patients with SP-MS significantly differed from the control subjects and patients with RR-MS.46,47 The correlation between DTI measures and clinical disability is also found to be stronger in SP-MS patients, suggesting a role for DTI in monitoring advanced phases of the disease.19
The PP-MS group has a unique clinical course and usually appears with atypical clinical and MRI features. Although during the disease course fewer lesions develop and there is little gadolinium enhancement,48 the patients with PP-MS usually demonstrate severe clinical disability. Several studies have investigated the DTI abnormalities in NAWM and NAGM and found small but widespread MD and FA changes in PP-MS as compared with healthy controls.20,24,46,49,50 Importantly, the diffuse abnormalities in normal-appearing brain tissues measured by DTI may contribute to the severe disability that patients with PP-MS often develop, despite a paucity of lesions on conventional MRI. Significant correlations between lesion load and DTI abnormalities in the normal-appearing brain tissues were observed in patients with RR-MS and SP-MS, but not in patients with PP-MS.49,51 These microscopic changes in these patients seem to be independent of the extent of T2-visible abnormalities. However, when compared with other subtypes, the degree of DTI abnormality in normal-appearing brain tissues in PP-MS is still controversial, and clarification is needed from further studies with larger patient samples.
DTI fiber tractography in MS—Recently, there has been interest in using fiber tractography obtained from DTI datasets in characterizing white matter tract directionality and integrity in relation to MS lesions.52,53 It has been found that lesions can be shown to transect white matter fiber tracts in a similar manner to that of brain tumors (Figure 2). Fiber tractography has a potential role in quantifying the degree of axonal loss and demyelination within different lesion types and NAWM. The differences in white matter tract disruption can be visualized directly, which may help to explain the association between lesion type and location with clinical symptomatology and may help in monitoring disease progression. In a review of 10 patients with RR-MS, a positive correlation between the number of fiber tracts (FT) and FA (P <0.0001) and a negative correlation between FT and MD (P <0.0001) were found. A negative correlation between FT and lesion size (P = 0.0038) was also reported, which suggests that lesion size may affect the number of fibers transected.54 Compared with NAWM (mean FT: 29.8, FA: 0.41, MD: 0.84), lesions were associated with significantly lower numbers of FT and FA, but significantly higher MD (mean FT: 21.4, FA: 0.37, MD: 1.19). Differences between lesion types were also noted: isointense lesions (mean FT: 25.2, FA: 0.39, MD: 1.10); hypointense lesions (mean FT: 19.4, FA: 0.37, MD: 1.24); and enhancing lesions (mean FT: 11.0, FA: 0.19, MD: 1.33).
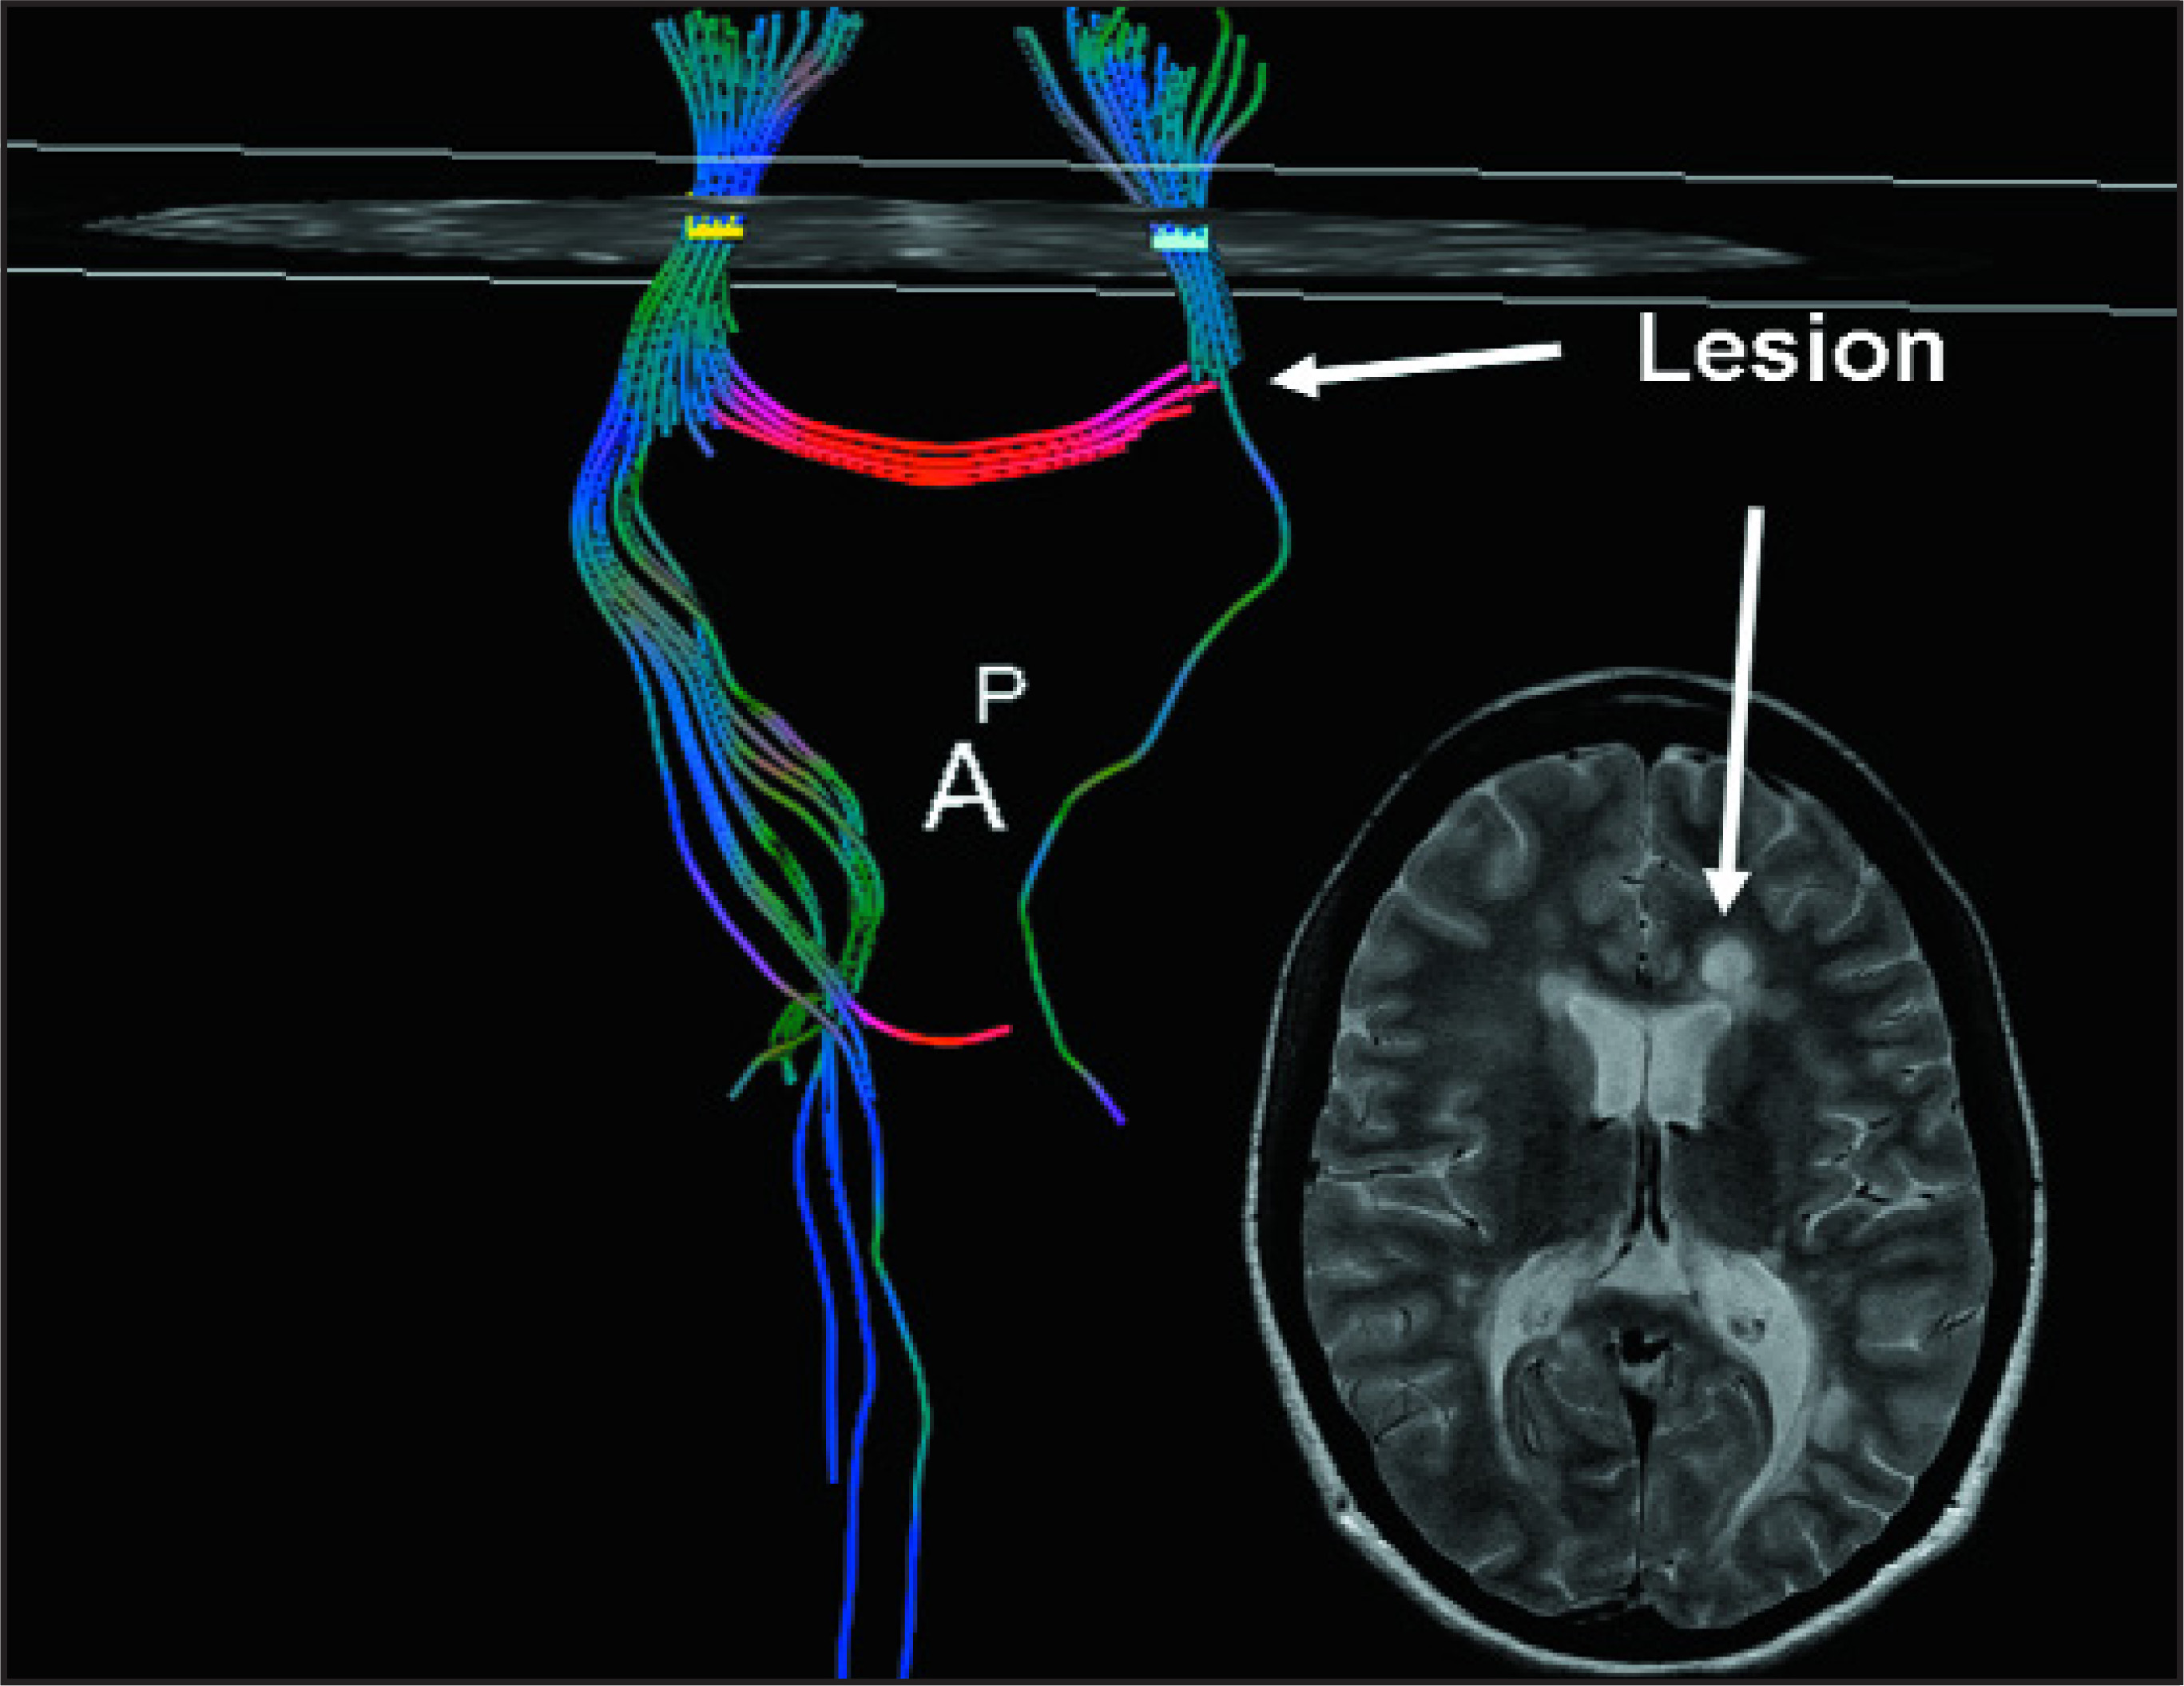
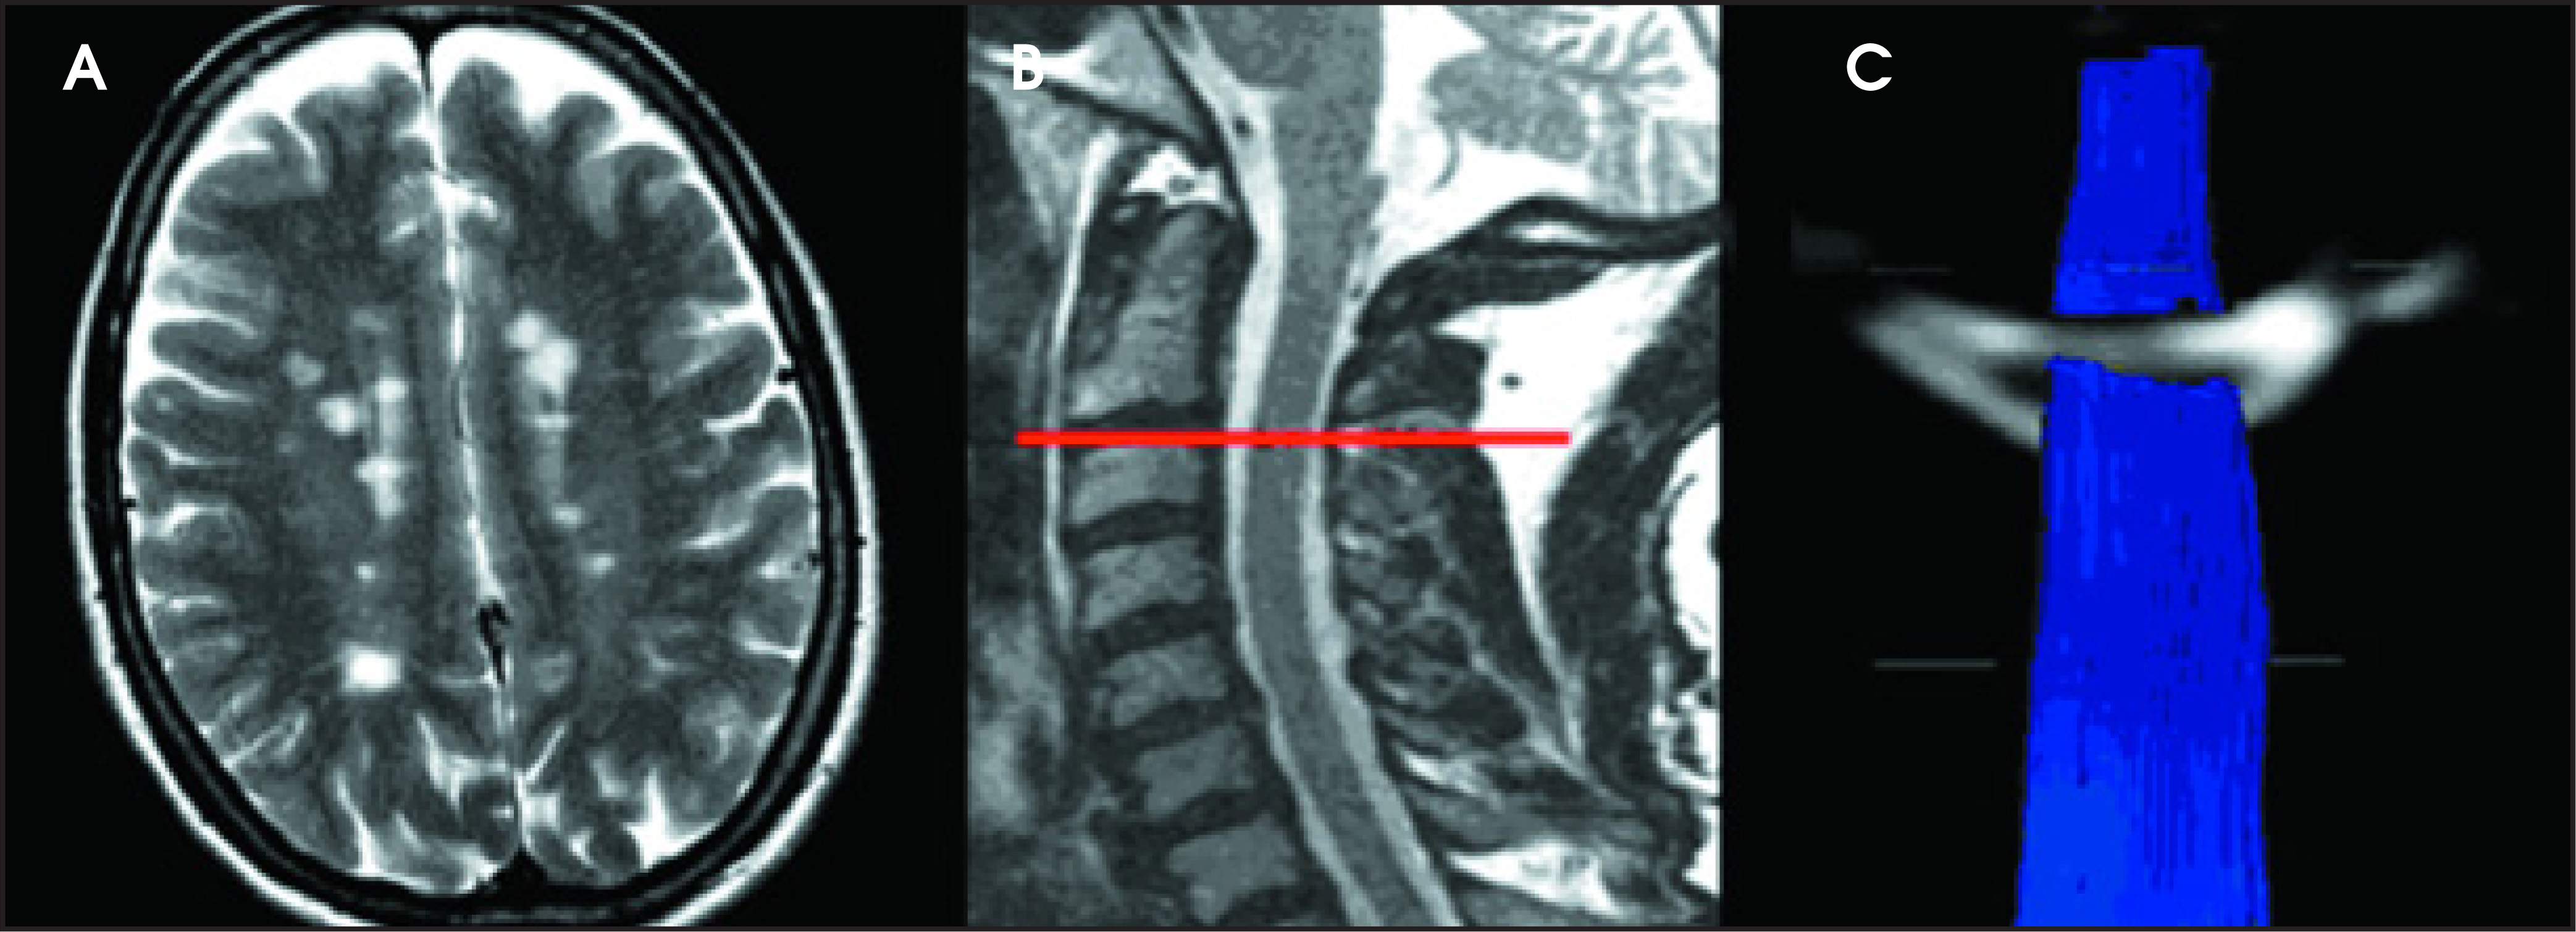
The measurement of the lesion load by conventional MR imaging has been pursued with the aim of determining the severity of disease and response to therapy. Because the hallmark of MS is multifocal lesions that are characterized by inflammatory demyelinating changes that primarily involve the white matter tracts in the brain, lesions tend to result in wallerian degeneration of remote white matter tracts. This can cause microscopic involvement of distant but contiguous white matter tracts without evidence of abnormal signal.15 Fiber tractography has the potential to delineate the corticospinal tract from the cerebral peduncle in the brainstem through the internal capsule to cerebral cortical gyri based on the multiple-ROI technique.52,53 The degree of fiber tract loss in corticospinal tracts at the level of the brainstem in MS patients is likely to relate to the lesion load in the supratentorial brain. The FA was significantly lower (FA = 0.52) in patients with a higher lesion load (volume >1360 mm3) as compared with those patients (FA = 0.63) with a lower lesion load (P = 0.03). Correspondingly, there were fewer fibers generated in the corticospinal tracts in patients with a higher lesion load (Figure 3). Also, patients with lesions in the corticospinal tracts showed lower FA values and a lower number of fiber tracts as compared with those who don’t have lesions on this pathway. This suggests that fiber tractography can provide a method for quantifying wallerian degeneration and axonal transection from remote lesions in MS.
Normal pressure hydrocephalus and Alzheimer’s disease
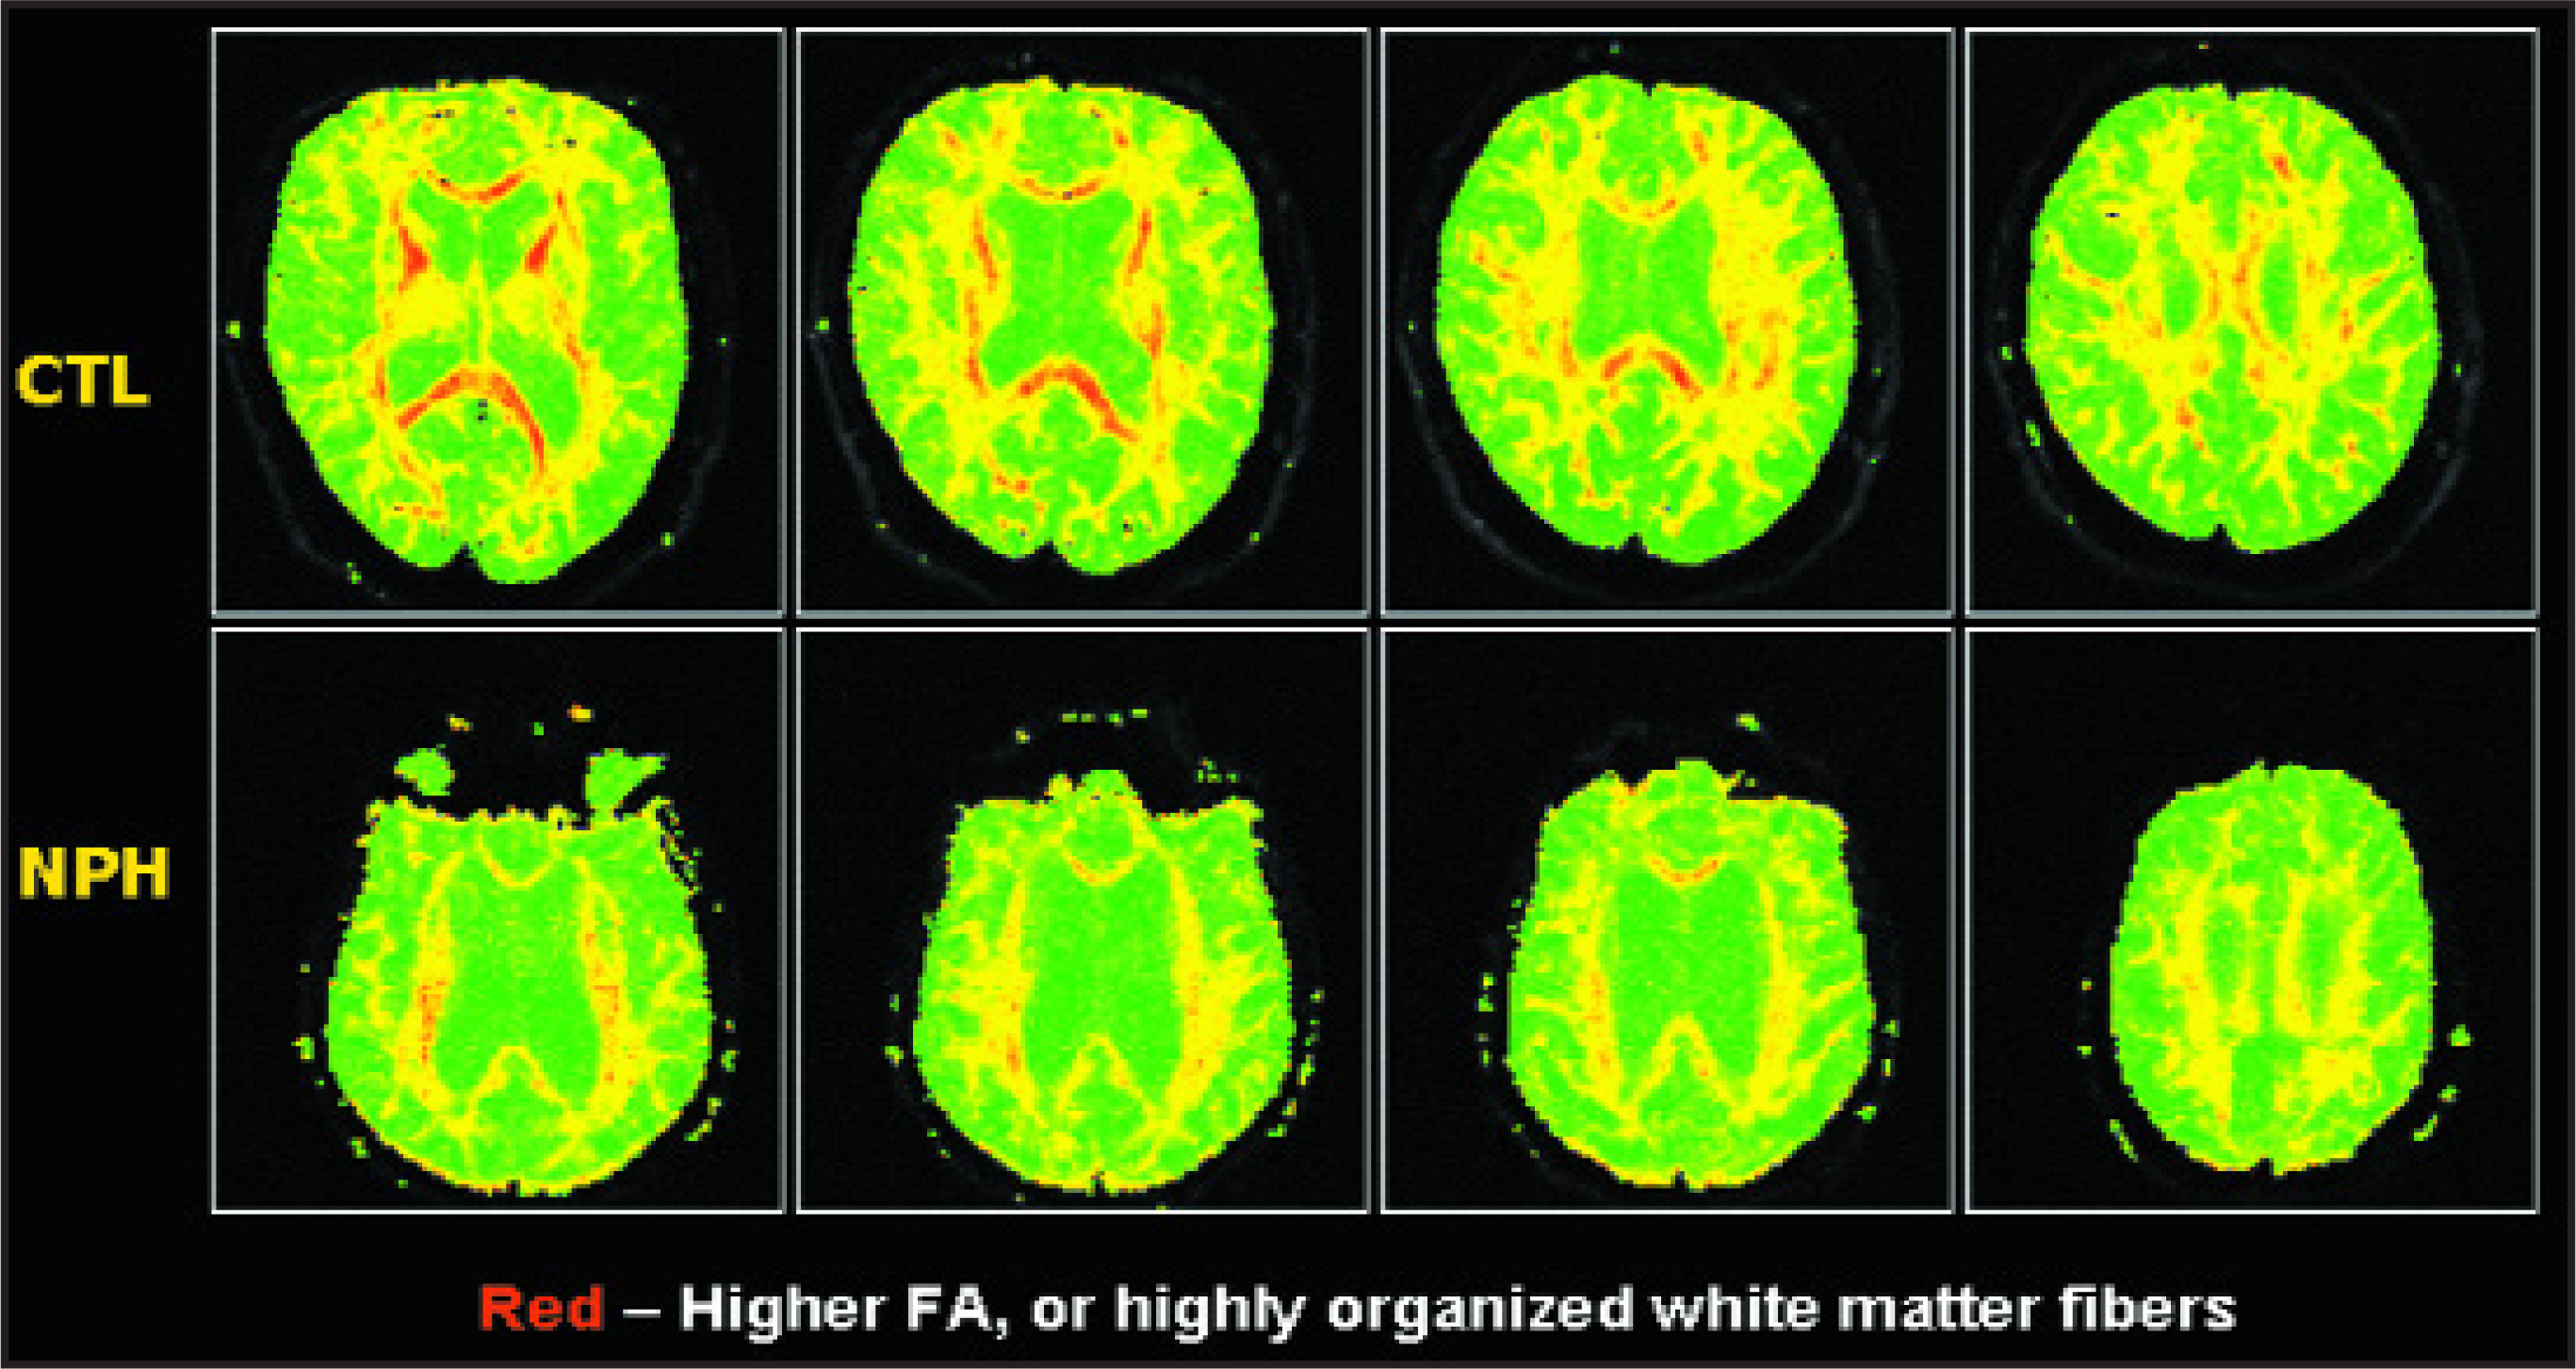
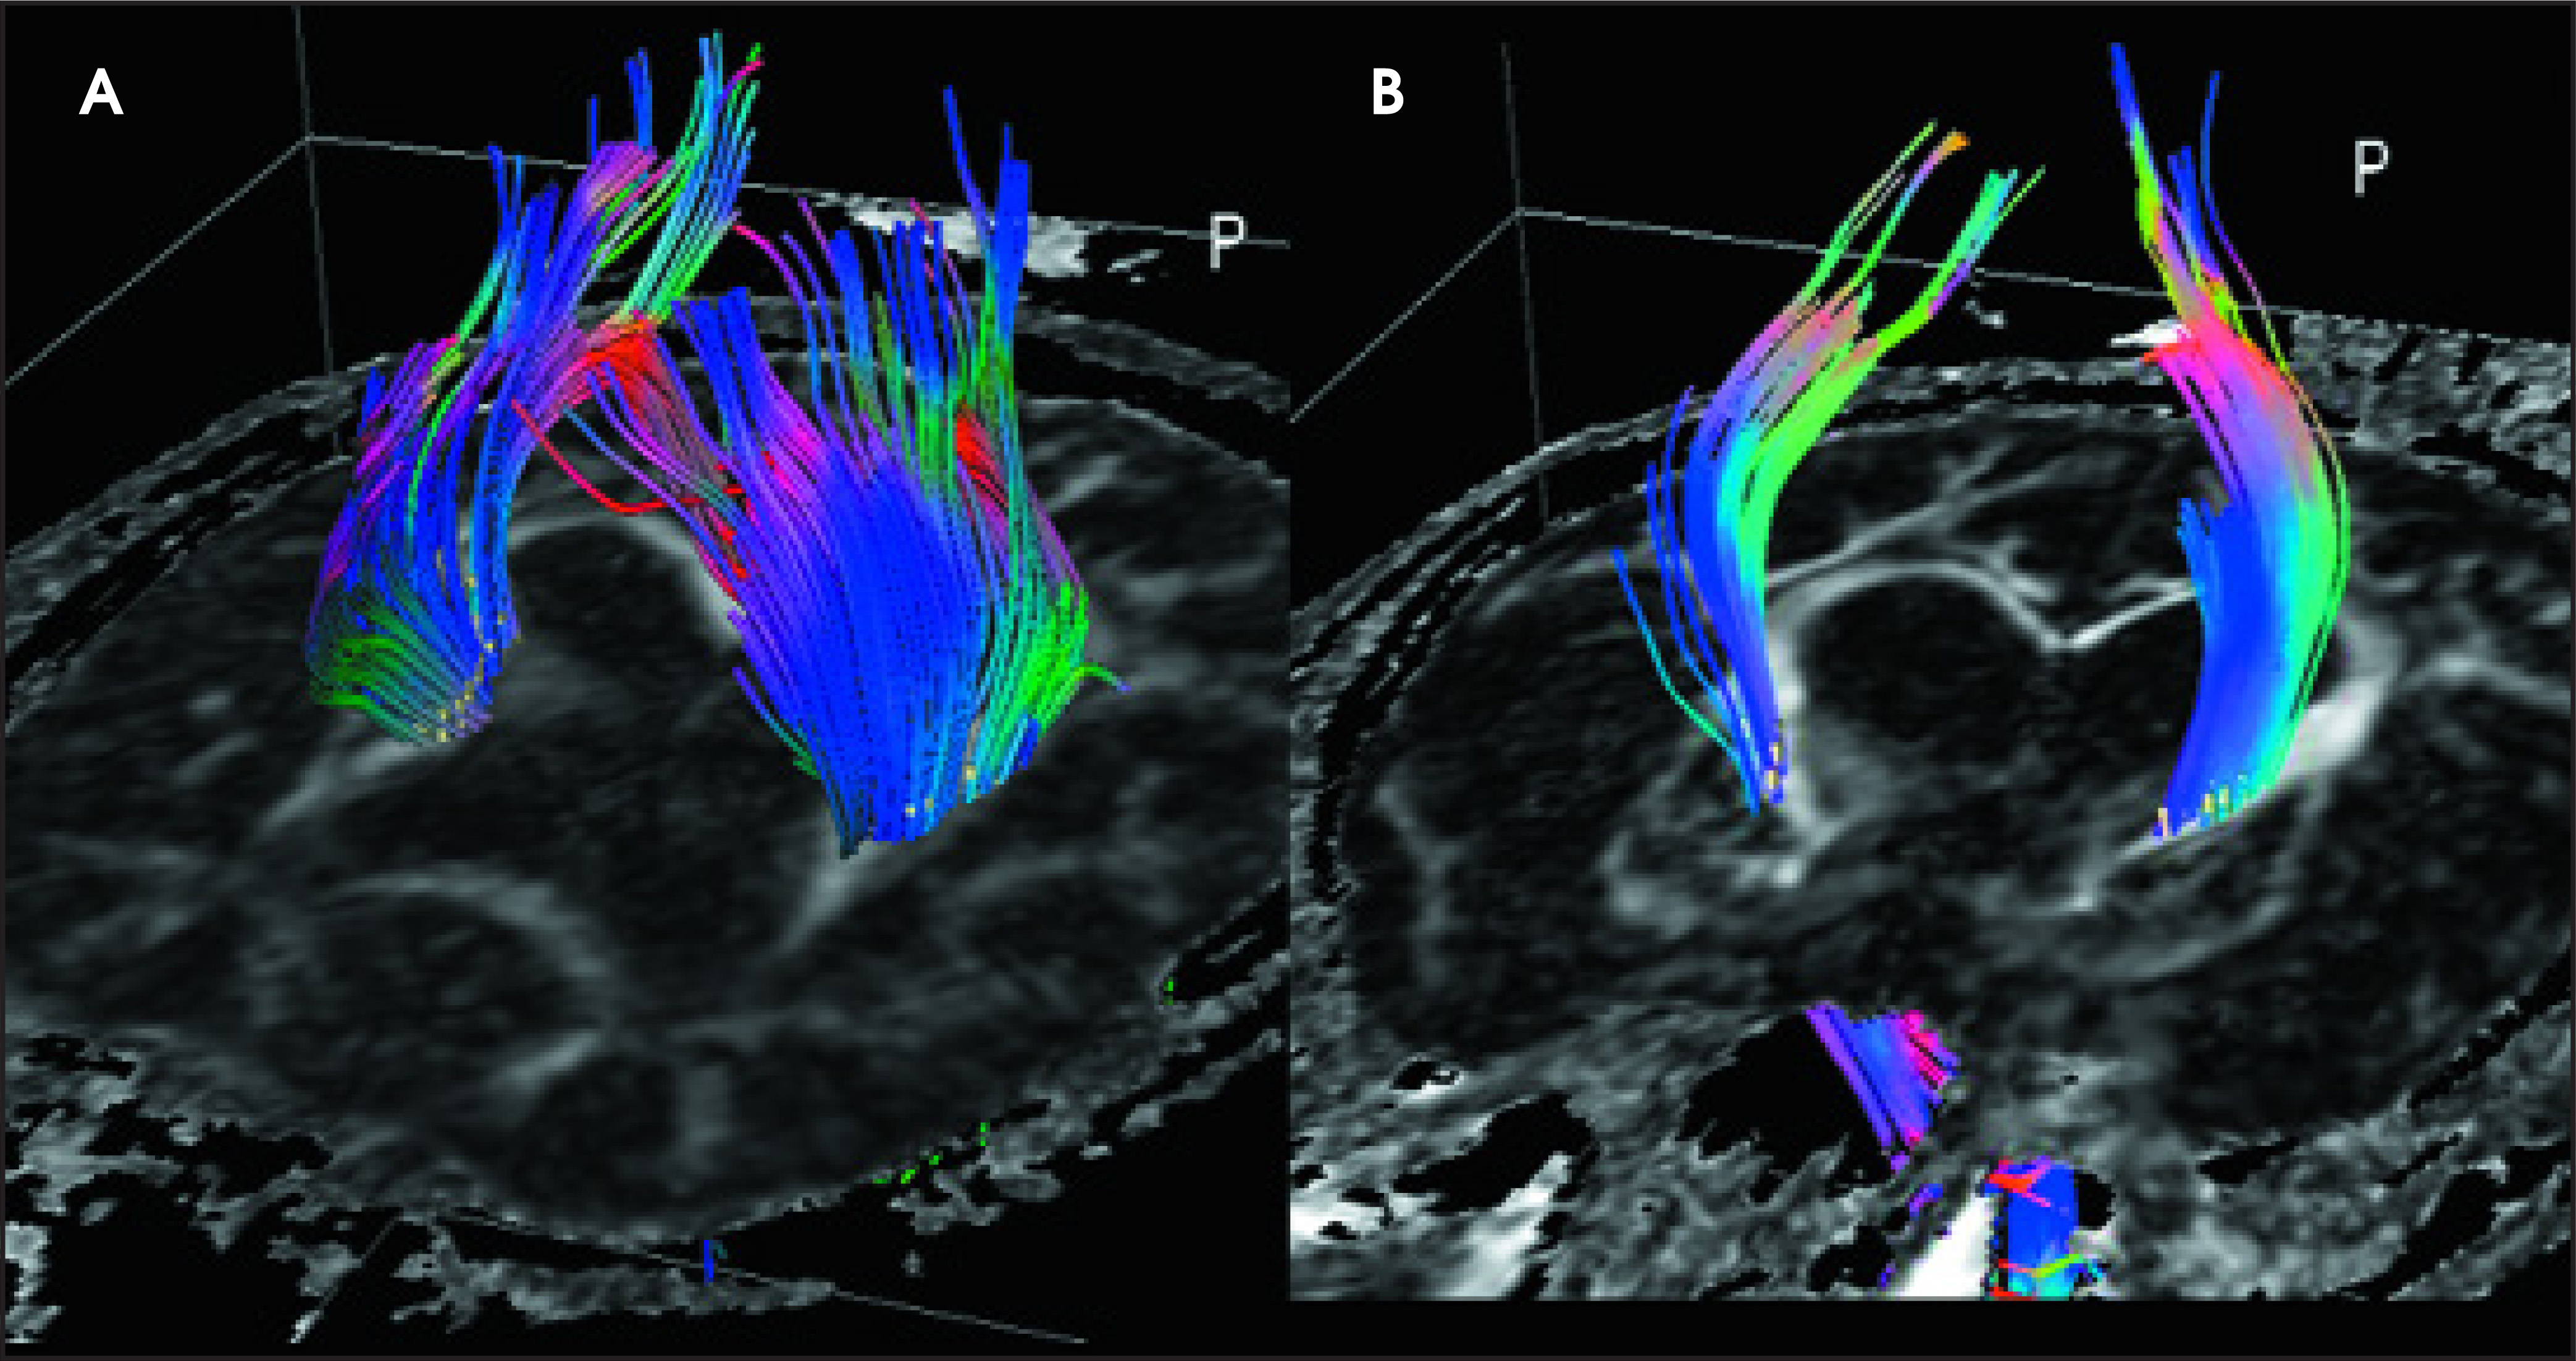
Recently, we investigated the correlation between the clinical symptoms of normal-pressure hydrocephalus (NPH), DTI measurements, and findings of fiber tractography in the motor tracts. The mean FA measured at the genu of the internal capsule in NPH patients with significant gait disturbance was significantly lower than that found in patients with Alzheimer’s disease (AD) (Figure 4). Notably, NPH patients with only minimal gait disturbance have FA values in the same range as asymptomatic and Alzheimer’s disease patients. There is also a decrease in the number of fiber tracts visualized in the standardized ROI of maximal FA in the genu of the internal capsule in NPH patients with severe gait disturbance when compared with NPH patients with a similar degree of ventriculomegaly and minimal gait symptoms as well as with patients with Alzheimer’s disease (Figure 5). We concluded that the degree of gait disturbance correlates with measurements of FA and MD and the number of visible tracts in the motor areas of the brain. This has implications for determining the severity of neurologic impairment, evaluating the response to therapy (such as ventricular shunting), and in follow-up assessement of patients with NPH.55
Tumors: preoperative planning and postoperative imaging
In brain tumor imaging, the neuroradiologist has multiple objectives. First, we aim to make a specific diagnosis, namely to differentiate between tumor and nontumoral disease. Second, if the diagnosis is glioma, then determination of the underlying tumor biology or grade is important to determine the most appropriate therapy and surgery. Third, prior to therapy, the surgeon or radiation oncologist should determine the true extent of disease for surgical resection or radiation portal design by characterizing the peritumoral region. Last—but certainly not least—after surgery or radiation, differentiation between residual/recurrent tumor versus radiation/therapeutic necrosis is important. Diffusion tensor imaging has been utilized in each of these settings to determine if it can be useful in tumor imaging.
As mentioned previously, DWI can be used to differentiate pyogenic abscess from other ring-enhancing mass lesions. Desprechins et al56 reported that pyogenic abscesses demonstrate diffusion restriction when compared with necrotic gliomas and metastases. Recent studies that investigated the use of DTI for classifying glioma grade have shown mixed findings. Inoue et al57 studied 41 patients with histologically proven gliomas and measured FA and MD within solid portions of the tumors. Their findings suggested, similarly to ours, that FA was significantly decreased in both low- and high-grade tumors as compared with NAWM, and that FA values were higher within anaplastic tumors than within low-grade lesions. Inoue’s group suggested that the histologic characteristics of high-grade malignancies (including endothelial proliferation and pseudopalisading) may be responsible for the increased FA indicative of histologic organization. They concluded that FA could be used to differentiate tumor grade preoperatively, but that MD was not useful in differentiating low-grade from high-grade gliomas.
Goebell et al58 investigated regional differences in fractional anisotropy between World Health Organization (WHO) grade II and grade III gliomas and calculated FA ratios with normal-appearing white matter within the contralateral hemisphere to correct for normal variation of anisotropy in different regions of the brain. They found a significant difference between low-grade and anaplastic tumor architecture only in comparisons made from the border of the tumor. They postulated that the center of both low-grade and anaplastic gliomas were characterized by disorganization of myelinated fibers (and, therefore, no difference in FA was found), and the difference in FA at the tumor border could be attributed to the relative preservation of fiber tracts in low-grade lesions compared with their anaplastic counterparts. They recognized that 25% of the patients they studied who had anaplastic lesions had received radiation therapy, and that may have influenced the FA measurements of both the tumor and surrounding white matter. This group placed only 1 ROI in each of the tumor areas, and heterogeneity within the solid portion of tumor may have affected their results. Our own results have shown that FA can be used to distinguish between low-grade and anaplastic glial brain tumors preoperatively, with FA being significantly higher in central regions of high-grade tumors than in low-grade tumors. The finding that FA within high-grade tumors is significantly closer than low-grade tumors to the anisotropy of normal-appearing white matter suggests that FA within the tumor is higher in anaplastic lesions, which is possibly explained by endothelial proliferation, pseudopalisadation, and extracellular matrix metalloproteases of these anaplastic tumors.
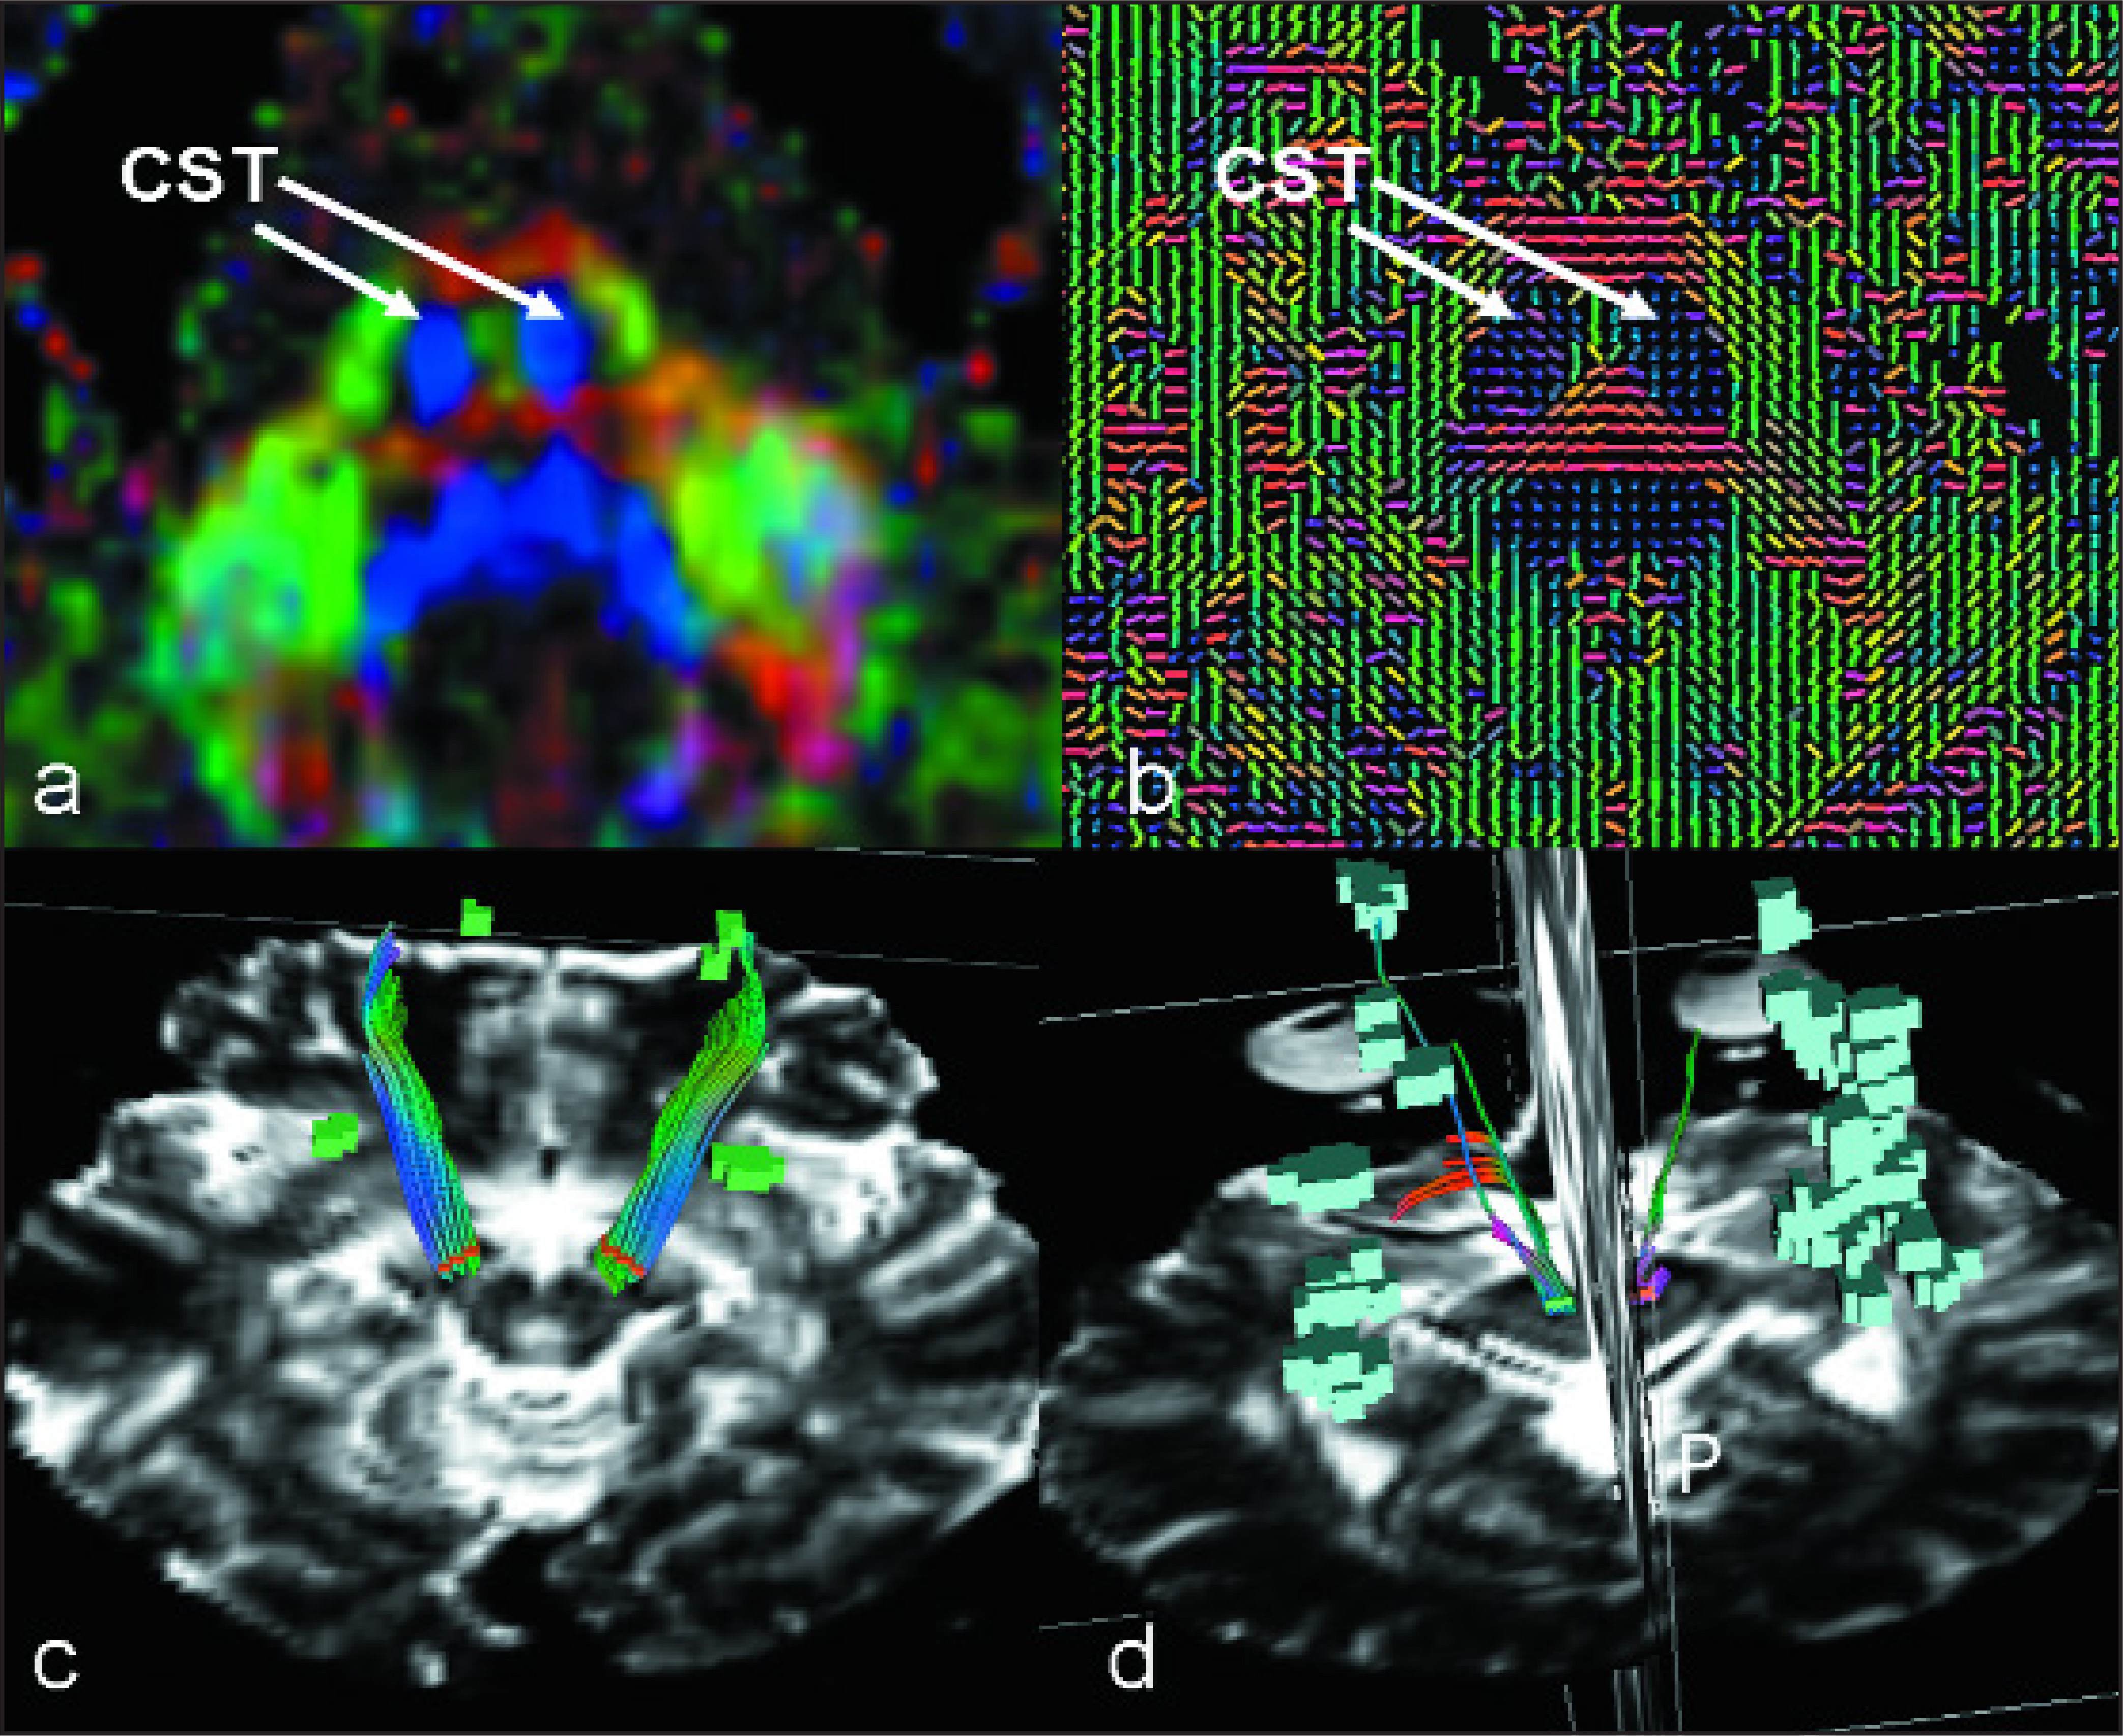
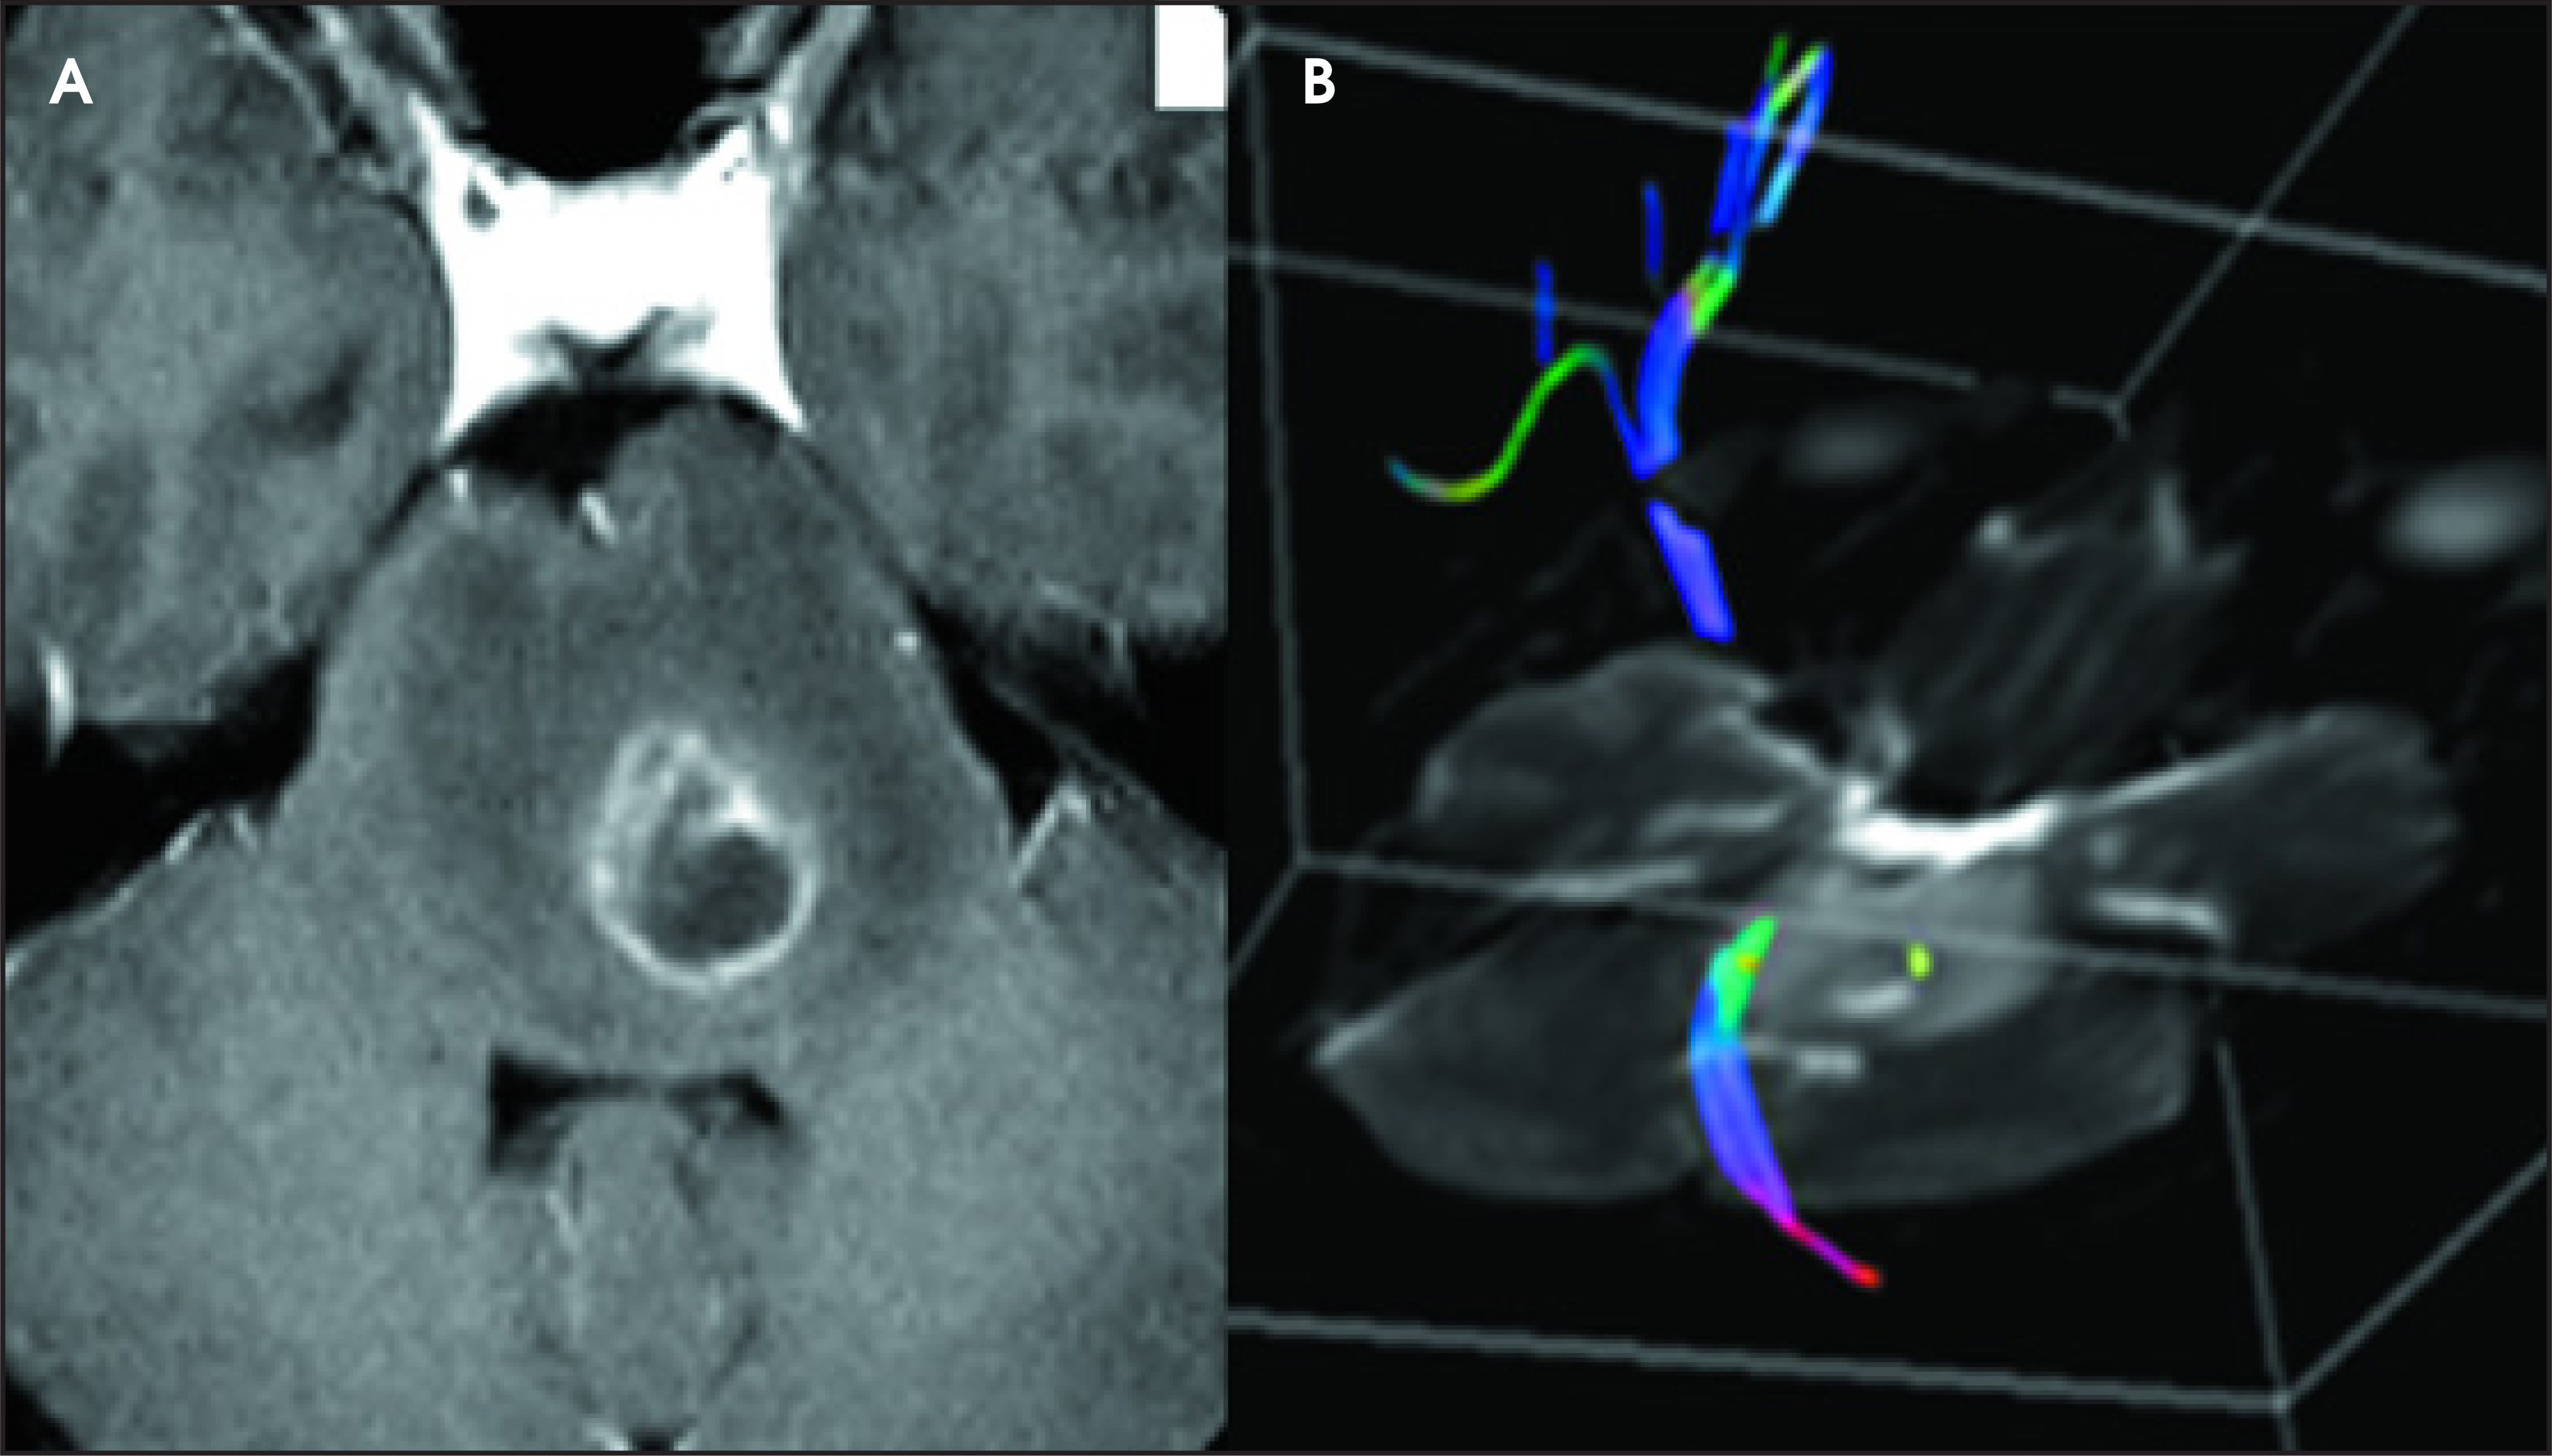
Recent studies that evaluated the peritumoral region have shown an overall increase in MD in high-grade gliomas compared with metastases.57,59-62 This is thought to reflect the relative cellularity of the peritumoral region of infiltrating gliomas versus the vasogenic edema surrounding circumscribed lesions, such as metastases and meningiomas.63 In a similar fashion, Jellison et al1 and Field et al64 categorized fiber tracts using FA and MD measurements compared with the contralateral side in addition to FA color-map findings, in order to divide fiber tracts into 4 different patterns: 1) normal or nearly normal FA and ADC, with abnormal tract location or tensor directions attributable to bulk mass displacement; 2) moderately decreased FA and increased ADC with normal tract locations and tensor directions; 3) moderately decreased FA and increased ADC with abnormal tensor directions; and 4) near isotropy. They then suggest that these 4 patterns correspond to 4 different pathologic states, which allows for determination of the tumor type, the tumor biologic, and the extent of tumoral infiltration. Many aspects of these investigations are still being studied and neurosurgeons are becoming more aware of the clinical utility of this information in pre- and intraoperative planning.65,66 More recently, we have also shown that DTI metrics and tractography findings correlate with neurologic deficits and clinical outcome in patients with brainstem/posterior fossa tumors and that individual eigenvalues provide more specific correlates than MD and FA to clinical findings and outcome. Specifically, we learned that abnormalities of DTI metrics in the motor tracts correspond to contralateral weakness on physical examination and that DTI metrics, including eigenvalues, can predict outcome (Figures 6 and 7).
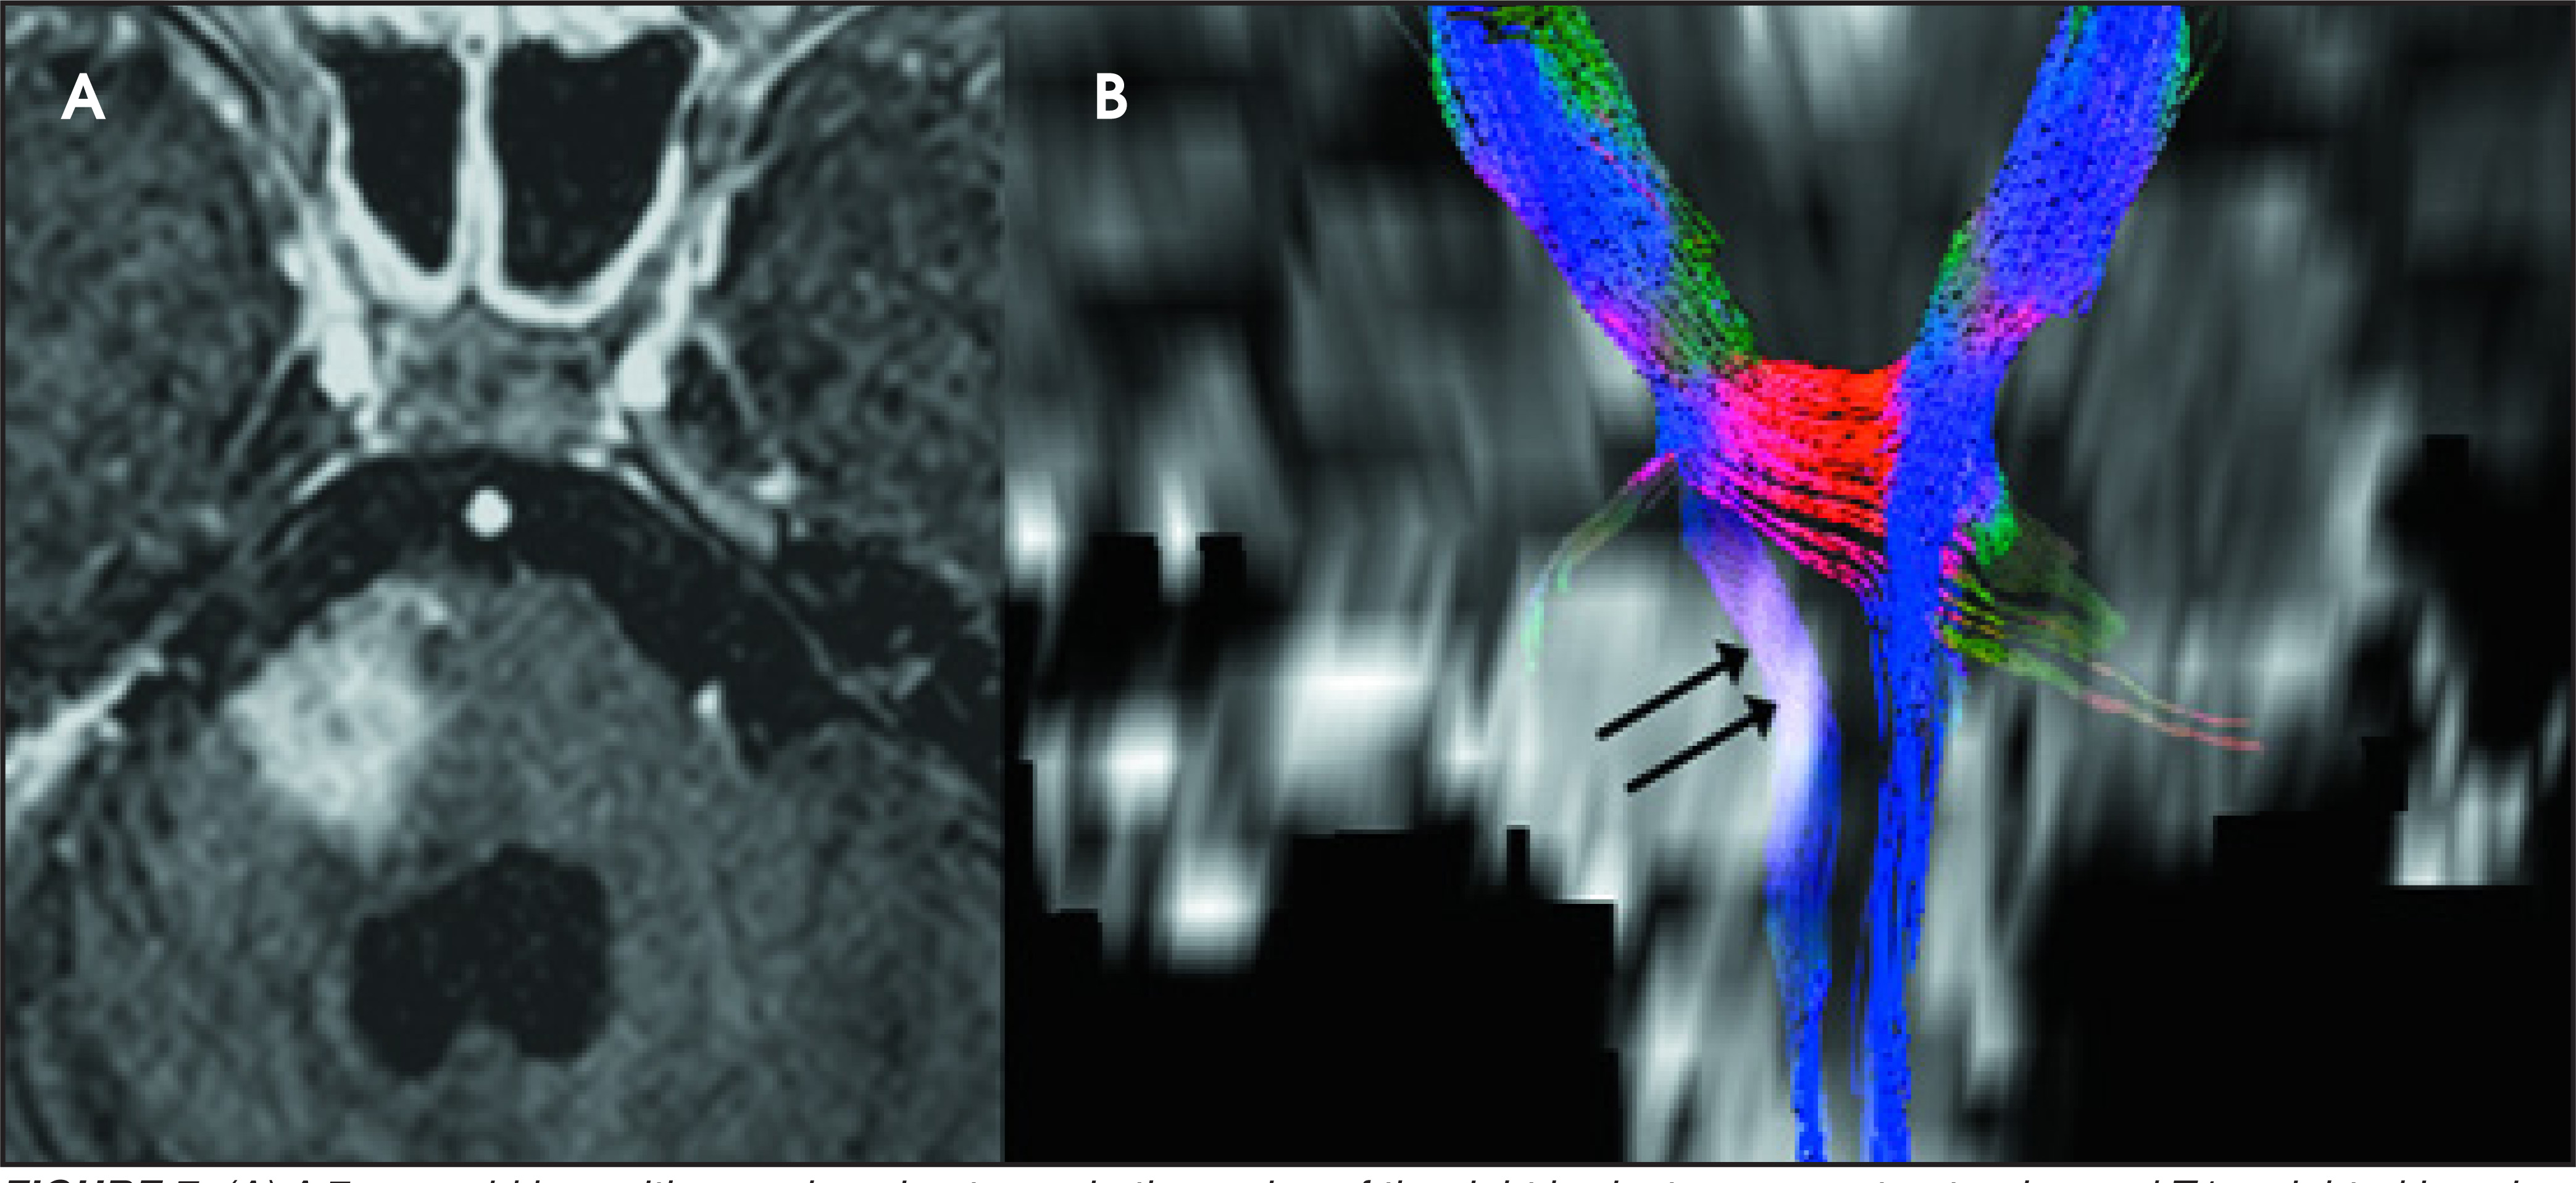
Following therapy, which may include surgery, radiation, and chemotherapy, the posttreatment MRI scan often shows evidence of enhancement, which may represent residual/recurrent tumor or post-therapeutic changes. Although perfusion MRI is most likely the more sensitive and specific test to differentiate these pathologies, a number of investigators have utilized DTI in this setting. Diffusion has been shown to increase following cell death, and changes in ADC were found to be useful in predicting response to therapy.67
Spinal cord DTI
Diffusion tensor imaging in the spinal cord has recently received new interest. However, obtaining spinal cord DTI has been a challenge because of its inherent technical difficulty. The spinal cord’s small size requires the use of small voxel sizes for spatial resolution, decreasing the signal-to-noise ratio. Images may be degraded because of macroscopic motion related to the surrounding cerebrospinal fluid (CSF), and, in the case of cervical and thoracic regions, patient breathing and swallowing may further increase the degradation. In addition, local field inhomogeneities prevent efficient rephasing of proton spins, thereby lessening the image resolution. Because of these technical challenges, limited data exist regarding not only pathologic processes, but also normal variants. This difficulty leads to a relative paucity of information regarding normal cervical spinal cord gray and white matter regional DTI metrics (FA and MD) and minor and major eigenvectors in the axial plane. With faster alternative techniques being developed for acquiring DTI data sets (such as multishot echoplanar imaging, diffusion-weighted periodically rotated overlapping parallel lines with enhanced reconstruction [PROPELLER], and spin-echo navigator spiral DTI) and parallel imaging methods (such as sensitivity-encoding [SENSE]), acquisition times have been reduced to allow data to be acquired from structures like the human spinal cord. The spinal cord has intrinsic cord motion and CSF pulsation that makes acquisition of DTI metrics difficult unless faster sequences are utilized. In the absence of spinal cord signal abnormality at conventional MR examination, DTI in the spinal cord has shown a significantly decreased FA in the lateral and posterior tracts in the cervical spinal cord of MS patients. These findings may be clinically useful in differentiating primary from secondary causes of demyelination, such as cervical spondylosis, which seems to have a propensity for involving the posterior and central regions of the spinal cord. Furthermore, DTI may allow characterization of different spinal cord pathways within the spinal cord, such as the anterior and posterior column pathways, which again will have diagnostic, prognostic, and therapeutic implications.
We have demonstrated regional differences in DTI metrics in normal volunteers that can be explained by intrinsic differences in the white matter tracts, such as density, diameter, and myelination.68 These regional differences in FA have been correlated with the axonal density, the axonal diameter, the degree of myelination, and the integrity and density of cytoskeletal structures in the rat spinal cord.69,70
A number of investigators have also characterized DTI metrics in various pathologies of the spinal cord ranging from spinal cord tumors and demyelination to cervical degenerative cord narrowing. The most common spinal cord tumors are astrocytomas and ependymomas. Ependymomas arise from the ependymal cells that line the central canal and grow concentrically, displacing the fiber tracts, whereas astrocytomas are typically infiltrating and arise from the astrocytic cells, typically with an eccentric location. Diffusion tensor imaging and fiber tractography can be used to characterize spinal cord lesions to determine whether these are infiltrating or displacing fiber tracts within the cord.71
The radiologic characterization of cervical spondylosis remains challenging, as the correlation between anatomic abnormality, clinical disability, and spinal cord function is limited. Diffusion tensor imaging has shown promise in the evaluation of white matter tract integrity and has been shown to be able to detect changes in the spinal cord in spondylosis,72,73 which typically consist of decreased FA and increased MD. These changes in FA and MD may not be sufficient to differentiate between potentially reversible edema and irreversible gliosis in patients with spondylosis. However, the evaluation of major (E1) and minor (E2, E3) eigenvalues, from which FA is calculated, may assist in identifying subgroups of patients. We compared diffusion tensor metrics in the white matter tracts of the cervical spinal cord in patients with severe multilevel spondylosis with normal volunteers, evaluating changes in FA and MD as well as the major and minor eigenvalues. We found increased minor eigenvalues in the setting of chronic spondylosis, with preservation of the major eigenvalue. In the spinal cord, the minor eigenvalues typically correspond to transverse diffusion, perpendicular to the longitudinal axis of the spinal cord. Animal studies have suggested that increases in the minor eigenvalues occur in the setting of demyelination, increased axonal diameter, and additional factors, including protein integrity.69 The increased transverse diffusion seen in the normal-appearing spinal cord of patients with cervical spondylosis suggests possible microscopic demyelination and axonal compromise.
Patients who present with abnormal spinal cord signal sometimes also pose a diagnostic dilemma. Diffusion tensor imaging and fiber tractography have been shown to provide physiologic information regarding cerebral white matter disorganization, which precedes abnormalities seen on conventional imaging. By comparing DTI metrics spatially within both the gray matter and white matter tracts of the cervical spinal cord in normal volunteers and in patients with MS in regions of the cord that appear normal on conventional MR, we hoped to determine the spatial changes in DTI metrics within the spinal cord. The FA was found to be significantly lower in the normal-appearing spinal cord of MS patients in the lateral, posterior, and central cord compared with controls (Figure 8). The measurement of DTI metrics in the cervical spinal cord may prove useful in aiding the diagnosis of MS, correlating with clinical disability, and monitoring disease progression and therapeutic effect.74
Future investigation
In recent years, advances in DTI and fiber tractography have enabled their application as clinical tools in the assessment of CNS diseases. Using DTI, several key elements will emerge in the future study CNS diseases. First, since highly ordered white matter fiber tracts have components of both axon and myelin (and DTI can evaluate properties that vary with the space, shape, and direction of the compartment that is accessible to the water molecule), DTI has the potential to decode these properties in order to differentiate the origin of tissue injury, to see whether only myelin or both myelin and axonal injury occurs. This has been shown in some experimental work by decoding axial and radial diffusivity of the optic nerve in animal studies. The application in human brain will have clinical significance in terms of characterizing the severity of tissue injury and differentiating axonal injury, demyelination, and remyelination during lesion evolution. In part, the separation of DTI information into individual directional eigenvalues may impart more specificity in characterizing the underlying pathophysiology. Second, the emerging technique of fiber tactography from DTI data has a major impact on visualizing and quantifying axonal fibers in vivo. Future research using fiber tracking technology can provide direct evidence not only for clinical manifestations caused by path ology at the primary site where axonal injury occurs, but also for secondary de generative processes caused by axonal pathway transection at a distant site. High angular resolution diffusion imaging (HARDI) techniques will allow for the study of complex white matter architecture, where multiple crossing fibers may intersect in different directions within a single voxel.10 Third, validation of DTI metrics in normal tissue and histopathological validation of DTI metrics for various pathologies is a challenge but will help resolve many questions regarding the specific characterization of tissue damage at different stages of different disease processes. Comparing DTI metrics with other advanced MRI techniques will also help to define the value of DTI in the CNS. For example, we have recently correlated DTI and perfusion metrics in the normal-appearing corpus callosum of RR-MS patients. We found that decreasing perfusion is correlated with decreasing mean diffusion. These findings appear to be consistent with a primary ischemic phenomenon rather than a secondary hypoperfusion phenomenon from wallerian degeneration.75 Lastly, it is important to have sufficient standardization of DTI techniques for use in future clinical trials, including the assessment of inherent variation in both cross-sectional and longitudinal data as well as determination of the most optimal imaging sequence, technique, and postprocessing methodologies.
Conclusion
The ability of DTI to measure microscopic diffusion of water molecules and their interaction with cellular and extracellular structures provides a unique tool for characterizing and defining the extent of pathologic and microstructural alteration that occurs in diseases of the CNS. We have reviewed only a short list of CNS diseases that could potentially be investigated with DTI. Diffusion tensor imaging metrics and fiber tracking of different pathologies allows more accurate characterization of intrinsic integrity of tissues, including cellular density and architecture. Together with perfusion MR imaging, magnetization transfer imaging, and MR spectroscopy, DTI has made a significant contribution to the evaluation of “invisible” disease burden or occult lesions in normal-appearing CNS tissues (ie, NAWM, NAGM). The quantitative nature of DTI will play a role in assessing the outcome of clinical trials, as an additional surrogate marker in monitoring the therapeutic response. Careful studies to validate DTI and its metrics will allow it to become more applicable clinically and can affect therapeutic decision-making and eventually patient outcome. This will ensure future acceptance of the implementation of tools such as DTI for use in determining the safety and efficacy of novel therapies. Future longitudinal studies and histopathological validative data are critically important to improve our understanding of DTI in quantifiying patho-physiological changes in the CNS.
Acknowledgments
The authors wish to acknowledge the assistance of Michael Kim, MD, James Provenzale, MD, Vadim Spektor, MD, Yvonne Lui, MD, and Abraham Padua, BSRT, for their contribution to the text and illustrations in this manuscript.
References
- Jellison B, Field A, Medow J. Diffusion tensor imaging of cerebral white matter: A pictorial review of physics, fiber tract anatomy, and tumor imaging patterns. AJNR Am J Neuroradiol. 2004;25:356-369.
- Mori S, Kaufmann W, Davatzikos C. Imaging cortical association tracts in the human brain using diffusion-tensor-based axonal tracking. Magn Reson Med. 2002;47:215-223.
- Mori S, Frederiksen K, van Zijl P. Brain white matter anatomy of tumor patients evaluated with diffusion tensor imaging. Ann Neurol. 2002;51:377-380.
- Wakana S, Jiang H, Nagae-Poetscher L. Fiber tract-based atlas of human white matter anatomy. Radiology. 2004;230(1):77-87.
- Salamon N, Sicotte N, Alger J. Analysis of the brain-stem white-matter tracts with diffusion tensor imaging. Neuroradiology. 2005;47:895-902.
- Wheeler-Kingshott C, Hickman S, Parker G. Investigating cervical spinal cord structure using axial diffusion tensor imaging. NeuroImage. 2002;16(1):93-102.
- Neil J, Shiran S, McKinstry R. Normal brain in human newborns: Apparent diffusion coefficient and diffusion anisotropy measured by using diffusion tensor MR imaging. Radiology. 1998;209(1):57-66.
- Mukherjee P, Miller J, Shimony J. Normal brain maturation during childhood: Developmental trends characterized with diffusion-tensor MR imaging. Radiology. 2001;221:349-358.
- Mukherjee P, Miller J, Shimony J. Diffusion-tensor MR imaging of gray and white matter development during normal human brain maturation. AJNR Am J Neuroradiol. 2002;23:1445-1456.
- Mukherjee P, McKinstry R. Diffusion tensor imaging and tractography of human brain development. Neuroimaging Clin N Am. 2006;16(1).
- Albayram S, Melhem E, Mori S. Holoprosencephaly in children: Diffusion tensor MR imaging of white matter tracts of the brainstem–Initial experience. Radiology. 2002;223:645-651.
- Guo A, Petrella J, Kurtzberg J, Provenzale J. Evaluation of white matter anisotropy in Krabbe disease with diffusion tensor MR imaging: Initial experience. Radiology. 2001;218:809-815.
- McGraw P, Liang L, Escolar M. Krabbe disease treated with hematopoietic stem cell transplantation: Serial assessment of anisotropy measurements–Initial experience. Radiology. 2005;236:221-230.
- Baum H, Rothschild B. The incidence and pre-valence of reported multiple sclerosis. Ann Neurol. 1981;10:420-428.
- Trapp B, Peterson J, Ransohoff R. Axonal transection in the lesions of multiple sclerosis. N Engl J Med. 1998;338:278-85.
- Lublin F, Reingold S. Defining the clinical course of multiple sclerosis. Results of an international survey. National Multiple Sclerosis Society (USA) Advisory Committee on Clinical Trials of New Agents in Multiple Sclerosis. Neurology. 1996;46:907-911.
- Miller D, Grossman R, Reingold S, McFarland H. The role of magnetic resonance techniques in understanding and managing multiple sclerosis. Brain. 1998;121(Pt 1):3-24.
- Miller D, Thompson A, Filippi M. Magnetic resonance studies of abnormalities in the normal appearing white matter and grey matter in multiple sclerosis. J Neurol. 2003;250:1407-1419.
- Filippi M, Cercignani M, Inglese M. Diffusion tensor magnetic resonance imaging in multiple sclerosis. Neurology. 2001;56:304-311.
- Filippi M. Non-conventional MR techniques to monitor the evolution of multiple sclerosis. Neurol Sci. 2001;22:195-200.
- Larsson H, Thomsen C, Frederiksen J. In vivo magnetic resonance diffusion measurement in the brain of patients with multiple sclerosis. Magn Reson Imaging. 1992;10(1):7-12.
- Heide A, Richards T, Alvord E. Diffusion imaging of experimental allergic encephalo-myelitis. Magn Reson Med. 1993;29:478-484.
- Richards T, Alvord E, He Y. Experimental allergic encephalomyelitis in non-human primates: Diffusion imaging of acute and chronic brain lesions. Mult Scler. 1995;1:109-117.
- Droogan A, Clark C, Werring D. Comparison of multiple sclerosis clinical subgroups using navigated spin echo diffusion-weighted imaging. Magn Reson Imaging. 1999;17:653-661.
- Filippi M, Iannucci G, Cercignani M. A quantitative study of water diffusion in multiple sclerosis lesions and normal-appearing white matter using echo-planar imaging. Arch Neurol. 2000;57:1017-1021.
- Roychowdhury S, Maldjian J, Grossman R. Multiple sclerosis: Comparison of trace apparent diffusion coefficients with MR enhancement pattern of lesions. AJNR Am J Neuroradiol. 2000;21:869-874.
- Castriota Scanderbeg A, Tomaiuolo F, Sabatini U. Demyelinating plaques in relapsing-remitting and secondary-progressive multiple sclerosis: Assessment with diffusion MR imaging. AJNR Am J Neuroradiol. 2000;21:862-868.
- Bammer R, Augustin M, Strasser-Fuchs S. Magnetic resonance diffusion tensor imaging for characterizing diffuse and focal white matter abnormalities in multiple sclerosis. Magn Reson Med. 2000;44:583-591.
- Werring D, Clark C, Barker G. Diffusion tensor imaging of lesions and normal-appearing white matter in multiple sclerosis. Neurology. 1999;52:1626-1632.
- Castriota-Scanderbeg A, Fasano F, Hagberg G. Coefficient D(av) is more sensitive than fractional anisotropy in monitoring progression of irreversible tissue damage in focal nonactive multiple sclerosis lesions. AJNR Am J Neuroradiol. 2003;24:663-670.
- Mori S, Itoh R, Zhang J. Diffusion tensor imaging of the developing mouse brain. Magn Reson Med. 2001;46(1):18-23.
- Nusbaum A, Lu D, Tang C, Atlas S. Quantitative diffusion measurements in focal multiple sclerosis lesions: Correlations with appearance on TI-weighted MR images. AJR Am J Roentgenol. 2000;175:821-825.
- Nusbaum A, Tang C, Wei T. Whole-brain diffusion MR histograms differ between MS subtypes. Neurology. 2000;54:1421-1417.
- Cercignani M, Iannucci G, Rocca M. Pathologic damage in MS assessed by diffusion-weighted and magnetization transfer MRI. Neurology. 2000;54:1139-1144.
- Cercignani M, Bozzali M, Iannucci G. Magnetisation transfer ratio and mean diffusivity of normal appearing white and grey matter from patients with multiple sclerosis. J Neurol Neurosurg Psychiatry. 2001;70:311-317.
- Rocca M, Cercignani M, Iannucci G. Weekly diffusion-weighted imaging of normal-appearing white matter in MS. Neurology. 2000;55:882-884.
- Guo A, Jewells V, Provenzale J. Analysis of normal-appearing white matter in multiple sclerosis: Comparison of diffusion tensor MR imaging and magnetization transfer imaging. AJNR Am J Neuroradiol. 2001;22:1893-1900.
- Guo A, MacFall J, Provenzale J. Multiple sclerosis: Diffusion tensor MR imaging for evaluation of normal-appearing white matter. Radiology. 2002;222:729-736.
- Ge Y, Law M, Johnson G. Preferential occult injury of corpus callosum in multiple sclerosis measured by diffusion tensor imaging. J Magn Reson Imaging. 2004;20(1):1-7.
- De Groot C, Bergers E, Kamphorst W. Post-mortem MRI-guided sampling of multiple sclerosis brain lesions: Increased yield of active demyelinating and (p)reactive lesions. Brain. 2001;124(Pt 8):1635-1645.
- Evangelou N, Esiri M, Smith S. Quantitative pathological evidence for axonal loss in normal ap-pearing white matter in multiple sclerosis. Ann Neurol. 2000;47:391-395.
- Ranjeva J, Pelletier J, Confort-Gouny S. MRI/MRS of corpus callosum in patients with clinically isolated syndrome suggestive of multiple sclerosis. Mult Scler. 2003;9:554-565.
- Werring D, Brassat D, Droogan A. The pathogenesis of lesions and normal-appearing white matter changes in multiple sclerosis: A serial diffusion MRI study. Brain. 2000;123(Pt 8):1667-1676.
- Filippi M, Rocca M, Martino G. Magnetization transfer changes in the normal appearing white matter precede the appearance of enhancing lesions in patients with multiple sclerosis. Ann Neurol. 1998;43:809-814.
- Pike G, De Stefano N, Narayanan S. Multiple sclerosis: Magnetization transfer MR imaging of white matter before lesion appearance on T2-weighted images. Radiology. 2000;215:824-830.
- Bozzali M, Cercignani M, Sormani M. Quantification of brain gray matter damage in different MS phenotypes by use of diffusion tensor MR imaging. AJNR Am J Neuroradiol. 2002;23:985-988.
- Nusbaum A. Diffusion tensor MR imaging of gray matter in different multiple sclerosis phenotypes. AJNR Am J Neuroradiol. 2002;23:899-900.
- Thompson A, Kermode A, Wicks D. Major differences in the dynamics of primary and secondary progressive multiple sclerosis. Ann Neurol. 1991;29(1):53-62.
- Rocca M, Iannucci G, Rovaris M. Occult tissue damage in patients with primary progressive multiple sclerosis is independent of T2-visible lesions–A diffusion tensor MR study. J Neurol. 2003;250:456-460.
- Rovaris M, Bozzali M, Iannucci G. Assessment of normal-appearing white and gray matter in patients with primary progressive multiple sclerosis: A diffusion-tensor magnetic resonance imaging study. Arch Neurol. 2002;59:1406-1412.
- Oh J, Henry R, Genain C. Mechanisms of normal appearing corpus callosum injury related to pericallosal T1 lesions in multiple sclerosis using directional diffusion tensor and 1H MRS imaging. J Neurol Neurosurg Psychiatry. 2004;75:1281-1286.
- Ge Y, Tuvia K, Law M. Corticospinal tract degeneration in brainstem in patients with multiple sclerosis: Evaluation with diffusion tensor tractography. Paper 2803 [abstract]. Proc Intern Soc Magn Reson Med. 2005:536.
- Campi A, Staempfli P, Jaermann T. . 2004.
- Soohoo S, Ge Y, Law M. . 2005:108.
- Spektor V, Law M, Golomb L. . 2004.
- Desprechins B, Stadnik T, Koerts G. Use of diffusion-weighted MR imaging in differential diagnosis between intracerebral necrotic tumors and cerebral abscesses. AJNR Am J Neuroradiol. 1999;20:1252-1257.
- Inoue T, Ogasawara K, Beppu T. Diffusion tensor imaging for preoperative evaluation of tumor grade in gliomas. Clin Neurol Neurosurg. 2005;107:174-180.
- Goebell E, Paustenbach S, Vaeterlein O. Low-grade and anaplastic gliomas: Differences in architecture evaluated with diffusion-tensor MR imaging. Radiology. 2006;239:217-222.
- Krabbe K, Gideon P, Wagn P. MR diffusion imaging of human intracranial tumours. Neuroradiology. 1997;39:483-489.
- Sugahara T, Korogi Y, Kochi M. Usefulness of diffusion-weighted MRI with echo-planar technique in the evaluation of cellularity in gliomas. J Magn Reson Imaging. 1999;9:53-60.
- Lu S, Ahn D, Johnson G, Cha S. Peritumoral diffusion tensor imaging of high-grade gliomas and metastatic brain tumors. AJNR Am J Neuroradiol. 2003;24:937-941.
- Lu S, Ahn D, Johnson G. Diffusion-tensor MR imaging of intracranial neoplasia and associated peritumoral edema: Introduction of the tumor infiltration index. Radiology. 2004;232:221-228.
- Law M, Cha S, Knopp E. High-grade gliomas and solitary metastases: Differentiation by using perfusion and proton spectroscopic MR imaging. Radiology. 2002;222:715-721.
- Field A, Alexander A, Wu Y. Diffusion tensor eigenvector directional color imaging patterns in the evaluation of cerebral white matter tracts altered by tumor. J Magn Reson Imaging. 2004;20:555-562.
- Nimsky C, Ganslandt O, Hastreiter P. Preoperative and intraoperative diffusion tensor imaging-based fiber tracking in glioma surgery. Neurosurgery. 2005;56:130-138.
- Nimsky C, Ganslandt O, Hastreiter P. Intraoperative diffusion-tensor MR imaging: Shifting of white matter tracts during neurosurgical procedures–Initial experience. Radiology. 2005;234:218-225.
- Cao Y, Sundgren P, Tsien C. Physiologic and metabolic magnetic resonance imaging in gliomas. J Clin Oncol. 2006;24:1228-1235.
- Hesseltine S, Law M, Lopez S. . 2006.
- Schwartz E, Cooper E, Chin C. Ex vivo evaluation of ADC values within spinal cord white matter tracts. AJNR Am J Neuroradiol. 2005;26:390-397.
- Schwartz E, Chin C, Shumsky J. Apparent diffusion coefficients in spinal cord transplants and surrounding white matter correlate with degree of axonal dieback after injury in rats. AJNR Am J Neuroradiol. 2005;26:7-18.
- Ducreux D, Lepeintre J, Fillard P. MR 5 diffusion tensor imaging and fiber tracking in spinal cord astrocytomas. AJNR Am J Neuroradiol. 2006;27:214-216.
- Facon D, Ozanne A, Fillard P. MR Diffusion tensor imaging and fiber tracking in spinal cord compression. AJNR Am J Neuroradiol. 2005;26:1587-1594.
- Mamata H, Jolesz F, Maier S. Apparent diffusion coefficient and fractional anisotropy in spinal cord: Age and cervical spondylosis-related changes. J Magn Reson Imaging. 2005;22:38-43.
- Hesseltine S, Law M, Babb J. Diffusion tensor imaging in multiple sclerosis: Assessment of regional differences in the axial plane within normal-appearing cervical spinal cord. AJNR Am J Neuroradiol. 2006;27:1189-1193.
- Saindane A, Law M, Ge Y. Correlation of diffusion tensor and dynamic perfusion MR imaging metrics in normal-appearing corpus callosum: Support for primary hypoperfusion in multiple sclerosis. AJNR Am J Neuroradiol.
Citation
. Applications of diffusion tensor imaging and fiber tractography. Applied Radiology. 2007;36(5):36-37. doi:10.37549/AR1509.