Cardiac CT: Is multidetector imaging a paradigm shift?
Applied Radiology — Vol. 33 , Issue 11 , pp. 12 -22
DOI: 10.37549/AR1298
Published: November 1, 2004
Categories
Noninvasive cardiac assessment has been a goal of investigators for decades. The coronary arteries, in particular, provide a formidable challenge because of their small size (3 to 4 mm), tortuous course, and susceptibility to cardiac and respiratory motion. In addition, evaluation of cardiac function requires excellent temporal resolution on the order of ≤100 msec. Echocardiography, nuclear medicine techniques, and magnetic resonance imaging (MRI) have been used noninvasively for a variety of cardiac indications, but no single technique provides a comprehensive assessment.
The prospect of imaging the heart and coronary arteries using computed tomography (CT) has been anticipated since the development of CT more than 3 decades ago. The lack of speed and poor temporal resolution of previous generations of CT scanners prevented meaningful evaluation of the coronary arteries and cardiac function. Most early assessments of the coronary arteries with CT were performed with electron-beam tomography (EBT), which was developed in the early 1980s. It has been used most widely for noninvasive evaluation of coronary artery calcium, but other applications, including assessment of coronary artery stenosis, have also been reported. Notwithstanding these capabilities, EBT is expensive and not widely available.
The advent of multidetector CT (MDCT) in 1998 represented a substantial step forward in the ability to evaluate small, mobile structures, such as the coronary arteries. With submillimeter spatial resolution (≤0.75), improved temporal resolution (50 to 200 msec), and ECG gating, the current generation of CT scanners (16-slice MDCT) makes it possible to image and potentially accurately characterize the coronary tree.1
Technique
Two basic methods of cardiac scanning are performed with MDCT. Calcium scoring CT is acquired without contrast and using prospective ECG gating. Cardiac CT angiography is obtained with contrast and using retrospective ECG gating so that multiple cardiac phases can be reconstructed. Sample protocols are shown in Tables 1 and 2 (based on the Philips IDT scanner, Philips Medical Systems, Cleveland, OH).
Cardiac CT applications
Calcium scoring
Calcium scoring has been used for more than a decade to directly visualize atherosclerotic changes of the coronary arteries. Coronary calcium is an independent predictor of cardiac events, although the relationship is not linear. An asymptomatic individual with a calcium score in the 80% rank has more than 15 times the relative risk of a serious cardiac event compared with an individual without coronary calcium.2 Moreover, the negative predictive value of a normal calcium scoring test (absence of any calcium) in the setting of atypical chest pain approaches 100%.3,4
Conventionally, calcium scoring has been obtained with EBT. The Agatston score, which is the product of the number of pixels with calcification and the density weighting of the calcification on a sliding scale, is the most widely used metric and can be calculated using standard software.5 A threshold of 130 HU is typically used to indicate calcification (Figure 1). Results are normalized for age and gender, and a percentile rank is generated based on a large database.6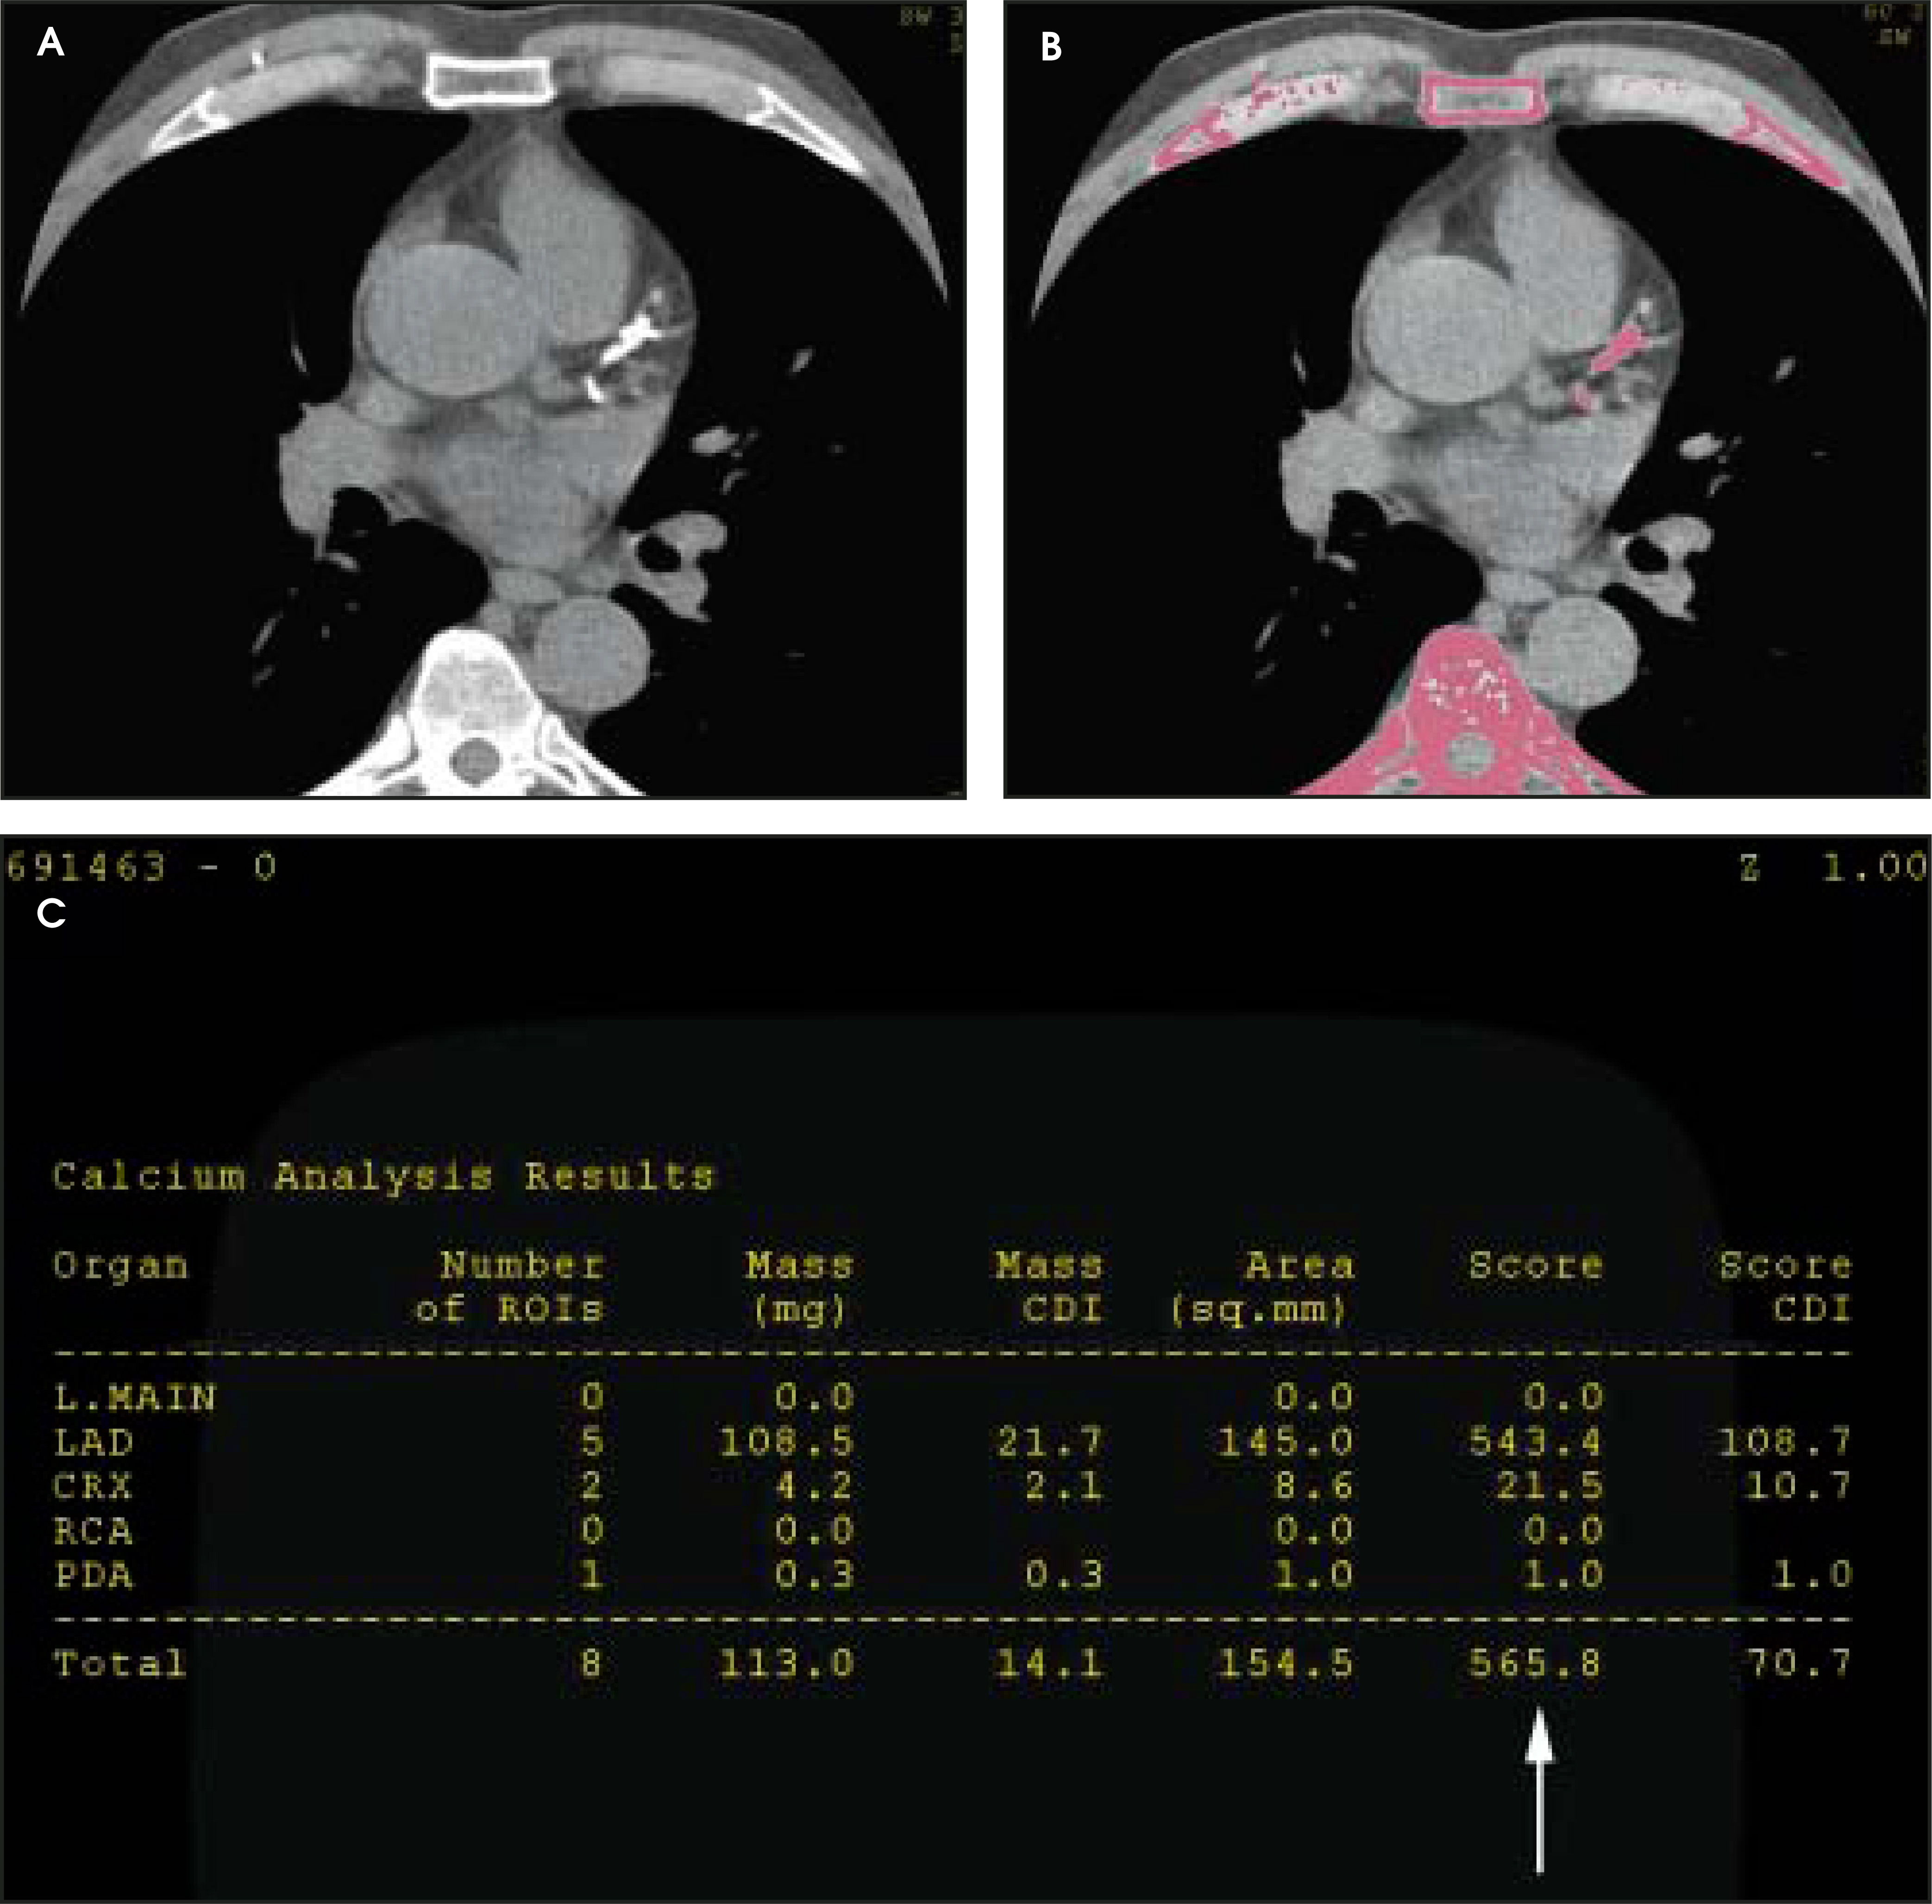
Much interest has centered on whether MDCT provides as accurate and reproducible a study as EBT. A recent study by Becker et al7 found a strong correlation (r = 0.9) between EBT and a 4-slice scanner among 100 patients who underwent both studies. Increasingly, there is recognition that the Agatston score, which is based on a conventional model of 3-mm-thick axial sections, does not take into account the volumetric nature of MDCT. Two newer measurements, calcium volume and calcium mass, better account for these volumetric characteristics and, thus, may provide more reproducible calcium scores among different scanners. A recent critical analysis of the literature suggested that MDCT correlates well with EBT for calcium scoring, with the possible exception of patients with low levels of coronary calcium.8
Cardiac anatomy
Cardiac CT provides accurate delineation of the cardiac chamber size and wall thickness. Valve thickness and calcification are readily assessed and the mitral and aortic valves are clearly depicted (Figure 2). The right-sided valves may be more difficult to delineate due to contrast-related streak artifact. A thrombus in the apex of the left ventricle and the left atrial appendage is visualized easily and can be quantified (Figure 2). Cardiac tumors, such as myxoma and metastatic disease, are clearly delineated (Figure 3). A variety of congenital heart diseases are readily diagnosed (Figure 4).9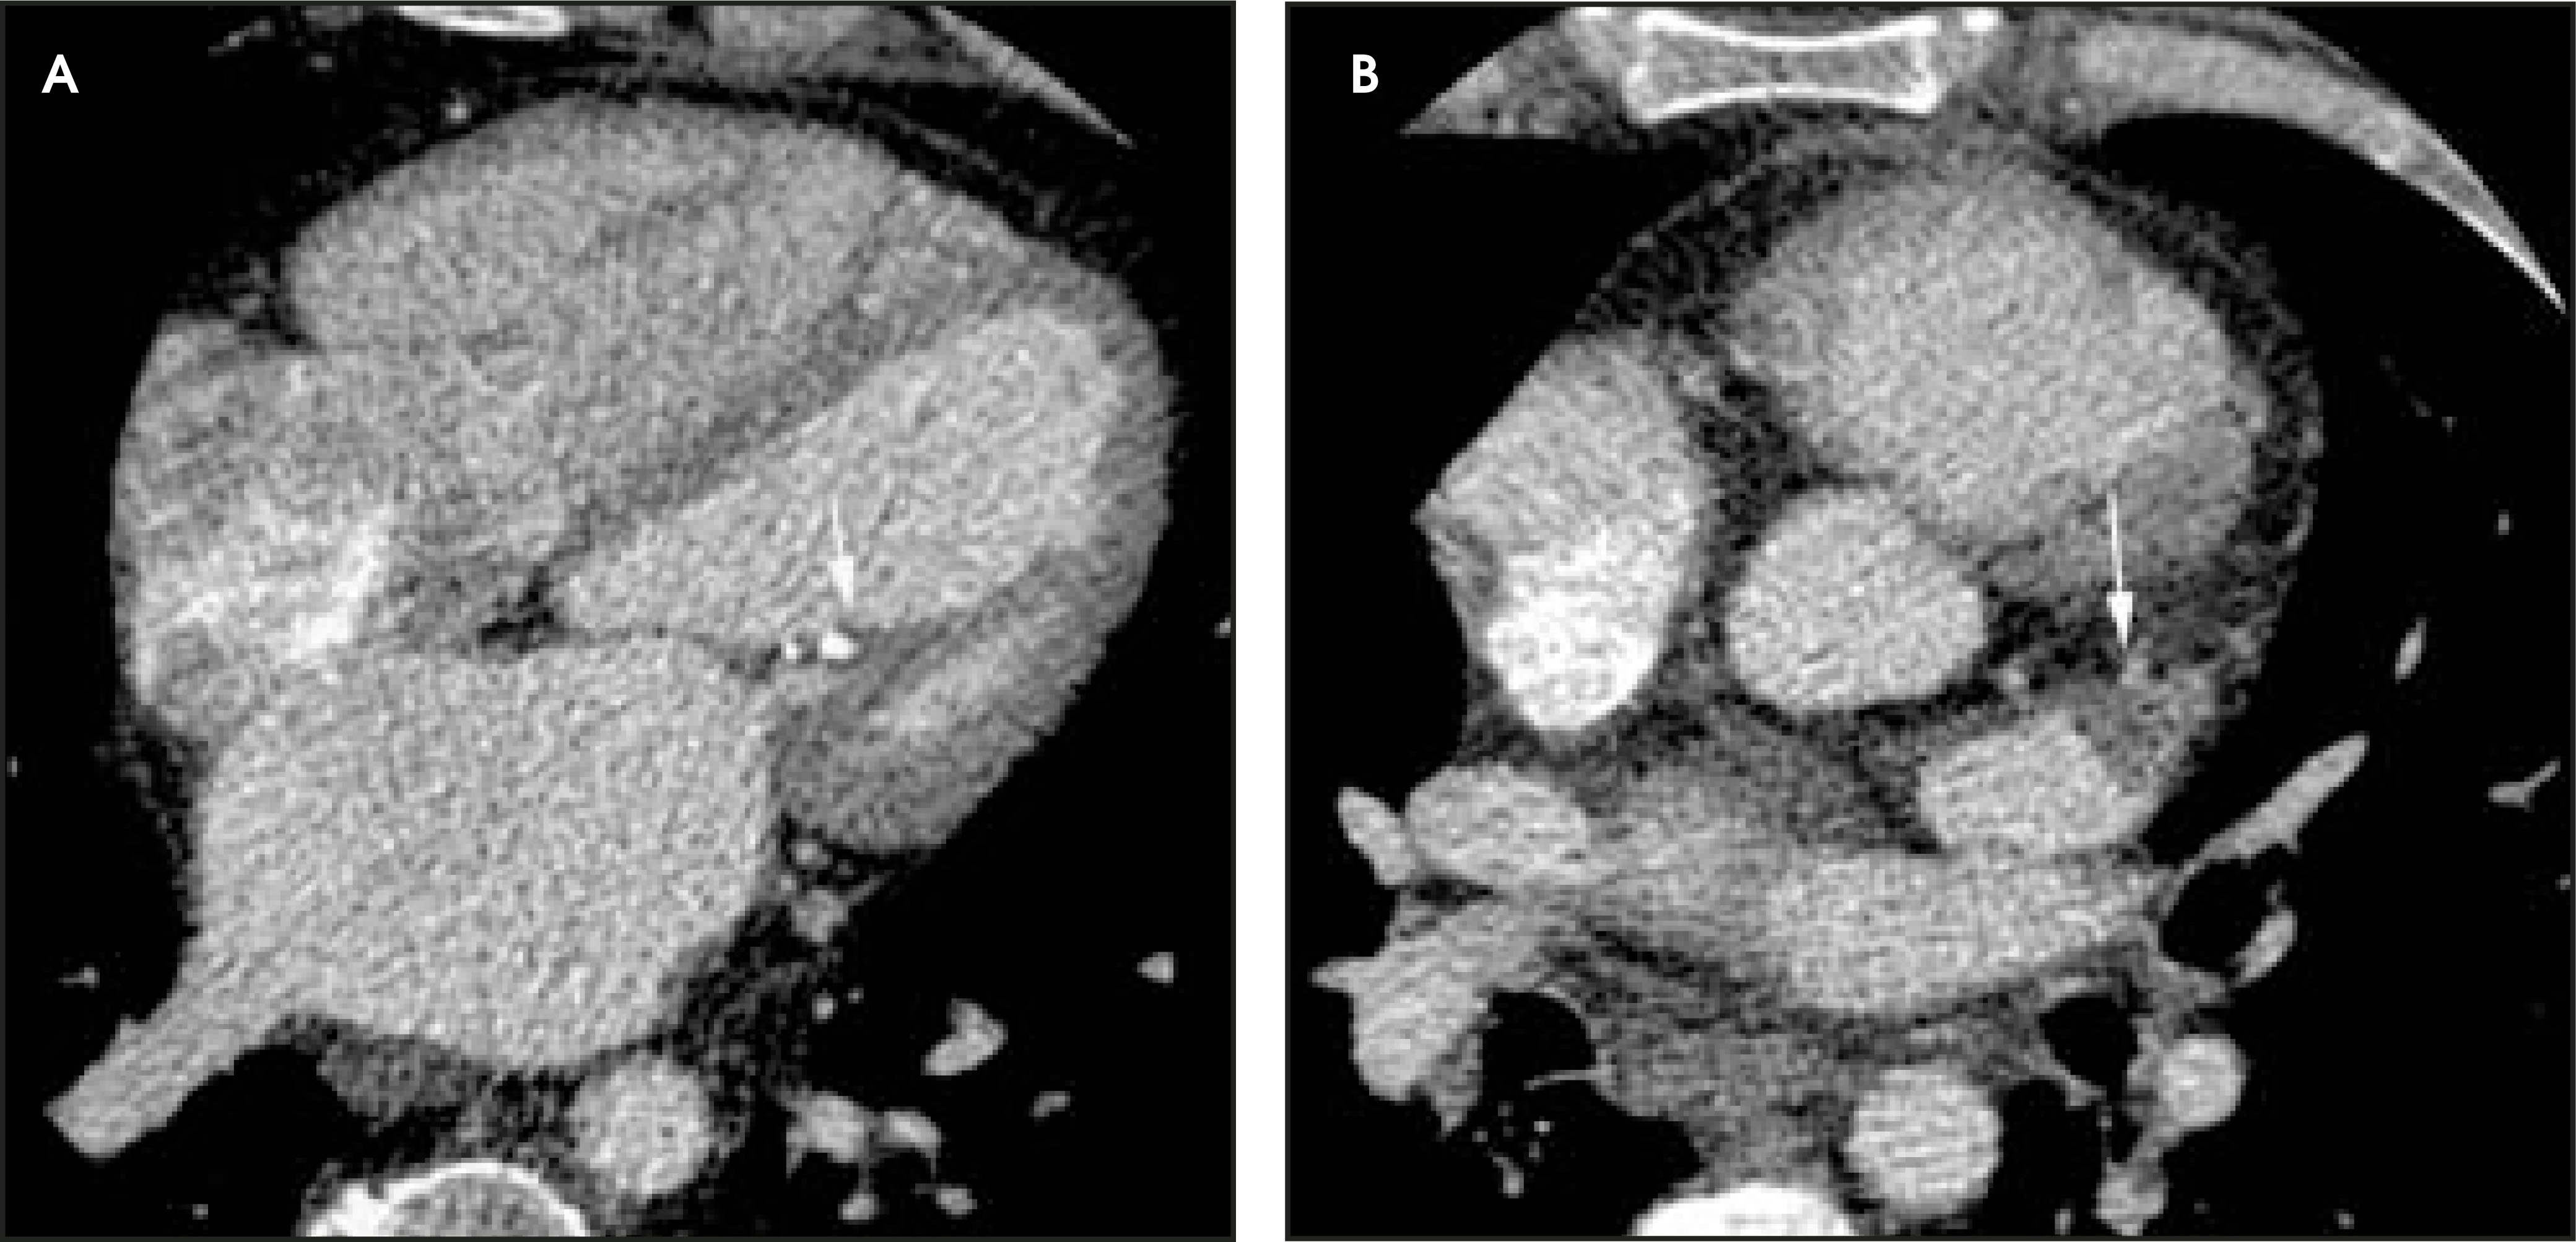
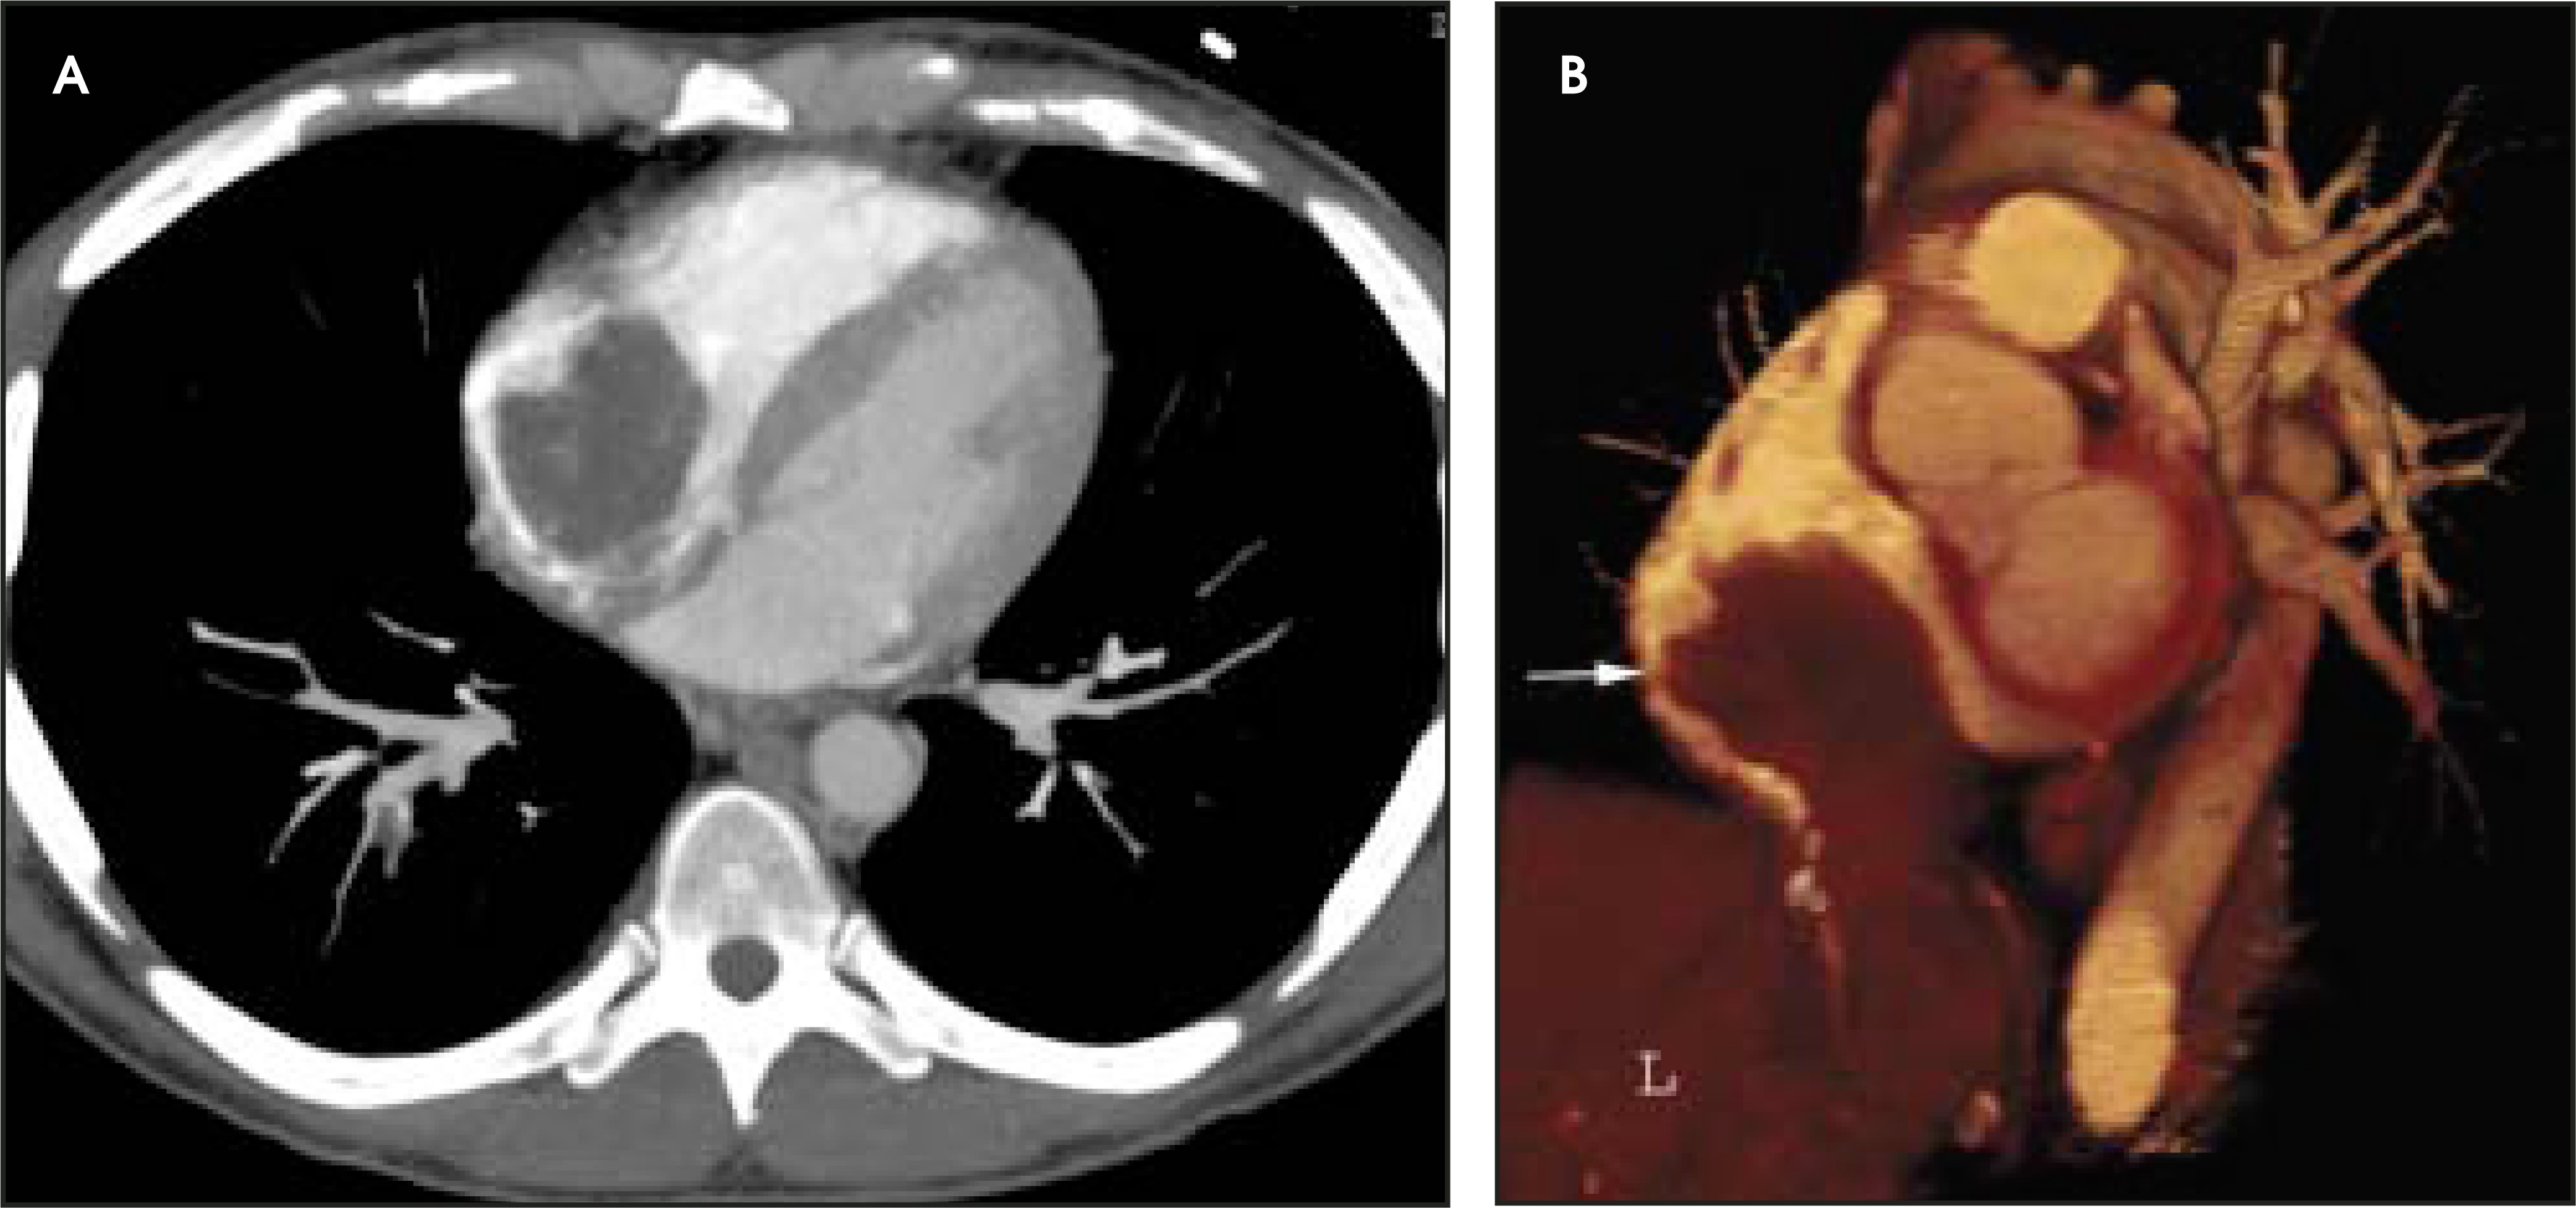
One of the indications for which cardiac CT has been used increasingly is in the evaluation of the left atrium and pulmonary veins as part of planning atrial fibrillation ablation therapy. The size and number of veins can be assessed (Figure 4).10 Radiofrequency ablation is associated with a 5% rate of pulmonary vein stenosis, which is well demonstrated on CT .11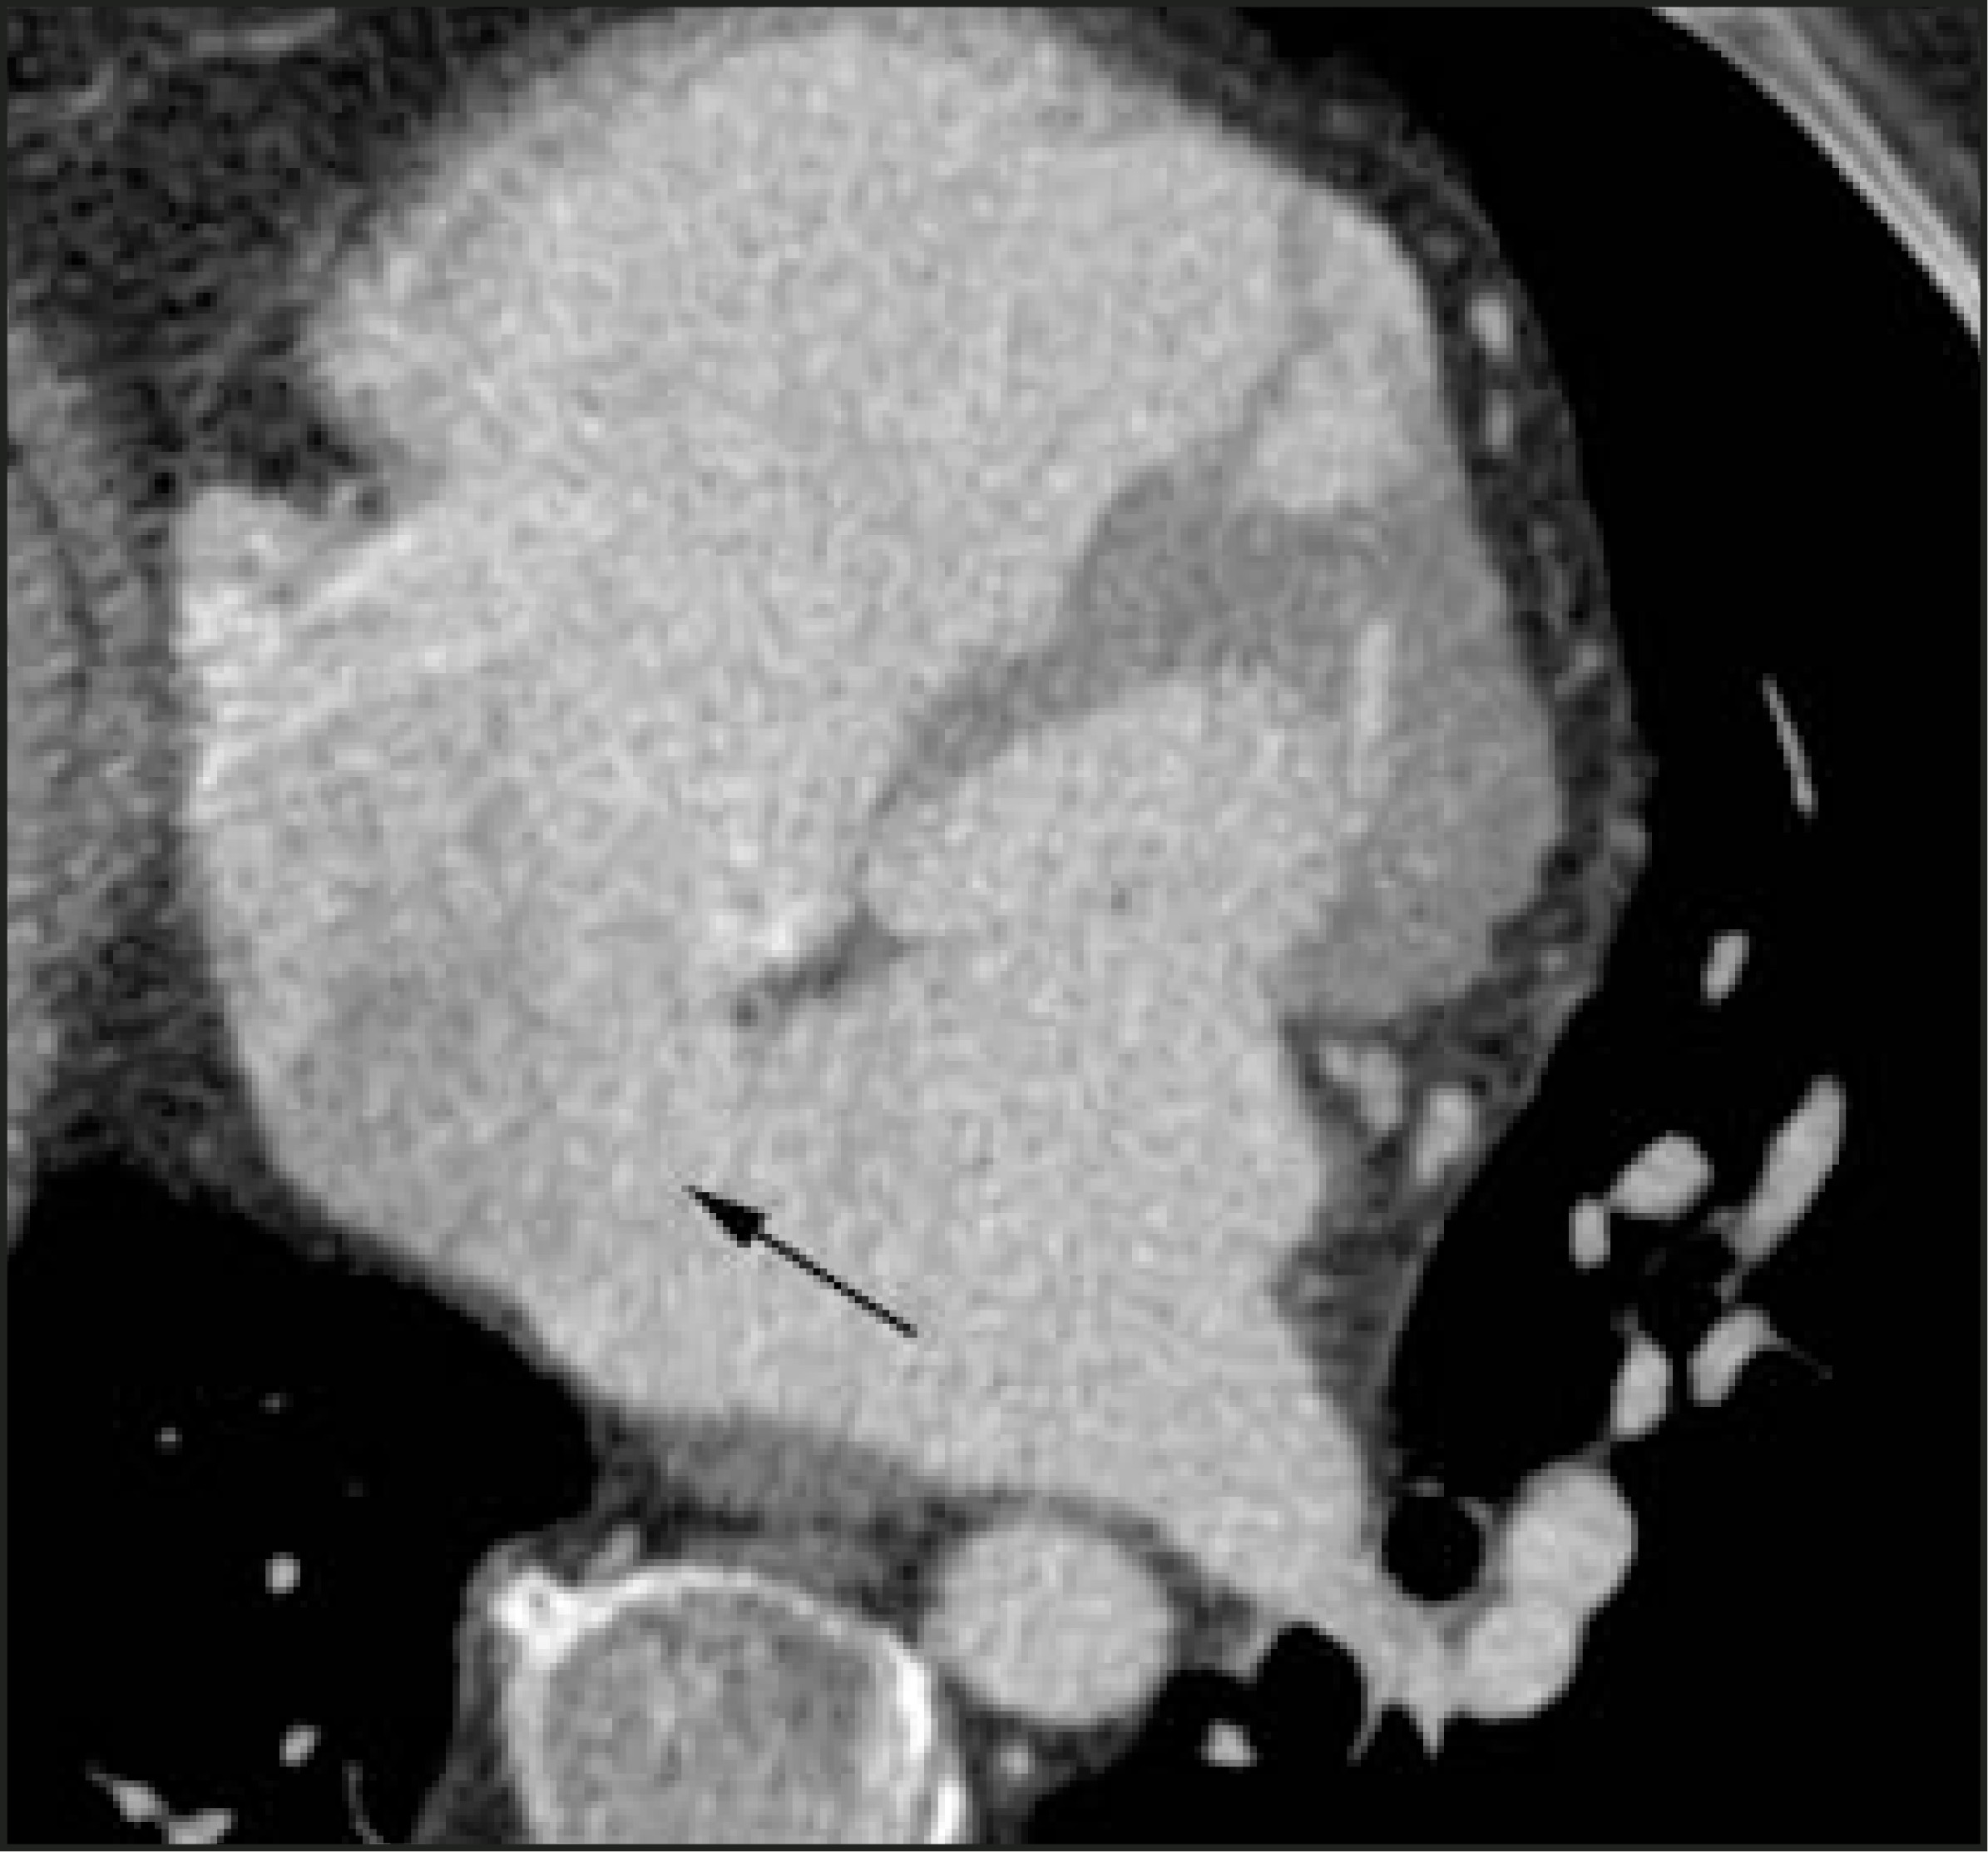
Coronary artery evaluation
The use of submillimeter resolution, ECG gating, and breath-holding allows reliable visualization of the proximal coronary arteries and often permits assessment of the more distal coronary tree. In patients with higher heart rates (>70 beats per minute), beta-blocker administration optimizes coronary artery evaluation. Typically, images are reconstructed at 40% to 90% of the cardiac cycle, and the best images are selected by visual inspection. The optimal image set for the left and right coronary system may differ. Coronary artery images may be viewed using curved planar, thin-slab, or volumetric techniques (Figure 5). Newer software permits extraction of the coronary arteries and assessment of the extent of coronary artery stenosis using a preselected reference point.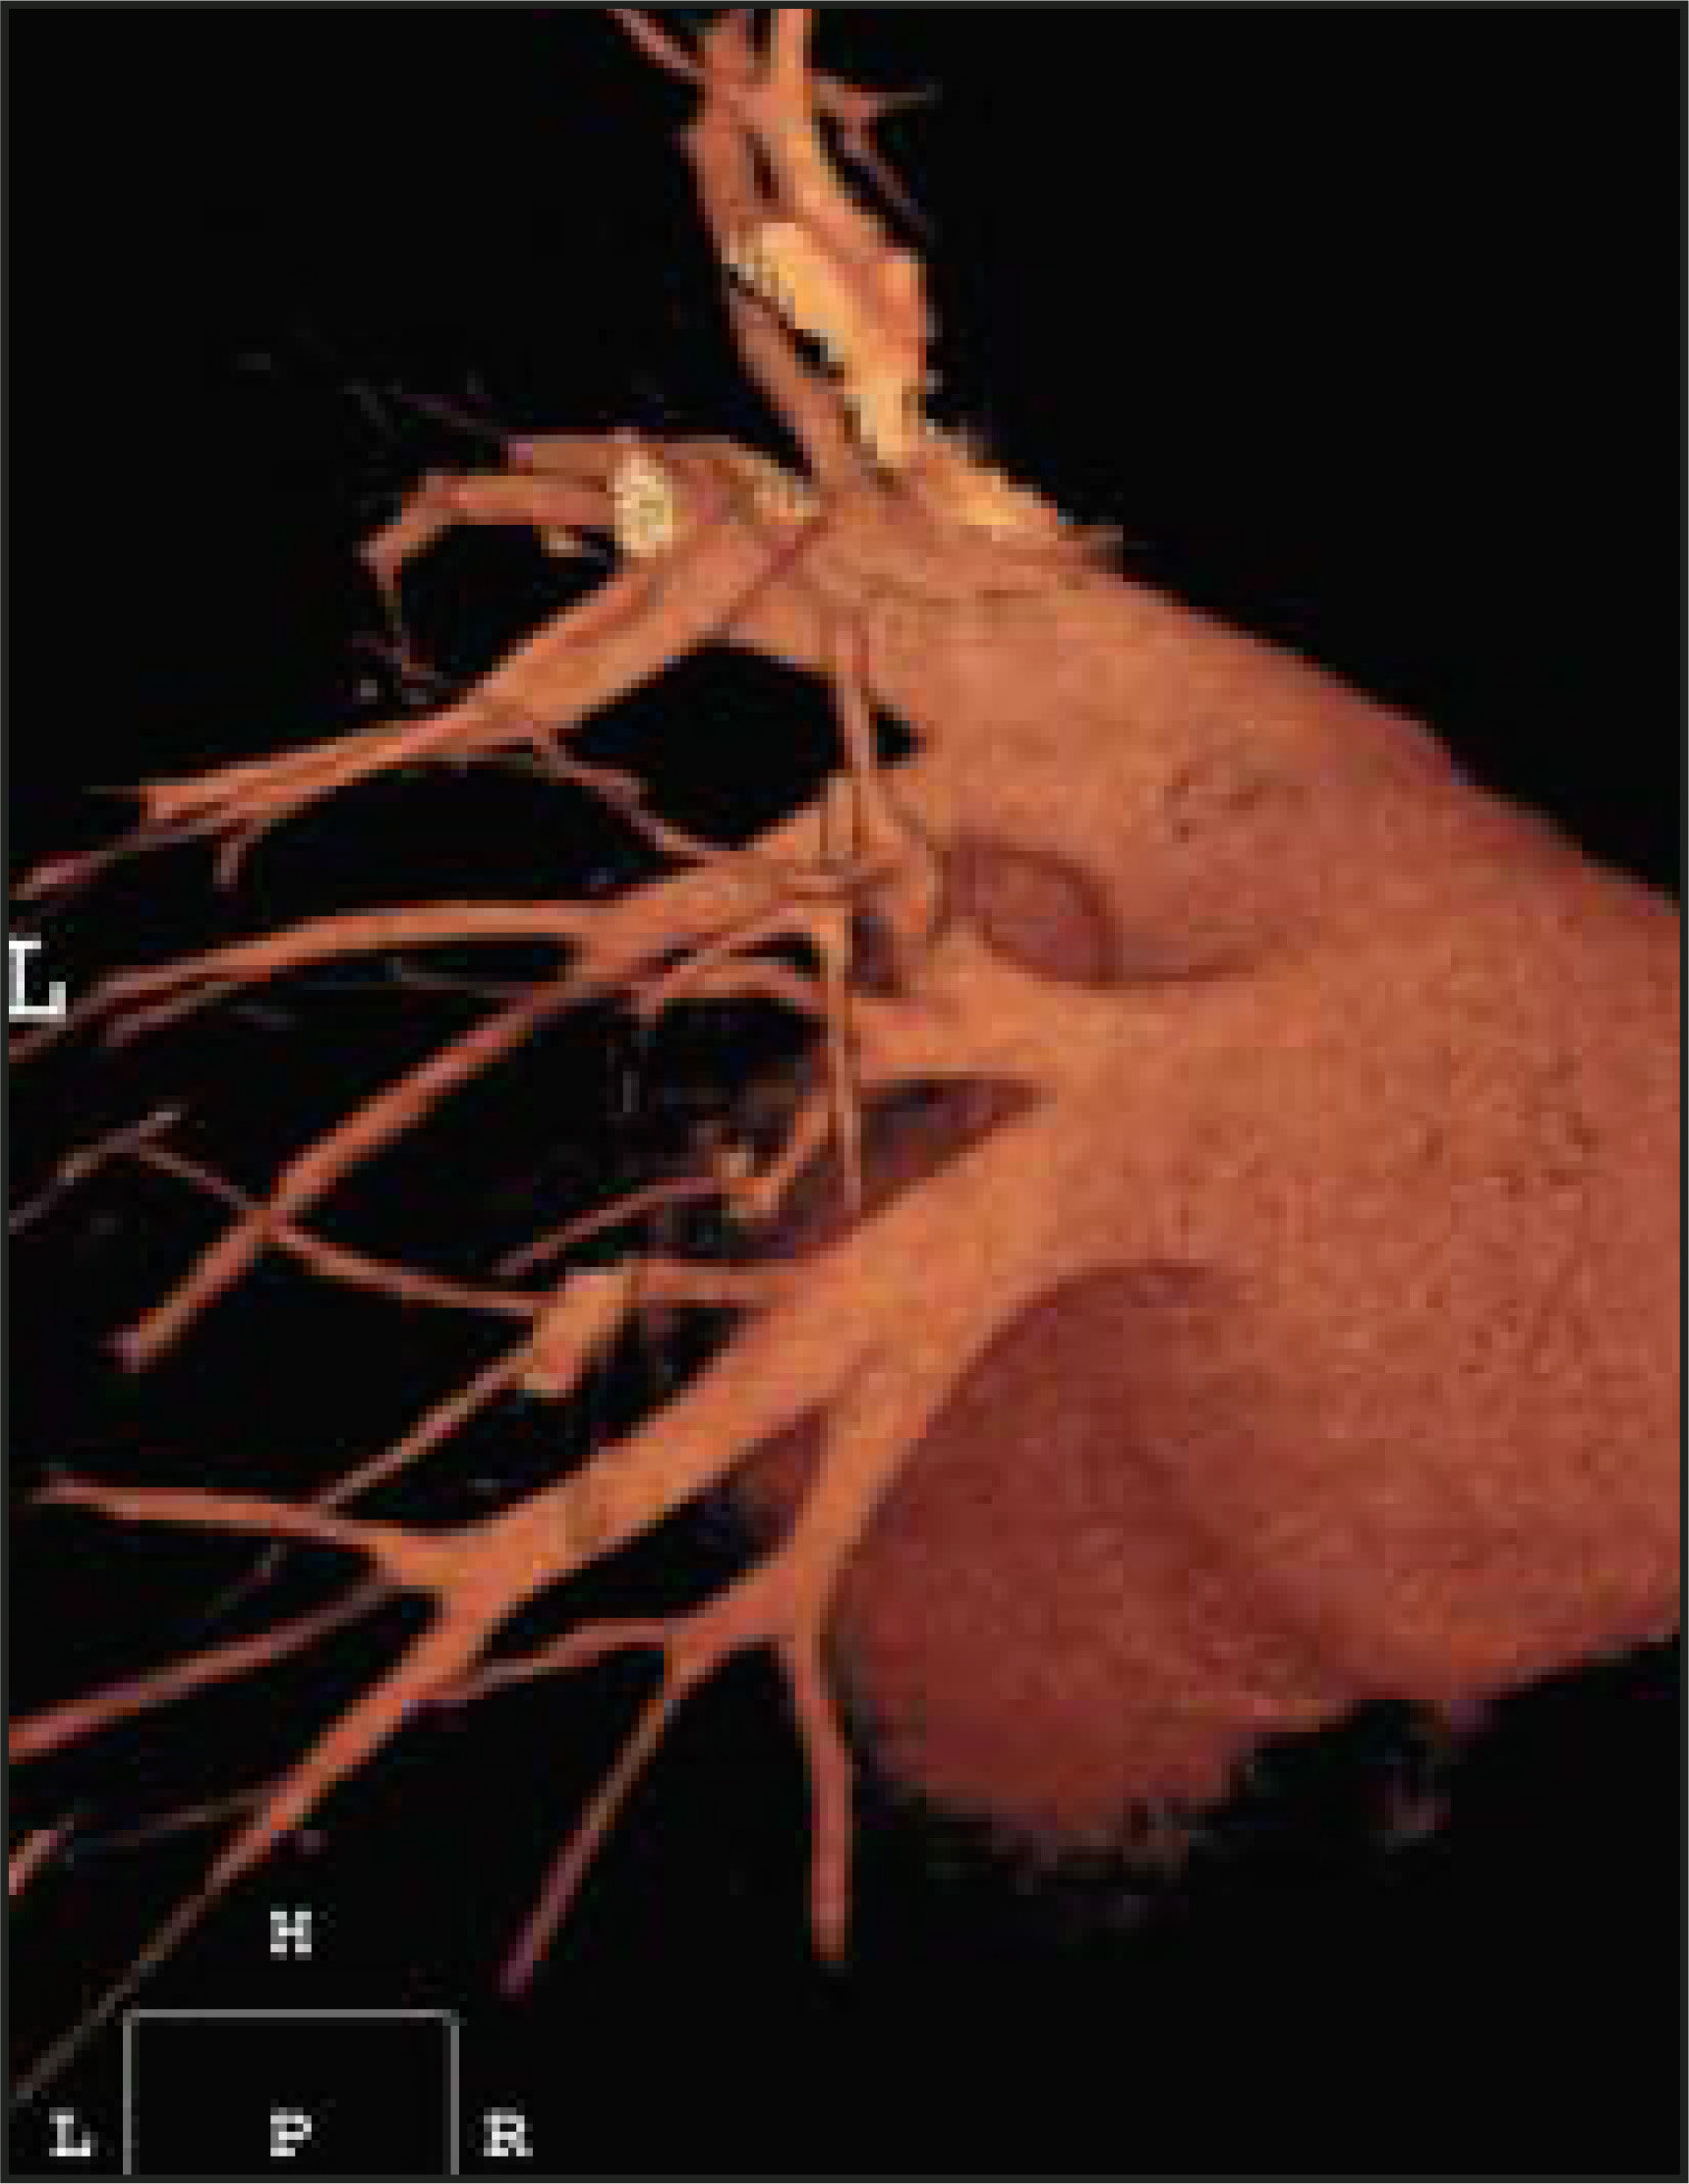
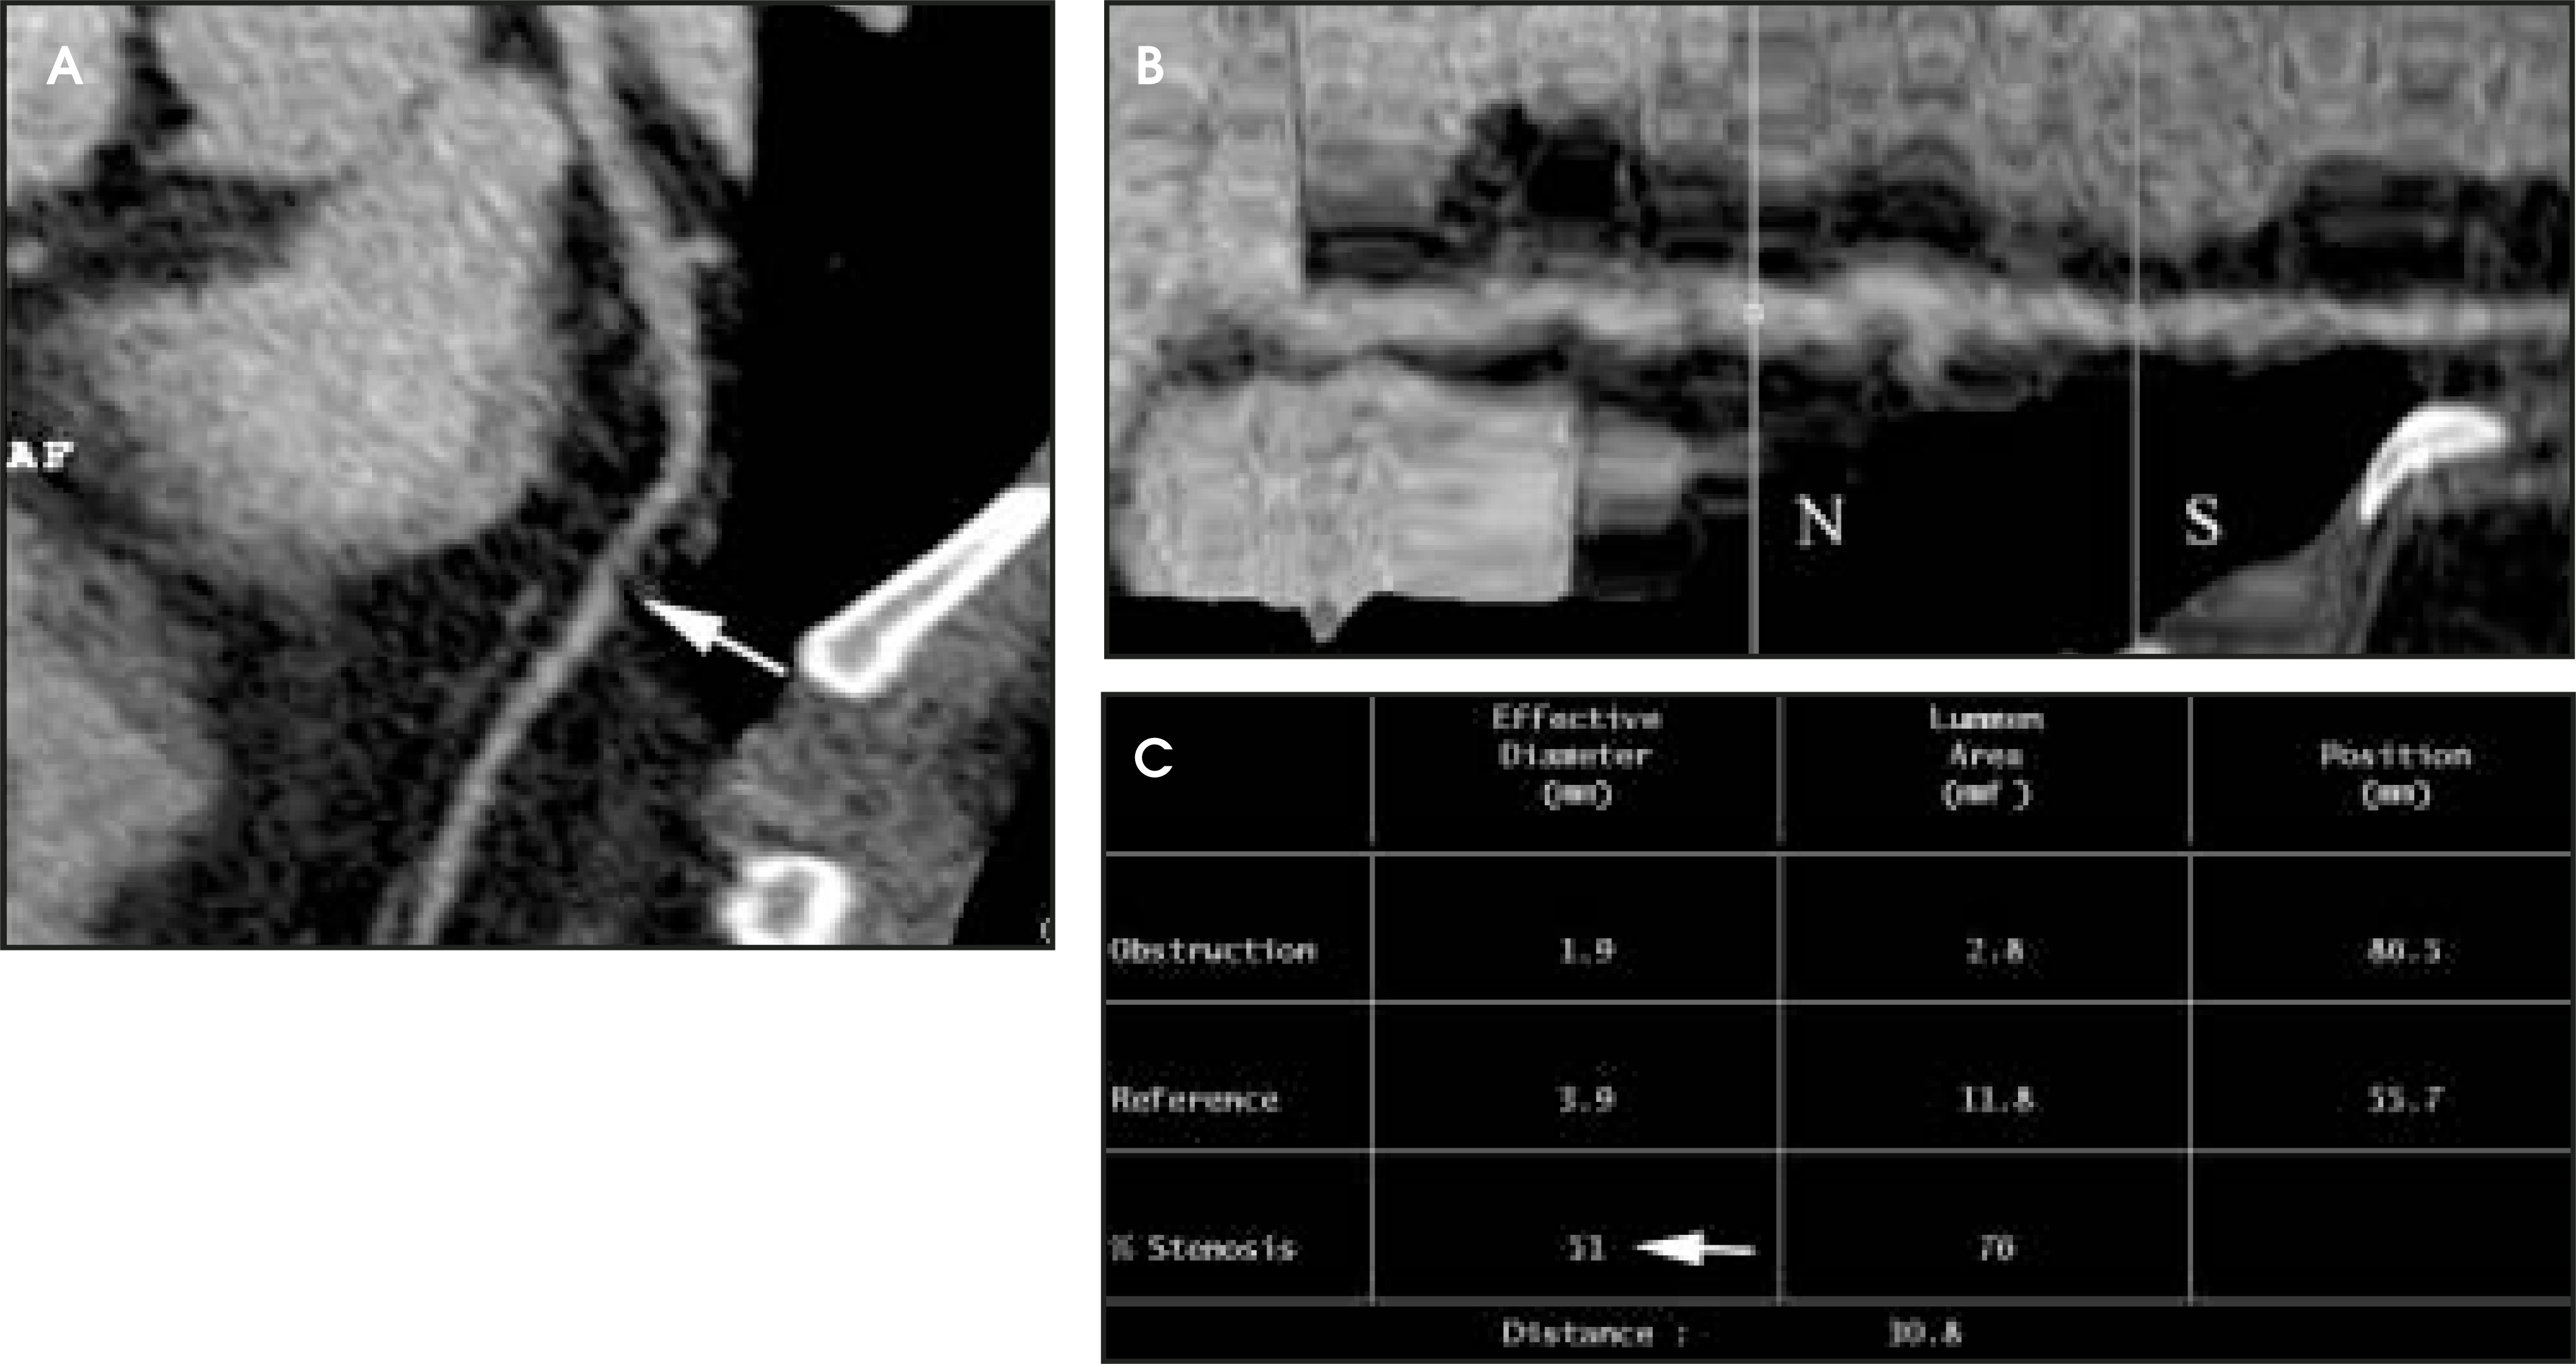
Several studies have evaluated coronary artery stenosis on CT angiography using coronary angiography as the standard reference technique. Early studies using a 4-slice CT scanner revealed sensitivity and specificity values of 80% to 95% but had a relatively high number of nonevaluable segments (up to 28%).12,13 With more recent technology, the number of nonevaluable segments has decreased, with continued high sensitivity) (Figures 6 and 7).14,15 At least two multicenter trials using current CT technology are planned.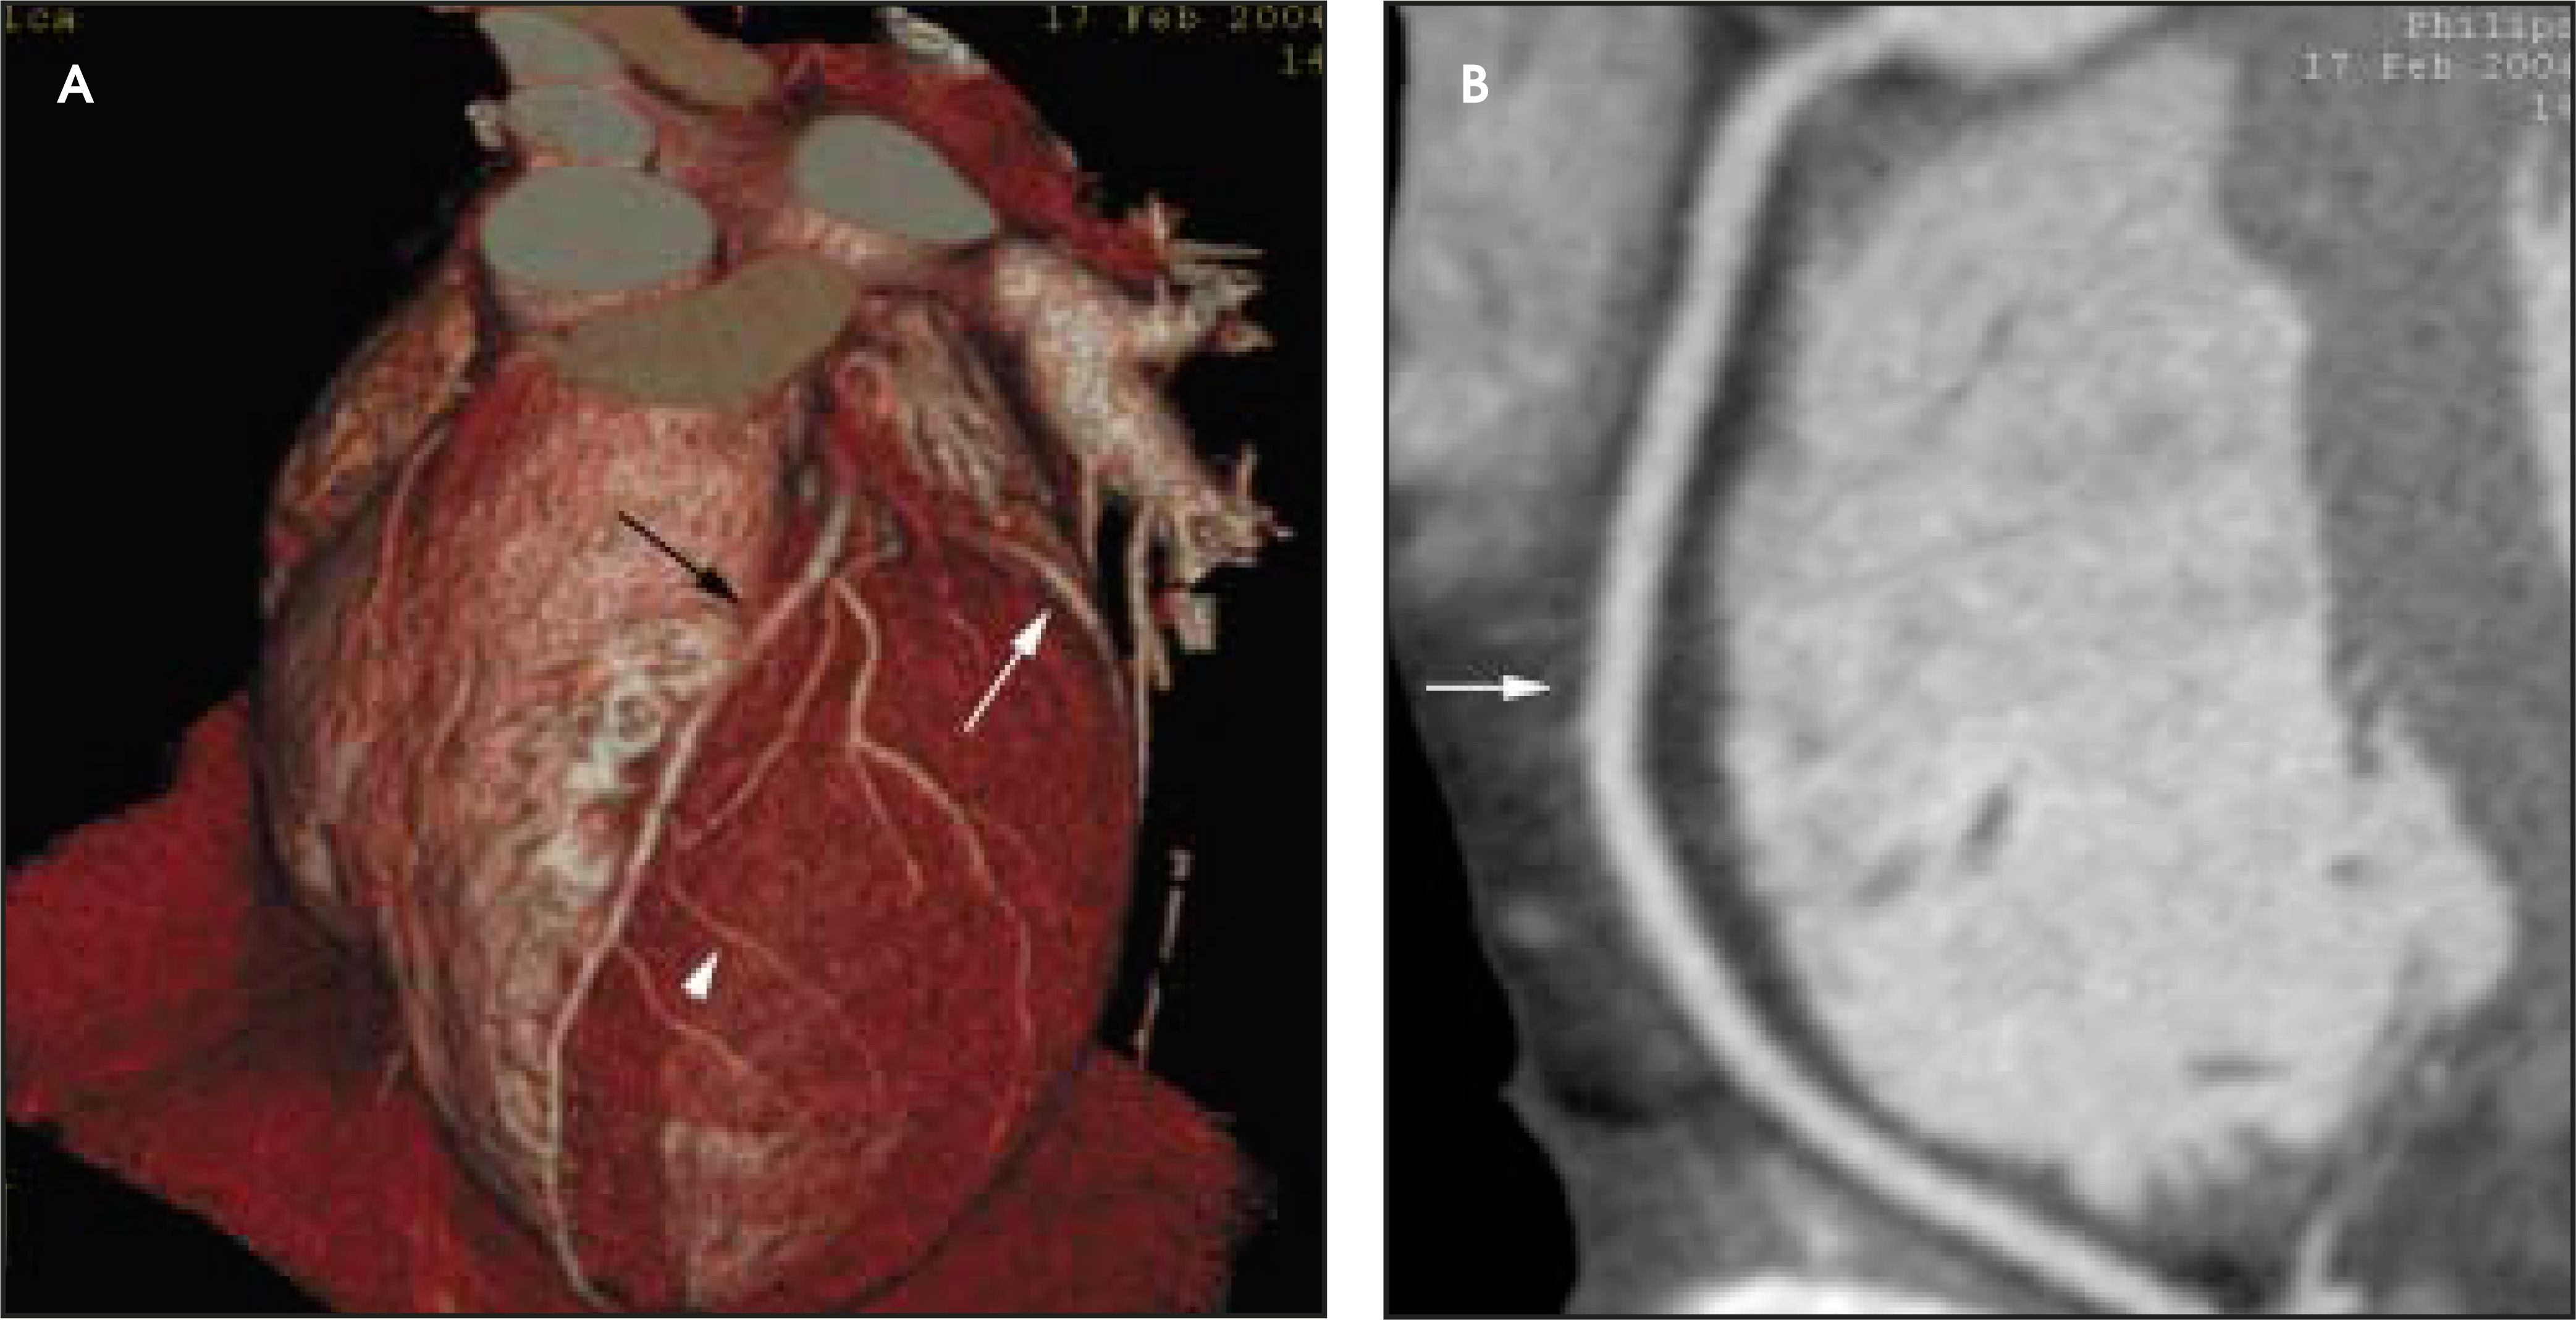
Cardiac CT is useful to evaluate coronary stents and bypass grafts. The location of the coronary stent is readily identified. Thrombosis within the stent can be depicted, although the stent material may interfere with luminal visualization.16 Absence of fiow distal to the stent is an indication of stent occlusion, although the presence of distal fiow, which may be due to collateral sources, does not guarantee stent patency. After coronary bypass surgery, patency of both internal mammary artery and saphenous vein bypass grafts is also well demonstrated (Figure 8). Sensitivity and specificity of 95% to 100% for detecting occlusion has been reported.17,18 Assessment of bypass graft stenosis is associated with somewhat lower sensitivity and specificity. In general, the distal graft anastamosis with the native coronary artery is more difficult to visualize than is the proximal portion. Complications, such as saphenous venous graft aneurysm, are readily depicted.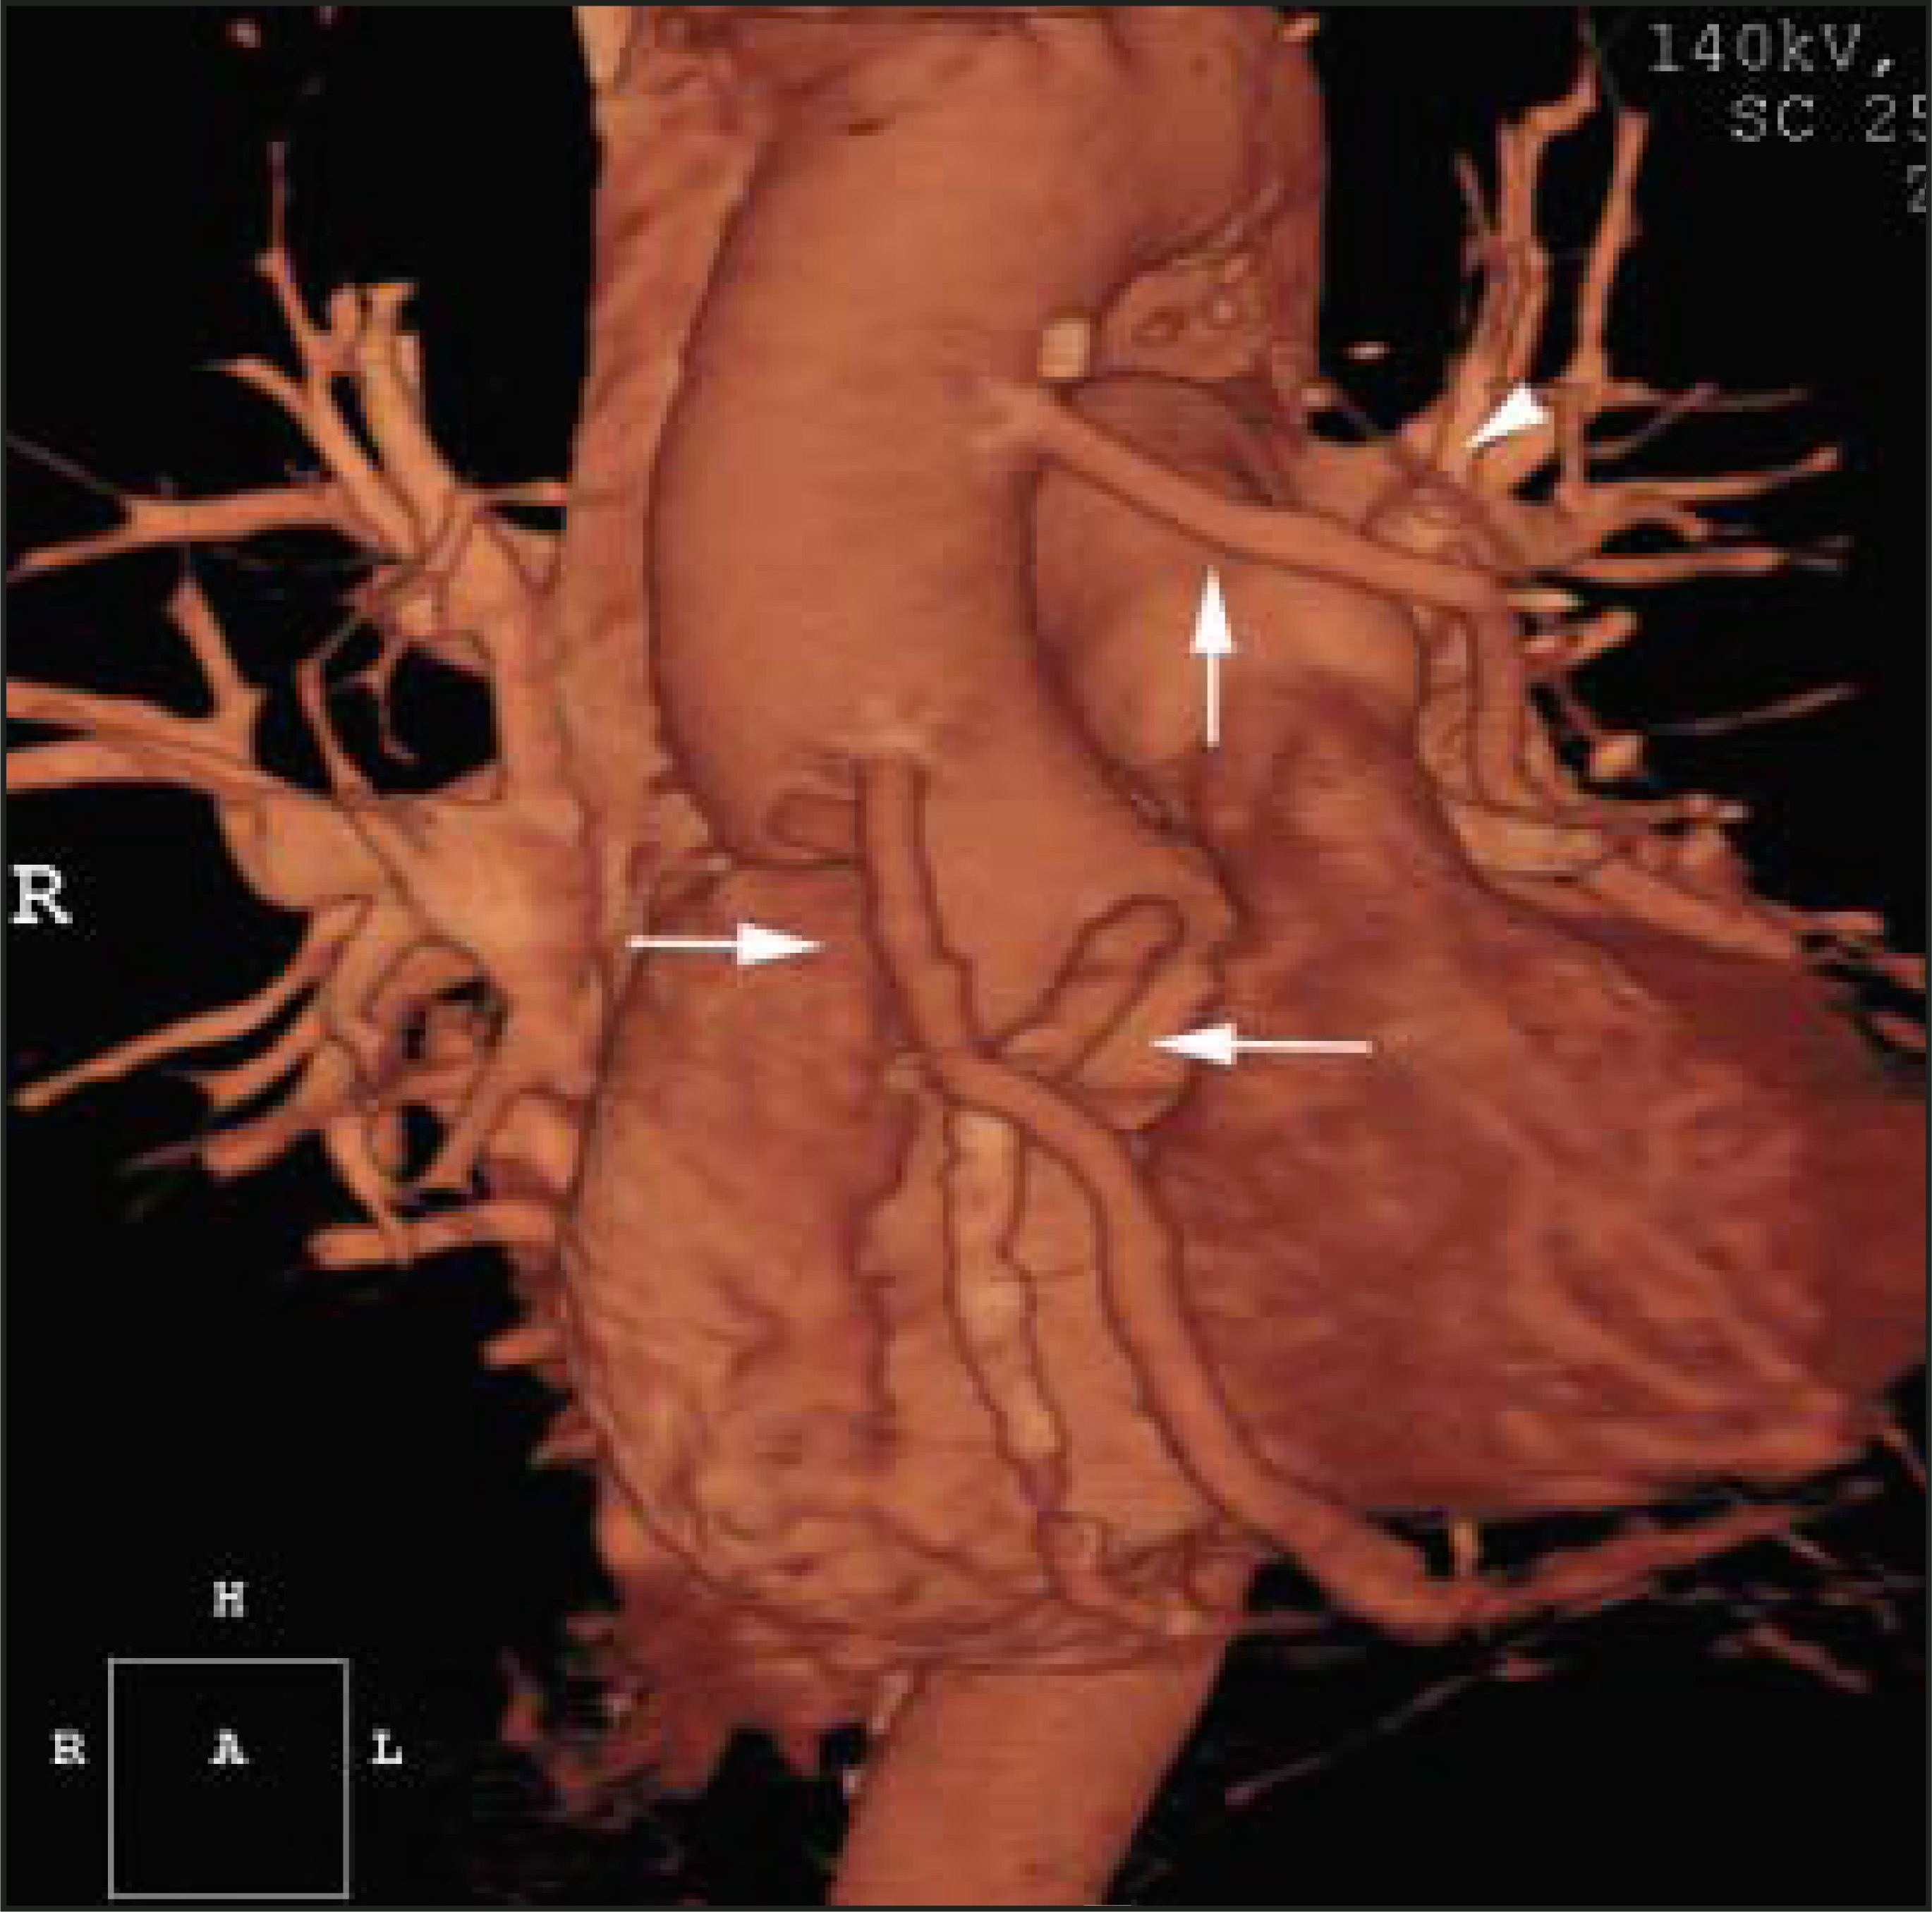
Coronary artery anomalies occur in 1% of patients and may be associated with sudden death if the anomalous vessel passes between the aorta and pulmonary artery. In this setting, prophylactic bypass graft may be indicated. The anomaly is typically discovered at coronary angiography, but the precise course with respect to the great vessels is often ambiguous. Cardiac CT reliably delineates both the origin of the anomalous vessel and its subsequent course (Figure 9). Miscellaneous coronary abnormalities that can be visualized on cardiac CT include coronary aneurysms and coronary arteriovenous fistulas.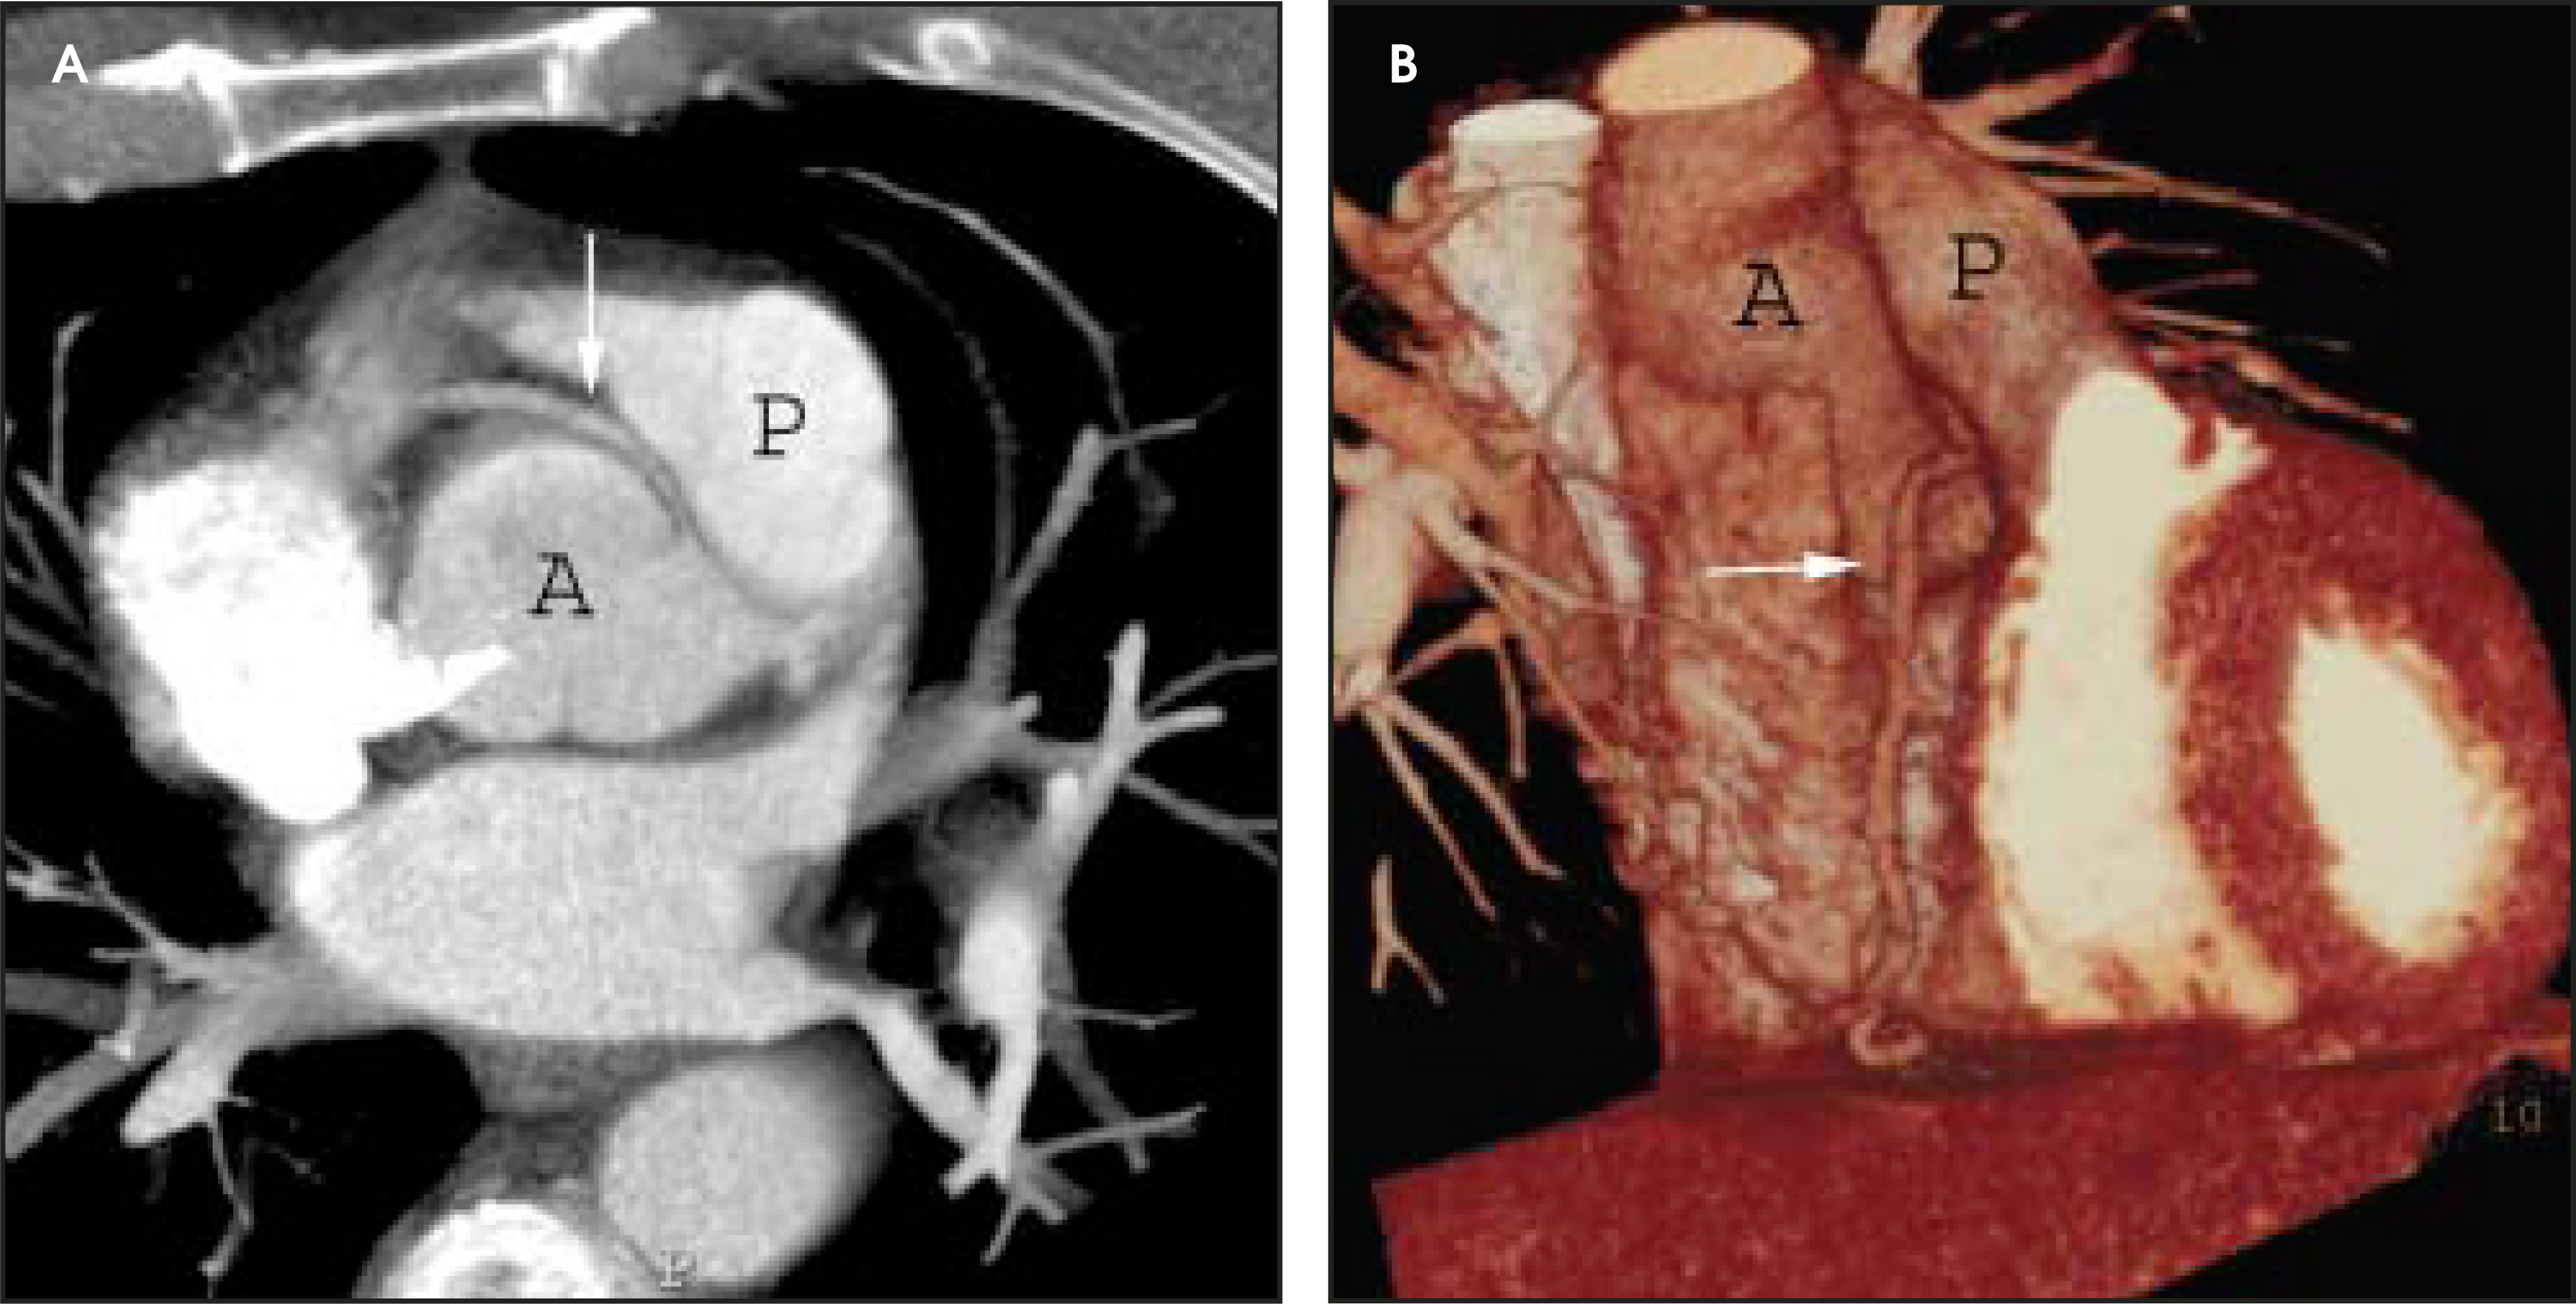
Functional cardiac assessment
Current MDCT scanners provide software packages that permit assessment of ejection fraction, stroke volume, wall-motion, and wall thickness and provide a detailed output display. Although an automated edge-detection program provides an initial estimate of cardiac margins, some operator input is usually necessary to define the proper endo- and epicardial borders (Figure 10). A cardiac ejection fraction similar to that of other methods may be obtained with cardiac CT, but some concern exists that it may systematically underestimate the correct value due to temporal resolution that is inadequate to define end-systole. Notwithstanding this potential limitation, limited investigations indicate a strong correlation between ejection fraction calculated with CT and by MRI.19-21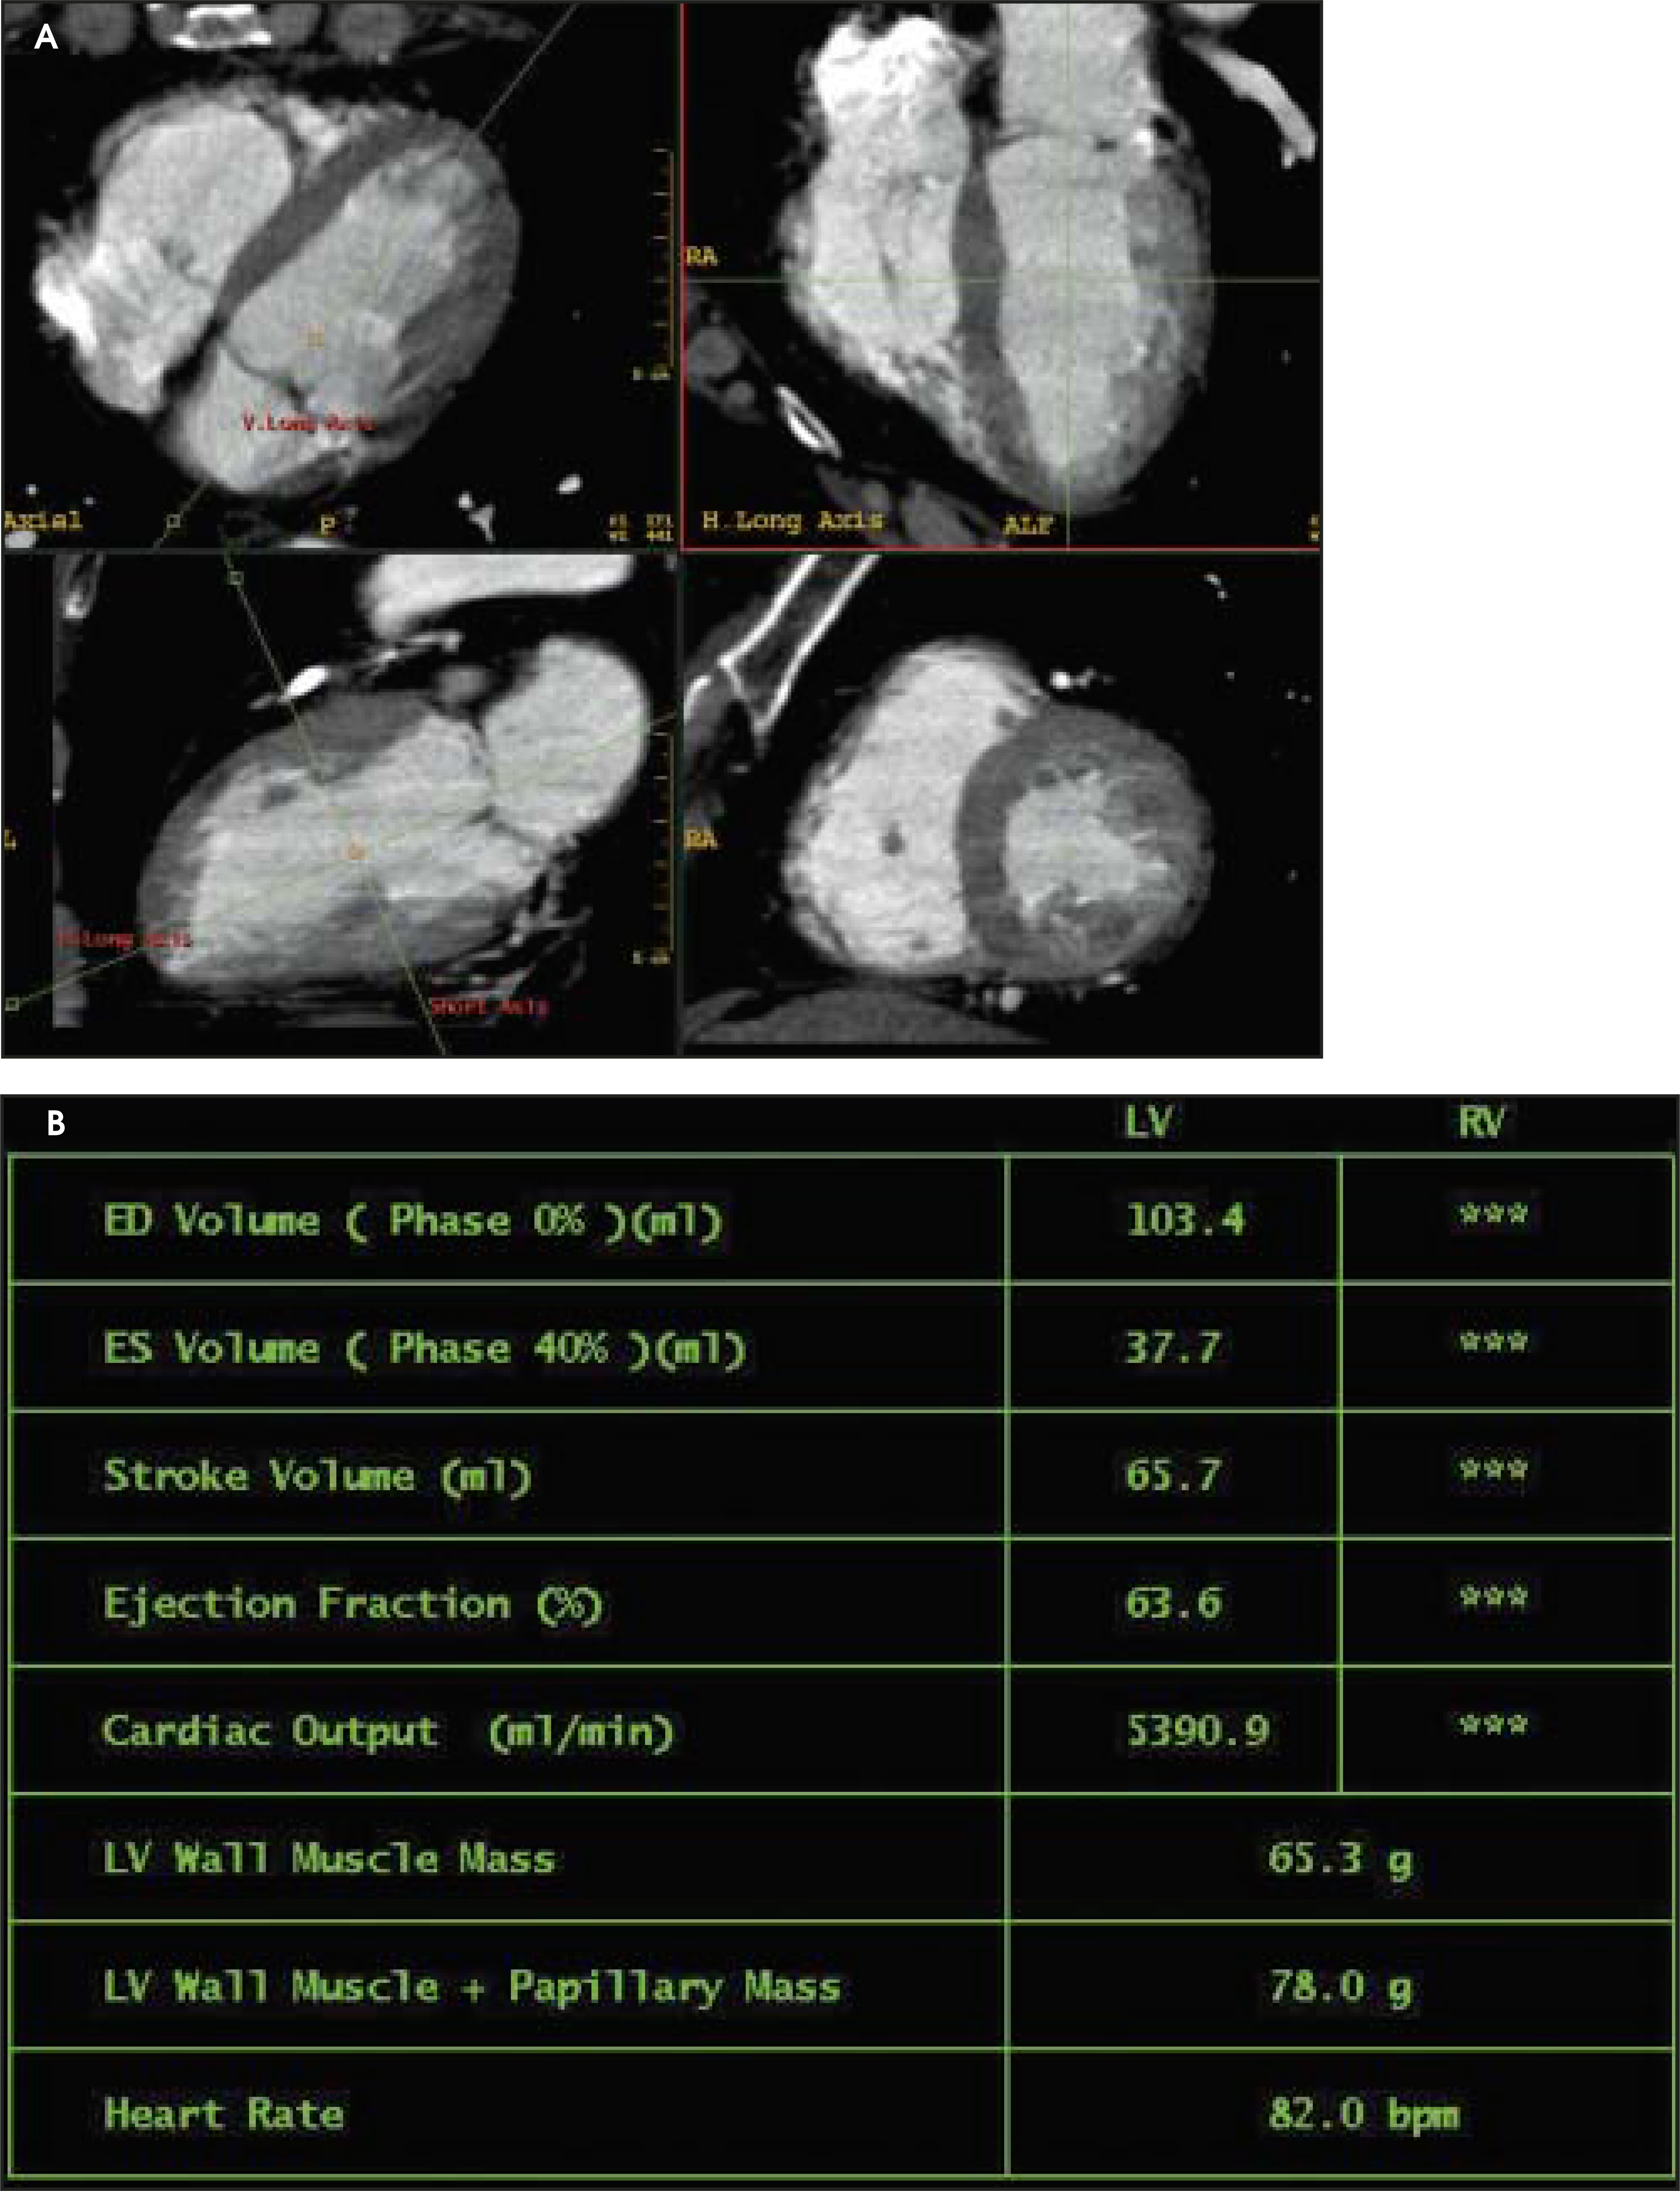
Cardiac perfusion
Similar to cardiac MRI, ischemia may cause differential perfusion of the myocardium on CT. Decreased attenuation is observed in ischemic areas and may be subendocardial or transmural (Figure 11).22 It is not clear whether acute ischemia has a different appearance from chronic ischemia or infarction. It is also uncertain what the role of delayed imaging, analogous to that used to assess myocardial viability on MRI, might be.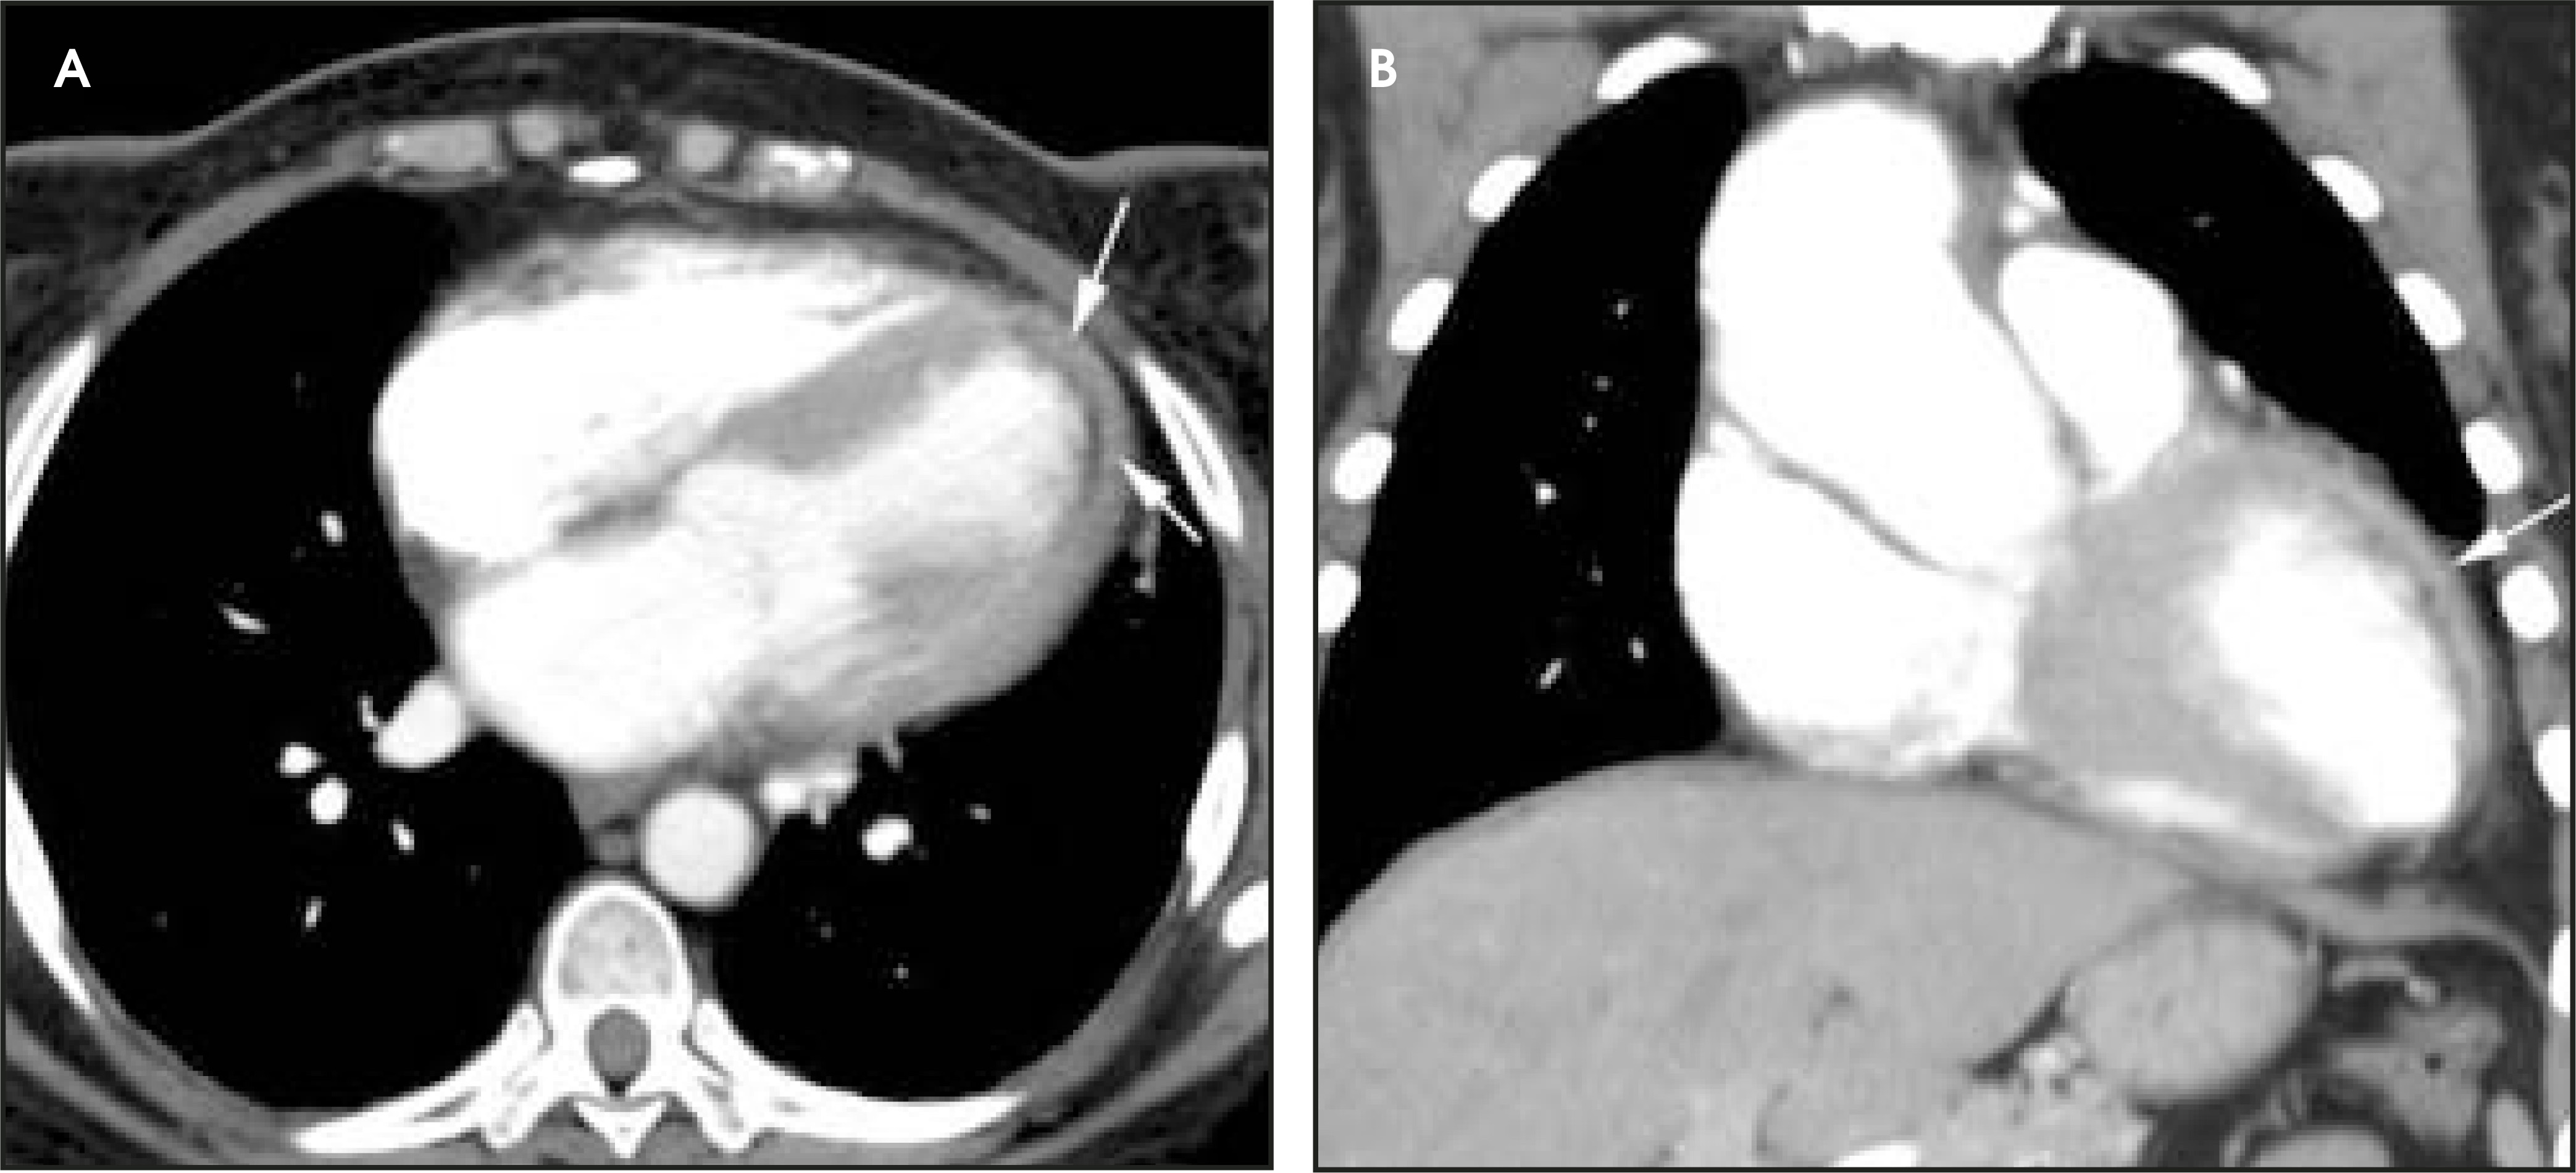
Cardiac CT versus MRI
Over the last 5 years, the technology curve for cardiac CT has been much steeper than that for MRI. Currently, CT features superior spatial resolution, less artifact-related image degradation, ability to image in the presence of cardiac pacemakers and defibrillators, and lower cost. Even more important, perhaps, is that CT is more intuitive to interpret. However, MRI remains superior in many respects. It has superior temporal resolution, does not rely on iodinated contrast, with its attendant risks of allergies and contrast nephropathy, has no ionizing radiation, and has the capability to measure fiow velocities and to assess valvular regurgitation, which CT does not. Finally, the use of MRI to assess myocardial viability is well established, whereas its evaluation by CT has yet to be proven.
Radiation considerations in cardiac CT
One of the disadvantages of cardiac CT compared with competing technologies, such as MRI, is its use of ionizing radiation. The radiation is highly dependent on the protocol used in cardiac CT. For prospective gating generally used for calcium scoring, in which imaging occurs for only a portion of the cardiac cycle, the radiation dose is comparatively low. Typically, doses in the 1 to 2 mSv range are reported. For retrospective gating used for coronary stenosis assessment, much higher doses of 8 to 12 mSv are reported.23,24 The higher dose is due to the necessity of imaging throughout the cardiac cycle. By comparison, the radiation dose of an uncomplicated coronary angiography is 4 to 6 mSv. Efforts to reduce the high dose accumulated in retrospective gating, termed dose modulation, are directed at reducing the tube current during parts of the cardiac cycle, particularly systole, where poorer image quality can be tolerated because assessment of the coronary arteries is suboptimal. With dose modulation, a 30% to 50% dose reduction can be achieved.25
Future directions
It is certain that both hardware and software enhancements to cardiac CTA are forthcoming. Already, one vendor has begun delivery of a 40-detector MDCT system. Additional vendors have announced development of a 64-detector unit. Increasing speed of reconstruction to handle the large number (up to 5000) of images is imminent. A completely new approach using fiat panel technology may ultimately permit z-axis resolution <0.2 mm.
Inadequate temporal resolution remains a barrier to motionless imaging of the coronary arteries. As of this writing, the minimal gantry rotation time is 0.375 seconds, and substantial hardware and software upgrades will be necessary for further improvement. Reconstruction speeds as fast as 20 images per second are available on some systems.
Workstation technology is also rapidly advancing. Better workfiow patterns are in the offing. Various methods can be employed to calculate ejection fraction, and other functional parameters, such as stroke volume and left ventricular mass. Improved coronary extraction algorithms feature one-touch mechanisms. Both the major CT vendors and independent workstation companies are engaged in major initiatives.
Conclusion
The development of cardiac MDCT has led to its use for a whole range of new applications. Further advancements are likely to permit reliable functional analysis and assessment of the entire coronary tree, which would lead to a paradigm shift in the imaging evaluation of cardiac disease.
References
- Schoepf U, Becker C, Hofmann L, Yucel E. Multidetector-row CT of the heart. Radiol Clin North Am. 2003;41:491-505.
- Raggi P, Cooil B, Callister T. Use of electron beam tomography data to develop models for prediction of hard coronary events. Am Heart J. 2001;141:375-382.
- Laudon D, Vukov L, Breen J. Use of electron-beam computed tomography in the evaluation of chest pain patients in the emergency department. Ann Emerg Med. 1999;33:15-21.
- Raggi P, Callister T, Cooil B. Evaluation of chest pain in patients with low to intermediate pretest probability of coronary artery disease by electron beam computed tomography. Am J Cardiol. 2000;85:283-288.
- Agatston A, Janowitz W, Hildner F. Quantification of coronary artery calcium using ultrafast computed tomography. J Am Coll Cardiol. 1990;15:827-32.
- Hoff J, Chomka E, Krainik A. Age and gender distributions of coronary artery calcium detected by electron beam tomography in 35,246 adults. Am J Cardiol. 2001;87:1335-1339.
- Becker C, Kleffel T, Crispin A. Coronary artery calcium measurement: Agreement of multirow detector and electron beam CT. AJR Am J Roentgenol. 2001;176:1295-1298.
- Nasir K, Budoff M, Post W. Electron beam CT versus helical CT scans for assessing coronary calcification: Current utility and future directions. Am Heart J. 2003;146:969-977.
- Gilkeson R, Ciancibello L, Zahka K. Pictorial essay. Multidetector CT evaluation of congenital heart disease in pediatric and adult patients. AJR Am J Roentgenol. 2003;180:973-980.
- Marom E, Herndon J, Kim Y, McAdams H. Variations in pulmonary venous drainage to the left atrium: Implications for radiofrequency ablation. Radiology. 2004;230:824-829.
- Saad E, Marrouche N, Saad C. Pulmonary vein stenosis after catheter ablation of atrial fibrillation: Emergence of a new clinical syndrome. Ann Intern Med. 2003;138:634-638.
- Nieman K, Oudkerk M, Rensing B. Coronary angiography with multi-slice computed tomography. Lancet. 2001;357:599-603.
- Achenbach S, Giesler T, Ropers D. Detection of coronary artery stenoses by contrast-enhanced, retrospectively electrocardiographically-gated, multislice spiral computed tomography. Circulation. 2001;103:2535-2538.
- Nieman K, Cademartiri F, Lemos P. Reliable noninvasive coronary angiography with fast submillimeter multislice spiral computed tomography. Circulation. 2002;106:2051-2054.
- Ropers D, Baum U, Pohle K. Detection of coronary artery stenoses with thin-slice multi-detector row spiral computed tomography and multiplanar reconstruction. Circulation. 2003;107:664-666.
- Maintz D, Grude M, Fallenberg E. Assessment of coronary arterial stents by multislice-CT angiography. Acta Radiol. 2003;44((1)):597-603.
- Yoo K, Choi D, Choi B. The comparison of the graft patency after coronary artery bypass grafting using coronary angiography and multi-slice computed tomography. Eur J Cardiothorac Surg. 2003;24:86-91.
- Dewey M, Lembcke A, Enzweiler C. Isotropic half-millimeter angiography of coronary artery bypass grafts with 16-slice computed tomography. Ann Thorac Surg. 2004;77:800-804.
- Halliburton S, Petersilka M, Schvartzman P. Evaluation of left ventricular dysfunction using multiphasic reconstructions of coronary multi-slice computed tomography data in patients with chronic ischemic heart disease: Validation against cine magnetic resonance imaging. J Cardiovasc Imaging. 2003;19:73-83.
- Mahnken A, Spuentrup E, Niethammer M. Quantitative and qualitative assessment of left ventricular volume with ECG-gated multislice spiral CT: Value of different image reconstruction algorithms in comparison to MRI. Acta Radiol. 2003;44:604-611.
- Juergens K, Grude M, Maintz D. Multi-detector row CT of left ventricular function with dedicated analysis software versus MR imaging: initial experience. Radiology. 2004;230:403-410.
- Mochizuki T, Higashino H, Koyama Y. Clinical usefulness of the cardiac multi-detector-row CT. Comput Med Imaging Graph. 2003;27((1)):35-42.
- Trabold T, Buchgeister M, Kuttner A. Estimation of radiation exposure in 16-detector row computed tomography of the heart with retrospective ECG-gating. Rofo Fortschr Geb Rontgenstr Neuen Bildgeb Verfahr. 2003;175:1051-1055.
- Hunold P, Vogt F, Schmermund A. Radiation exposure during cardiac CT: Effective doses at multi-detector row CT and electron-beam CT. Radiology. 2003;226:145-152.
- Poll L, Cohnen M, Brachten S. Dose reduction in multi-slice CT of the heart by use of ECG-controlled tube current modulation (“ECG pulsing”): Phantom measurements. Rofo Fortschr Geb Rontgenstr Neuen Bildgeb Verfahr. 2002;174:1500-1505.
Citation
. Cardiac CT: Is multidetector imaging a paradigm shift?. Applied Radiology. 2004;33(11):12-22. doi:10.37549/AR1298.