Cerebral venous thrombosis and infarct: Review of imaging manifestations
Applied Radiology — Vol. 45 , Issue 3 , pp. 9 -17
DOI: 10.37549/AR2263
Published: March 1, 2016
Categories
Cerebral venous thromboses and infarcts are rare but serious conditions with devastating consequences without prompt diagnosis and treatment. They are reported to occur in 2 to 7 persons per million annually.1 There is wide variability in their clinical presentation as well as in their imaging manifestations. Imaging can vary from the most subtle findings of sulcal effacement to the extremely complex, with concomitant infarct, vasogenic edema often complicated by hemorrhage, thus making cerebral venous thrombosis a challenging diagnosis to both radiologists and clinical colleagues.
A proper history, high index of suspicion and proper interpretation of images are necessary for prompt diagnosis, treatment and favorable patient outcome. However, even when the correct diagnosis of venous infarct is made, controversy and uncertainty surrounding the best course of treatment make for a challenging discussion.This article will cover the various imaging presentations of venous infarcts, diagnostic pitfalls and current treatment recommendations.
Background
Understanding the pathophysiology of venous thromboses and infarcts helps to explain the imaging manifestations and natural evolution of venous infarcts. Venous thrombosis can occur spontaneously or secondary to trauma, infection or as a complication of surgery. Transient states of hypercoagulability from dehydration, oral contraceptives, and pregnancy or permanent hypercoagulability from genetic causes or chronic physiologic states such as malignancy are risk factors.
Cerebral veins are thin, valveless structures that do not contain smooth muscle.2 Venous infarcts occur due to obstruction of the venous system by thrombus or external compression. Subsequently, venous pressure continues to rise leading to cortical edema and the appearance of vasogenic edema on imaging. Eventually, the continued rise in venous pressure overcomes the arterial inflow pressure, ultimately leading to cytotoxic edema.3 Cerebral edema can exacerbate the degree of venous obstruction leading to a cyclical cascade of edema and further cerebral venous obstruction. Hydrocephalus may occur in the early phases due to decreased cerebrospinal fluid absorption, contributing to elevated intracranial pressures.4 The rate of rise in venous pressure depends on the acuity of the venous occlusion and whether or not venous collaterals can be recruited to dampen the rise of venous pressure. If the rate of rise in venous pressure is rapid, the friable valveless venous vasculature is unable to withstand the pressure, ultimately leading to parenchymal hemorrhage.Direct venous pressure measurements are reported to range from 42 mmHg to 51 mmHg (57 cmH2O to 69 cmH2O) in patients with stage IV venous thrombosis with parenchymal hemorrhage, which all resolved after thrombolysis.4
Cerebral venous thrombosis however does not always result in infarct.Approximately, 50% of patients with cerebral venous thrombosis progress to venous infarct.Moreover, other studies have suggested that unlike arterial infarcts, venous infarcts caused by cerebral venous thrombosis are reversible with anticoagulation treatment in as high as 50% of patients.4-5 Potential reversibility of venous infarct with anticoagulation highlights the importance of prompt diagnosis.
Data acquisition
Head CT examination was performed on GE scanners (Milwaukee, WI) without contrast using the following parameters: slice thickness 2.5-5 mm, field of view 220-250 mm, kVp 120, mA 110-320.CT venogram was performed on GE scanners (Milwaukee, WI) after intravenous contrast administration OminpqueTM 350 100mls using the following parameters: slice thickness 2.5-5 mm, field of view 180-250, kVp 120-140, mA 180-220.
Magnetic resonance images were obtained using a GE 1.5-T unit (Milwaukee, WI). An MR venogram was performed using 2D time of flight (TOF) with slice thickness of 2 mm with slice gap of 1-2 mm. Standard noncontrast MR images were performed with slice thickness of 5 mm, slice gap of 6.5 mm, field of view 220-250 mm. Postcontrast T1-weighted MR images were obtained after intravenous administration of 10 mls of OmniscanTM.
Imaging findings
Hyperdense sinus or T1-hyperintense sinus
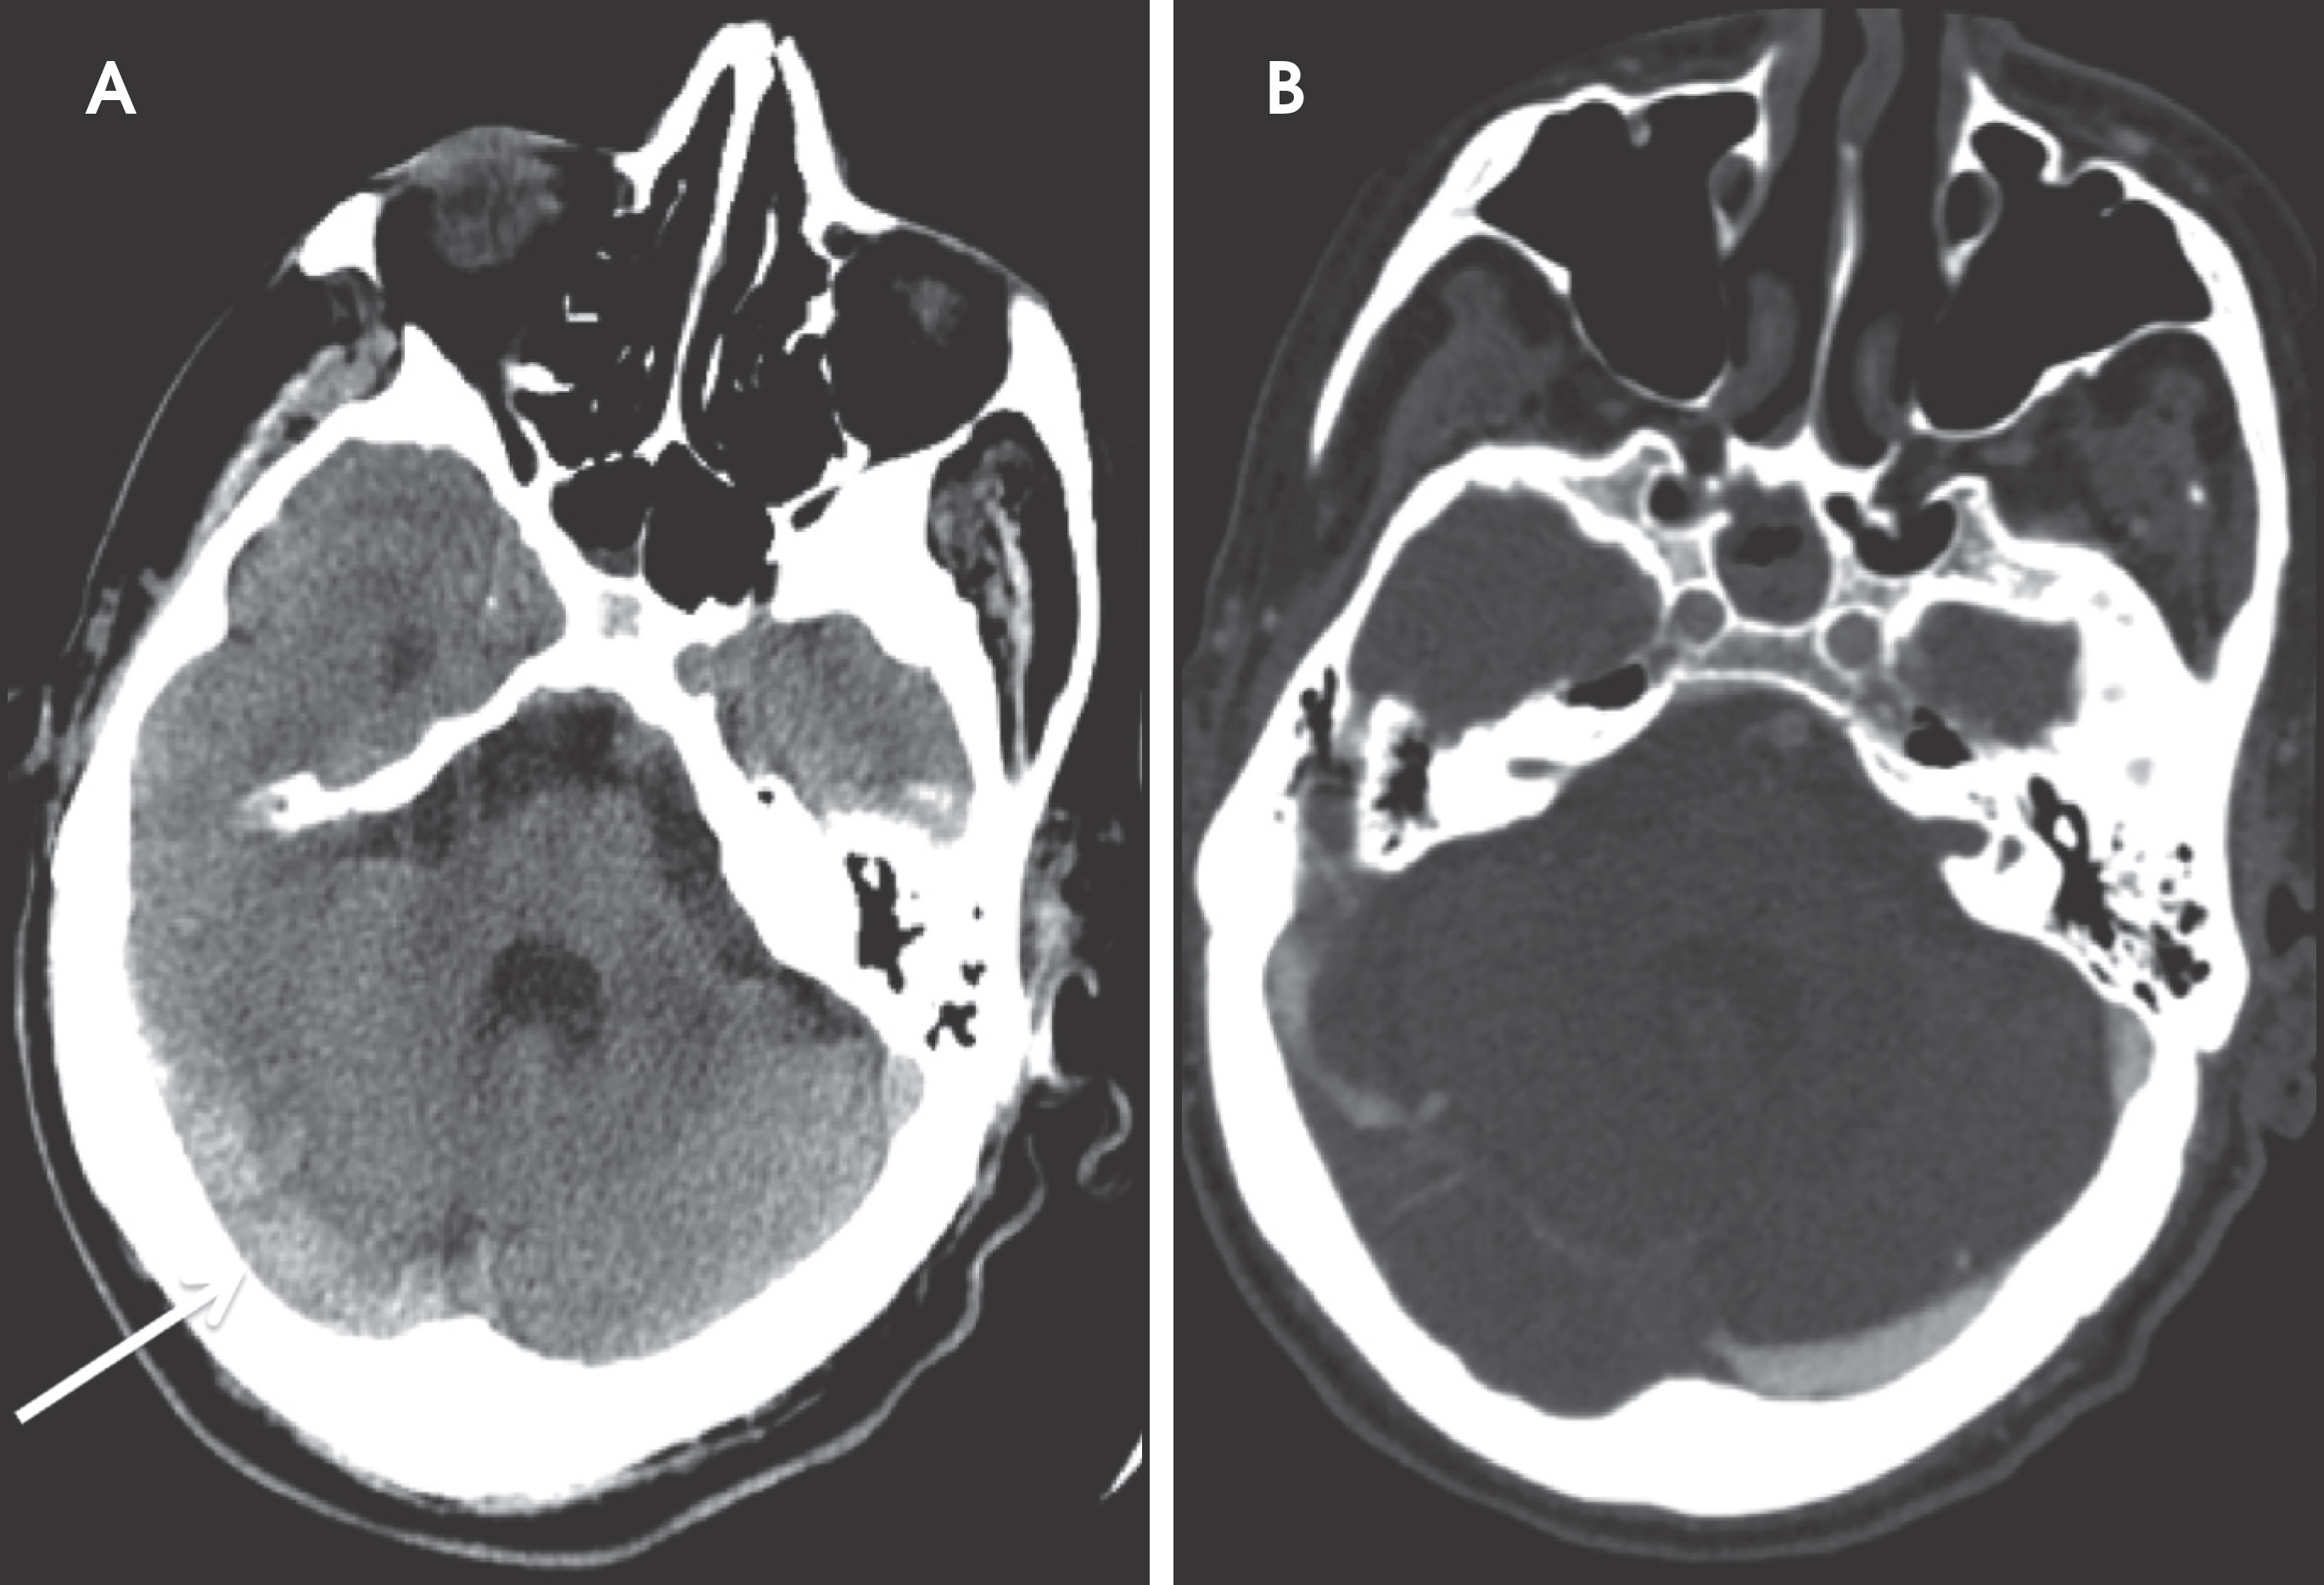
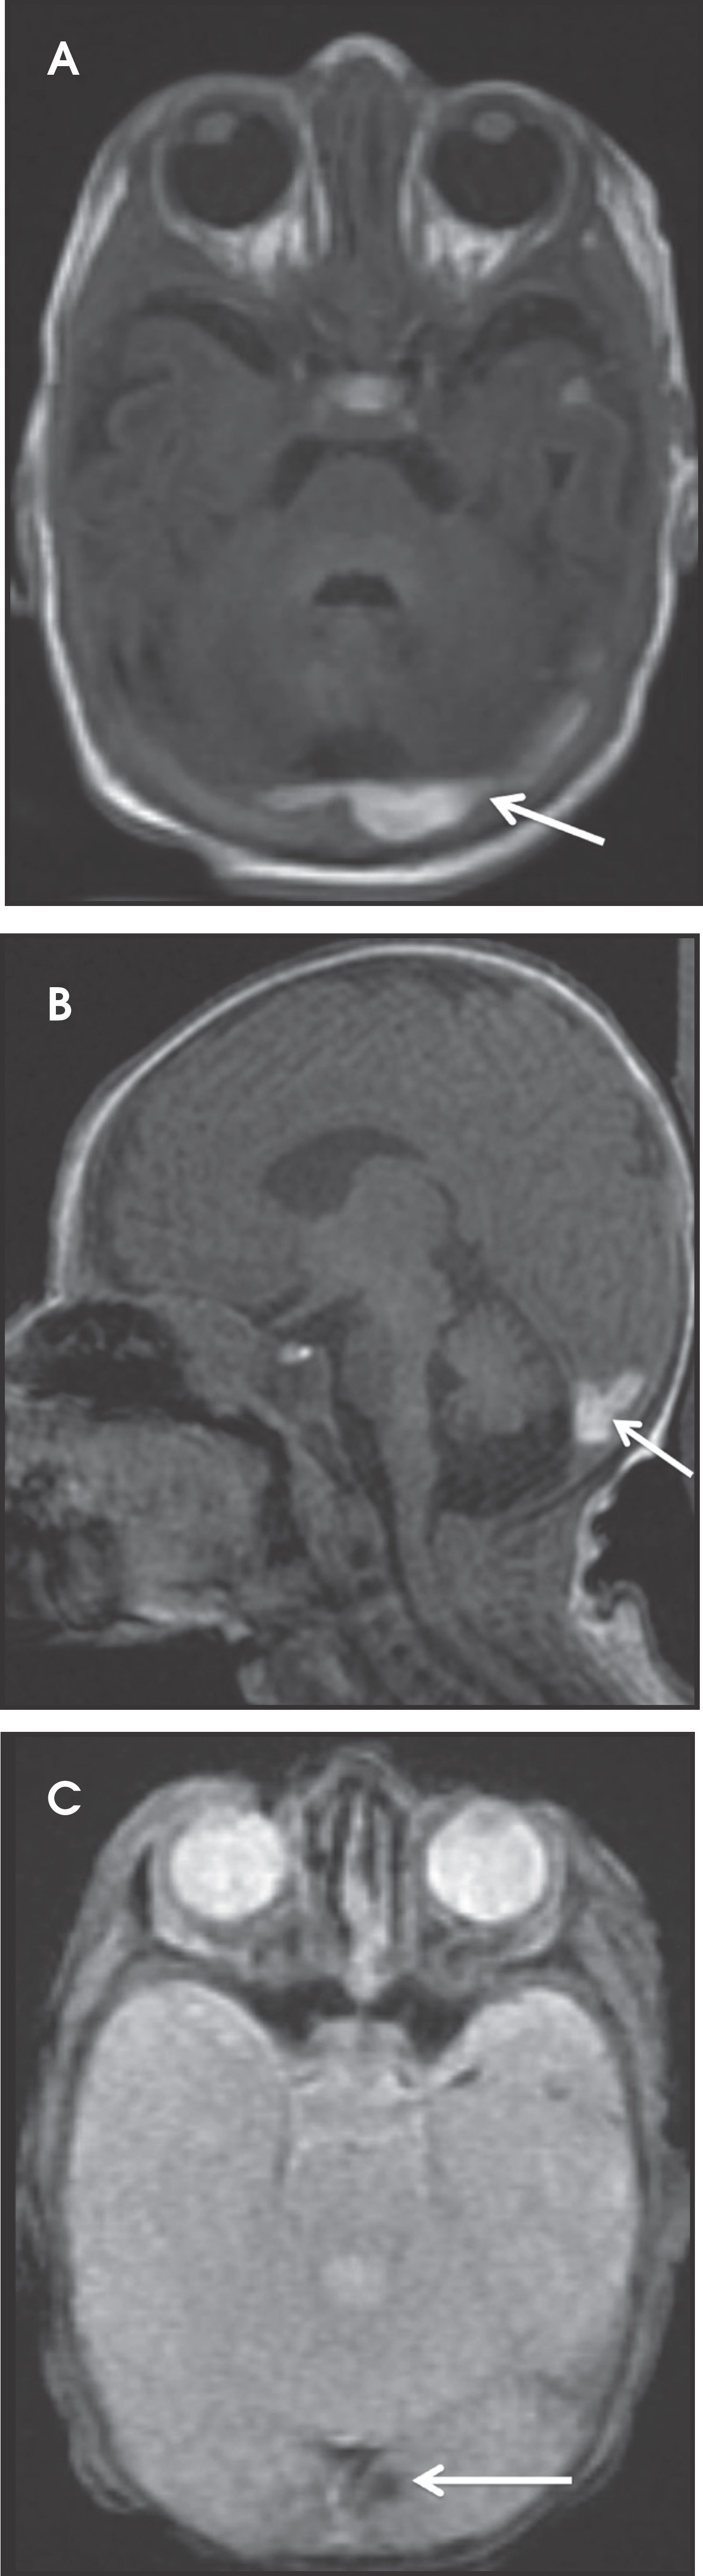
Findings of cerebral venous thrombosis can be subtle on imaging. When the clinical presentation is non-specific, a noncontrast CT is usually the first imaging exam performed. A hyperdense sinus may be the only sign of a thrombosed dural sinus in the absence of venous infarction (Figure 1A). In cases where a hyperdense sinus is suspected, a CT or MR venogram is performed which demonstrates a filling defect within the sinus in question (Figure 1B). When MRI of the brain is the initial exam, a T1 hyperintense thrombus or loss of T2 flow void effect may be found within the dural sinus (Figure 2). The gradient echo sequence may demonstrate susceptibility hypointensity within the thrombosed venous sinus (Figure 2C). However, the hyperdense sinus sign has a wide range in reported sensitivity of 25-64%,6 and is not consistently reliable due to variability of sinus attenuation.1 The vertex and posterior fossa are locations where the superior sagittal, transverse and sigmoid sinuses reside, but are frequently obscured from beam hardening on noncontrast CT, contributing to the decreased reliability of the hyperdense sinus sign. Also, the offending vein is not always identified when small cortical veins are involved, presumably from recanalization after the subsequent insult by hemorrhage or infarct occurs.
Cerebral edema
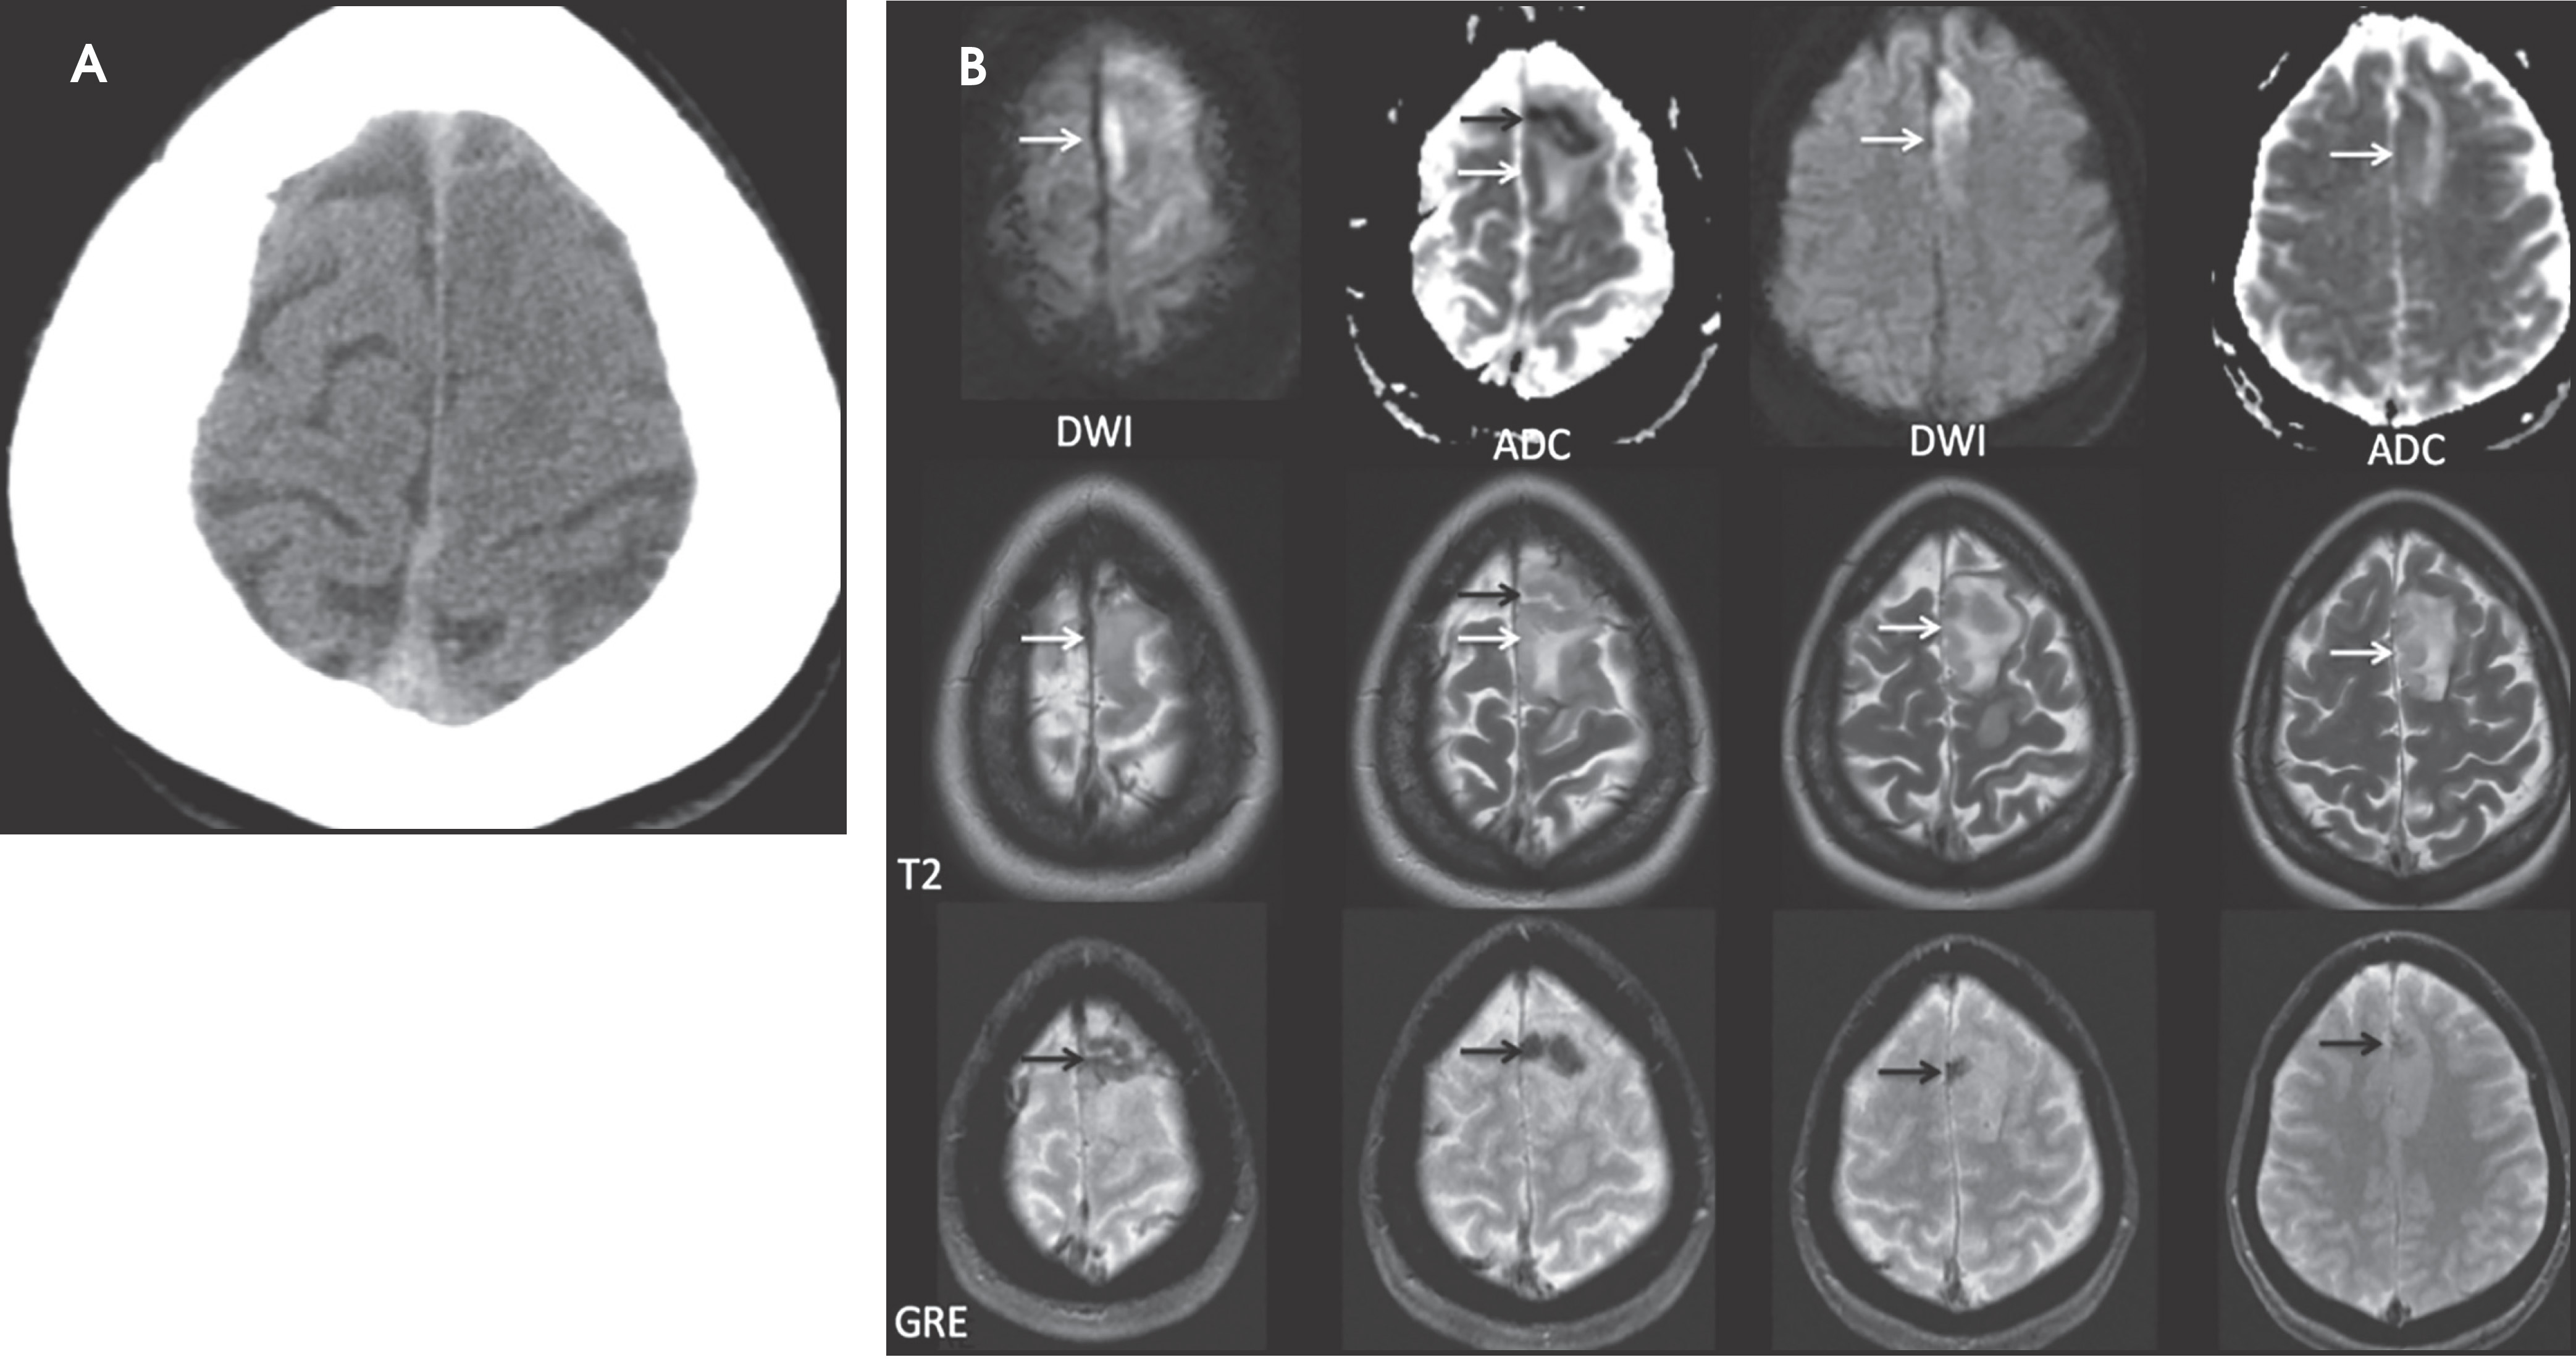
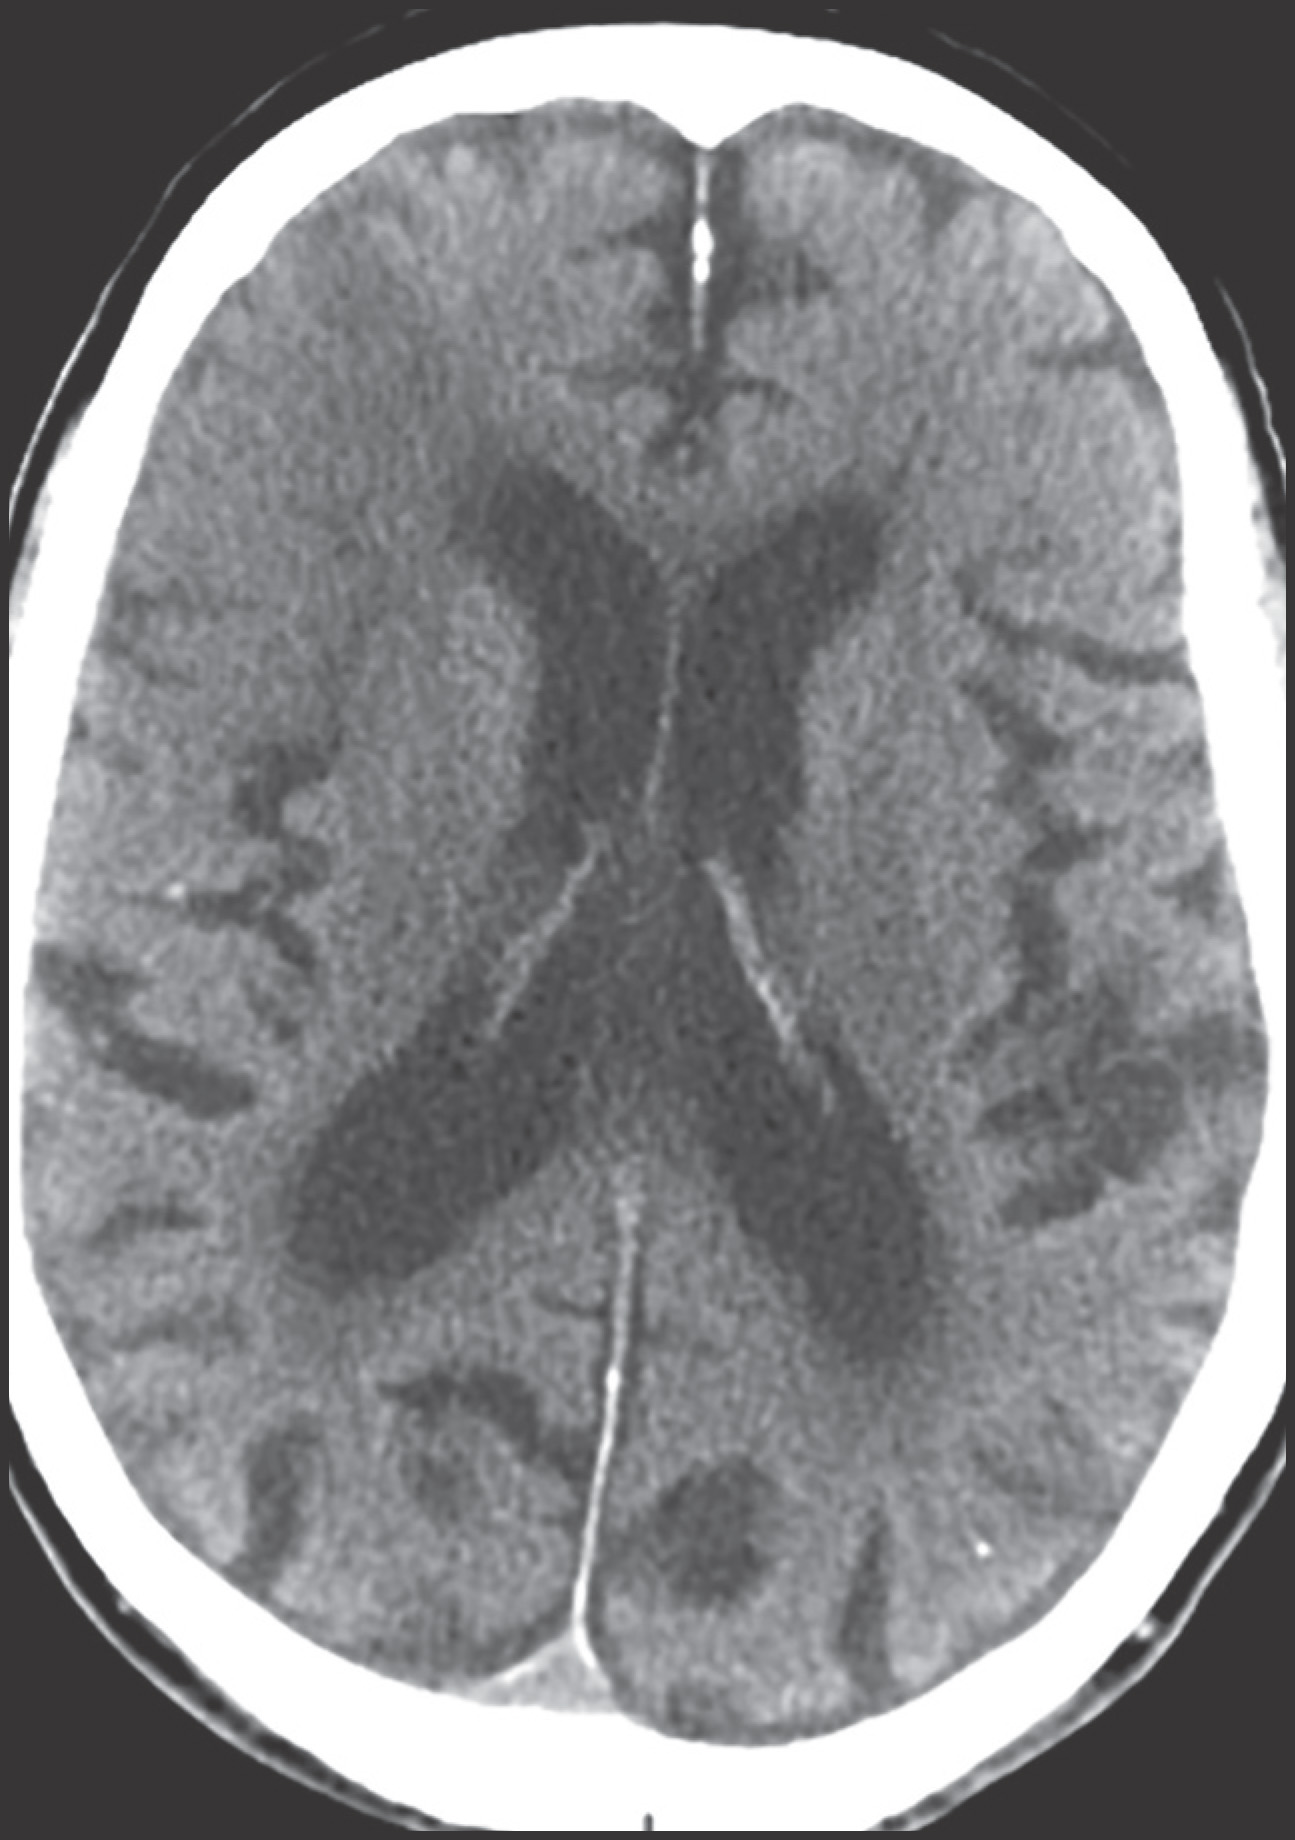
Sometimes, only secondary signs of cortical swelling and infarct are apparent on noncontrast CT, raising the question of venous thrombosis. The earliest sign of venous infarct is gyral swelling, which is often extremely subtle and only appreciable by noticing the effacement of the adjacent sulci (Figure 3). Gray-white differentiation will be relatively preserved and frequently accentuated with the presence of vasogenic edema (Figure 4) mimicking an underlying mass. In contrast, arterial infarct presents with cytotoxic edema with blurring of the gray and white matter interface from edema distal from the point of occlusion (Figure 5). Vasogenic edema is best identified on T2 or T2 FLAIR-weighted sequences, which presents as T2 hyperintensity of the subcortical and periventricular white matter with sparing of the cerebral cortex. Differentiation of vasogenic and cytotoxic edema within a venous infarction, which can be present concurrently, is made with diffusion-weighted sequence (DWI), with restricted diffusion representing cytotoxic edema and T2 shine through representing vasogenic edema.
Hemorrhage
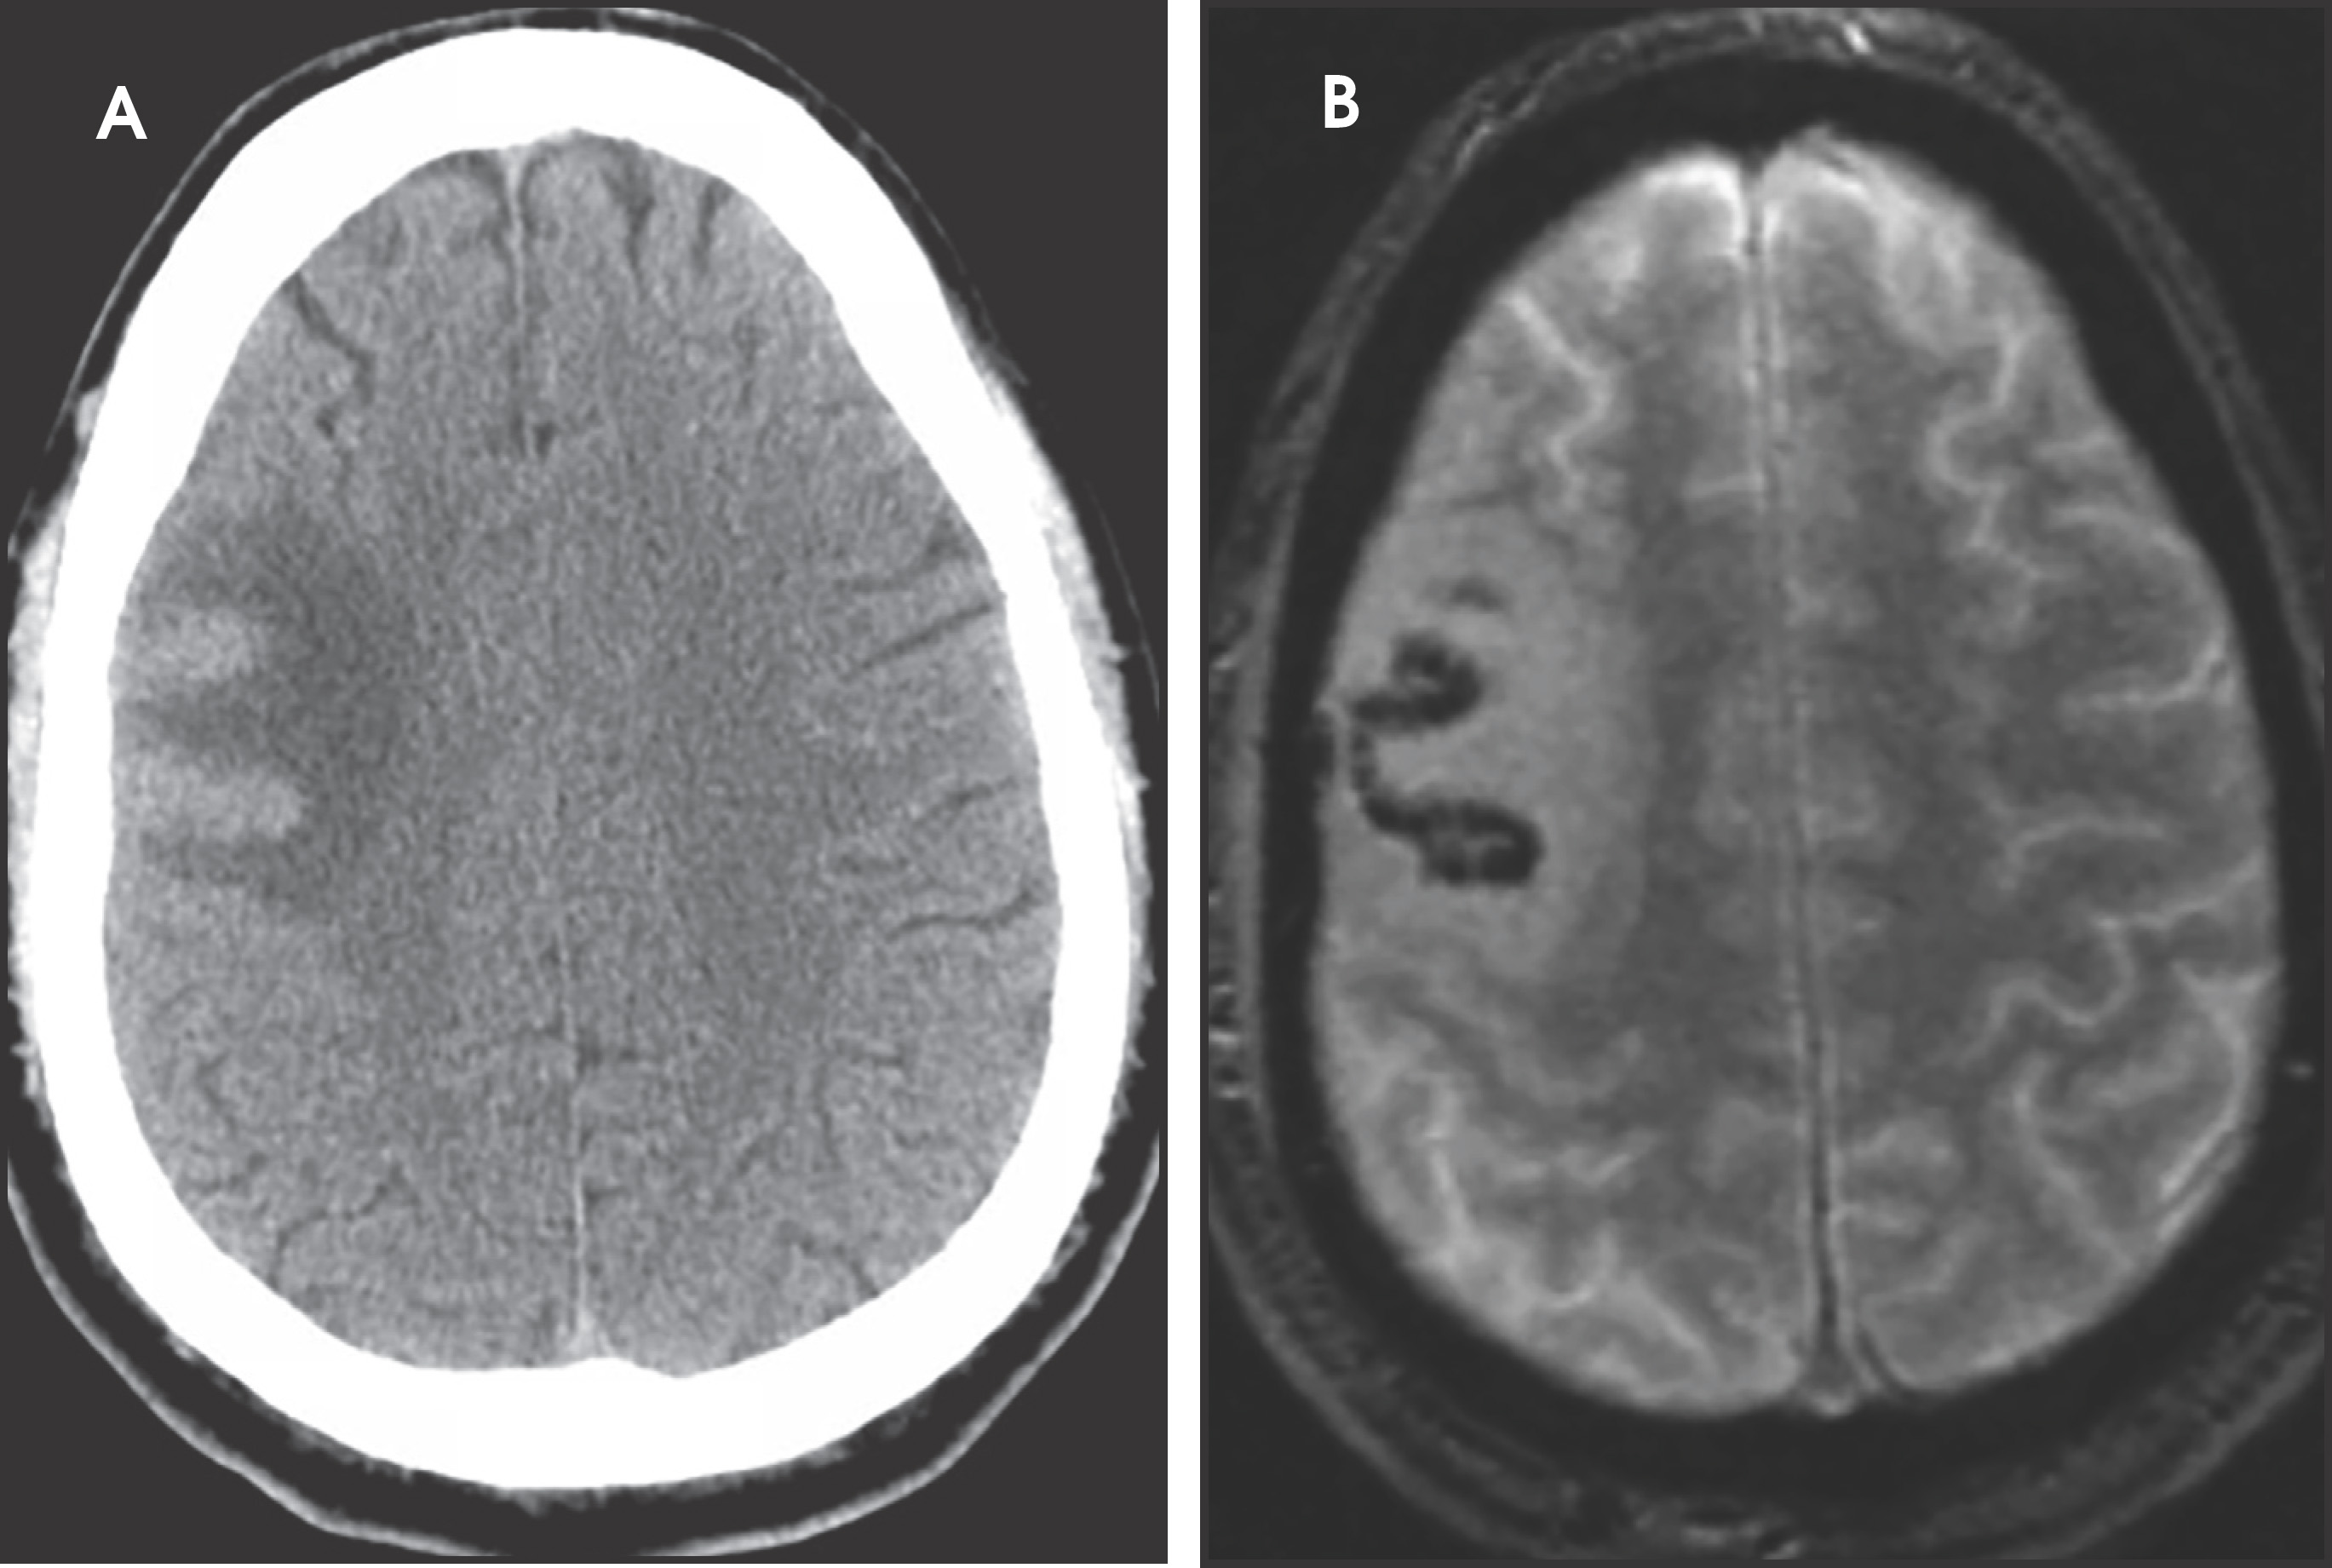
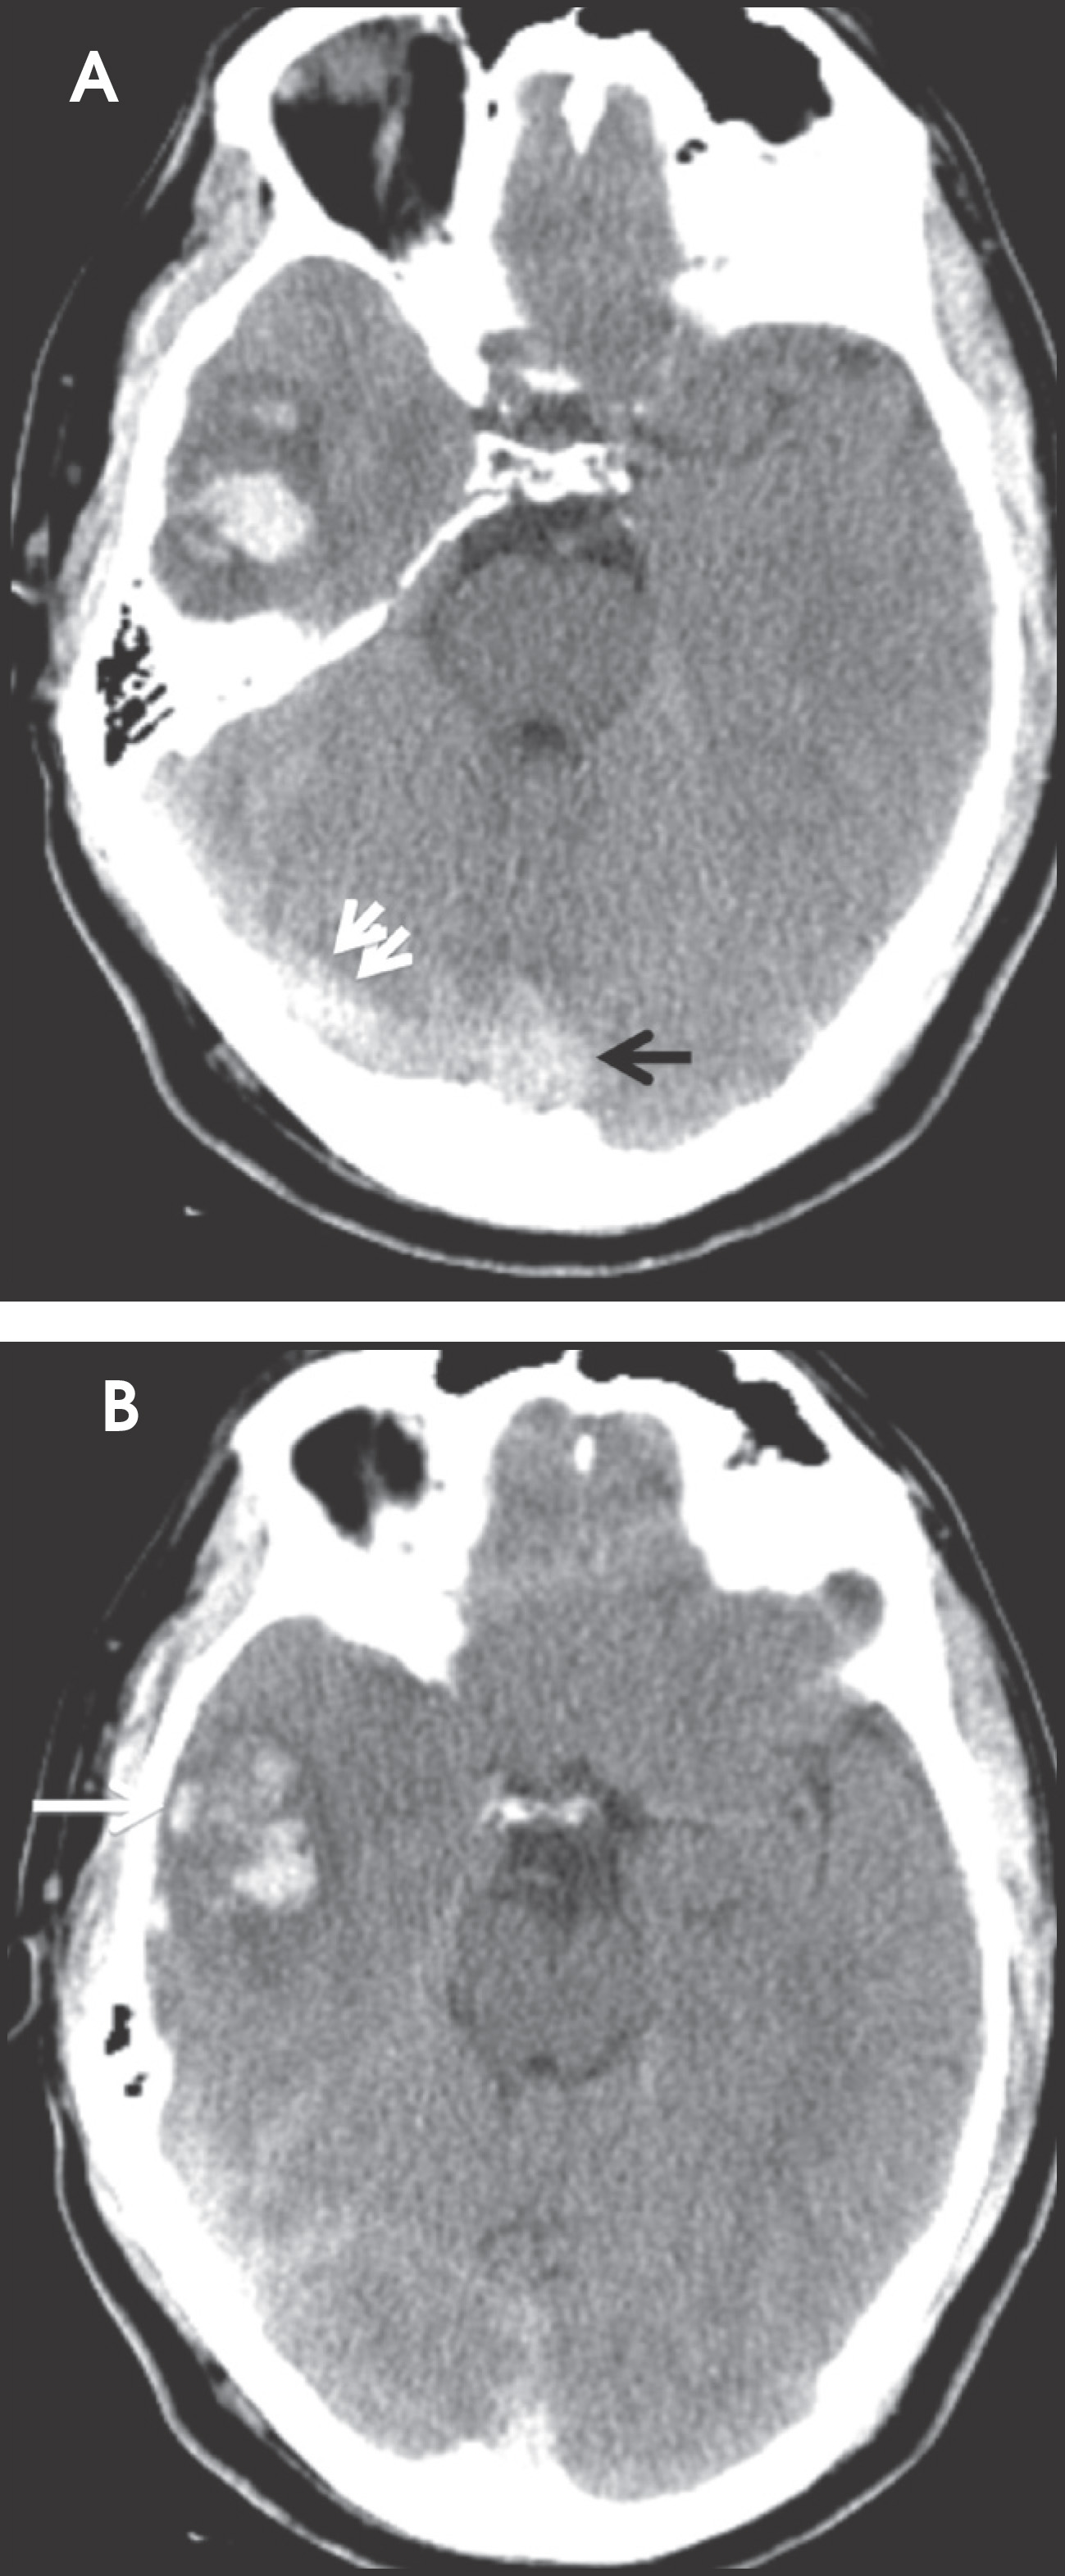
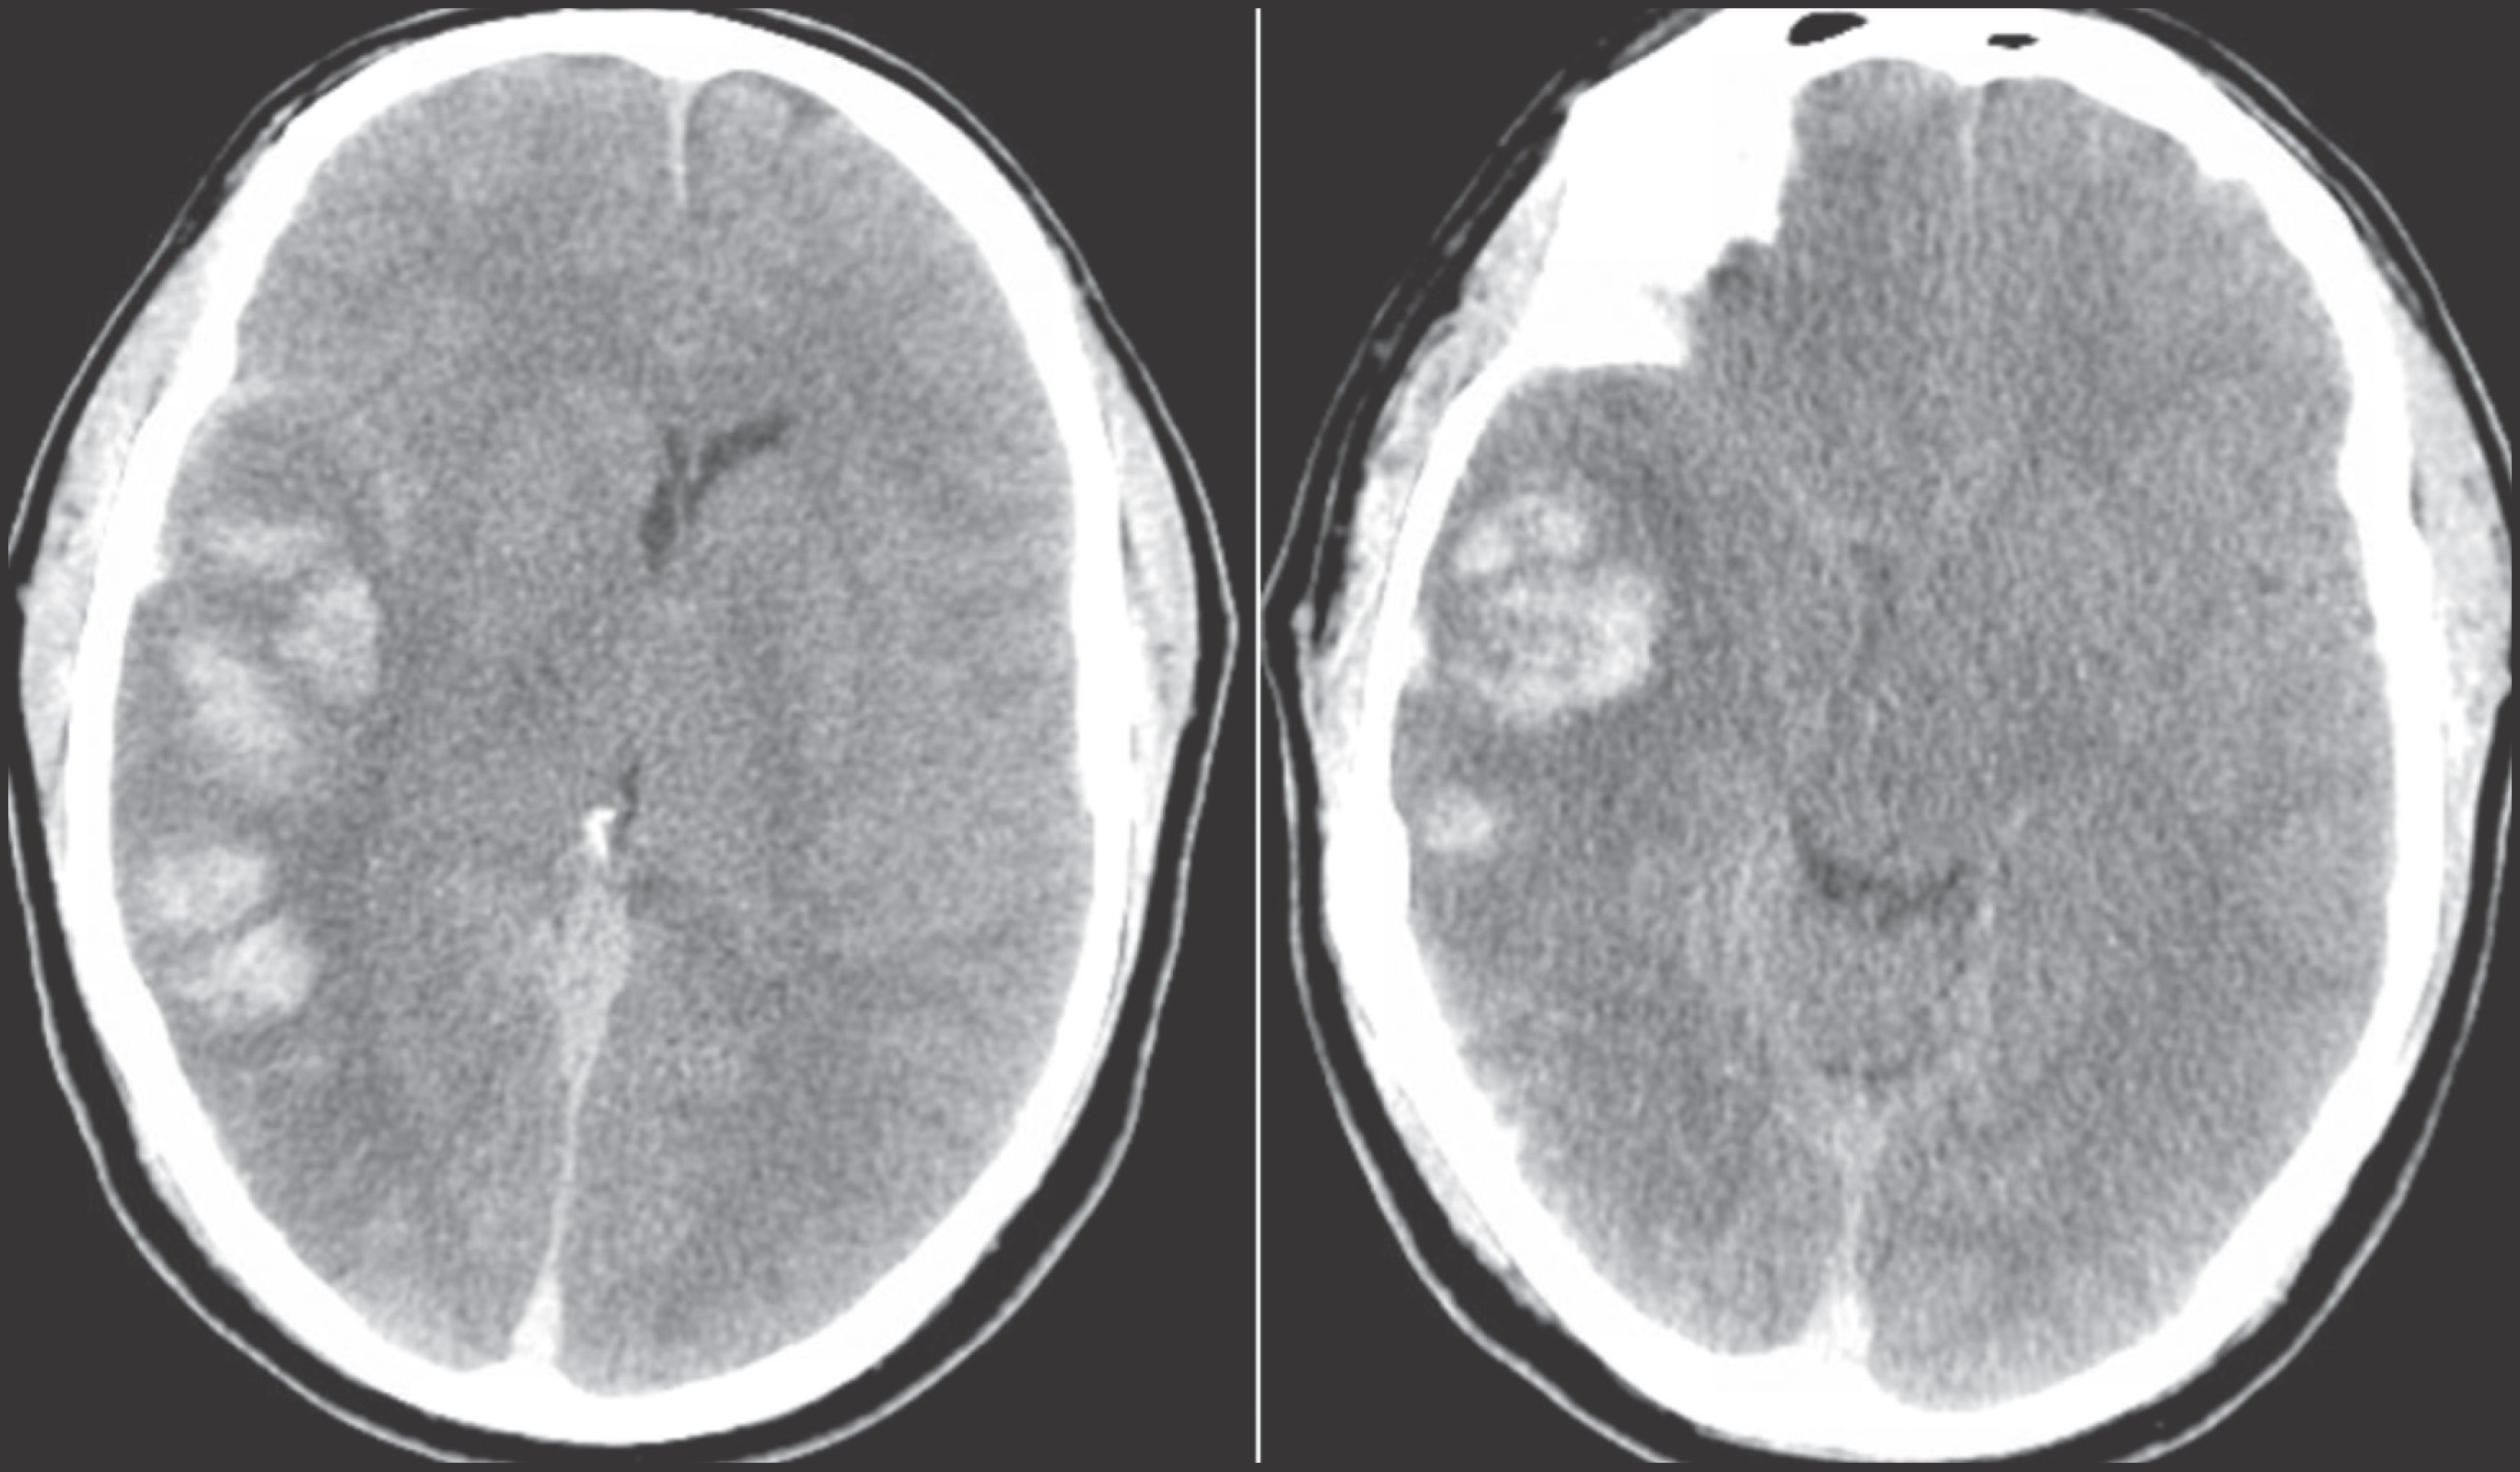
Venous infarcts can sometimes present with parenchymal hemorrhage and is estimated to occur in 30-40 % of patients with cerebral venous thrombosis.7 Hemorrhage is typically cortical or paramedian in location and not confined to a typical arterial vascular territory (Figures 6-8). In Figure 6, there is right temporal lobe cortical hemorrhage from a thrombosed inferior anastomotic vein (vein of Labbé), while in Figure 9 there is hematoma of the left occipital lobe from cortical vein thrombus. Diagnosis is sometimes hindered when the clinical history is obscured by trauma which may happen subsequent to the neurologic deficit as a result of the venous infarct and hemorrhage.
Noncontrast CT head and the T2* weighted MRI sequence are used to identify intraparenchymal hemorrhage with the greatest sensitivity.
Pitfalls in diagnosis
Clinical history
History is critical to prompt diagnosis and essential to avoid misinterpretation. Figure 3 demonstrates a case of a young woman in her first trimester of pregnancy presenting with seizure. There was a high clinical suspicion for venous thrombosis because of the early gestational age of her pregnancy and her transient state of hypercoagulability. Left paramedian gyral swelling and a hyperdense superior sagittal sinus from thrombosis and subsequent venous cortical edema and infarct was the most reasonable diagnostic possibility. However, without the proper history, the imaging findings on this noncontrast CT are much more nonspecific, and can include encephalitis or post-ictal cerebral edema. Imaging findings of venous infarct can be extremely complex with concomitant findings of hyperdense vein or venous sinus, vasogenic edema and hemorrhage (Figure 9). Common competing differential possibilities are trauma, tumor and infection.
Trauma
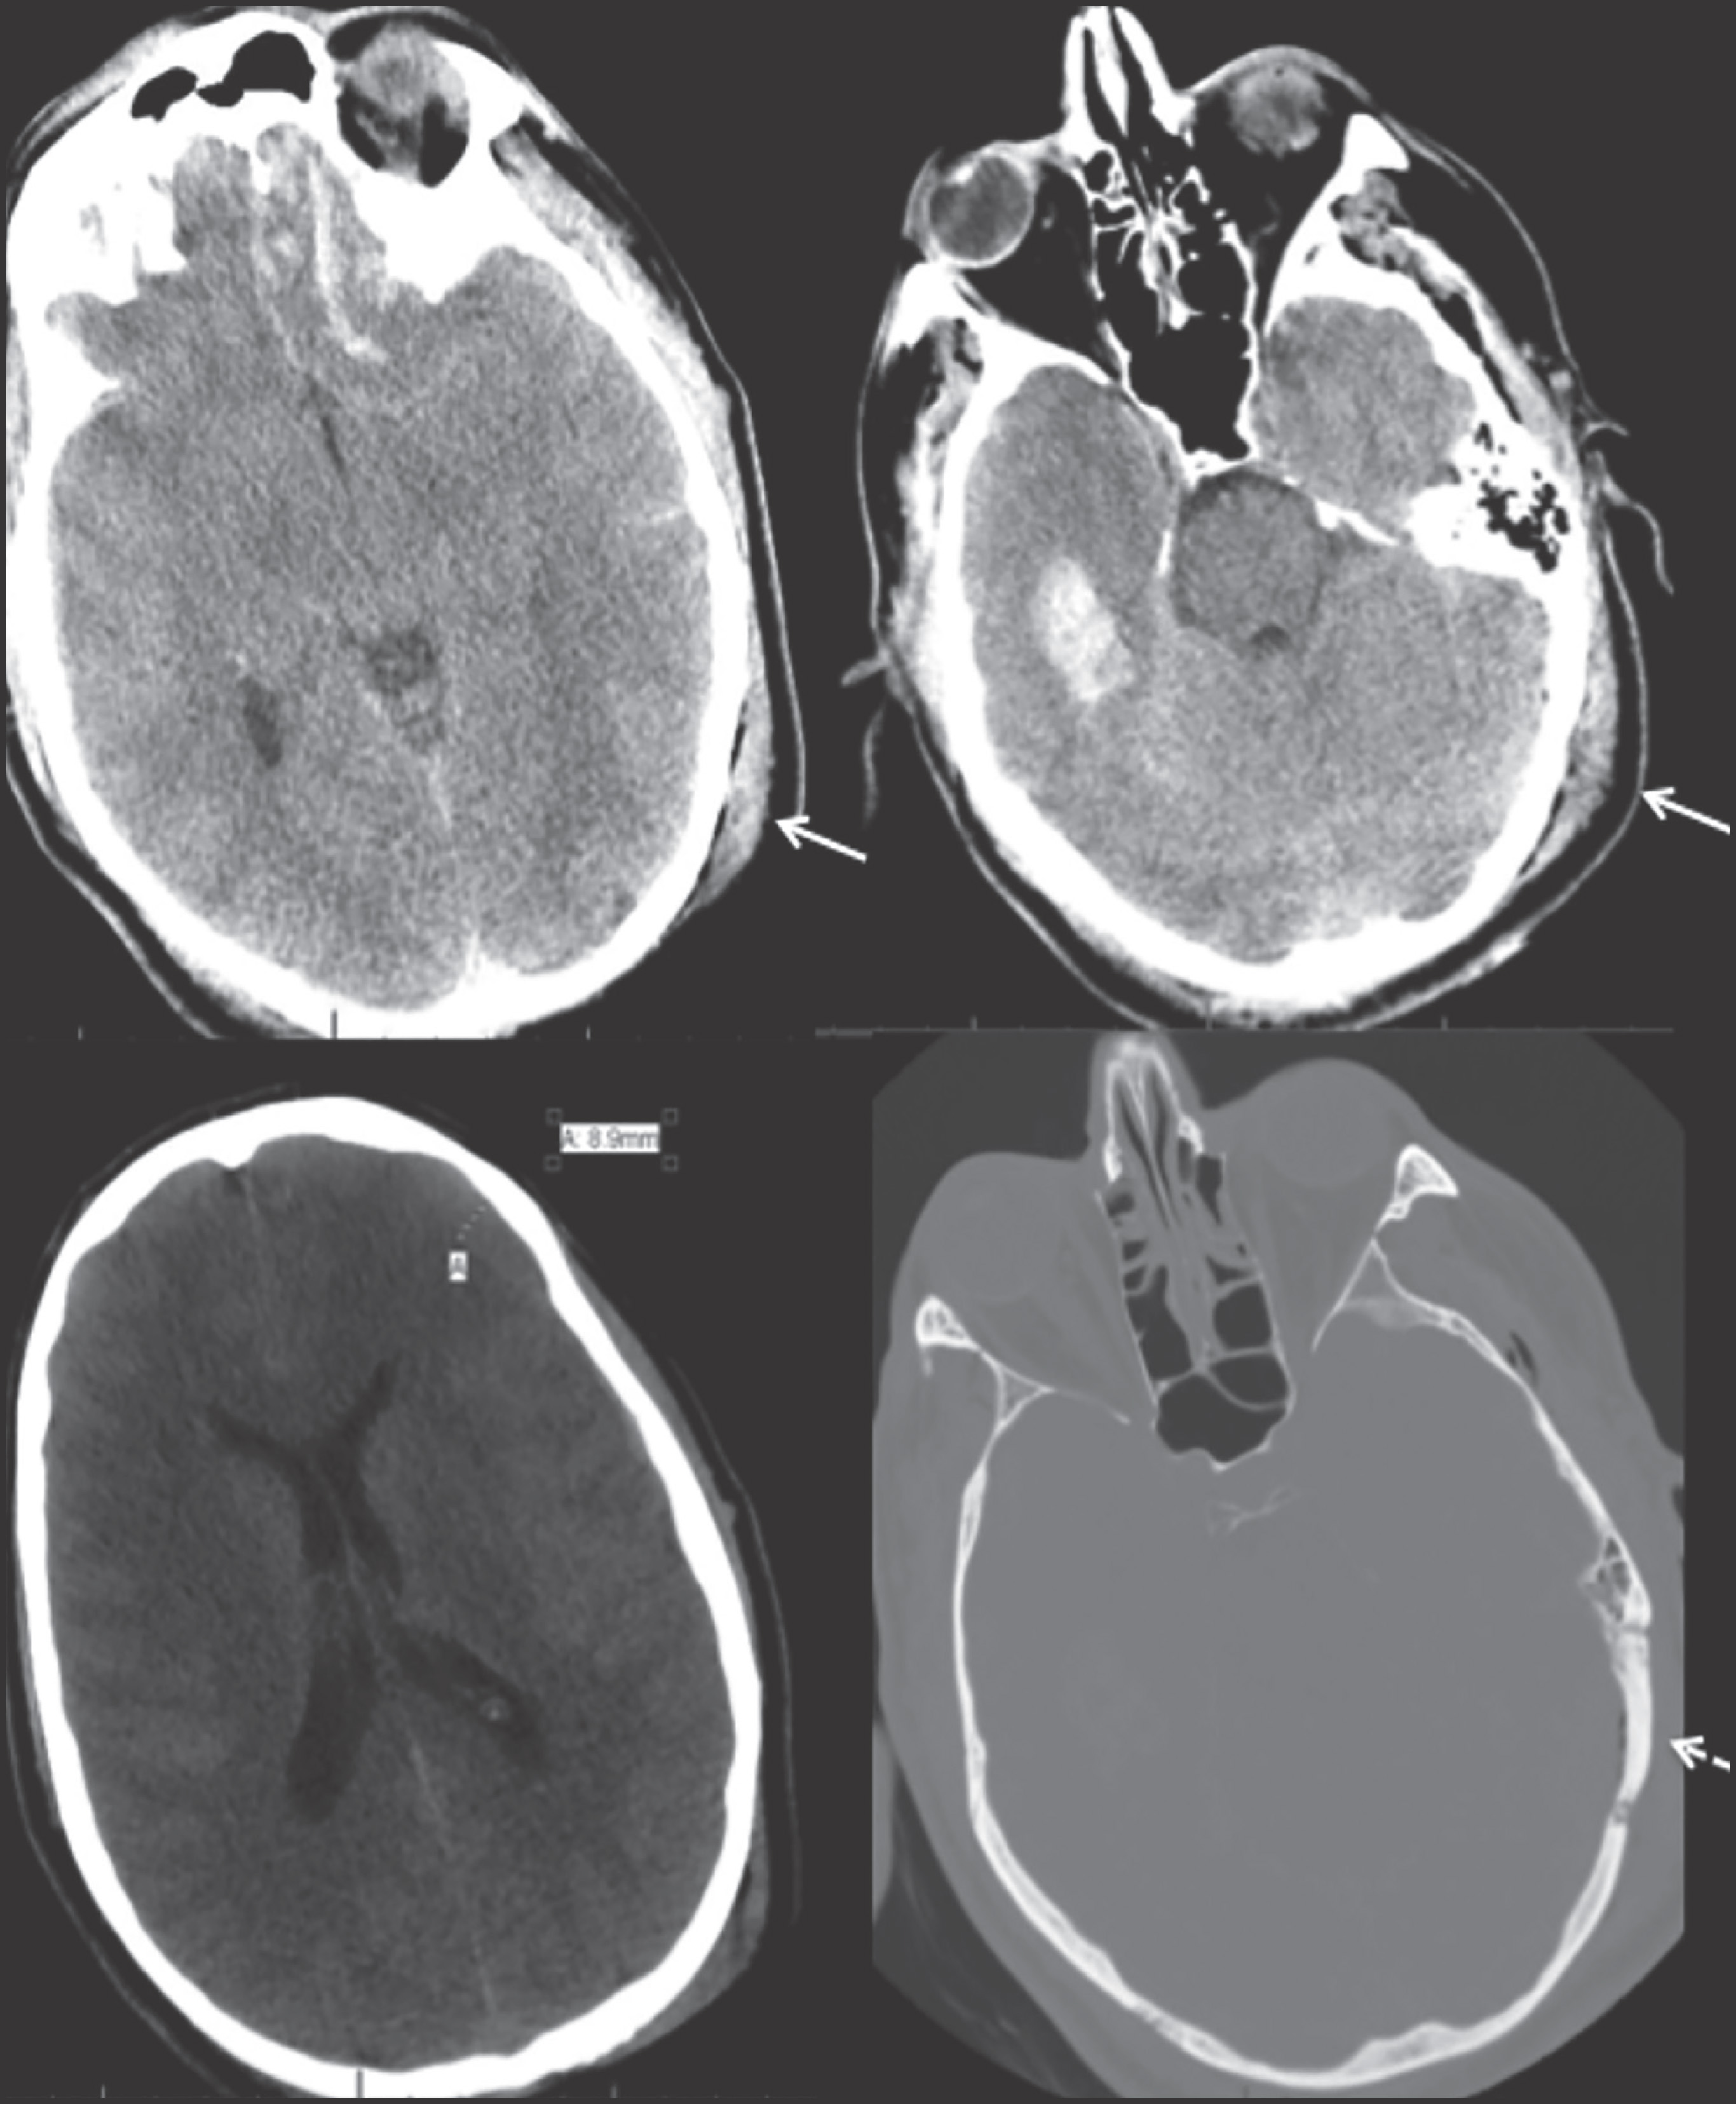
Trauma is the most common cause of parenchymal hemorrhage and may be a source of diagnostic confusion (Figure 10). However, traumatic hemorrhage usually occurs in typical locations such as the orbital frontal gyrus and temporal poles because of their relationship along the anterior and middle skull base and susceptibility to the greatest shearing forces. But parenchymal hemorrhage can occur anywhere at the impact, “coup” site with typical “contrecoup” hemorrhage occurring directly opposite. Figure 10 shows contrecoup parenchymal hemorrhage of the left orbital frontal gyrus and right temporal lobe with left frontal epidural hematoma (blood window). Direct (coup) impact the left temporal and occipital scalp result in temporal bone fracture and pneumocephalus.
Infection
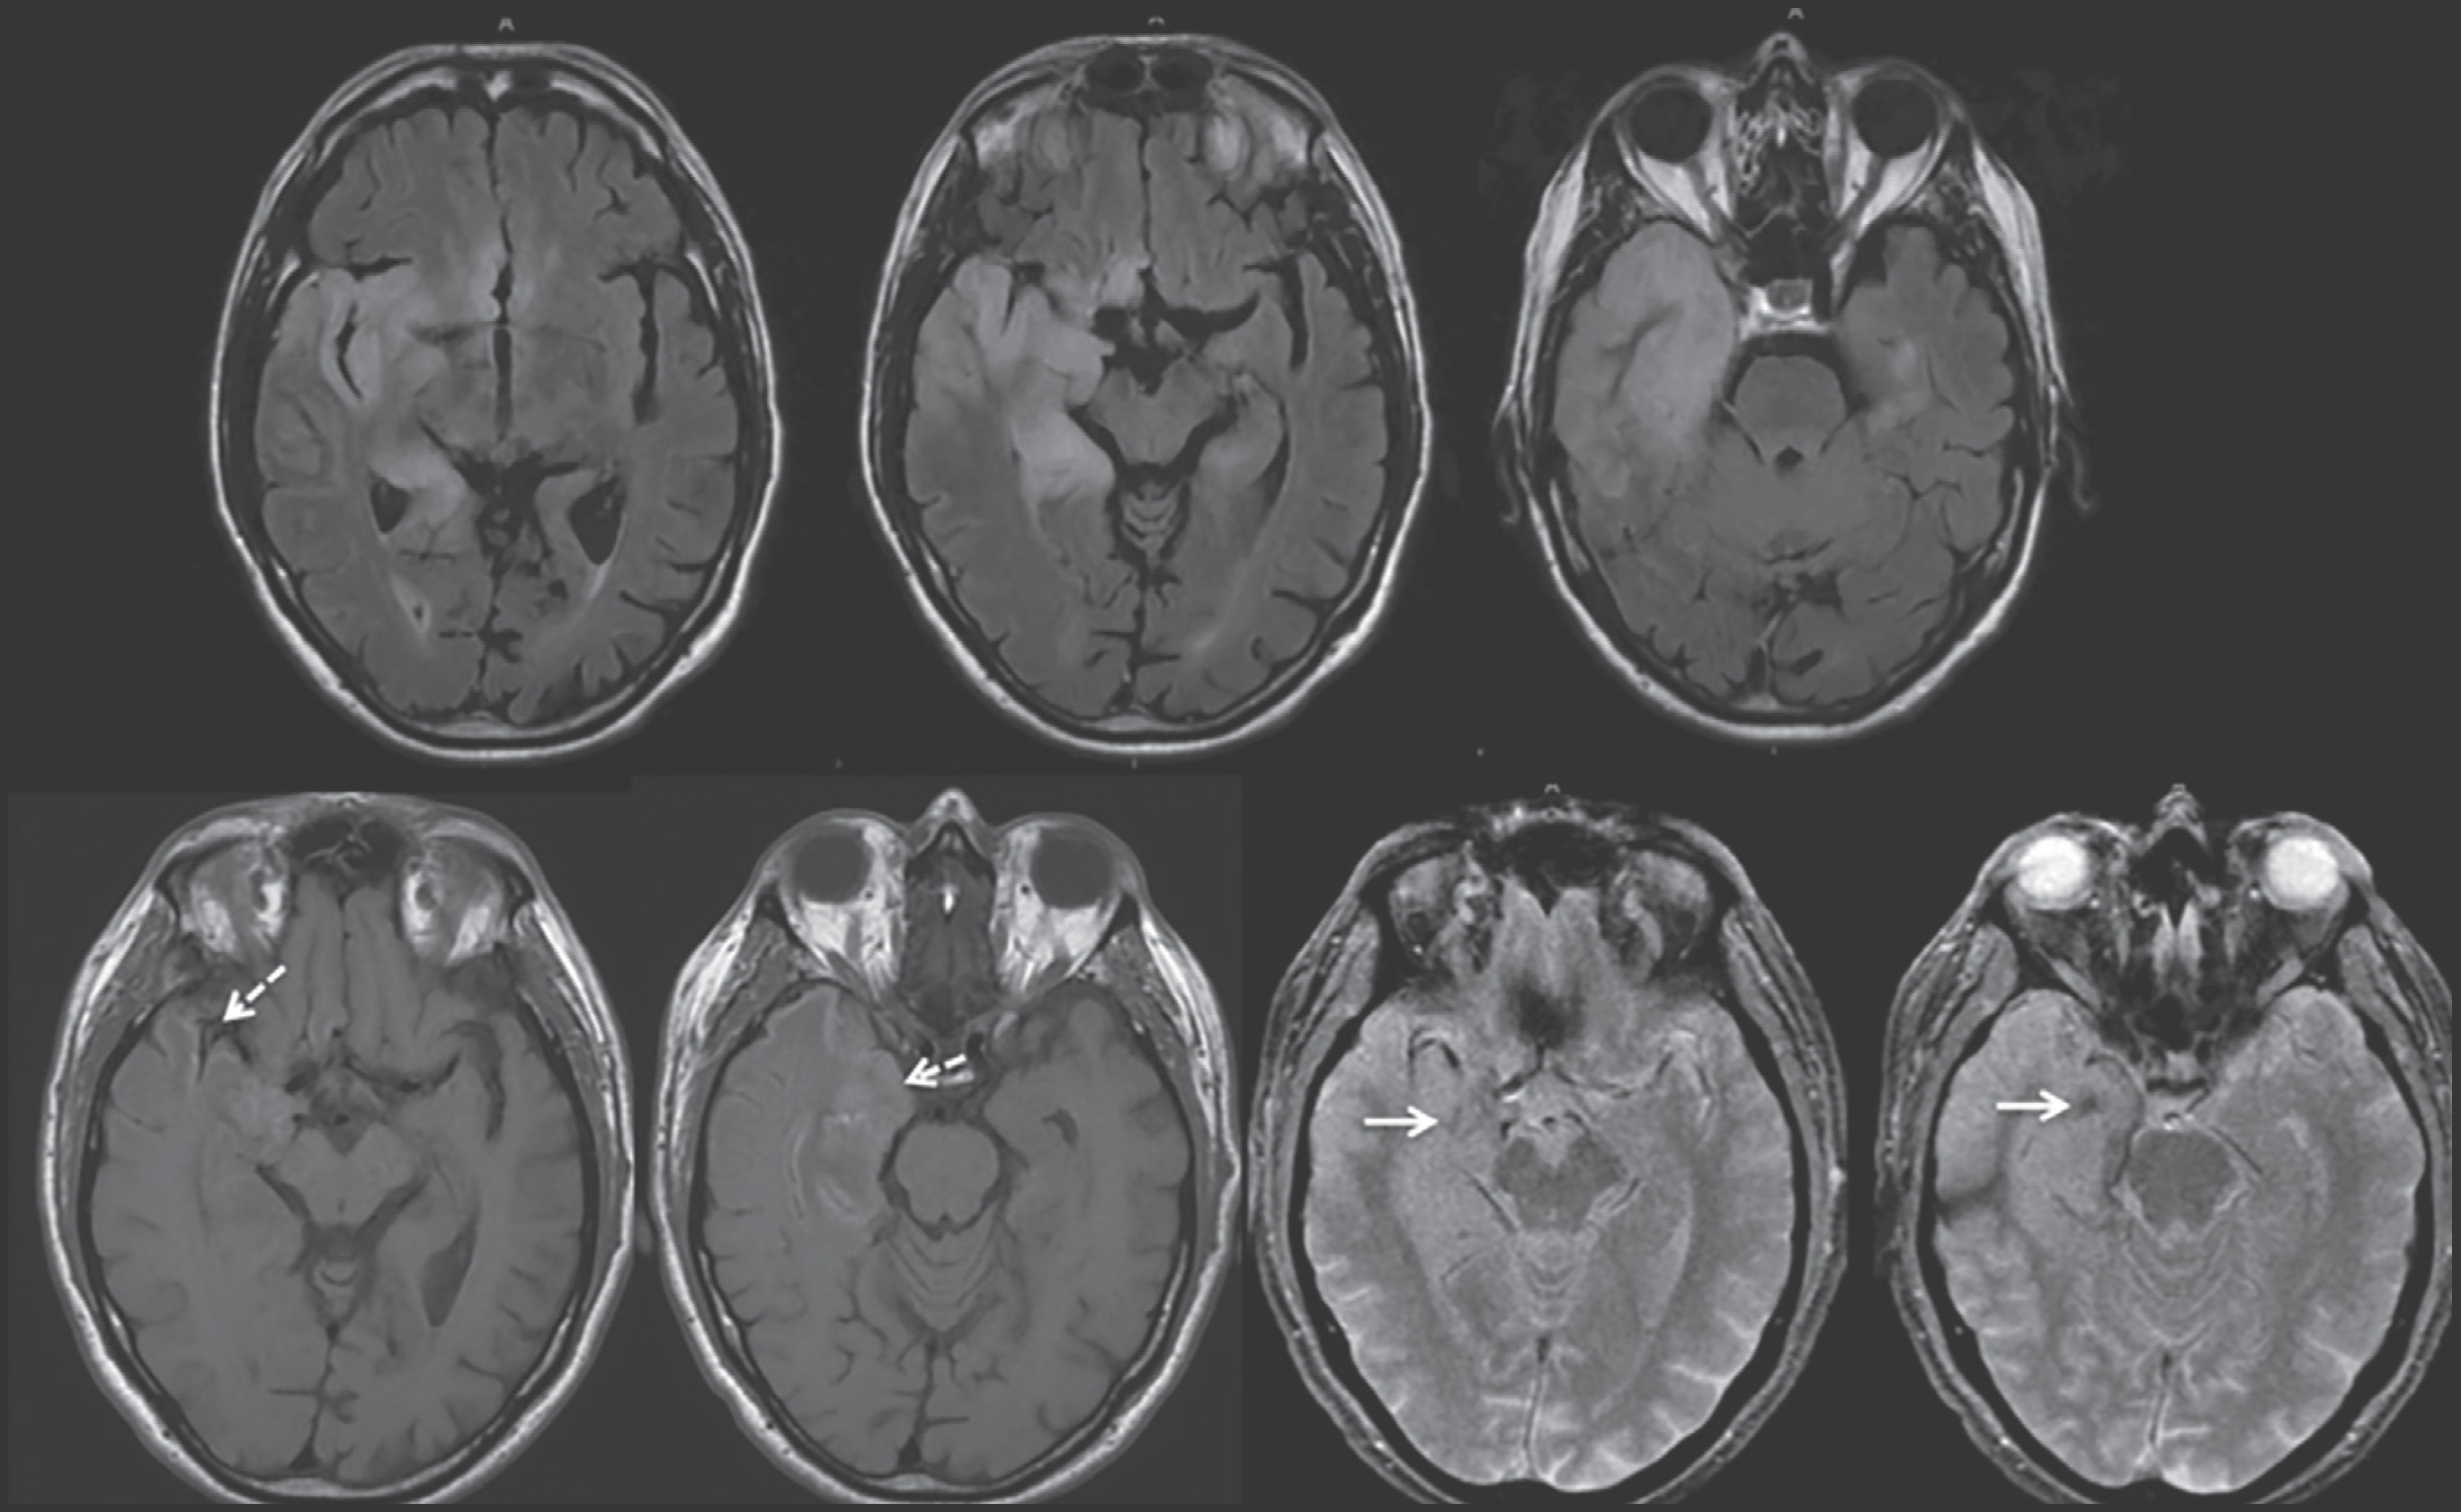
Herpes encephalitis typically involves the temporal lobes with areas of hemorrhage. However, temporal lobe involvement is usually bilateral but asymmetric and the regions of hemorrhage are typically petechial, as demonstrated in Figure 11.
Tumor
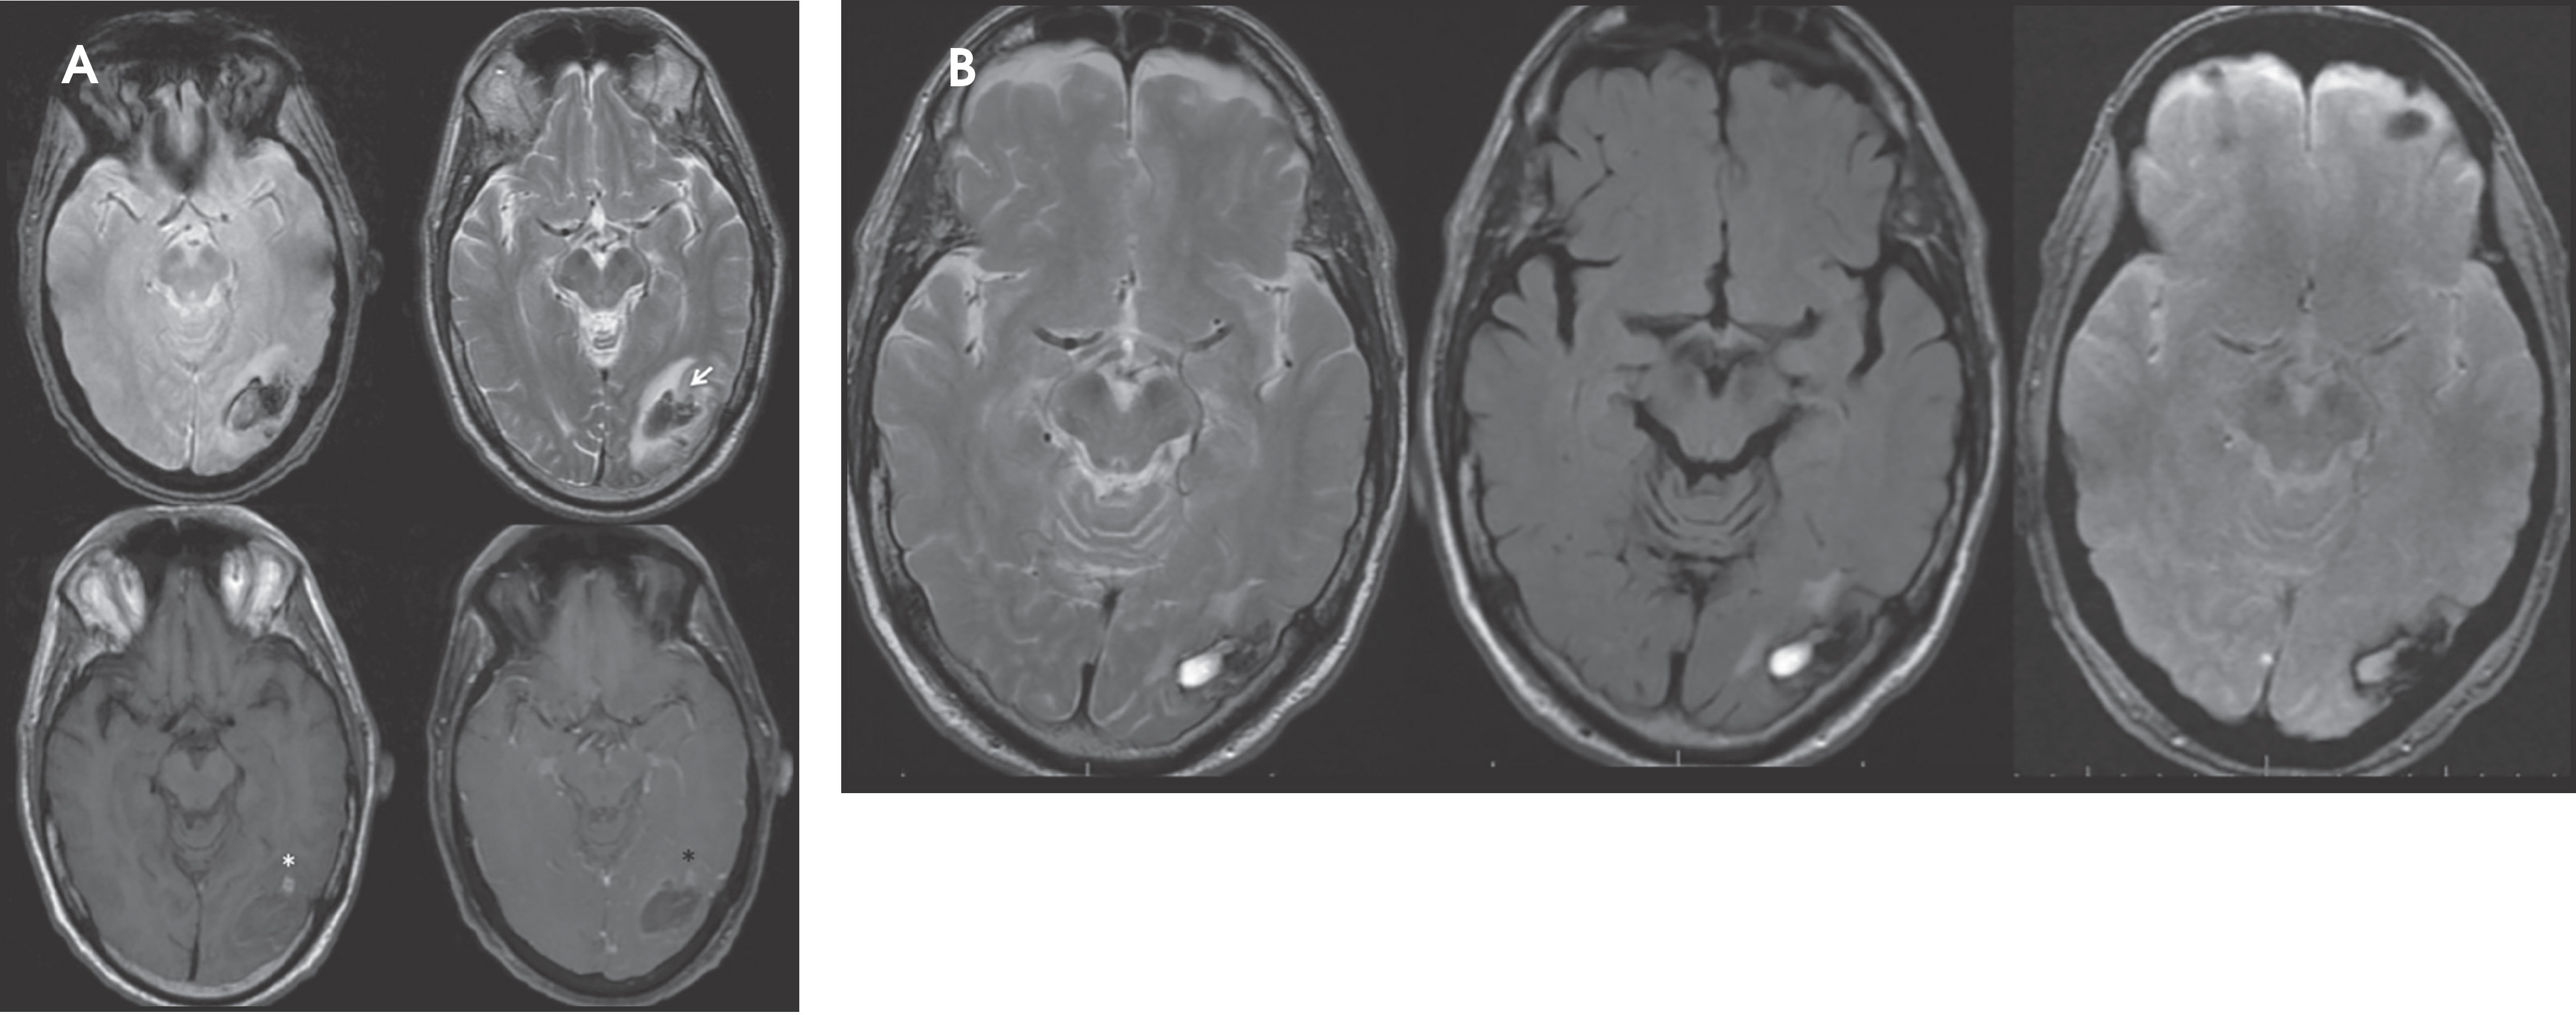
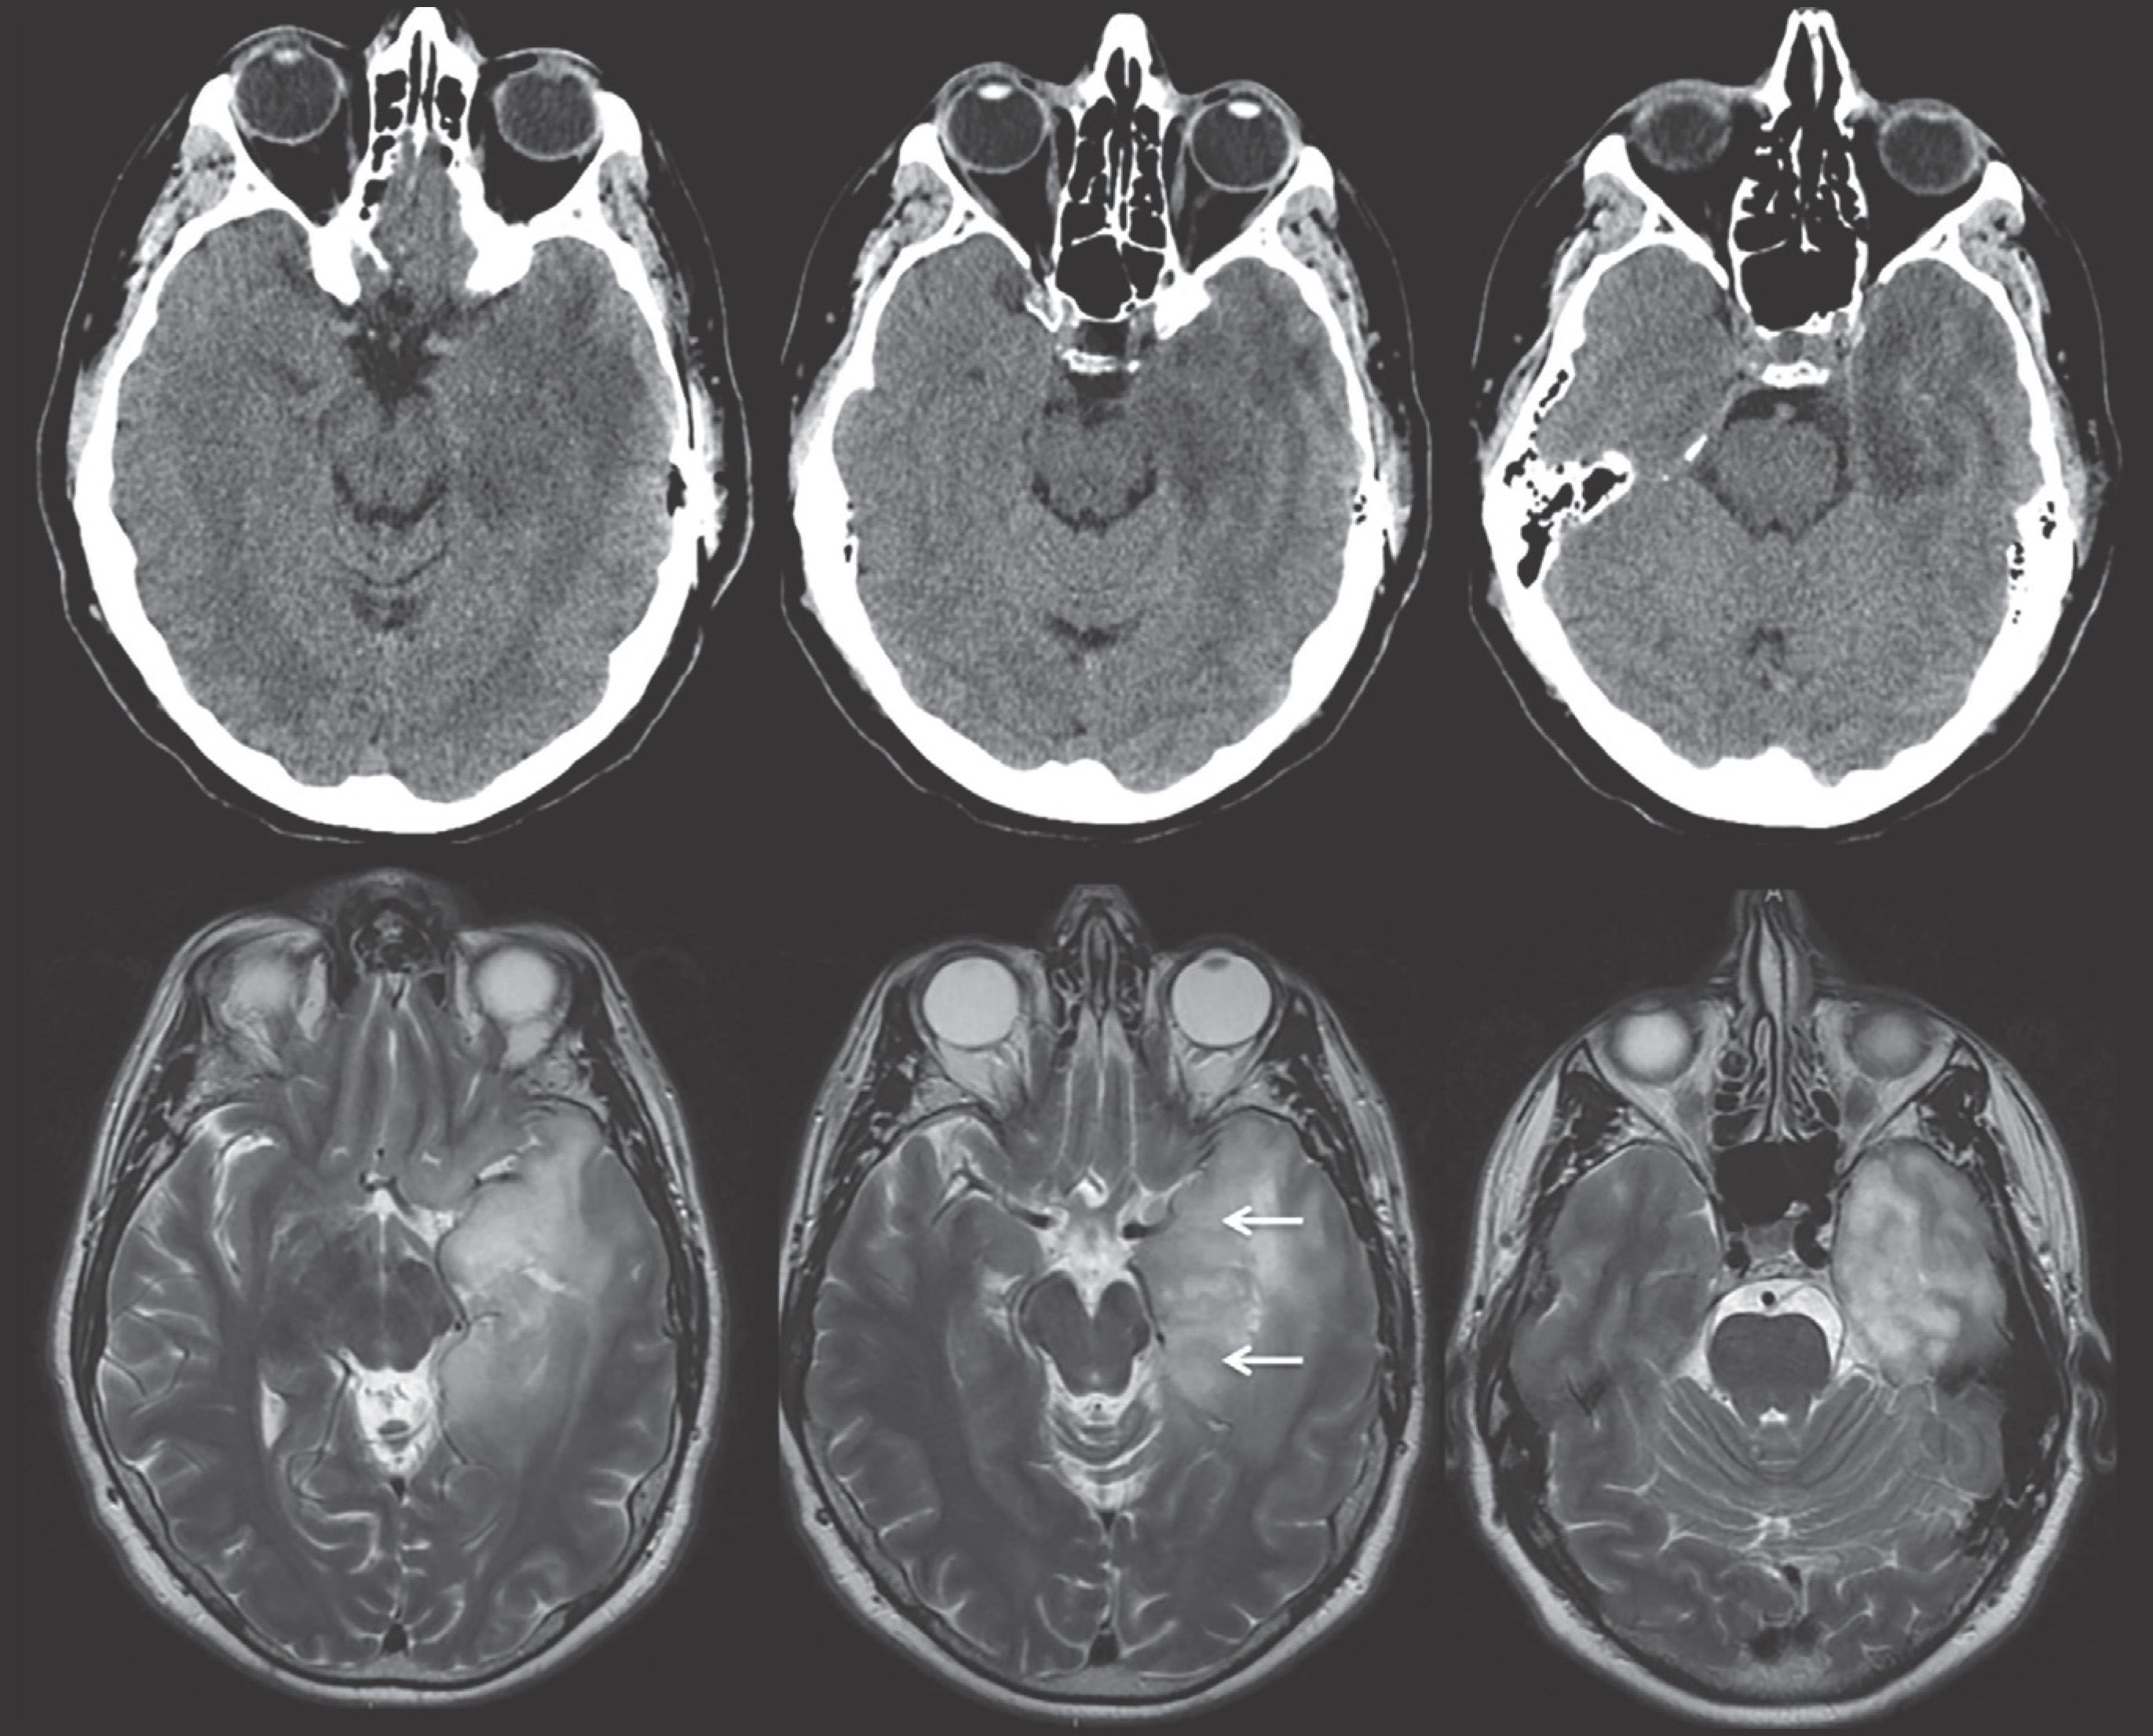
Infiltrating gliomas may sometimes mimic vasogenic edema.In Figure 12, there is an infiltrating tumor of the left temporal lobe, which is isointense to gray matter on T2, whereas the areas of vasogenic edema surrounding the tumor have increased T2 signal intensity.
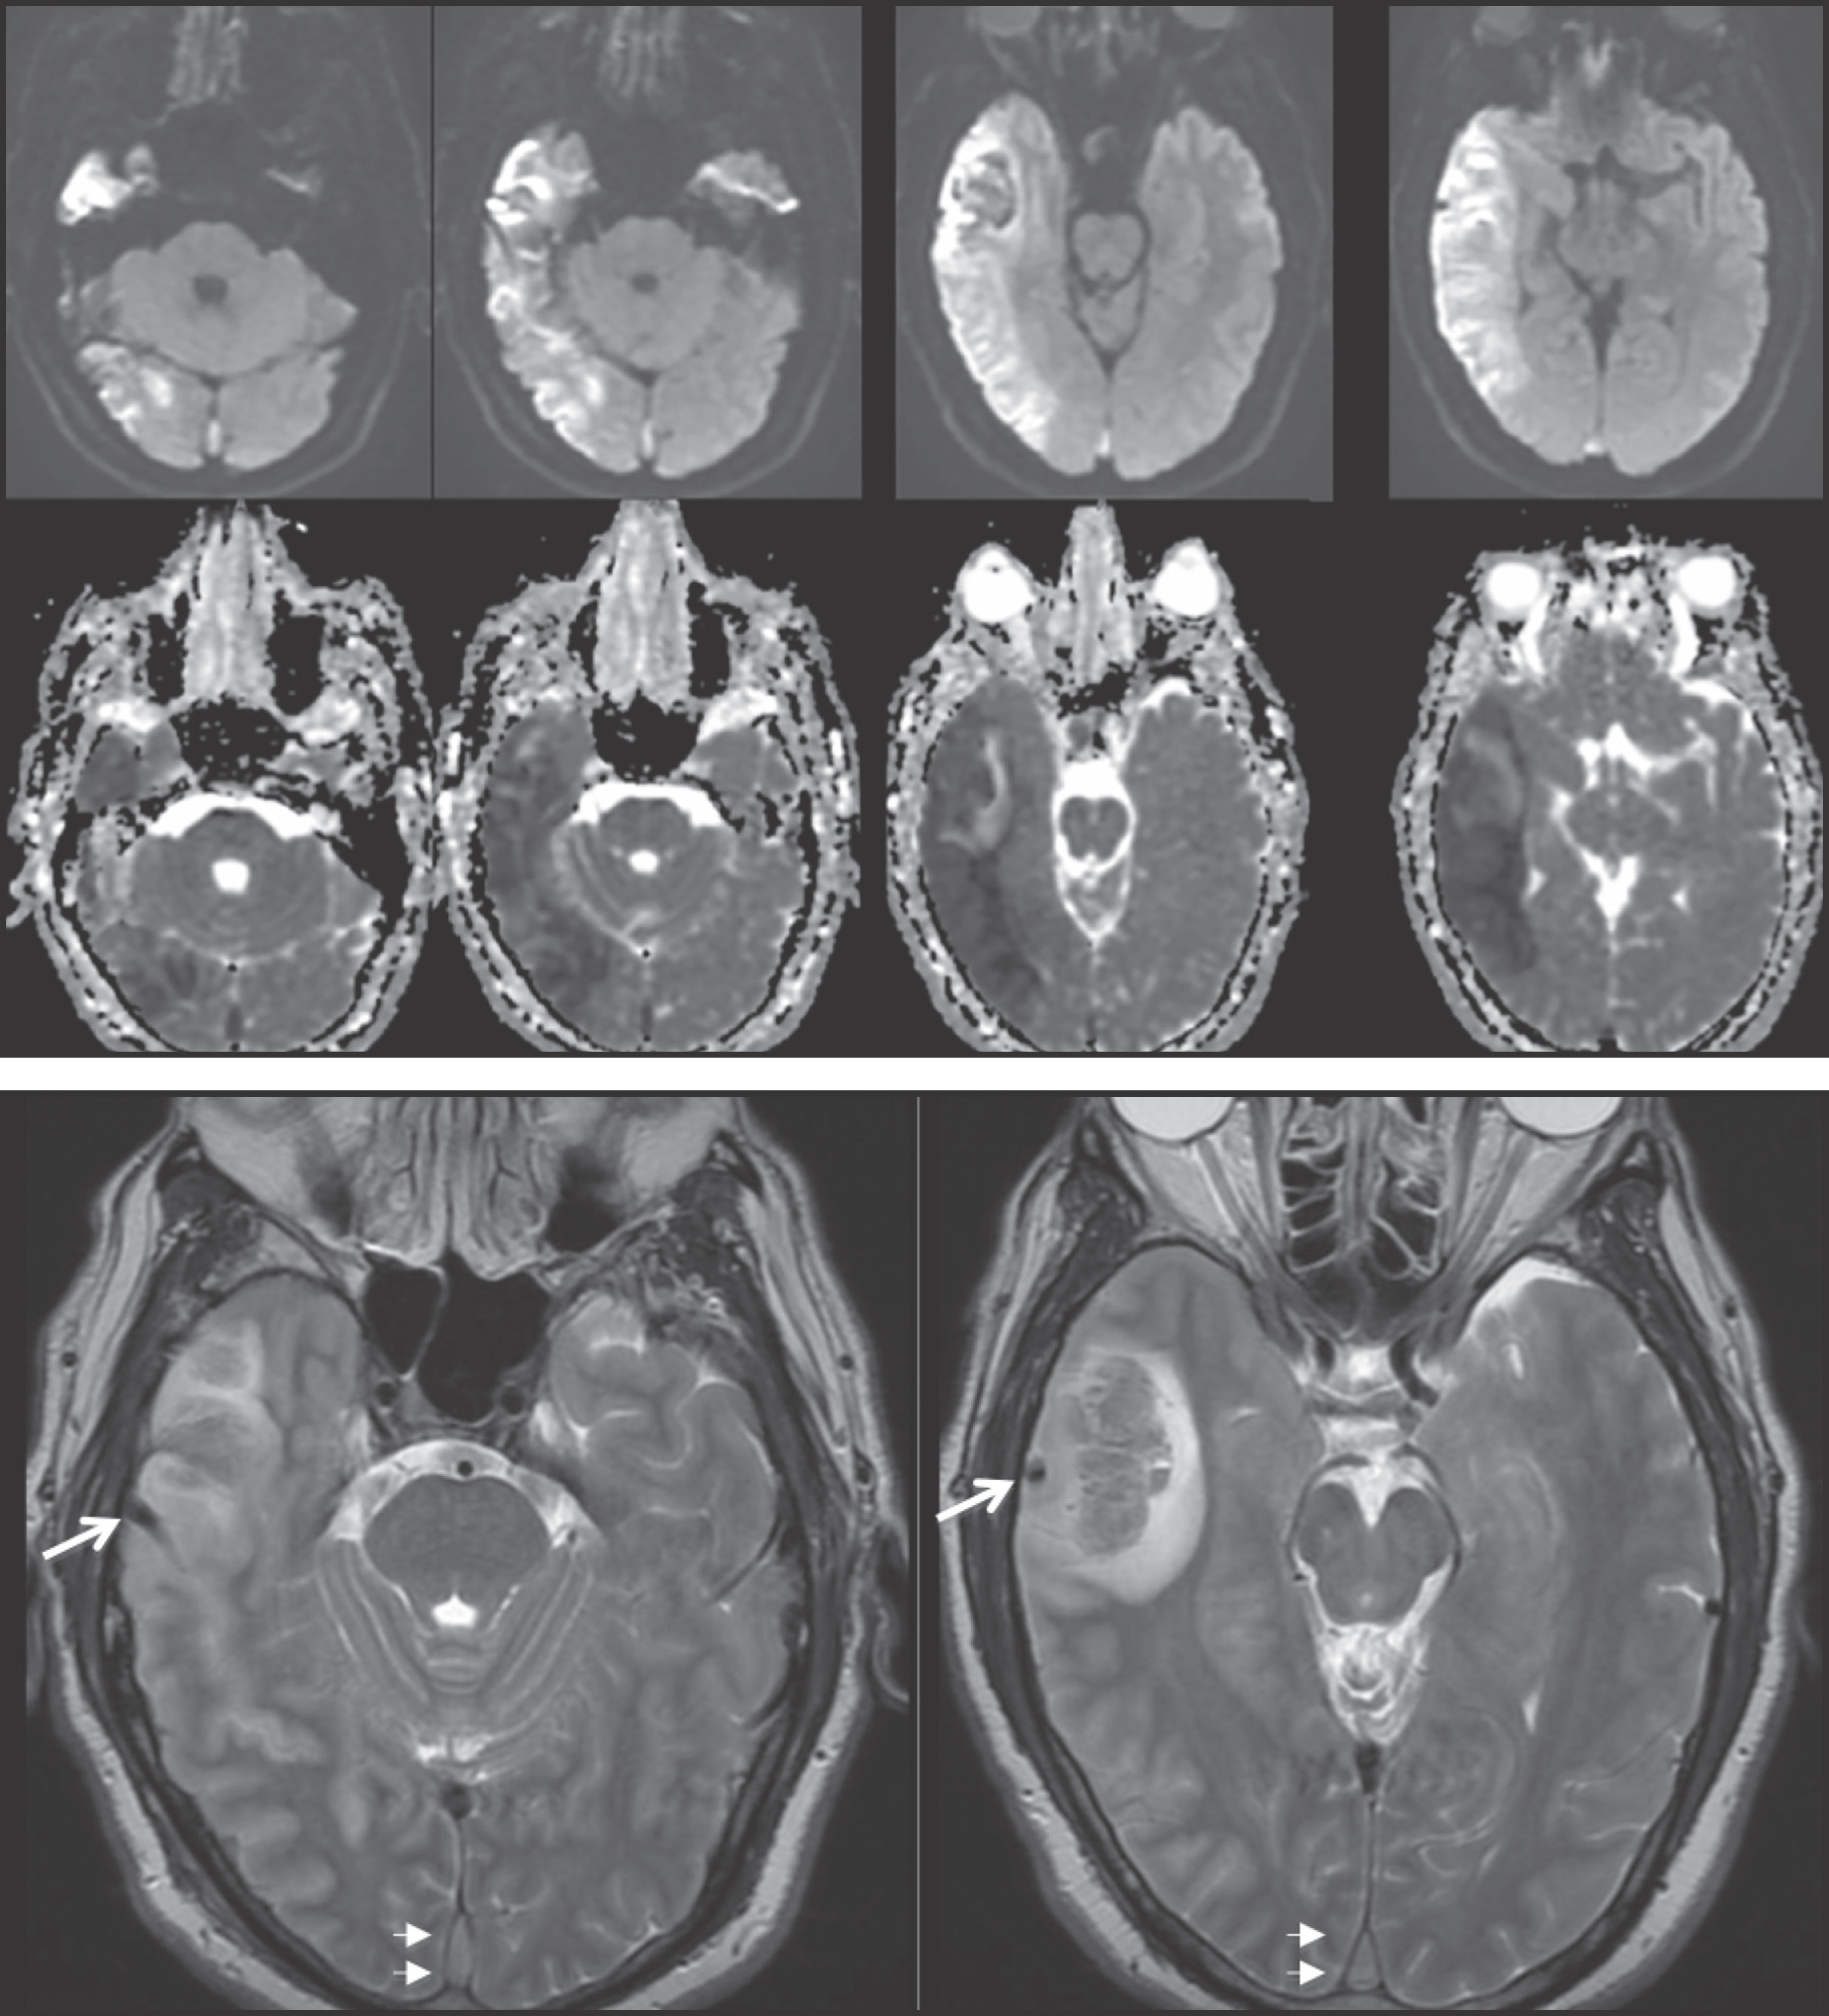
Prompt diagnosis and treatment are key to a favorable outcome. In Figure 6, the initial CT of the vein of Labbé and transverse dural sinus thrombosis and hemorrhagic venous infarct was interpreted as right temporal lobe hemorrhage with subdural hematoma with concern for an underlying arteriovenous malformation. The thrombosed (hyperdense) right transverse sinus was misinterpreted as a subdural hematoma. The tubular hyperdensity next to the hematoma was a thrombosed inferior anastomotic vein (vein of Labbé). The subsequent MRI performed 12 hours later (Figure 7) performed for the possibility of an underlying mass reveals progression with infarction of the right temporal and occipital lobe superimposed on the temporal lobe hemorrhage. The subsequent CT (Figure 8), 18 hours after presentation shows new hemorrhage of the newly infarcted right temporal lobe with worsening edema and uncal herniation.
Arterial infarct
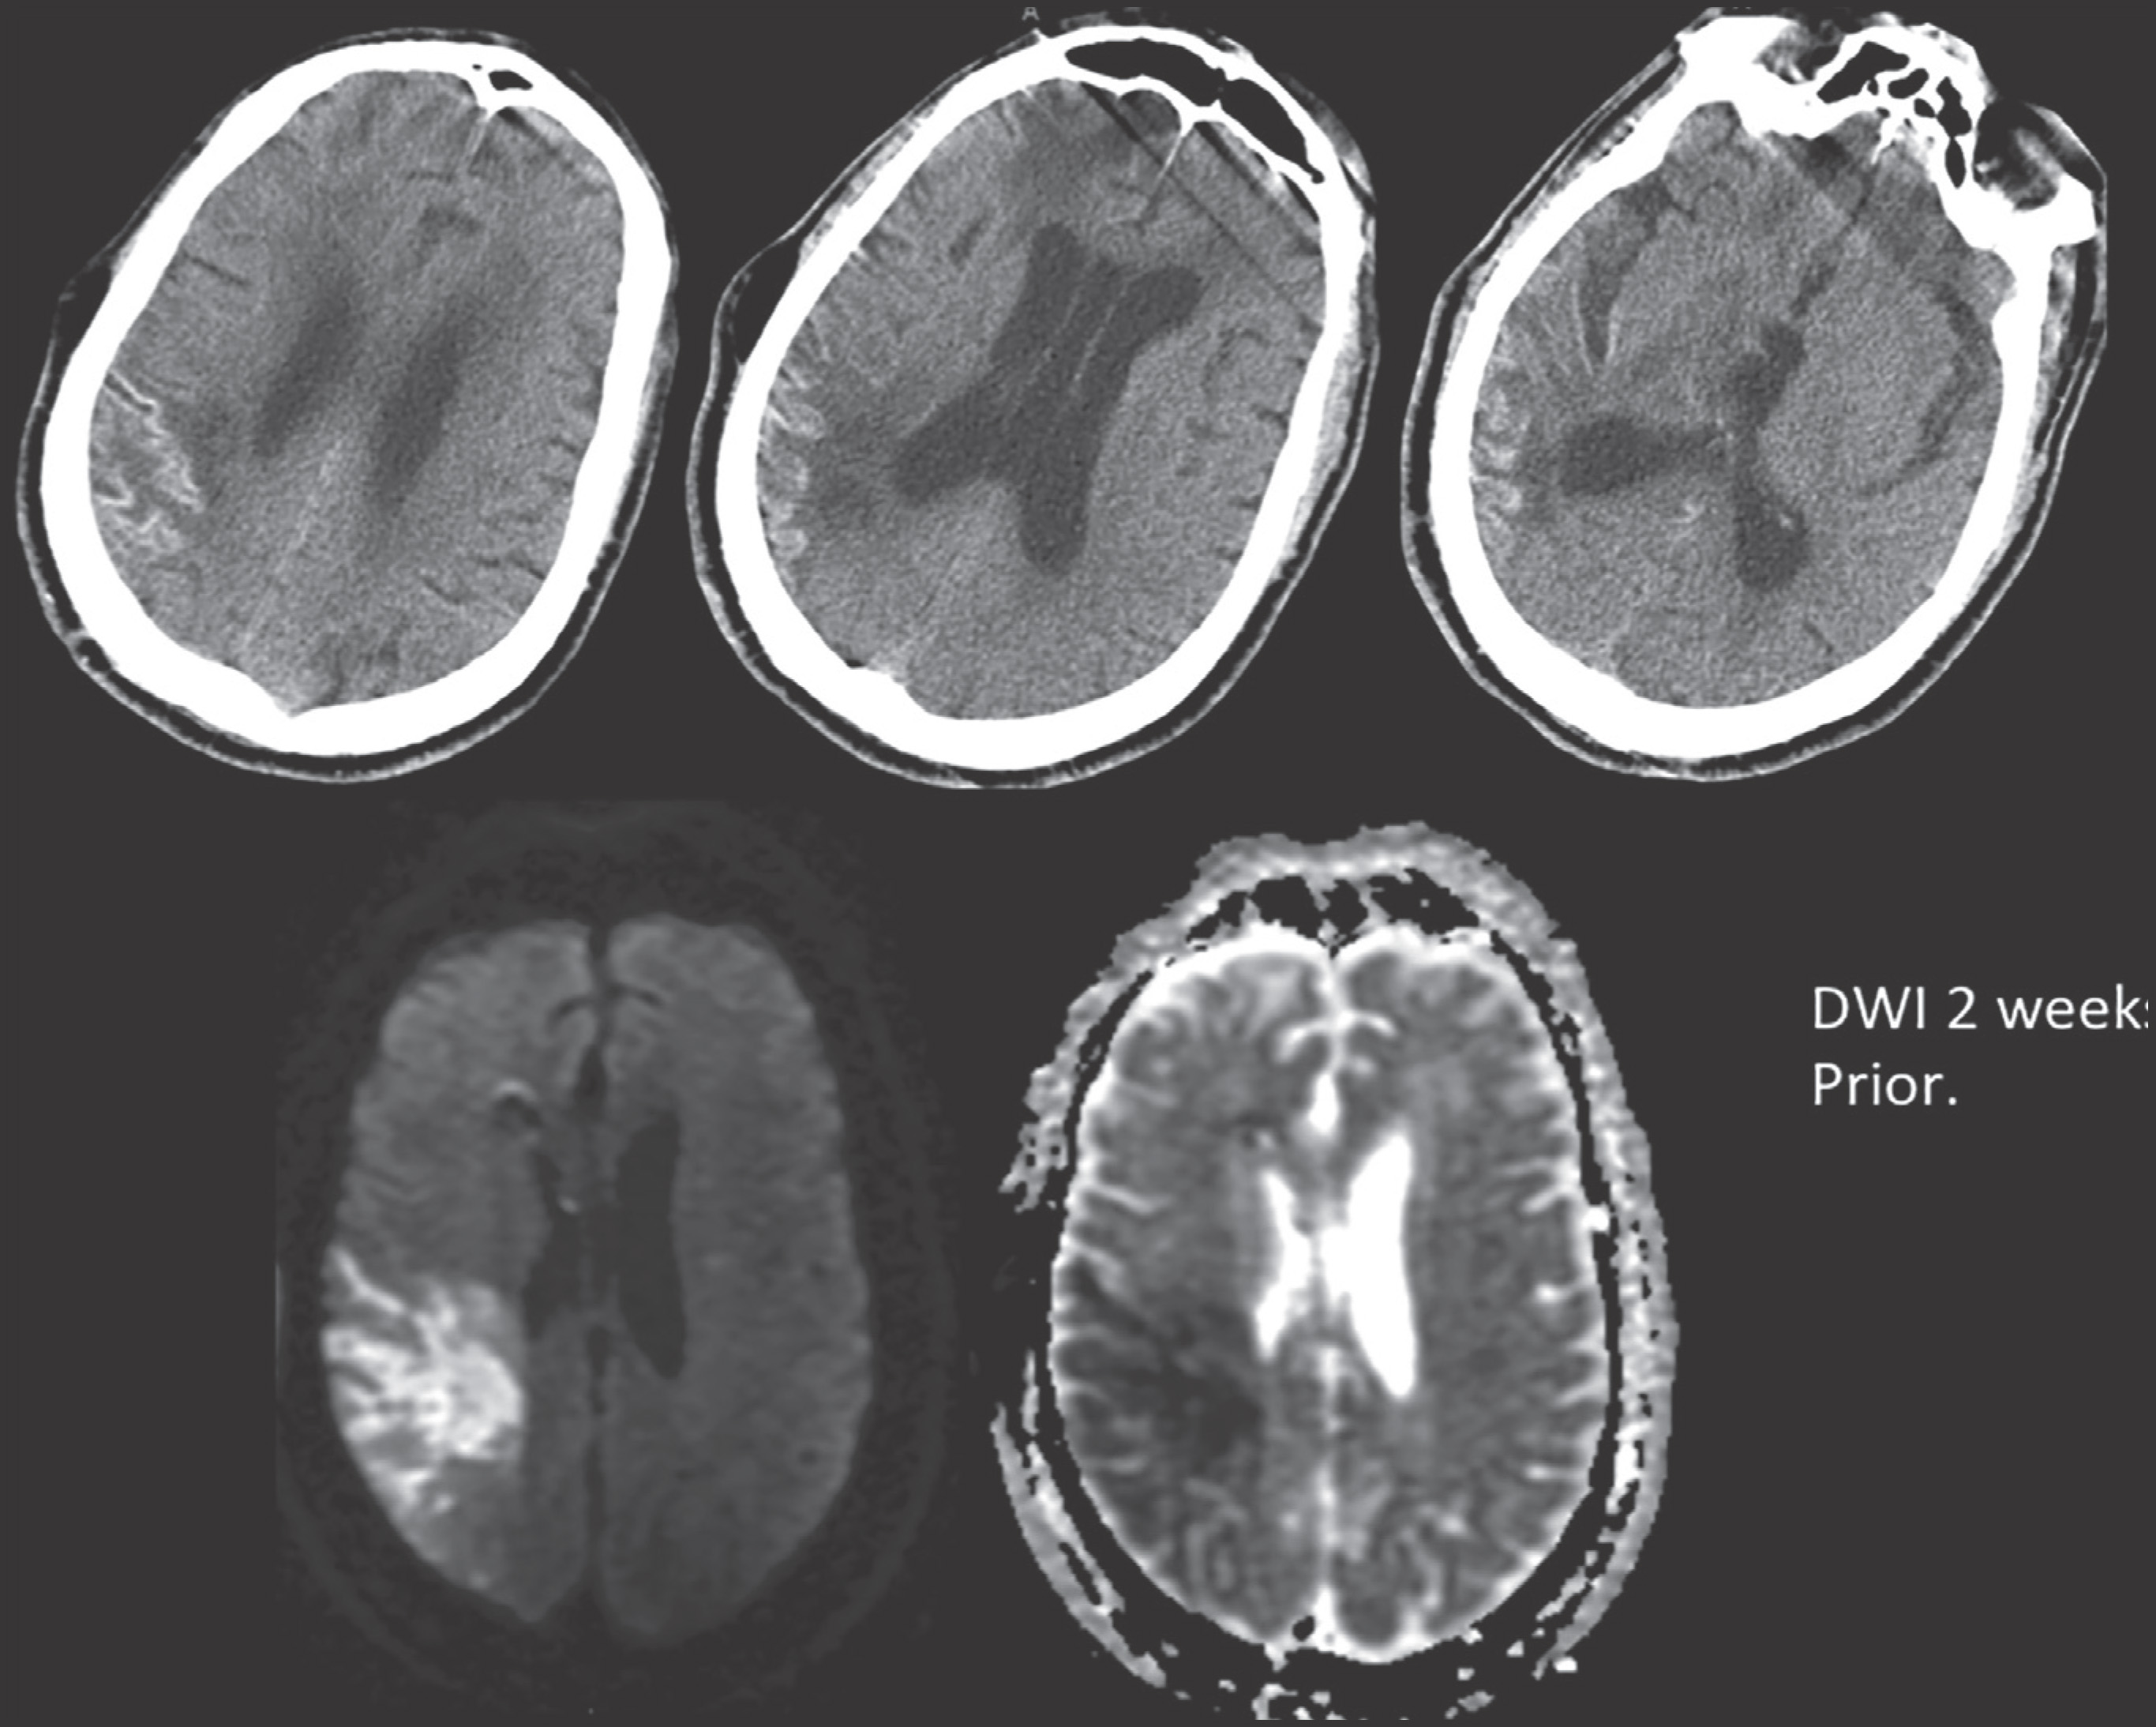
The main distinguishing factor between arterial and venous infarct is distribution. Figure 13 demonstrates a case of arterial infarct, with diffusion restriction in right inferior parietal lobule and temporal lobes, sparing the occipital lobe, in a typical distribution of posterior right middle cerebral artery territory. This is in contradistinction to the previous patient demonstrated in Figures 7 and 8, where there was also involvement of the occipital lobe, an area that is in the posterior cerebral arterial distribution. Infarct across multiple expected arterial territories suggests a venous rather than an arterial origin.
CVT and infarct treatment
The first line of treatment for venous thrombosis and infarct is anticoagulation. The standard of care is anticoagulation with low molecular weight heparin or unfractionated heparin and has been accepted by multiple trials for safety and efficacy.7-9 Anticoagulation is recommended even in the setting of venous thrombosis with hemorrhage. Pretreatment hemorrhage is associated with adverse outcome but does not appear to predispose the patient to new or worsening hemorrhage after anticoagulation.7,9,10
References
- Leach J, Fortuna R, Jones B. Imaging of cerebral venous thrombosis:current techniques, spectrum of findings, and diagnostic pitfalls. Radiographics.
- Kilic T, Akakin A. Anatomy of cerebral veins and sinuses. Front Neurol Neurosci. 2008;23:4-15.
- Lee S, terBrugge K. Cerebral venous thrombosis in adults: The role of imaging evaluation and management. Neuroimaging Clin N Am. 2003;13:139-152.
- Tsai F, Wang A, Matovich V. MR staging of acute dural sinus thrombosis: Correlation with venous pressure measurements and implications for treatment and prognosis. AJNR Am J Neuroradiol. 1995;16((5)):1021-1029.
- Rottger C, Trittmacher S, Gerriets T. Reversible MR imaging abnormalities following cerebral venous thrombosis. AJNR Am J Neuroradiol. 2005;26((3)):607-613.
- Buyck P, De Keyzer F, Vanneste D. CT density measurement and H:H ratio are useful in diagnosing acute cerebral venous sinus thrombosis. AJNR Am J Neuroradiol. 2013;34((8)):1568-1572.
- Saposnik G, Barinagarrementeria F, Brown R. Diagnosis and management of cerebral venous thrombosis: A statement for healthcare professionals from the American Heart Association/American Stroke Association. Stroke. 2011;42((4)):1158-1192.
- Bousser M, Ferro J. Cerebral venous thrombosis: an update. Lancet Neurol. 2007;6((2)):162-170.
- Ferro J, Canhao P. Cerebral venous sinus thrombosis: Update on diagnosis and management. Curr Cardiol Rep. 2014;16((9)).
- Einhaupl K, Stam J, Bousser M. EFNS guideline on the treatment of cerebral venous and sinus thrombosis in adult patients. Eur J Neurol. 2010((10)):1229-1235.
Citation
. Cerebral venous thrombosis and infarct: Review of imaging manifestations. Applied Radiology. 2016;45(3):9-17. doi:10.37549/AR2263.