Chemical Exchange Saturation Transfer for Epilepsy Imaging
Applied Radiology — Vol. 53 , Issue 3 , pp. 15 -19
DOI: 10.37549/AR2981
Published: May 1, 2024
Keywords
Epilepsy, Chemical Exchange Saturation Transfer, MRI, Nonlesional, Glutamate
Categories
Multimodal imaging plays an important role in epilepsy evaluation to localize the source of seizures and is crucial for successful surgical intervention in drug-resistant cases. Up to one-third of epilepsy patients have nonlesional brain MRIs. Glutamate levels in the brain are known to be increased in epileptogenic foci. Magnetic resonance spectroscopy (MRS) has been used to detect brain glutamate levels, but chemical exchange saturation transfer (CEST) imaging has demonstrated higher sensitivity and spatial resolution.
Recent data suggest that glutamate CEST is promising to identify the epileptogenic zone(s) in drug-resistant epilepsy patients without identifiable lesions on more conventional imaging and thus improve their prognosis. This article serves as an introduction to CEST for radiologists in the context of epilepsy imaging applications and their accompanying challenges.
Epilepsy Facts
Epilepsy is a central nervous system disorder characterized by disruptive electrical neuronal activity that results in recurrent seizures. It is a devastating disease that affects more than 46 million people worldwide.1 Uncontrolled seizures may prevent activities such as driving and employment, leading to stigmatization, social isolation, and psychological harm.2 Epilepsy is associated with 11 times the odds of premature mortality compared to the general population.3 The condition also inflicts a burden on society, costing an estimated $10-12 billion in medical expenditures and indirect costs annually in the United States.4,5 The primary treatment for epilepsy is antiepileptogenic medication. However, approximately one-third of patients are drug-resistant and may benefit from surgical intervention,6-8 including ablation and minimally invasive surgery.9,10 Localization-related epilepsy (LRE) is the most common type, accounting for 80% of drug-resistant patients.9 Localizing the epileptogenic source increases the chance of successful postsurgical outcomes by up to three times.11,12
Current Epilepsy Imaging
High-resolution images of brain structure and pathology can be obtained by MRI using tissue properties of T1 and T2 relaxation. Current diagnostic techniques have found 65% of LRE cases to be temporal lobe epilepsy (TLE),13,14 resulting in favorable surgical outcomes, with 70-80% of patients seizure-free post-treatment.15-19 Conventional MRI has found that two-thirds of TLE patients demonstrate mesial temporal sclerosis (MTS), including the hippocampus, amygdala, and parahippocampal gyrus.15 However, subtle or early-stage epileptogenic lesions may not alter brain physiology and morphology enough to exhibit detection by conventional MRI. In addition, one-third of drug-refractory TLE patients have no detectable lesions on conventional MRI,6,12-15,19,20 and are up to three times more likely to have worse surgical outcomes than patients with lesional MRIs.11,21 Despite this, histopathology is abnormal in approximately 87% of nonlesional MRI epilepsy patients, suggesting current imaging technology is unable to detect the existing pathology.22
Positron emission tomography (PET) with fluorodeoxyglucose (FDG) measures glucose metabolism, which is tightly connected with neuronal activity. The most common PET tracer in epilepsy localization for clinical practice, FDG is transported into the blood cells and phosphorylated by hexokinase to form FDG-6-phosphate. This step essentially traps it in the cell, and the positron radiation produced is subsequently measured. Interictal FDG-PET imaging reveals decreased uptake, reflecting hypometabolism, at epileptogenic foci; resection of these correlates with positive surgical outcomes.23-25
In pediatric patients, PET has been found to be more effective than conventional MRI in detecting subtle lesions; a recent study found that lesions were missed by MRI in up to 66% of patients but detected by PET in 77% of patients.26 FDG-PET imaging is usually combined with another modality, such as computed tomography (PET/CT). However, combining with MRI (PET/MR) results in equivalent sensitivity to PET/CT while providing the advantages of lower radiation exposure and lower dose to the brain and eyes owing to the acquisition of images in a single session.27 Overall, hybrid PET/MR imaging, compared to MRI alone, increases sensitivity and epileptogenic abnormality identification, resulting in improved seizure-free outcomes.28,29
Nevertheless, there are several limitations to PET utilization, including availability, radiation exposure, high cost, relatively long scan times, and preprocedural requirements such as fasting, tight blood glucose control, and avoidance of caffeine, alcohol, or drugs that may affect cerebral glucose metabolism.30 Studies are optimally performed during the interictal period, requiring the patient to be seizure free for at least 24 hours.31 PET’s ability to precisely define the surgical margin is also limited, as areas of hypometabolism may extend beyond the anatomical epileptogenic zone.32 Overall, standard multimodal imaging has been unable to identify a clear cause of seizures for one-third of epilepsy patients, half of whom are drug resistant.33 Owing to water’s abundance in the body, MRI relies heavily on the molecule’s protons, which produce contrasts based on relaxation rates of different gross tissue structures.
There is great interest in expanding the use of novel molecules; however, direct detection using a multinuclear imaging system is technically challenging and expensive.34 Magnetic resonance spectroscopy (MRS) is a technique that allows probing of the metabolic environment. Nevertheless, the current clinically available MRS sequences are limited by long acquisition times, low sensitivity, poor spectral and spatial resolution, and volume voxel overlapping with non-targeted tissue.35
Chemical Exchange Saturation Transfer Imaging
Chemical exchange saturation transfer (CEST) is an advanced MR imaging technique that addresses many limitations of current techniques. CEST takes advantage of proton exchange between solutes and water, providing an amplification strategy to detect metabolites and proteins with labile groups by using a frequency-selective radiofrequency saturation pulse (Figure 1). Saturation is a magnetic resonance state in which the selected tissue or, in this case, solute produces zero net magnetization or signal.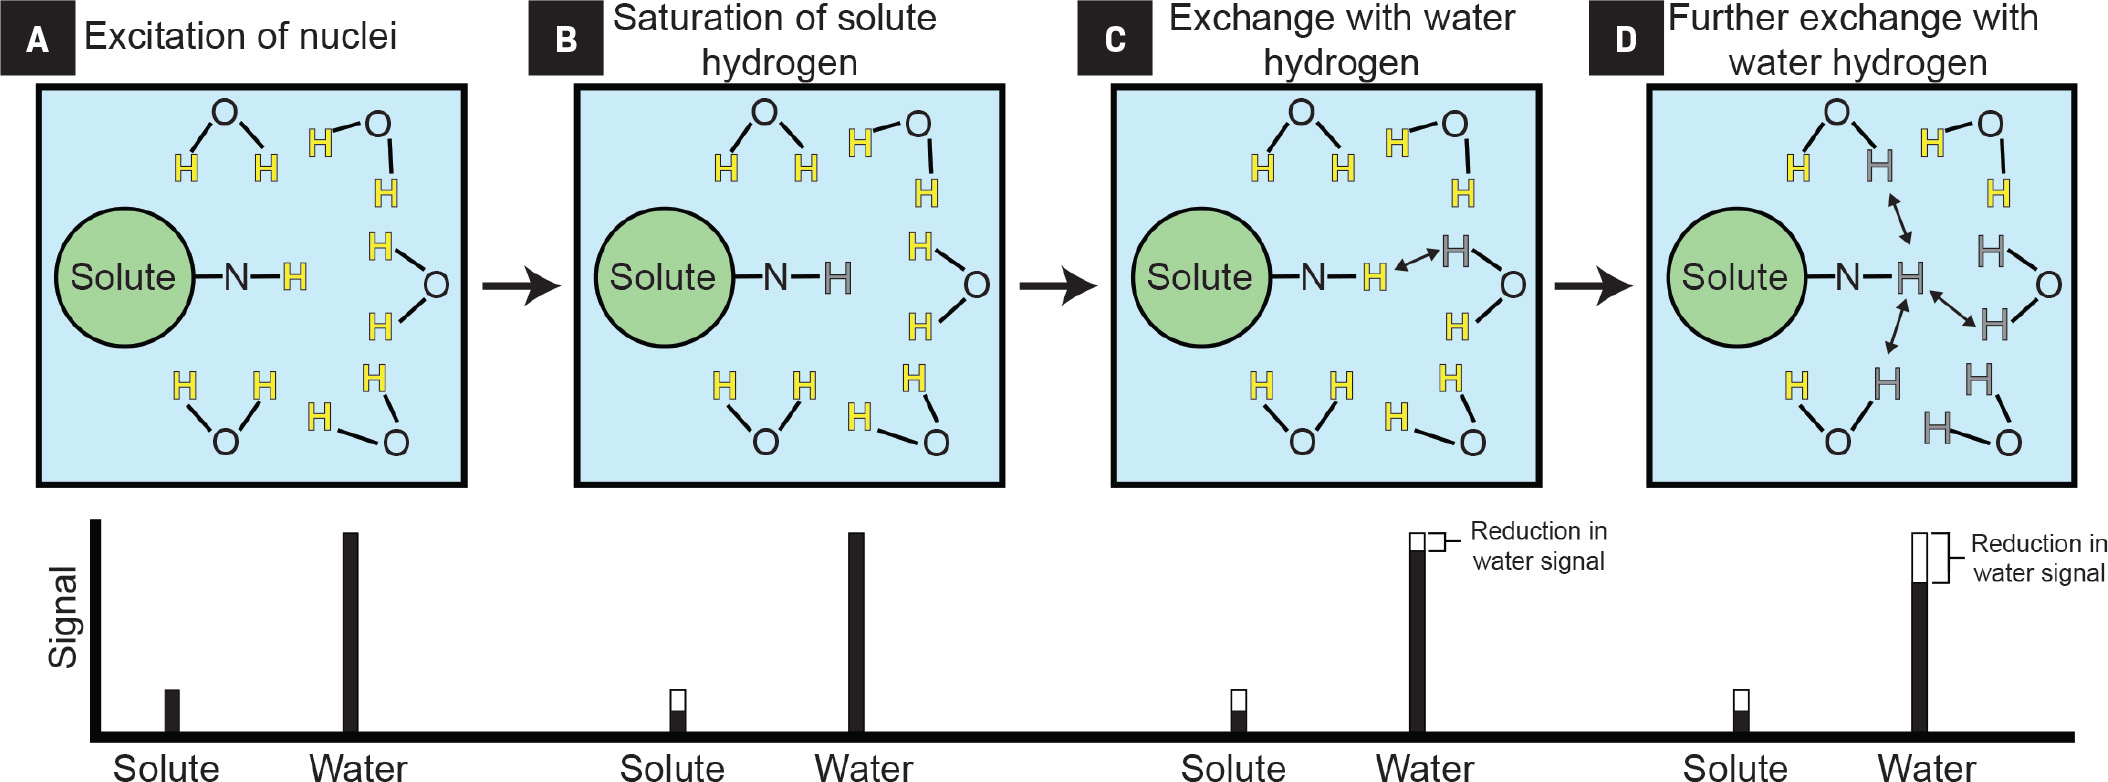
During radiofrequency saturation, low-concentration solutes with exchangeable protons can be selectively saturated. Owing to proton exchange, this saturation is continuously transferred to the much more abundant water molecules, leading to a proportional signal reduction for water.34,36 The difference in the water signal obtained with and without saturation essentially allows indirect detection of low-concentration solutes.
Glutamate is a key excitatory transmitter in the brain; however, an imbalance can result in seizure activity.39 Dysfunctional glutamate cycling by glutamine synthetase in astrocytes slows glutamate clearance and subsequently elevated levels of glutamate in the epileptogenic hippocampus.40-43 Studies in animals and humans demonstrate glutamate’s potential to serve as a marker for localizing epileptogenic foci. Microdialysis studies in human subjects have shown increased glutamate concentrations at the epileptogenic focus ictally, interictally, and postmortem.41,42,44-47
Increased glutamate concentration has also correlated with decreased hippocampal volume on MRI.47 Using MRS, Pfund et al found the combined glutamate and glutamine signal to be increased in the epileptogenic hippocampus of patients with morphologically nonlesional epilepsy.48 Decreased levels in sclerotic hippocampi were also noted; however, their observation could have been limited by the hippocampal volume loss and relatively large voxel size.48
This result has led to the investigation of glutamate as a metabolic agent for noninvasive imaging to correlate and potentially map epileptogenic networks using CEST (GluCEST). GluCEST has been found to have higher spatial resolution and twice the sensitivity for glutamate compared with traditional MRS methods.38
GluCEST has already been demonstrated in healthy subjects and Alzheimer disease mouse models.49-52 Davis et al have utilized GluCEST for epileptogenic source lateralization in four nonlesional, drug-resistant, epilepsy patients and 11 healthy controls.53 Using a two-dimensional single-slice GluCEST sequence on a 7 Tesla (T) MRI, the epileptogenic hippocampus was lateralized in all of the epilepsy patients, including two right-sided and two left-sided temporal epilepsy patients (Figure 2).53-55 GluCEST findings matched EEG and subsequent histopathology results.53 In addition, no significant difference in hippocampal volume was found between the epileptogenic and the contralateral sides.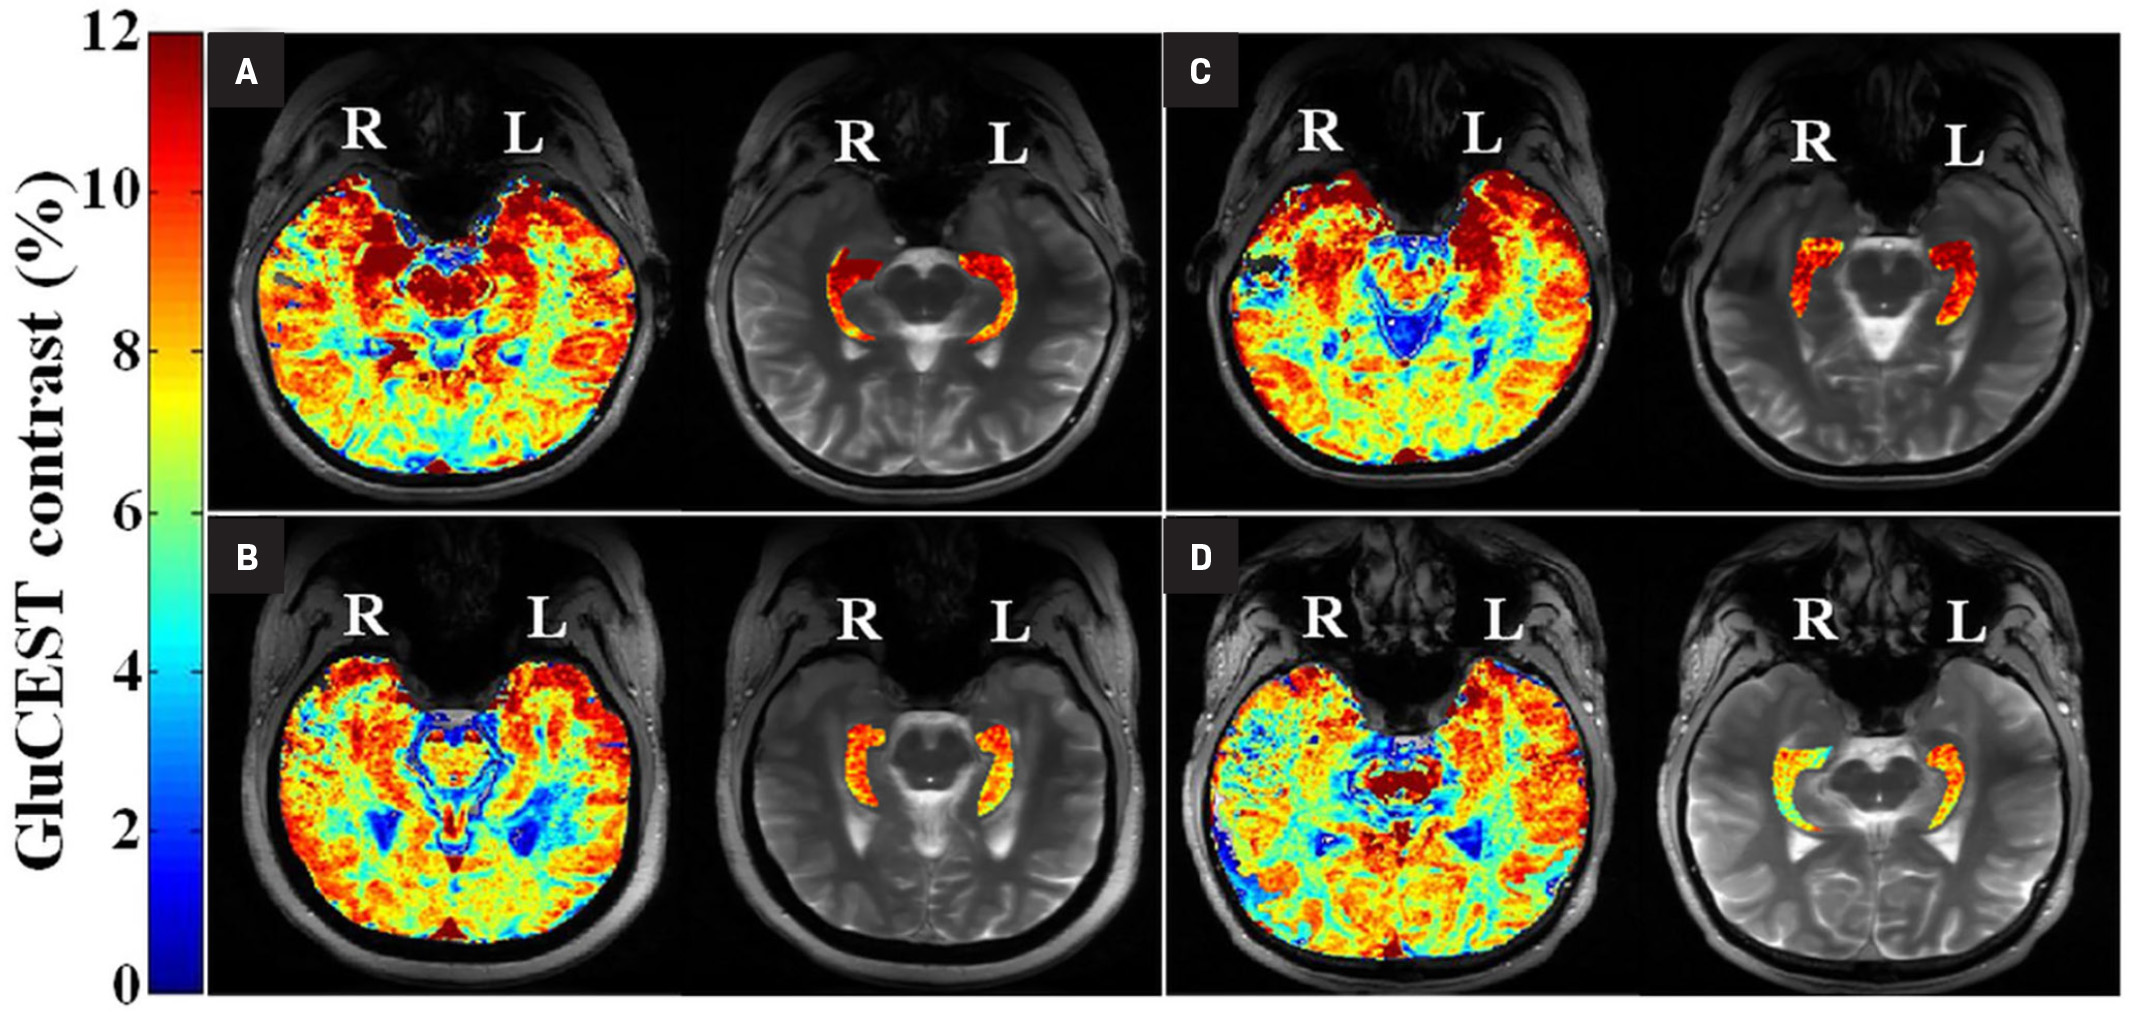
Subsequently, Hadar et al applied GluCEST to three-dimensional imaging and found similar results with increased GluCEST signal in the epileptogenic hippocampus,55 and Lucas et al found a GluCEST correlation with lesional and nonlesional hippocampi.54
CEST has also been used to distinguish the physical signs of tuberous sclerosis complex (TSC), a disease that affects more than 1 million people and is caused by mutations in the TSC1 or TSC2 genes.56,57 Neurological manifestations of TSC include seizures, intellectual disability, and behavioral problems.56,57 Hamartomas in the brain or tubers, major hallmarks of TSC, have been shown to correlate with seizure burden.58 Wen et al were able to utilize CEST imaging to differentiate tubers from normal brain tissue, with a probable major metabolic contributor being glutamate levels.59 In addition, CEST showed the potential to reveal tubers undetected by conventional T2 sequences.59
Challenges and Future Directions
Chemical exchange saturation transfer imaging provides a more sensitive and robust method to detect and measure biological metabolites. However, specific resonance of the biological metabolites can overlap and the CEST signal of two biological metabolites may contribute to each other. This includes a small contribution of the neurotransmitter gamma-aminobutyric acid and creatinine to GluCEST and glucose, contributing to glycogen detection.38,60 Users must be precise and mindful when selecting the proper offset. Also, there could be concomitant changes not only in glutamate concentration but also mild pH change.61
Third, CEST signal magnitude and spectral separation are enhanced at higher magnetic field strengths, requiring many of these studies to be performed on 7T scanners.53-55,60 The need for high field strengths has thus far limited the broader research and clinical implementation of CEST MRI; more research is needed to assess the potential of CEST to be utilized at lower and more widely available magnetic field strengths. Standardization and quantification across scanners also must be improved to allow reliable CEST imaging interpretation.62 Methods to address this issue are currently being explored.63,64
Conclusion
There are multiple diagnostic imaging approaches to epilepsy imaging, but there is still a subpopulation of treatment-refractory epilepsy patients whose lesions cannot be detected with conventional imaging. CEST provides direct interrogation of the metabolic composition of biological tissue and has been demonstrated to reveal epileptogenic foci not detectable with conventional MRI, including those in temporal lobe epilepsy and TSC patients. Additional work is needed to translate this capability to more widely available 3T MRI scanners and to standardize CEST acquisition and postprocessing.
Lastly, increased awareness of the CEST technique and its potential clinical use in epilepsy imaging is important as the field increasingly incorporates metabolic and precision imaging into clinical practice.
References
- Global, regional, and national burden of epilepsy, 1990-2016: a systematic analysis for the Global Burden of Disease Study 2016. Lancet Neurol. 2019;18(4):357-375.
- Baker G, Jacoby A, Buck D, Stalgis C, Monnet D. Quality of life of people with epilepsy: a European study. Epilepsia. 1997;38(3):353-362.
- Fazel S, Wolf A, Langstrom N, Newton C, Lichtenstein P. Premature mortality in epilepsy and the role of psychiatric comorbidity: a total population study. Lancet. 2013;382(9905):1646-1654.
- Yoon D, Frick K, Carr D, Austin J. Economic impact of epilepsy in the United States. Epilepsia. 2009;50(10):2186-2191.
- Begley C, Famulari M, Annegers J. The cost of epilepsy in the United States: an estimate from population-based clinical and survey data. Epilepsia. 2000;41(3):342-351.
- Kwan P, Brodie M. Early identification of refractory epilepsy. N Engl J Med. 2000;342(5):314-319.
- Sultana B, Panzini M, Veilleux Carpentier A. Incidence and Prevalence of Drug-Resistant Epilepsy: A Systematic Review and Meta-analysis. Neurology. 2021;96(17):805-817.
- Vakharia V, Duncan J, Witt J, Elger C, Staba R, Engel J. Getting the best outcomes from epilepsy surgery. Ann Neurol(4):676-690.
- Gross R, Stern M, Willie J. Stereotactic laser amygdalohippocampotomy for mesial temporal lobe epilepsy. Ann Neurol. 2018;83(3):575-587.
- Morrell M. Group RNSSiES. Responsive cortical stimulation for the treatment of medically intractable partial epilepsy. Neurology. 2011;77(13):1295-1304.
- Tellez-Zenteno J, Hernandez Ronquillo L, Moien-Afshari F, Wiebe S. Surgical outcomes in lesional and non-lesional epilepsy: a systematic review and meta-analysis. Epilepsy Res. 2010;89(2-3):310-318.
- Siegel A, Jobst B, Thadani V. Medically intractable, localization-related epilepsy with normal MRI: presurgical evaluation and surgical outcome in 43 patients. Epilepsia. 2001;42(7):883-888.
- Callaghan B, Anand K, Hesdorffer D, Hauser W, French J. Likelihood of seizure remission in an adult population with refractory epilepsy. Ann Neurol. 2007;62(4):382-389.
- Wiebe S, Camfield P, Jette N, Burneo J. Epidemiology of epilepsy: prevalence, impact, comorbidity and disparities. Can J Neurol Sci. 2009;36(Suppl 2):S7-16.
- Jette N, Wiebe S. Update on the surgical treatment of epilepsy. Curr Opin Neurol. 2013;26(2):201-207.
- Spencer S, Berg A, Vickrey B. Predicting long-term seizure outcome after resective epilepsy surgery: the multicenter study. Neurology. 2005;65(6):912-918.
- Wiebe S. Epilepsy. Outcome patterns in epilepsy surgery—the long-term view. Nat Rev Neurol. 2012;8(3):123-124.
- Mohammed H, Kaufman C, Limbrick D. Impact of epilepsy surgery on seizure control and quality of life: a 26-year follow-up study. Epilepsia. 2012;53(4):712-720.
- de Tisi J, Bell G, Peacock J. The long-term outcome of adult epilepsy surgery, patterns of seizure remission, and relapse: a cohort study. Lancet. 2011;378(9800):1388-1395.
- French J. Refractory epilepsy: clinical overview. Epilepsia. 2007;48(Suppl 1):3-7.
- Carne R, O’Brien T, Kilpatrick C. MRI-negative PET-positive temporal lobe epilepsy: a distinct surgically remediable syndrome. Brain. 2004;127(Pt 10):2276-2285.
- Cohen-Gadol A, Wilhelmi B, Collignon F. Long-term outcome of epilepsy surgery among 399 patients with nonlesional seizure foci including mesial temporal lobe sclerosis. J Neurosurg. 2006;104(4):513-524.
- Ergun E, Saygi S, Yalnizoglu D, Oguz K, Erbas B. SPECT-PET in Epilepsy and Clinical Approach in Evaluation. Semin Nucl Med. 2016;46(4):294-307.
- Elkins K, Moncayo V, Kim H, Olson L. Utility of gray-matter segmentation of ictal-Interictal perfusion SPECT and interictal (18)F-FDG-PET in medically refractory epilepsy. Epilepsy Res. 2017;130:93-100.
- Theodore W, Sato S, Kufta C, Gaillard W, Kelley K. FDG-positron emission tomography and invasive EEG: seizure focus detection and surgical outcome. Epilepsia. 1997;38(1):81-86.
- Kim Y, Kang H, Kim D. Neuroimaging in identifying focal cortical dysplasia and prognostic factors in pediatric and adolescent epilepsy surgery. Epilepsia. 2011;52(4):722-727.
- Oldan J, Shin H, Khandani A, Zamora C, Benefield T, Jewells V. Subsequent experience in hybrid PET-MRI for evaluation of refractory focal onset epilepsy. Seizure. 2018;61:128-134.
- Salamon N, Kung J, Shaw S. FDG-PET/MRI coregistration improves detection of cortical dysplasia in patients with epilepsy. Neurology. 2008;71(20):1594-1601.
- Lin Y, Fang Y, Wu G. Quantitative positron emission tomography-guided magnetic resonance imaging postprocessing in magnetic resonance imaging-negative epilepsies. Epilepsia. 2018;59(8):1583-1594.
- Juhasz C, John F. Utility of MRI, PET, and ictal SPECT in presurgical evaluation of non-lesional pediatric epilepsy. Seizure. 2020;77:15-28.
- Kuruva M, Moncayo V, Peterson R. PET and SPECT Imaging of Epilepsy: Technical Considerations, Pathologies, and Pitfalls. Semin Ultrasound CT MR. 2020;41(6):551-561.
- Sarikaya I. PET studies in epilepsy. Am J Nucl Med Mol Imaging. 2015;5(5):416-430.
- Nguyen D, Mbacfou M, Nguyen D, Lassonde M. Prevalence of nonlesional focal epilepsy in an adult epilepsy clinic. Can J Neurol Sci. 2013;40(2):198-202.
- Wu B, Warnock G, Zaiss M. An overview of CEST MRI for non-MR physicists. EJNMMI Phys. 2016;3(1):19.
- Simister R, Woermann F, McLean M, Bartlett P, Barker G, Duncan J. A short-echo-time proton magnetic resonance spectroscopic imaging study of temporal lobe epilepsy. Epilepsia. 2002;43(9):1021-1031.
- Kogan F, Hariharan H, Reddy R. Chemical Exchange Saturation Transfer (CEST) Imaging: Description of Technique and Potential Clinical Applications. Curr Radiol Rep. 2013;1(2):102-114.
- Ward K, Aletras A, Balaban R. A new class of contrast agents for MRI based on proton chemical exchange dependent saturation transfer (CEST). J Magn Reson. 2000;143(1):79-87.
- Cai K, Haris M, Singh A. Magnetic resonance imaging of glutamate. Nat Med. 2012;18(2):302-306.
- Eid T, Tu N, Lee T, Lai J. Regulation of astrocyte glutamine synthetase in epilepsy. Neurochem Int. 2013;63(7):670-681.
- Eid T, Thomas M, Spencer D. Loss of glutamine synthetase in the human epileptogenic hippocampus: possible mechanism for raised extracellular glutamate in mesial temporal lobe epilepsy. Lancet. 2004;363(9402):28-37.
- Eid T, Lee T, Wang Y. Gene expression of glutamate metabolizing enzymes in the hippocampal formation in human temporal lobe epilepsy. Epilepsia. 2013;54(2):228-238.
- Petroff O, Errante L, Rothman D, Kim J, Spencer D. Glutamate-glutamine cycling in the epileptic human hippocampus. Epilepsia. 2002;43(7):703-710.
- Eid T, Hammer J, Runden-Pran E. Increased expression of phosphate-activated glutaminase in hippocampal neurons in human mesial temporal lobe epilepsy. Acta Neuropathol. 2007;113(2):137-152.
- Wilson C, Maidment N, Shomer M. Comparison of seizure related amino acid release in human epileptic hippocampus versus a chronic, kainate rat model of hippocampal epilepsy. Epilepsy Res. 1996;26(1):245-254.
- Millan M, Chapman A, Meldrum B. Extracellular amino acid levels in hippocampus during pilocarpine-induced seizures. Epilepsy Res. 1993;14(2):139-148.
- Cavus I, Kasoff W, Cassaday M. Extracellular metabolites in the cortex and hippocampus of epileptic patients. Ann Neurol. 2005;57(2):226-235.
- Cavus I, Pan J, Hetherington H. Decreased hippocampal volume on MRI is associated with increased extracellular glutamate in epilepsy patients. Epilepsia. 2008;49(8):1358-1366.
- Pfund Z, Chugani D, Juhasz C. Evidence for coupling between glucose metabolism and glutamate cycling using FDG PET and 1H magnetic resonance spectroscopy in patients with epilepsy. J Cereb Blood Flow Metab. 2000;20(5):871-878.
- Kogan F, Singh A, Debrosse C. Imaging of glutamate in the spinal cord using GluCEST. Neuroimage. 2013;77:262-267.
- Cai K, Singh A, Roalf D. Mapping glutamate in subcortical brain structures using high-resolution GluCEST MRI. NMR Biomed. 2013;26(10):1278-1284.
- Haris M, Nath K, Cai K. Imaging of glutamate neurotransmitter alterations in Alzheimer’s disease. NMR Biomed. 2013;26(4):386-391.
- Crescenzi R, DeBrosse C, Nanga R. In vivo measurement of glutamate loss is associated with synapse loss in a mouse model of tauopathy. Neuroimage. 2014;101:185-192.
- Davis K, Nanga R, Das S. Glutamate imaging (GluCEST) lateralizes epileptic foci in nonlesional temporal lobe epilepsy. Sci Transl Med. 2015;7(309):309ra161.
- Lucas A, Nanga R, Hadar P. Mapping hippocampal glutamate in mesial temporal lobe epilepsy with glutamate weighted CEST (GluCEST) imaging. Hum Brain Mapp. 2022.
- Hadar P, Kini L, Nanga R. Volumetric glutamate imaging (GluCEST) using 7T MRI can lateralize nonlesional temporal lobe epilepsy: A preliminary study. Brain Behav. 2021;11(8).
- Marcotte L, Crino P. The neurobiology of the tuberous sclerosis complex. Neuromolecular Med. 2006;8(4):531-546.
- Crino P, Nathanson K, Henske E. The tuberous sclerosis complex. N Engl J Med. 2006;355(13):1345-1356.
- Holmes G, Stafstrom C. Tuberous Sclerosis Study G. Tuberous sclerosis complex and epilepsy: recent developments and future challenges. Epilepsia. 2007;48(4):617-630.
- Wen Q, Wang K, Hsu Y. Chemical exchange saturation transfer imaging for epilepsy secondary to tuberous sclerosis complex at 3 T: Optimization and analysis. NMR Biomed. 2021;34(9).
- van Zijl P, Jones C, Ren J, Malloy C, Sherry A. MRI detection of glycogen in vivo by using chemical exchange saturation transfer imaging (glycoCEST). Proc Natl Acad Sci U S A.. 2007;104(11):4359-4364.
- Lu D, Ji Y, Sundaram P. Alkaline brain pH shift in rodent lithium-pilocarpine model of epilepsy with chronic seizures. Brain Research. 2021;1758:147345.
- Sun P. Numerical simulation-based assessment of pH-sensitive chemical exchange saturation transfer MRI quantification accuracy across field strengths. NMR Biomed. 2023.
- Kim J, Wu Y, Guo Y, Zheng H, Sun P. A review of optimization and quantification techniques for chemical exchange saturation transfer MRI toward sensitive in vivo imaging. Contrast Media Mol Imaging. 2015;10(3):163-178.
- Zhou J, Zaiss M, Knutsson L. Review and consensus recommendations on clinical APT-weighted imaging approaches at 3T: Application to brain tumors. Magn Reson Med. 2022;88(2):546-574.
Citation
. Chemical Exchange Saturation Transfer for Epilepsy Imaging. Applied Radiology. 2024;53(3):15-19. doi:10.37549/AR2981.