Chronic diffuse infiltrative lung disease: Differential diagnosis and high-resolution CT imaging
Applied Radiology — Vol. 30 , Issue 11 , pp. 28 -38
DOI: 10.37549/AR1052
Published: November 1, 2001
Categories
Chronic diffuse infiltrative lung disease is the term we now use to describe what in the past was referred to as chronic interstitial lung disease. More than 200 such diseases or disorders have been described in the medical literature. Many represent primary disorders of the lung (e.g., silicosis), whereas others are manifestations of underlying systemic disorders (e.g., scleroderma). These chronic lung disorders are not rare. Such disorders comprise up to 15% of the pulmonary conditions seen by U.S. chest physicians.1 However, despite the vast number of diseases and the potentially debilitating effects, only 25% to 30% have a known or established etiology.2 Fortunately, for those radiologists involved with the imaging of such patients, only 15 to 20 diseases comprise >90% of the cases encountered in most clinical practices.
Terminology change
The preferred terminology is chronic diffuse infiltrative lung disease. Diffuse lung diseases are notoriously difficult to characterize on conventional chest radiographs. Many different disease processes have similar radiographic appearances, and the classic radiographic differentiation into “alveolar” and “interstitial” categories is unreliable. Many pathologically classified interstitial disorders produce an alveolar pattern on the chest radiograph. The pulmonary interstitium is a continuous structure extending from the visceral pleura to the hilus. The alveolar walls are composed of capillaries suspended by fibrous strands covered by epithelial cells. Within the alveolar wall there is a continuation of the interstitium in contact with the alveolar basement membrane. Thus, the alveolar and interstitial compartments are, in essence, contiguous. Therefore, essentially any disease process that involves one compartment invariably involves the other. Isolated involvement of the alveolus or interstitium is unusual.3-5
Clinical presentation and evaluation
Imaging studies comprise only one facet of the overall evaluation of patients with diffuse lung disease. The vast majority of patients are symptomatic. The primary complaint is dyspnea. The physical examination often reveals dry basilar rales or crackles that fail to clear with coughing. A thorough occupational (e.g., silica or asbestos exposure) and recreational (e.g., bird breeding) history may narrow an otherwise broad differential by identifying probable etiologies. Physiologic disturbances in gas exchange result in hypoxemia. Pulmonary function tests (PFTs) are often performed to provide an objective assessment of a given patient’s lung function. Although PFTs are sensitive to lung disease, the findings of reduced lung volume and a restrictive pattern are nonspecific.
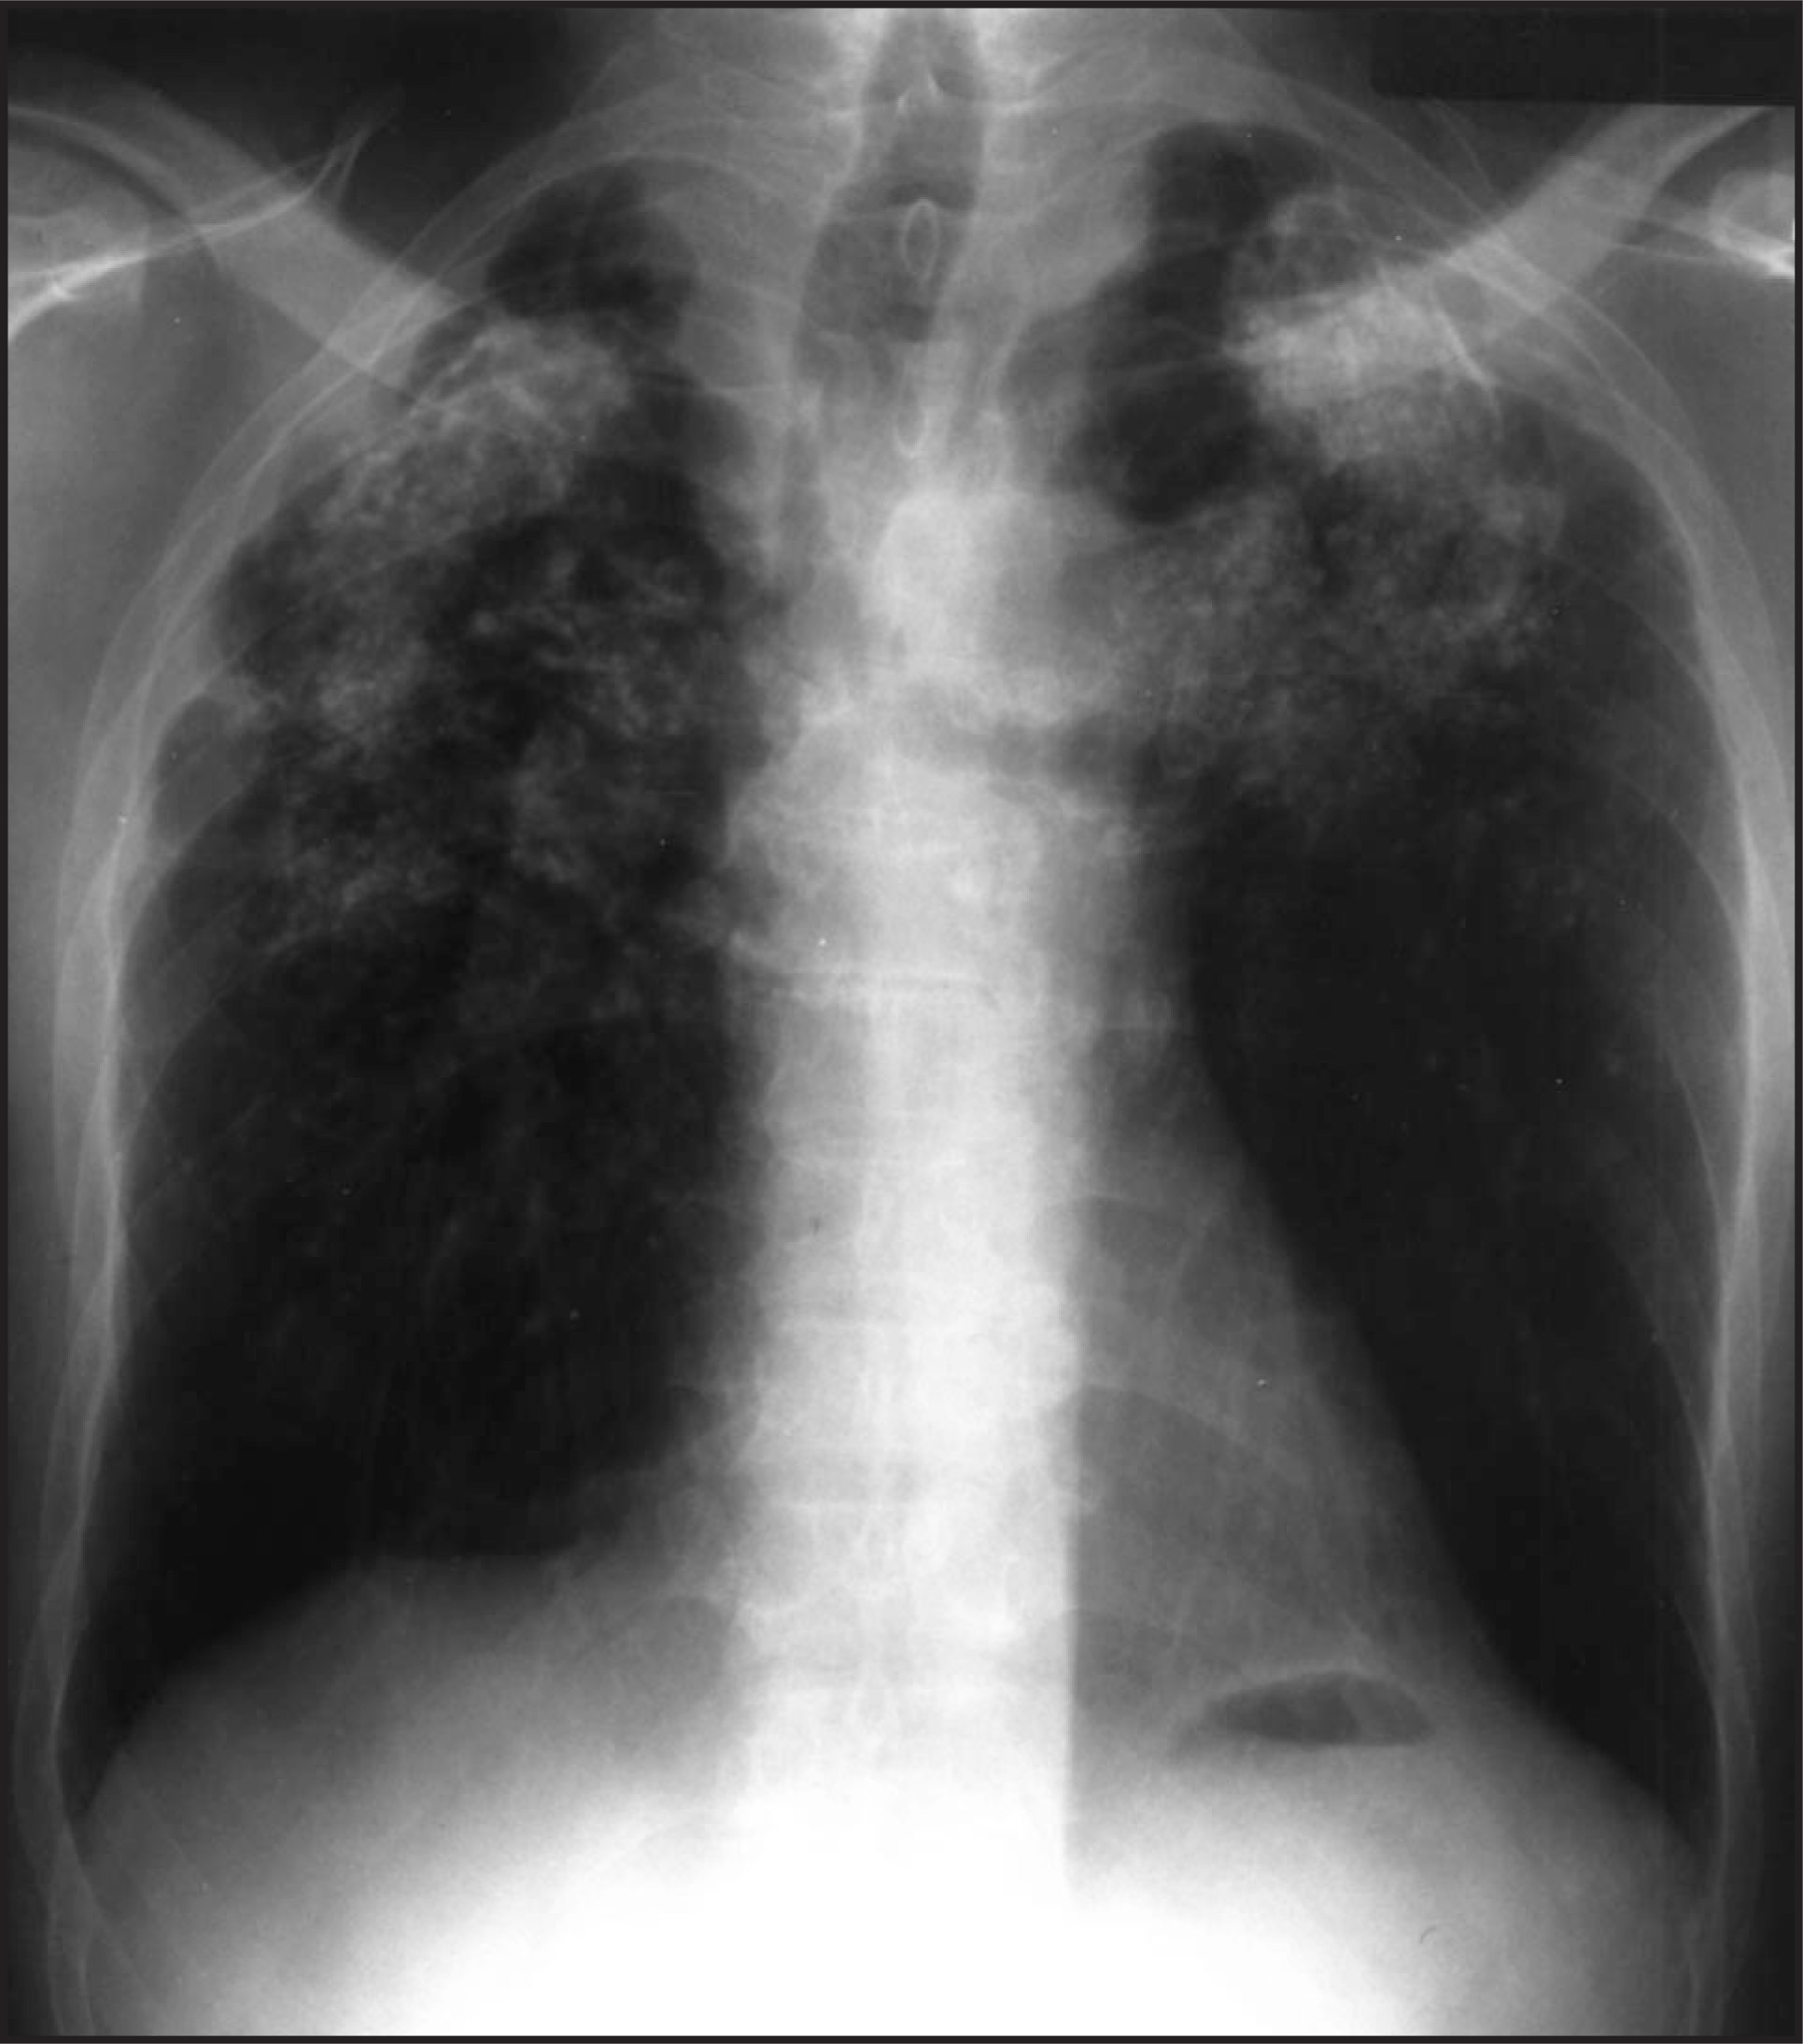
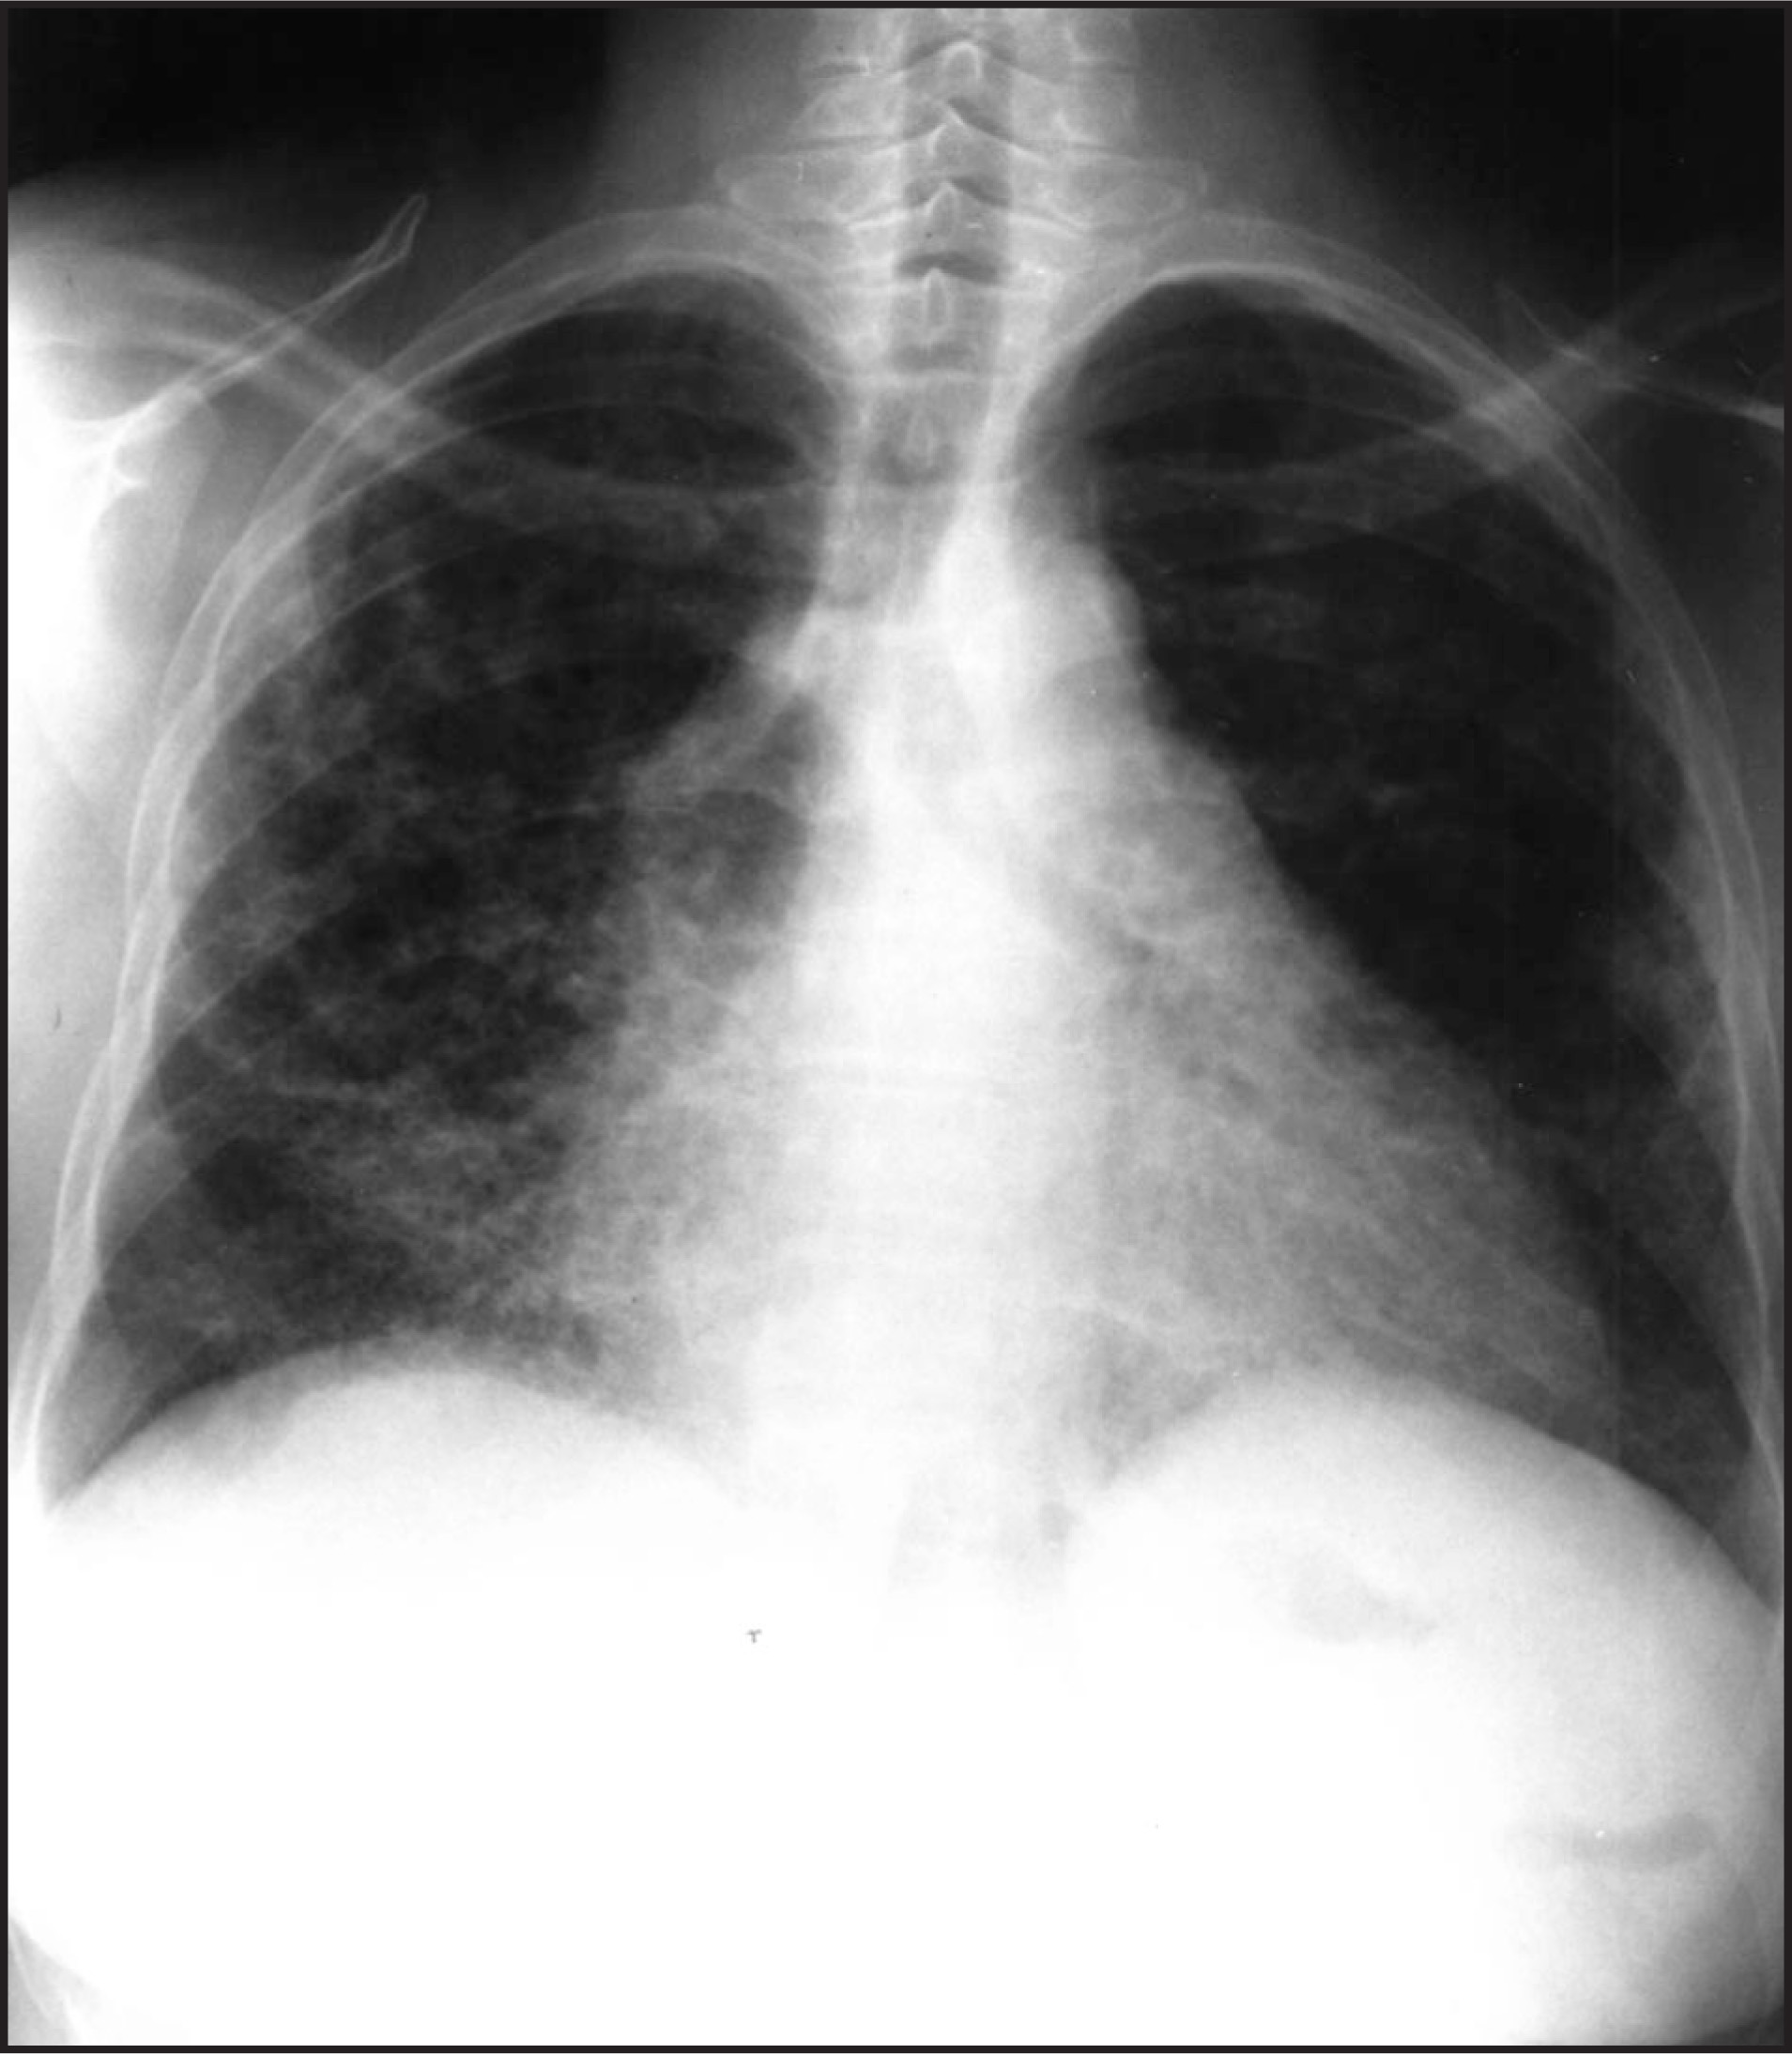
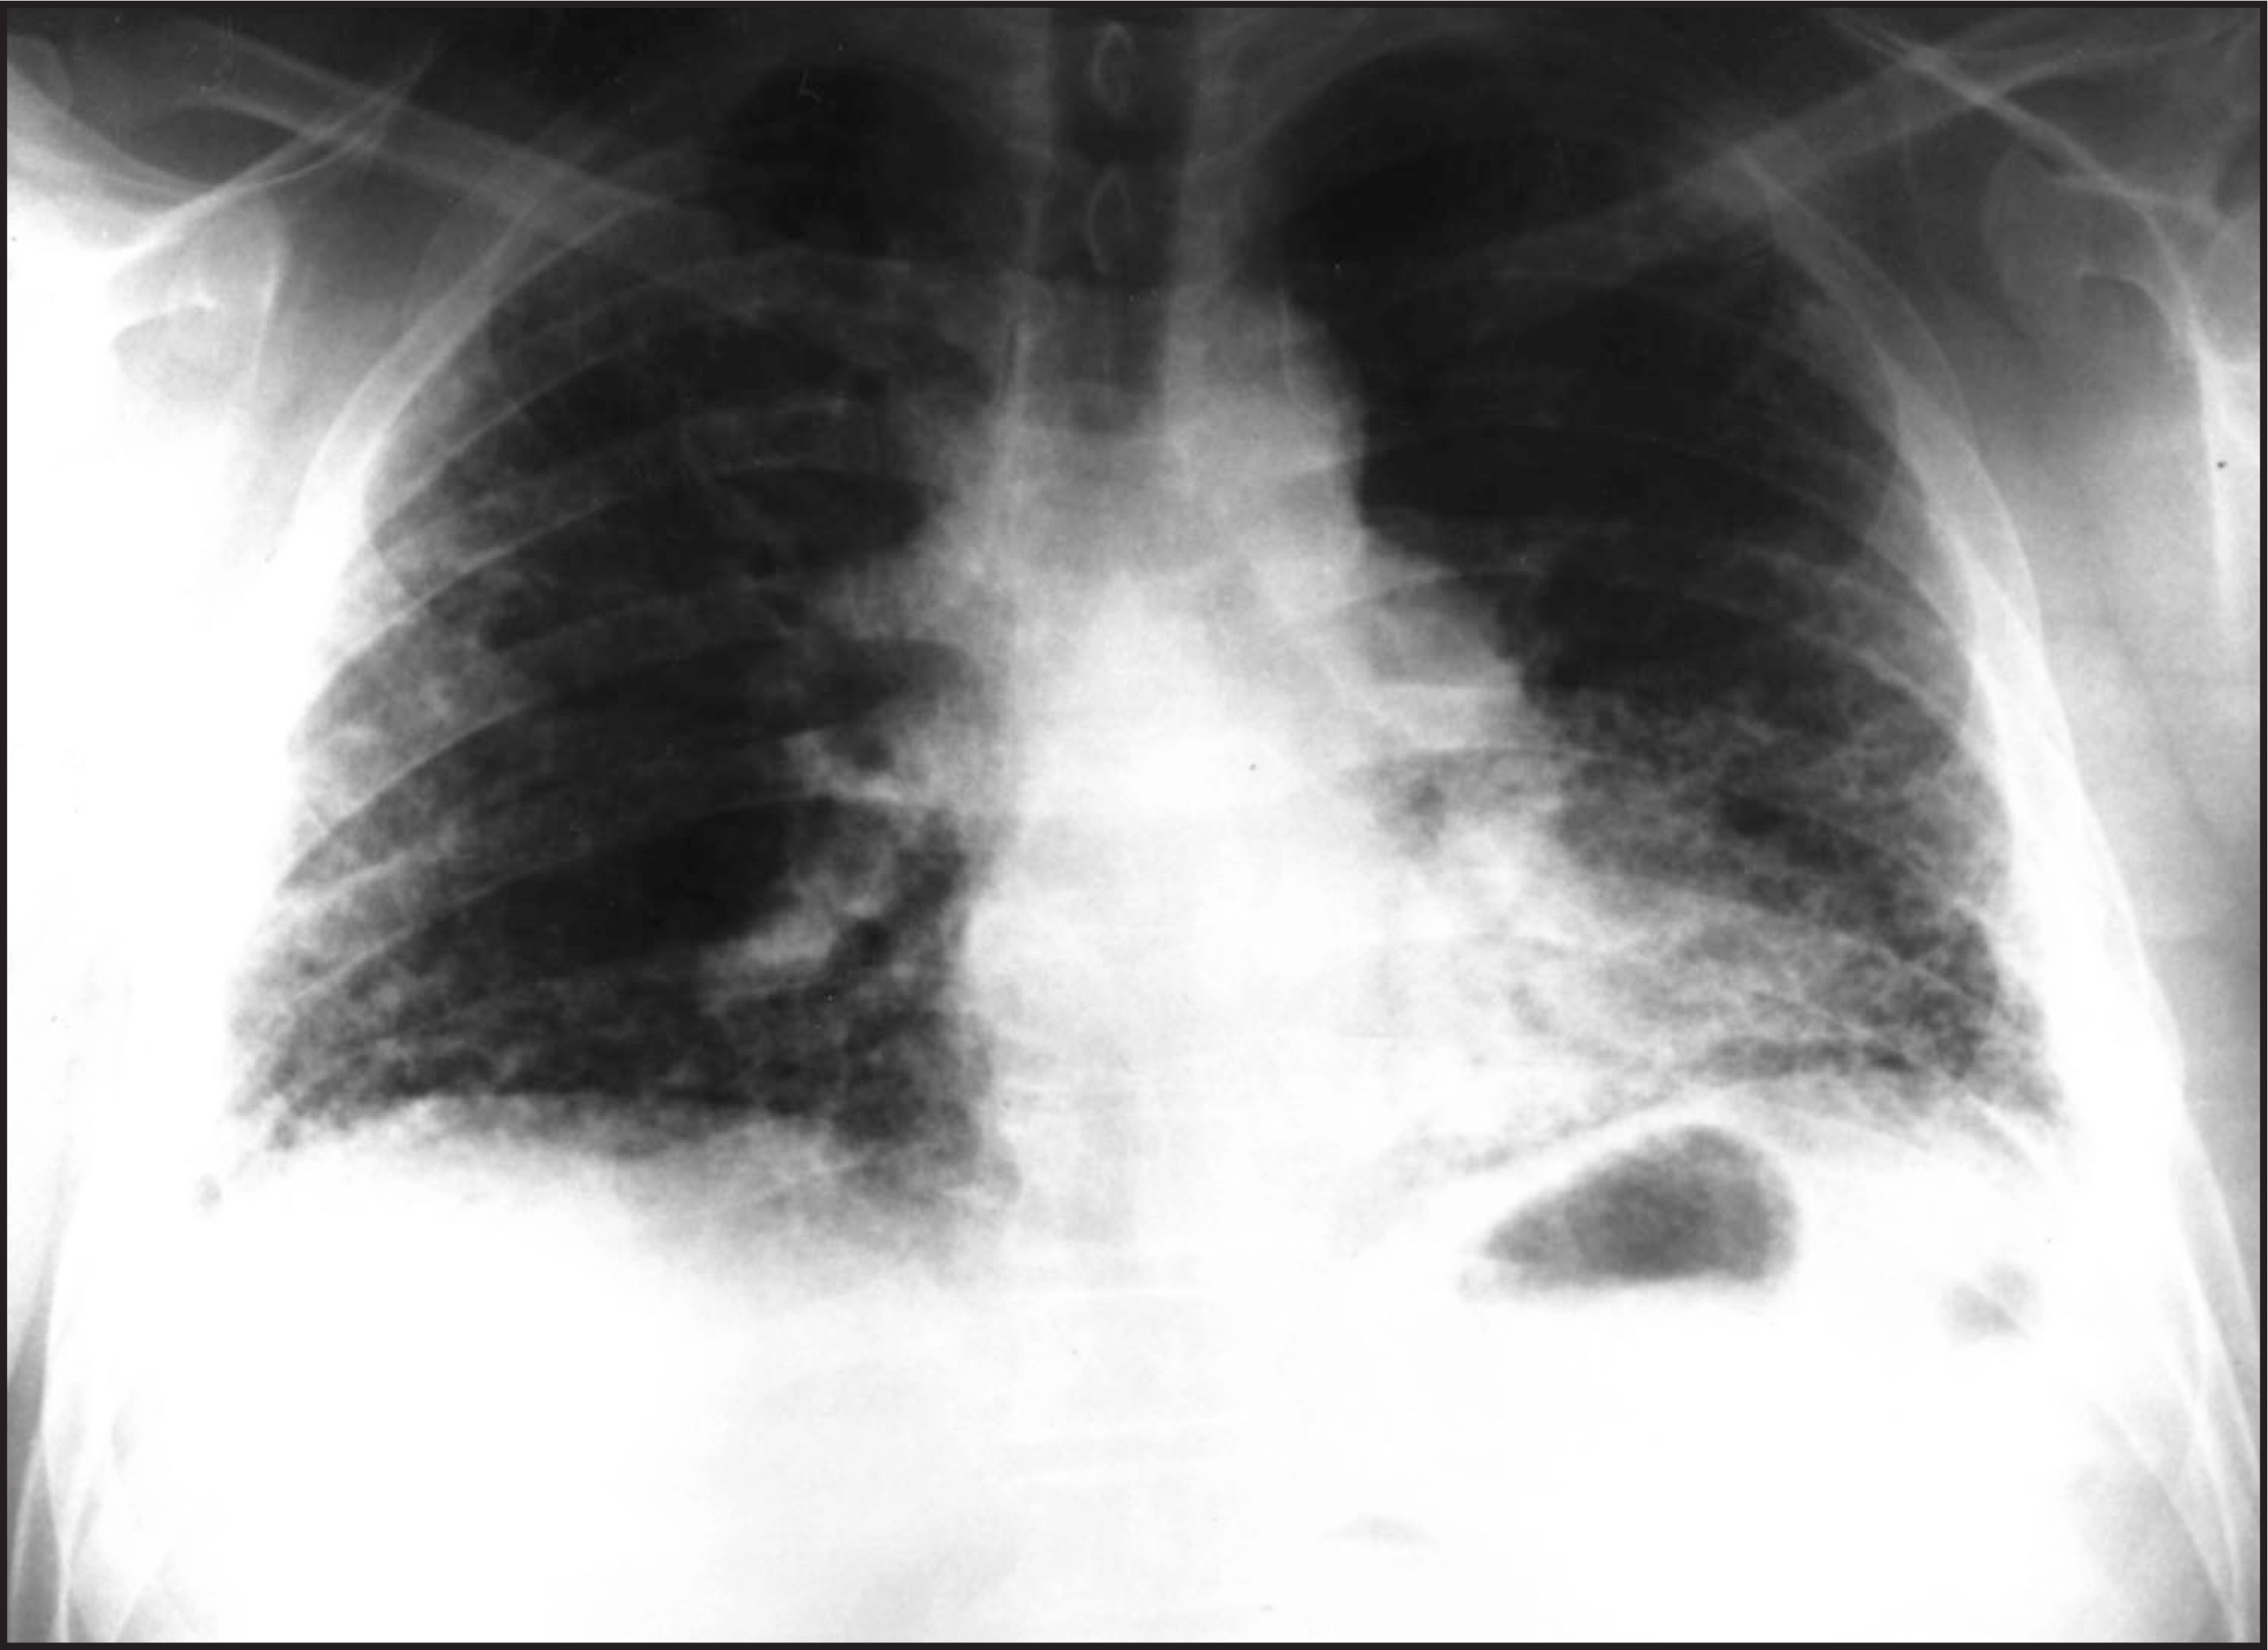
Most patients are then referred for a conventional posteroanterior (PA) and lateral chest radiograph. In some instances, with the appropriate clinical history and physiologic and radiographic findings, no further evaluation will be necessary (figure 1). In other instances, the chest radiograph is abnormal, but nonspecific (figure 2). Symptomatic patients with either a normal or abnormal but nonspecific chest radiograph may benefit from high-resolution computed tomography (HRCT) imaging. The HRCT findings may further delineate the parenchymal disease process, increasing the radiologists’ level of confidence in a particular diagnosis or differential diagnosis. The HRCT may also be used to appropriately guide potential transbronchial or open lung biopsies to establish a definitive diagnosis and to follow potential response to various drug therapies.
HRCT technique
High-resolution imaging techniques differ considerably from conventional or helical computed tomography (CT) imaging techniques. Fortunately, HRCT scans may be performed on most currently available CT scanners without hardware modifications. The technique is designed to optimize lung parenchymal resolution. Four scan parameters may be optimized to maximize resolution, including the reconstruction algorithm, slice collimation, pixel size, and the radiation dose delivered during the scan.
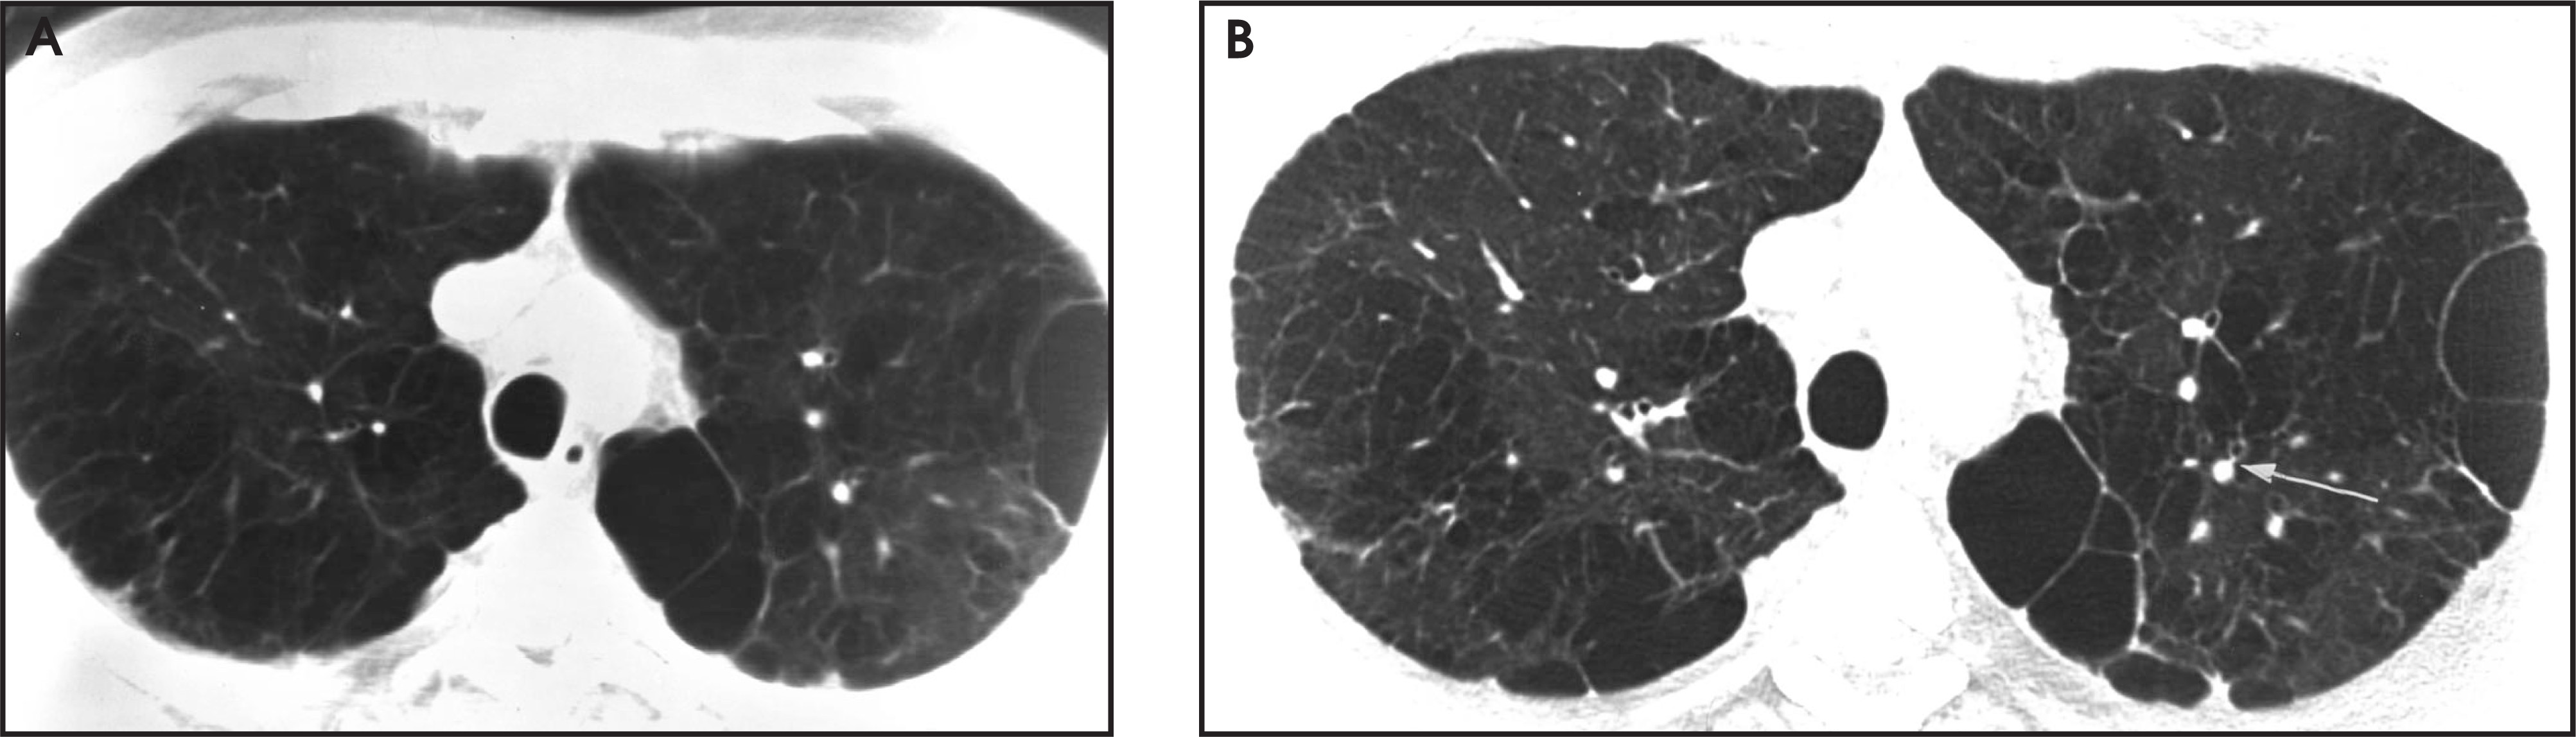
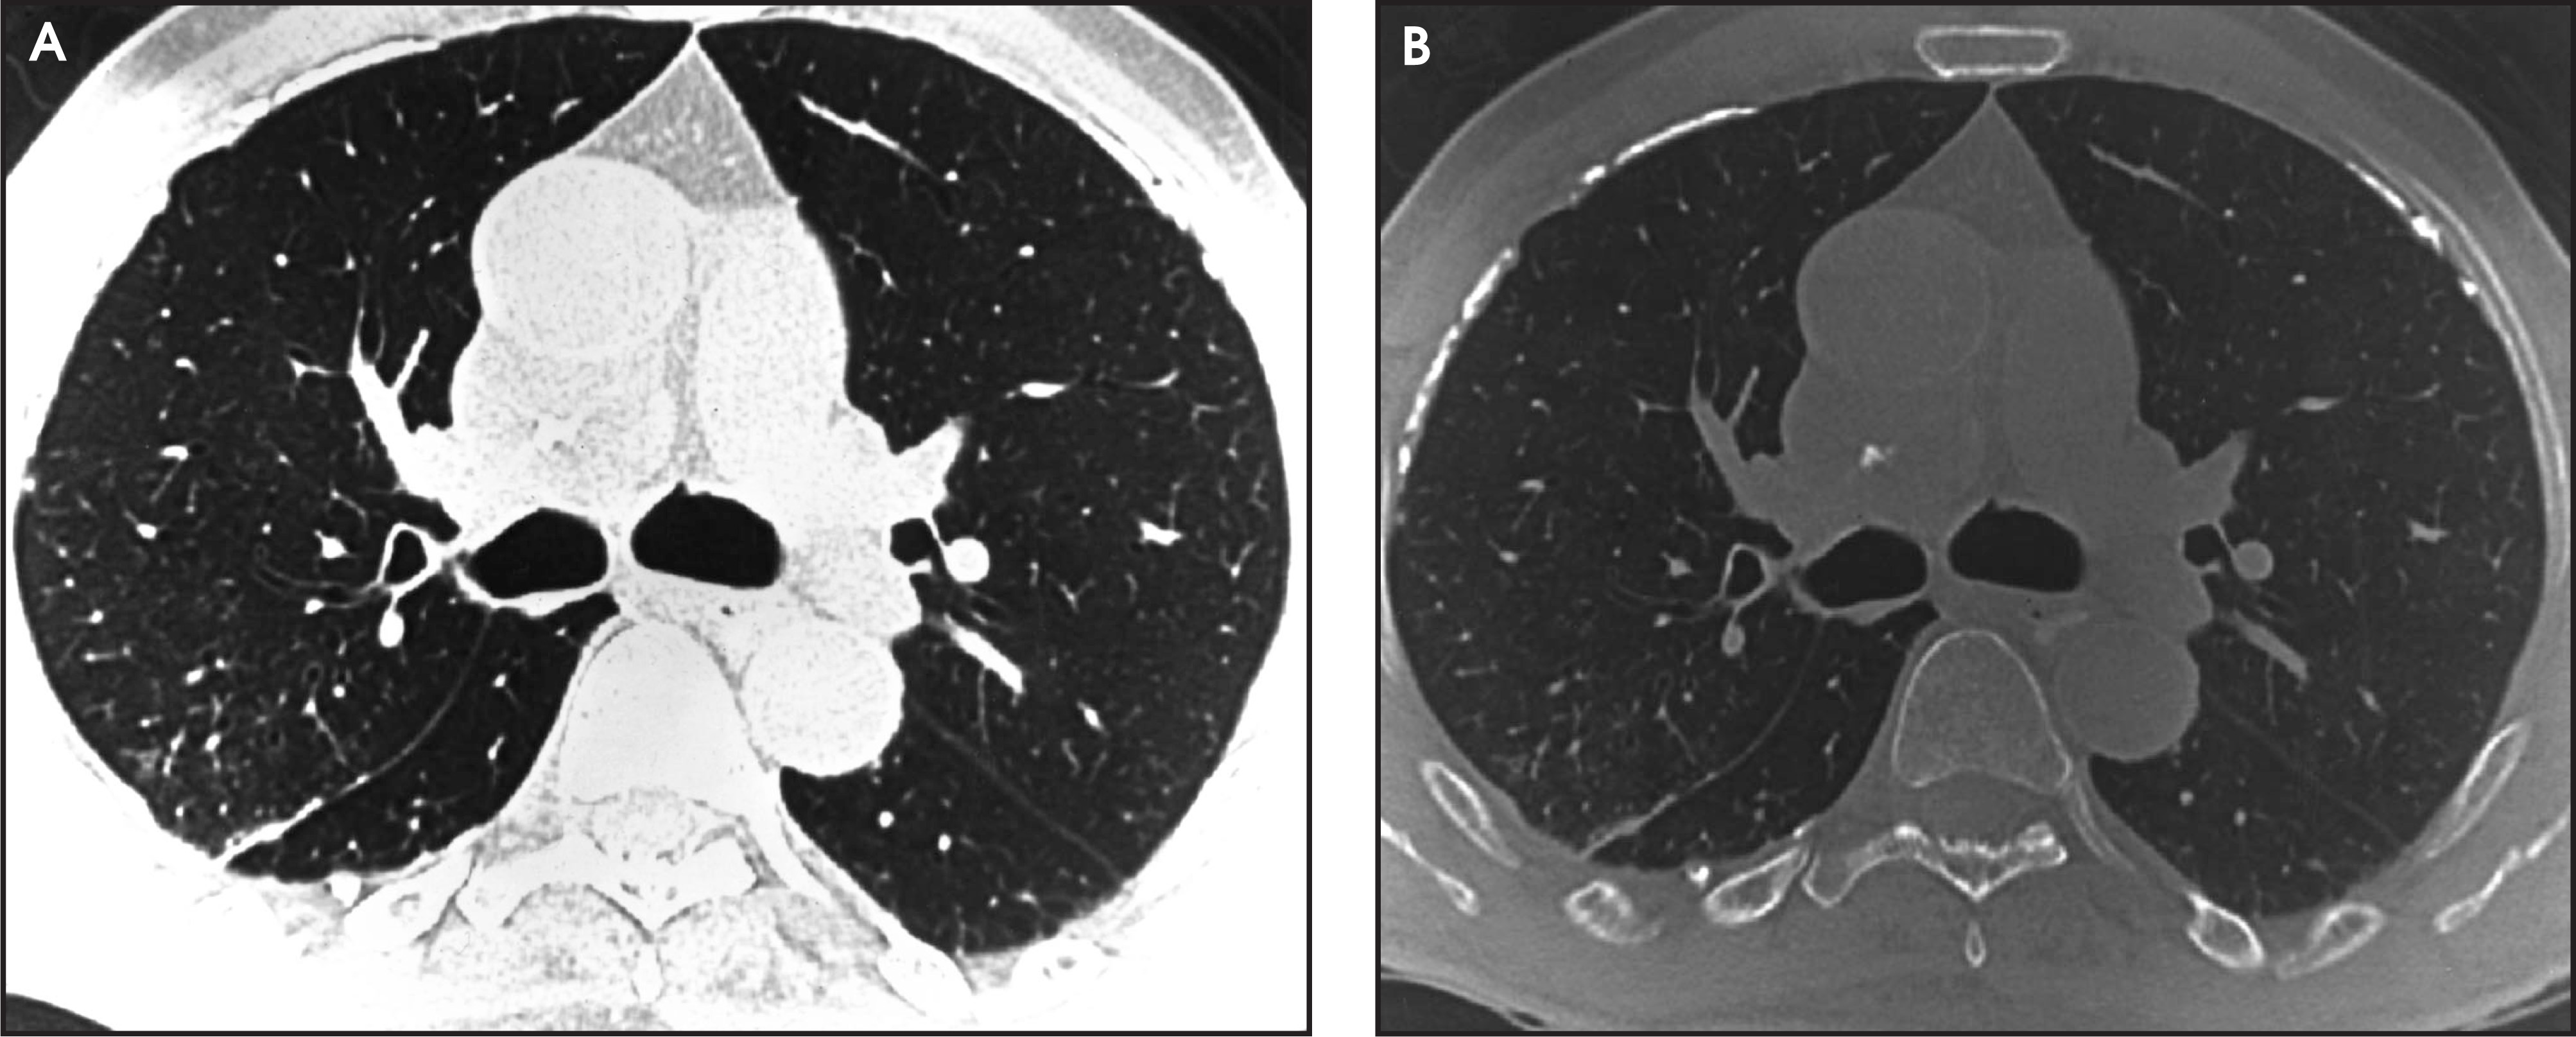
The radiologists’ ability to “resolve” small, high-contrast parenchymal structures (e.g., centrilobular artery, interlobular septa) is improved by the use of what is commonly referred to as a high spatial frequency reconstruction algorithm. The reconstruction algorithm specifies the frequency of information displayed in an image. Routine imaging uses a low-frequency algorithm. Such an algorithm creates a smooth image, with less visible noise, and is advantageous for imaging those tissues with little differences in contrast between adjacent structures (e.g., abdomen, brain). This algorithm does not work as well in the lung, where there are dramatic differences in density between adjacent structures (e.g., the bronchovascular bundle within a region of normal aerated lung). A low-frequency algorithm would essentially average these disparate densities, creating an indistinct or fuzzy bronchovascular bundle. Although the high-frequency algorithm improves the resolution of otherwise radiologically unresolvable structures, the images often appear more grainy (i.e., noisy) (figure 3). The high spatial frequency reconstruction algorithm available on most current scanners is a variation of a “sharp” or “bone” algorithm.6,7
Manipulation of the slice thickness or collimation is the second most important parameter to affect image resolution. The thinner the collimation, the less the partial volume averaging. Most radiologists use a 1- to 2-mm collimation. 6-8 We routinely use a collimation of 1.5 mm and acquire images every 10 mm from the lung bases to the apices. The caudal-cranial scan sequence is employed to minimize degradation by diaphragmatic motion as the patient fatigues during the scan and image acquisition.
The selected field of view (FOV) will affect the pixel size. The smaller the FOV, the smaller the pixel size, and the greater the ability to resolve smaller structures. One should select an FOV that sacrifices the soft tissues of the chest wall, outside the rib cage, but encompasses both lungs. Although single- lung targeting may seem an attractive means of further reducing pixel size and improving spatial resolution, it has limited practical clinical applications, and we do not advocate its routine use. Finally, one can reduce the amount of visible image noise by increasing the kilovoltage peak (kVp) and the milliamperage (mA). However, in most cases, this only serves to increase the radiation dose to the patient with little additional diagnostic benefit. For the evaluation of diffuse infiltrative lung disease, we prefer to scan our patients in the prone position, if tolerable, as gravitational or dependent atelectasis may often obscure early parenchymal or subpleural changes. We have also found the routine acquisition of images during both the inspiratory and expiratory phases of the respiratory cycle helpful in detecting otherwise unsuspected small and medium airway disease.
Secondary pulmonary lobule
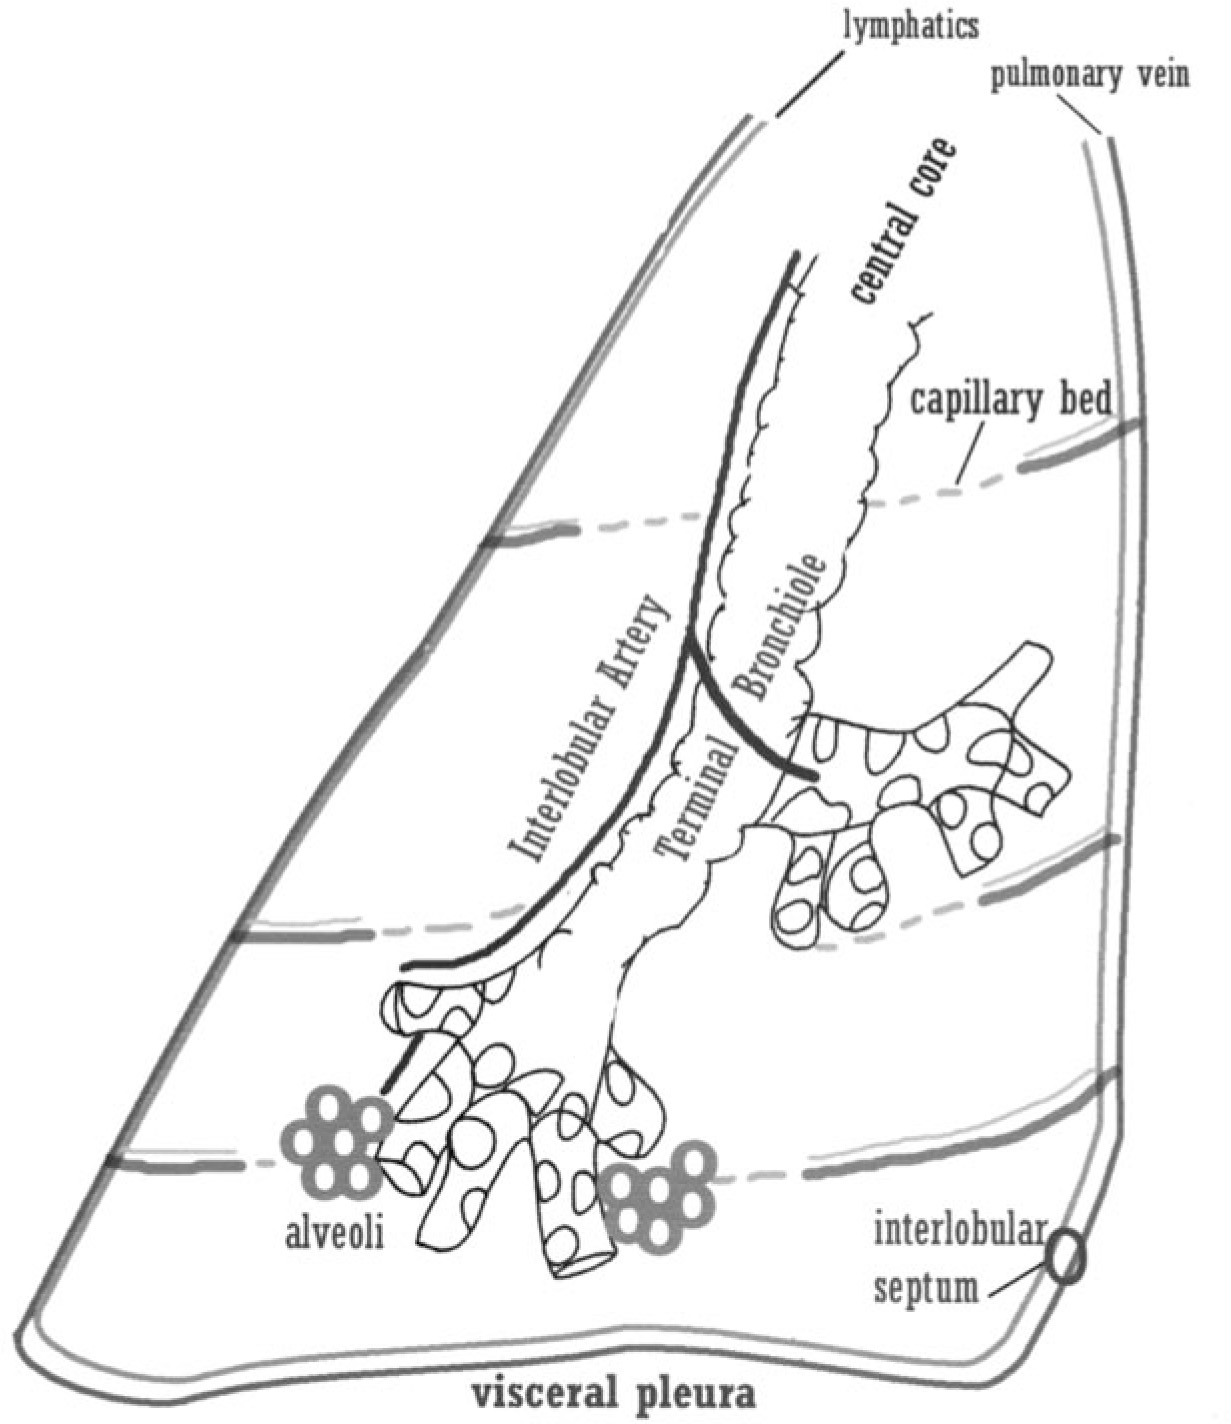
The secondary pulmonary lobule is the basic functional unit of the lung and cannot be visualized routinely with either conventional radiographic or CT imaging. The secondary lobule can, however, be evaluated on HRCT scans. Knowledge of the normal secondary lobule anatomy is critical to the interpretation of HRCT scans and to the understanding of diffuse infiltrative lung disease. The secondary pulmonary lobule is an irregular polyhedron that measures between 1.0 and 2.0 cm on each side. Each lobule is supplied by 3 to 5 terminal bronchioles and contains a central core and peripheral septa. The central core contains the pulmonary arteriole and the accompanying terminal bronchiole. The arteriole delivers blood to the capillary bed surrounding the alveoli. The smallest arteriole resolved by HRCT is approximately 0.2 mm and may be recognized as a singular peripheral dot or branching structure within 0.5 to 1.0 cm of the pleural surface. The accompanying terminal bronchiole cannot be resolved. Normal bronchi are typically not visualized in the peripheral 2.5 to 3.0 cm of the lung. Sheets of connective tissue form the peripheral boundaries of the lobule that also contain the draining pulmonary veins and lymphatics. Lymphatics are also present in the core (figure 4). The respiratory bronchioles, alveolar ducts, and alveoli occupy the space between the lobule core and septa. The lobules are most well developed in the apex and lung periphery, but less so in the posterior aspects of the upper and lower lungs. The septa are oriented perpendicular to the pleura in the lower lobes and, on occasion, are visualized in a normal lung. However, the visualization of numerous septa of multiple lobules indicates lung disease.8-14 Since the secondary lobule septa contain both pulmonary veins and lymphatics, any pathophysiologic process affecting these systems can affect the appearance of the lobular septa. For example, septal thickening may be seen in the setting of acute pulmonary edema (i.e., venous engorgement) and resolving or subacute bronchopneumonia (i.e., venous and lymphatic congestion). In order to avoid a potential inappropriate diagnosis of chronic diffuse infiltrative lung disease, one should not perform an HRCT scan until such processes have completely resolved.
Radiologic approach and analysis
The radiologic analysis of chronic diffuse lung disease requires a systematic approach. The radiologist should direct his or her attention to each of the following five categories: 1) the zonal distribution; 2) the lung volumes; 3) the presence or absence of lymphadenopathy; 4) the presence of pleural disease, and 5) the pattern of disease. Each category will now be addressed.
Zonal predilection
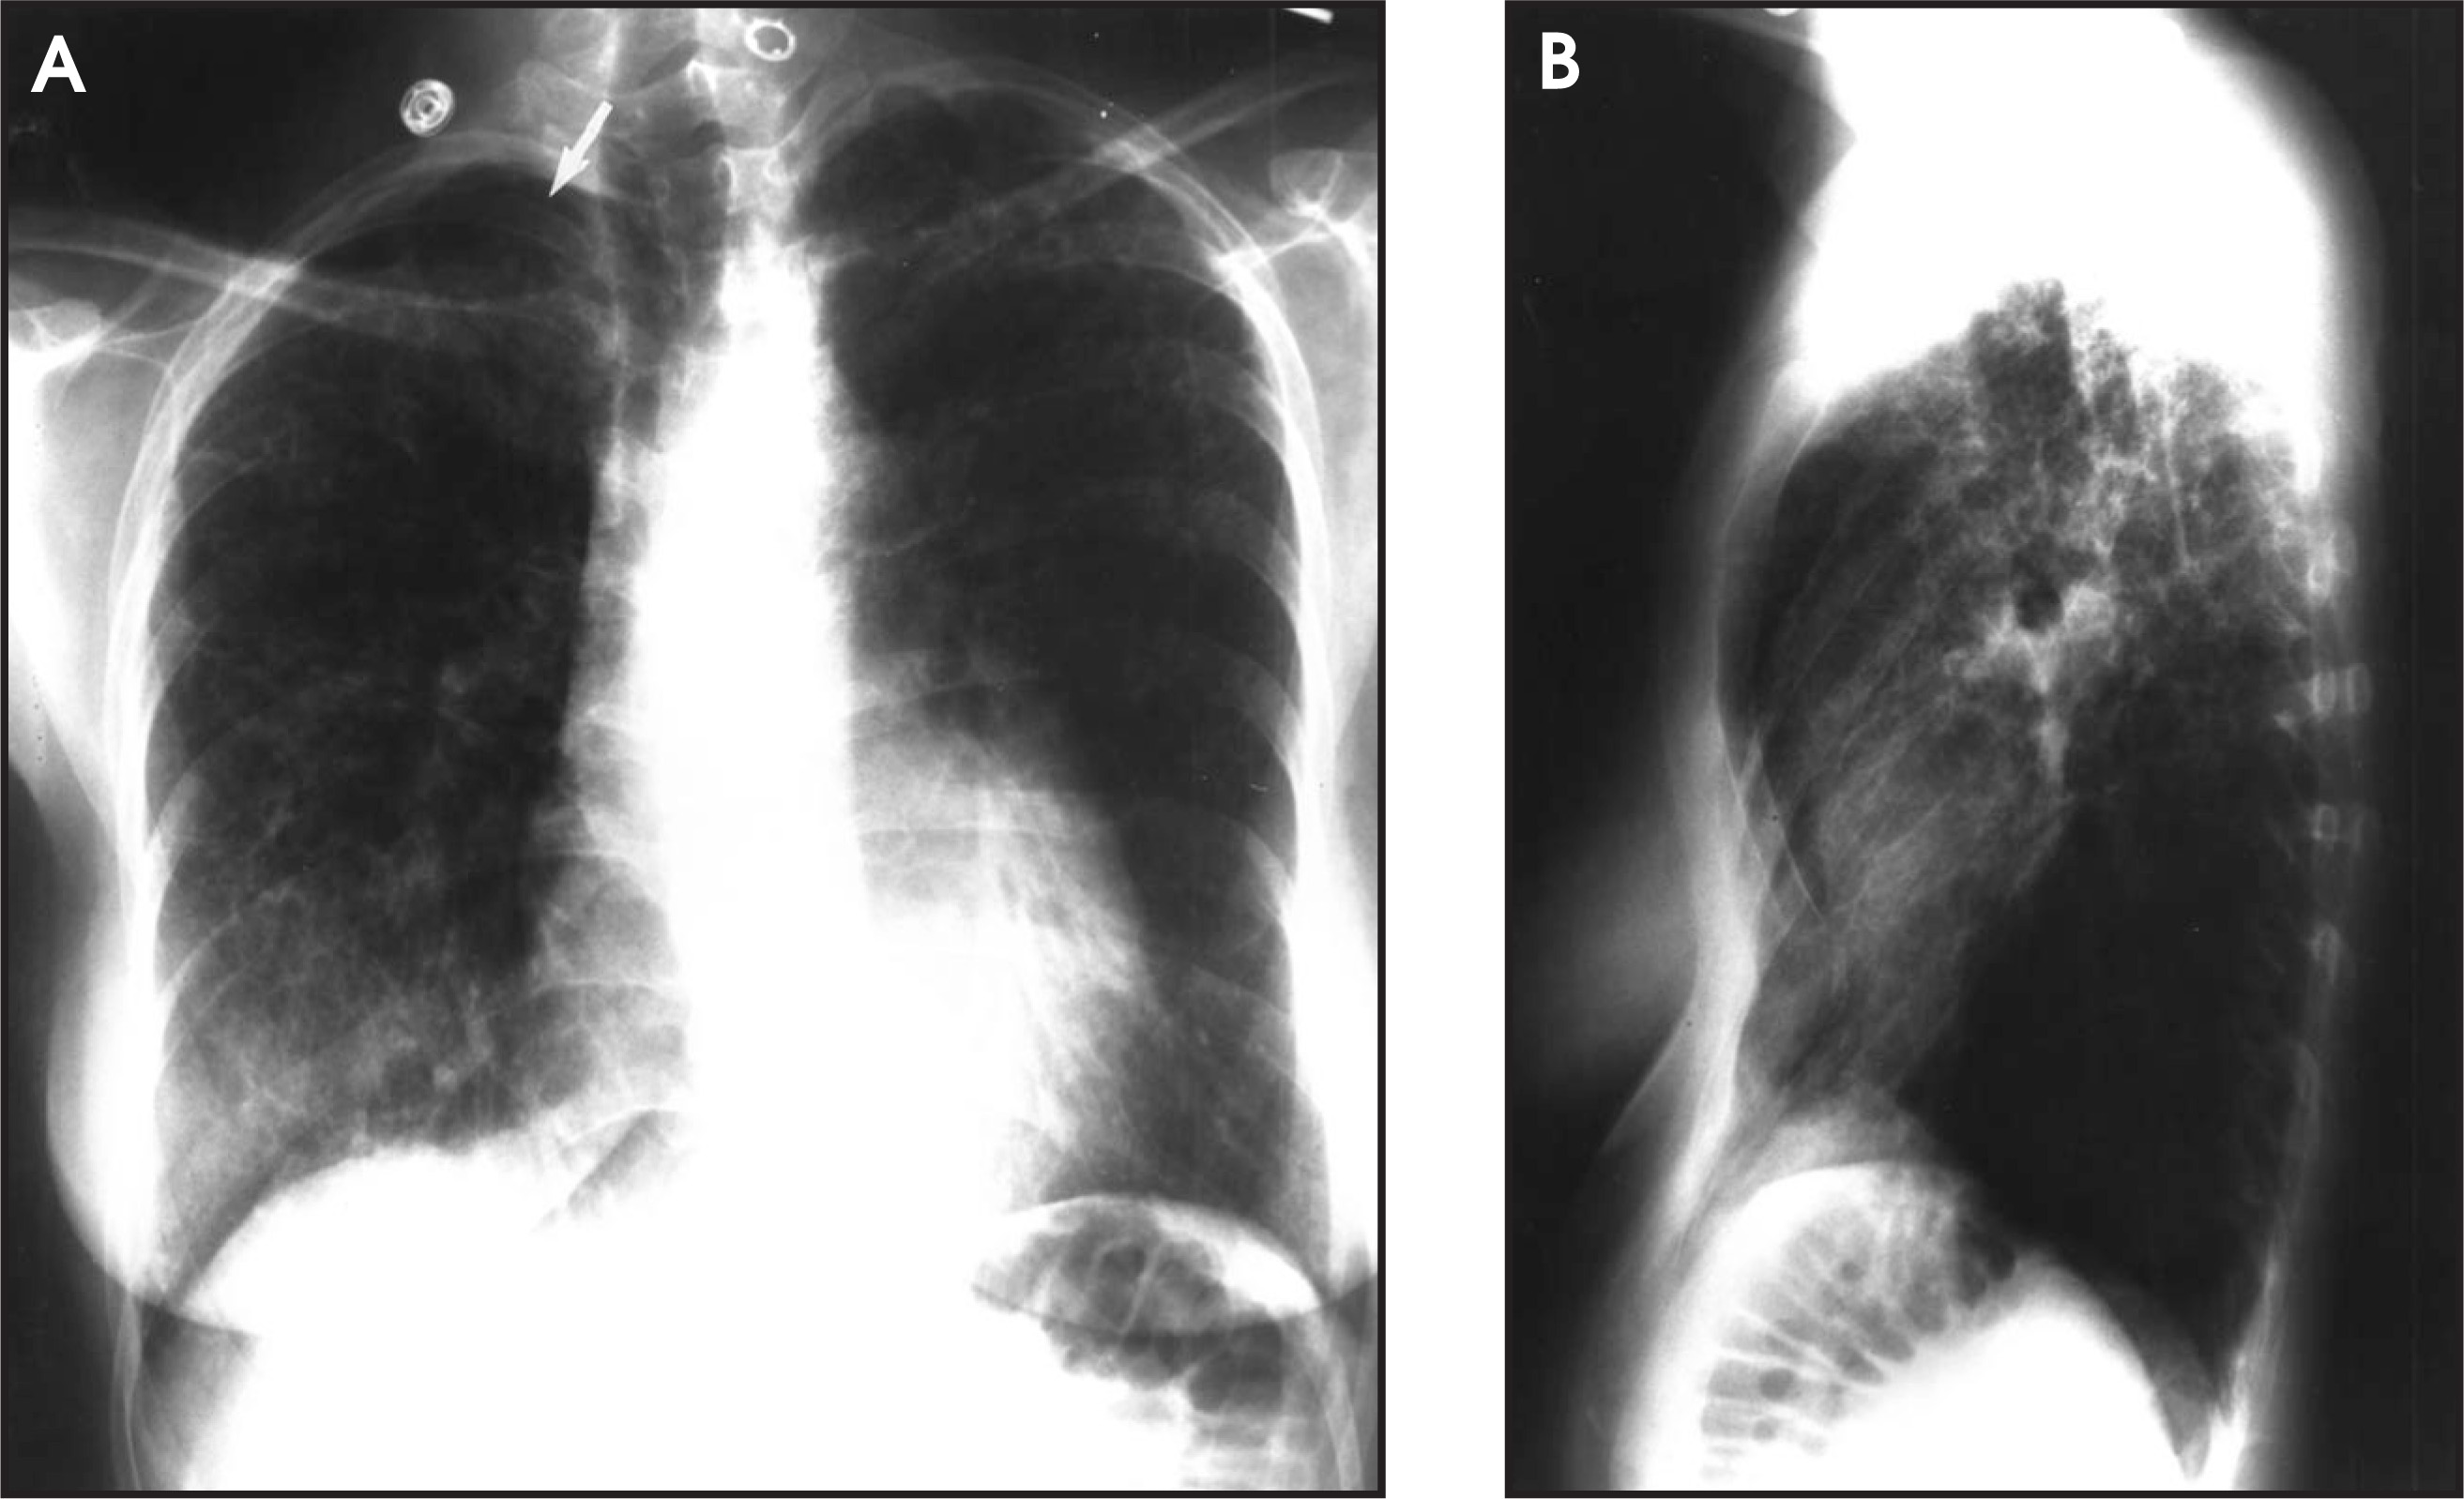
The upper and lower lung zones are physiologically quite different. These differences explain, in part, the regional predilection of some diffuse lung diseases. The lower lung receives the greatest amount of ventilation, perfusion, and lymphatic drainage and is more frequently affected by various fibrotic processes and those affecting the lymphatic system (figure 5). However, the upper lung has a relatively higher oxygen tension and pH, but less efficient lymphatic drainage. The upper lung is often affected by inhalational (e.g., silicosis) and granulomatous diseases and Langerhans cell histiocytosis15 (figure 6). The lung may be further divided into an axial, parenchymal (middle), and peripheral compartment. The axial compartment includes the peribronchovascular bundles and lymphatics and is contiguous with the mediastinum. The middle or parenchymal compartment is formed by the alveolar walls. The peripheral compartment includes the pleura, subpleural connective tissue, interlobular septa, pulmonary veins and lymphatics, and the walls of the cortical alveoli. Although these compartments communicate with one another, relatively selective involvement may be seen in a number of disease processes. The radiologist can take advantage of this zonal predilection when formulating a differential diagnosis and directing potential transbronchial or open lung biopsies (Tables 1 and 2).16
| Upper |
| Sarcoidosis |
| Chronic interstitial pneumonias |
| Coal workers’ pneumoconiosis |
| Silicosis |
| Langerhans cell histiocytosis |
| Ankylosing spondylitis |
| Lower |
| Idiopathic pulmonary fibrosis |
| Lymphangitic carcinomatosis |
| Collagen vascular diseases |
| Asbestosis |
| Lymphangioleiomyomatosis |
| Axial |
| Sarcoidosis |
| Lymphoma |
| Lymphangitic carcinomatosis |
| Peripheral |
| Sarcoidosis |
| Idiopathic pulmonary fibrosis |
| Lymphangitic carcinomatosis |
| Collagen vascular diseases |
| Rheumatoid arthritis |
| Middle |
| Sarcoidosis |
| Chronic medications |
| Lymphangitic carcinomatosis |
| Neurofibromatosis |
| Vasculitis |
| Silicosis |
Lung volume
Early in the disease course, the lung volumes are often relatively normal. Patients with various granulomatous diseases, as well as Langerhans cell histiocytosis, preserve lung volume even as the disease progresses. However, a gradual reduction in lung volume may be seen in the setting of various fibrotic processes (e.g., idiopathic pulmonary fibrosis, scleroderma). Increased or hyperexpanded lungs may be seen in association with an obstructive process (e.g., emphysema, cystic fibrosis, lymphangioleiomyomatosis). The preservation or alteration of a given patient’s lung volumes may also aid in narrowing the differential diagnosis (Table 3).
| Normal |
| Sarcoidosis |
| Langerhans cell histiocytosis |
| Early stage disease |
| Increased |
| Emphysema |
| Lymphangioleiomyomatosis |
| Cystic fibrosis |
| Reduced |
| Idiopathic pulmonary fibrosis |
| Chronic interstitial pneumonias |
| Collagen vascular diseases |
| Asbestosis |
Lymphadenopathy
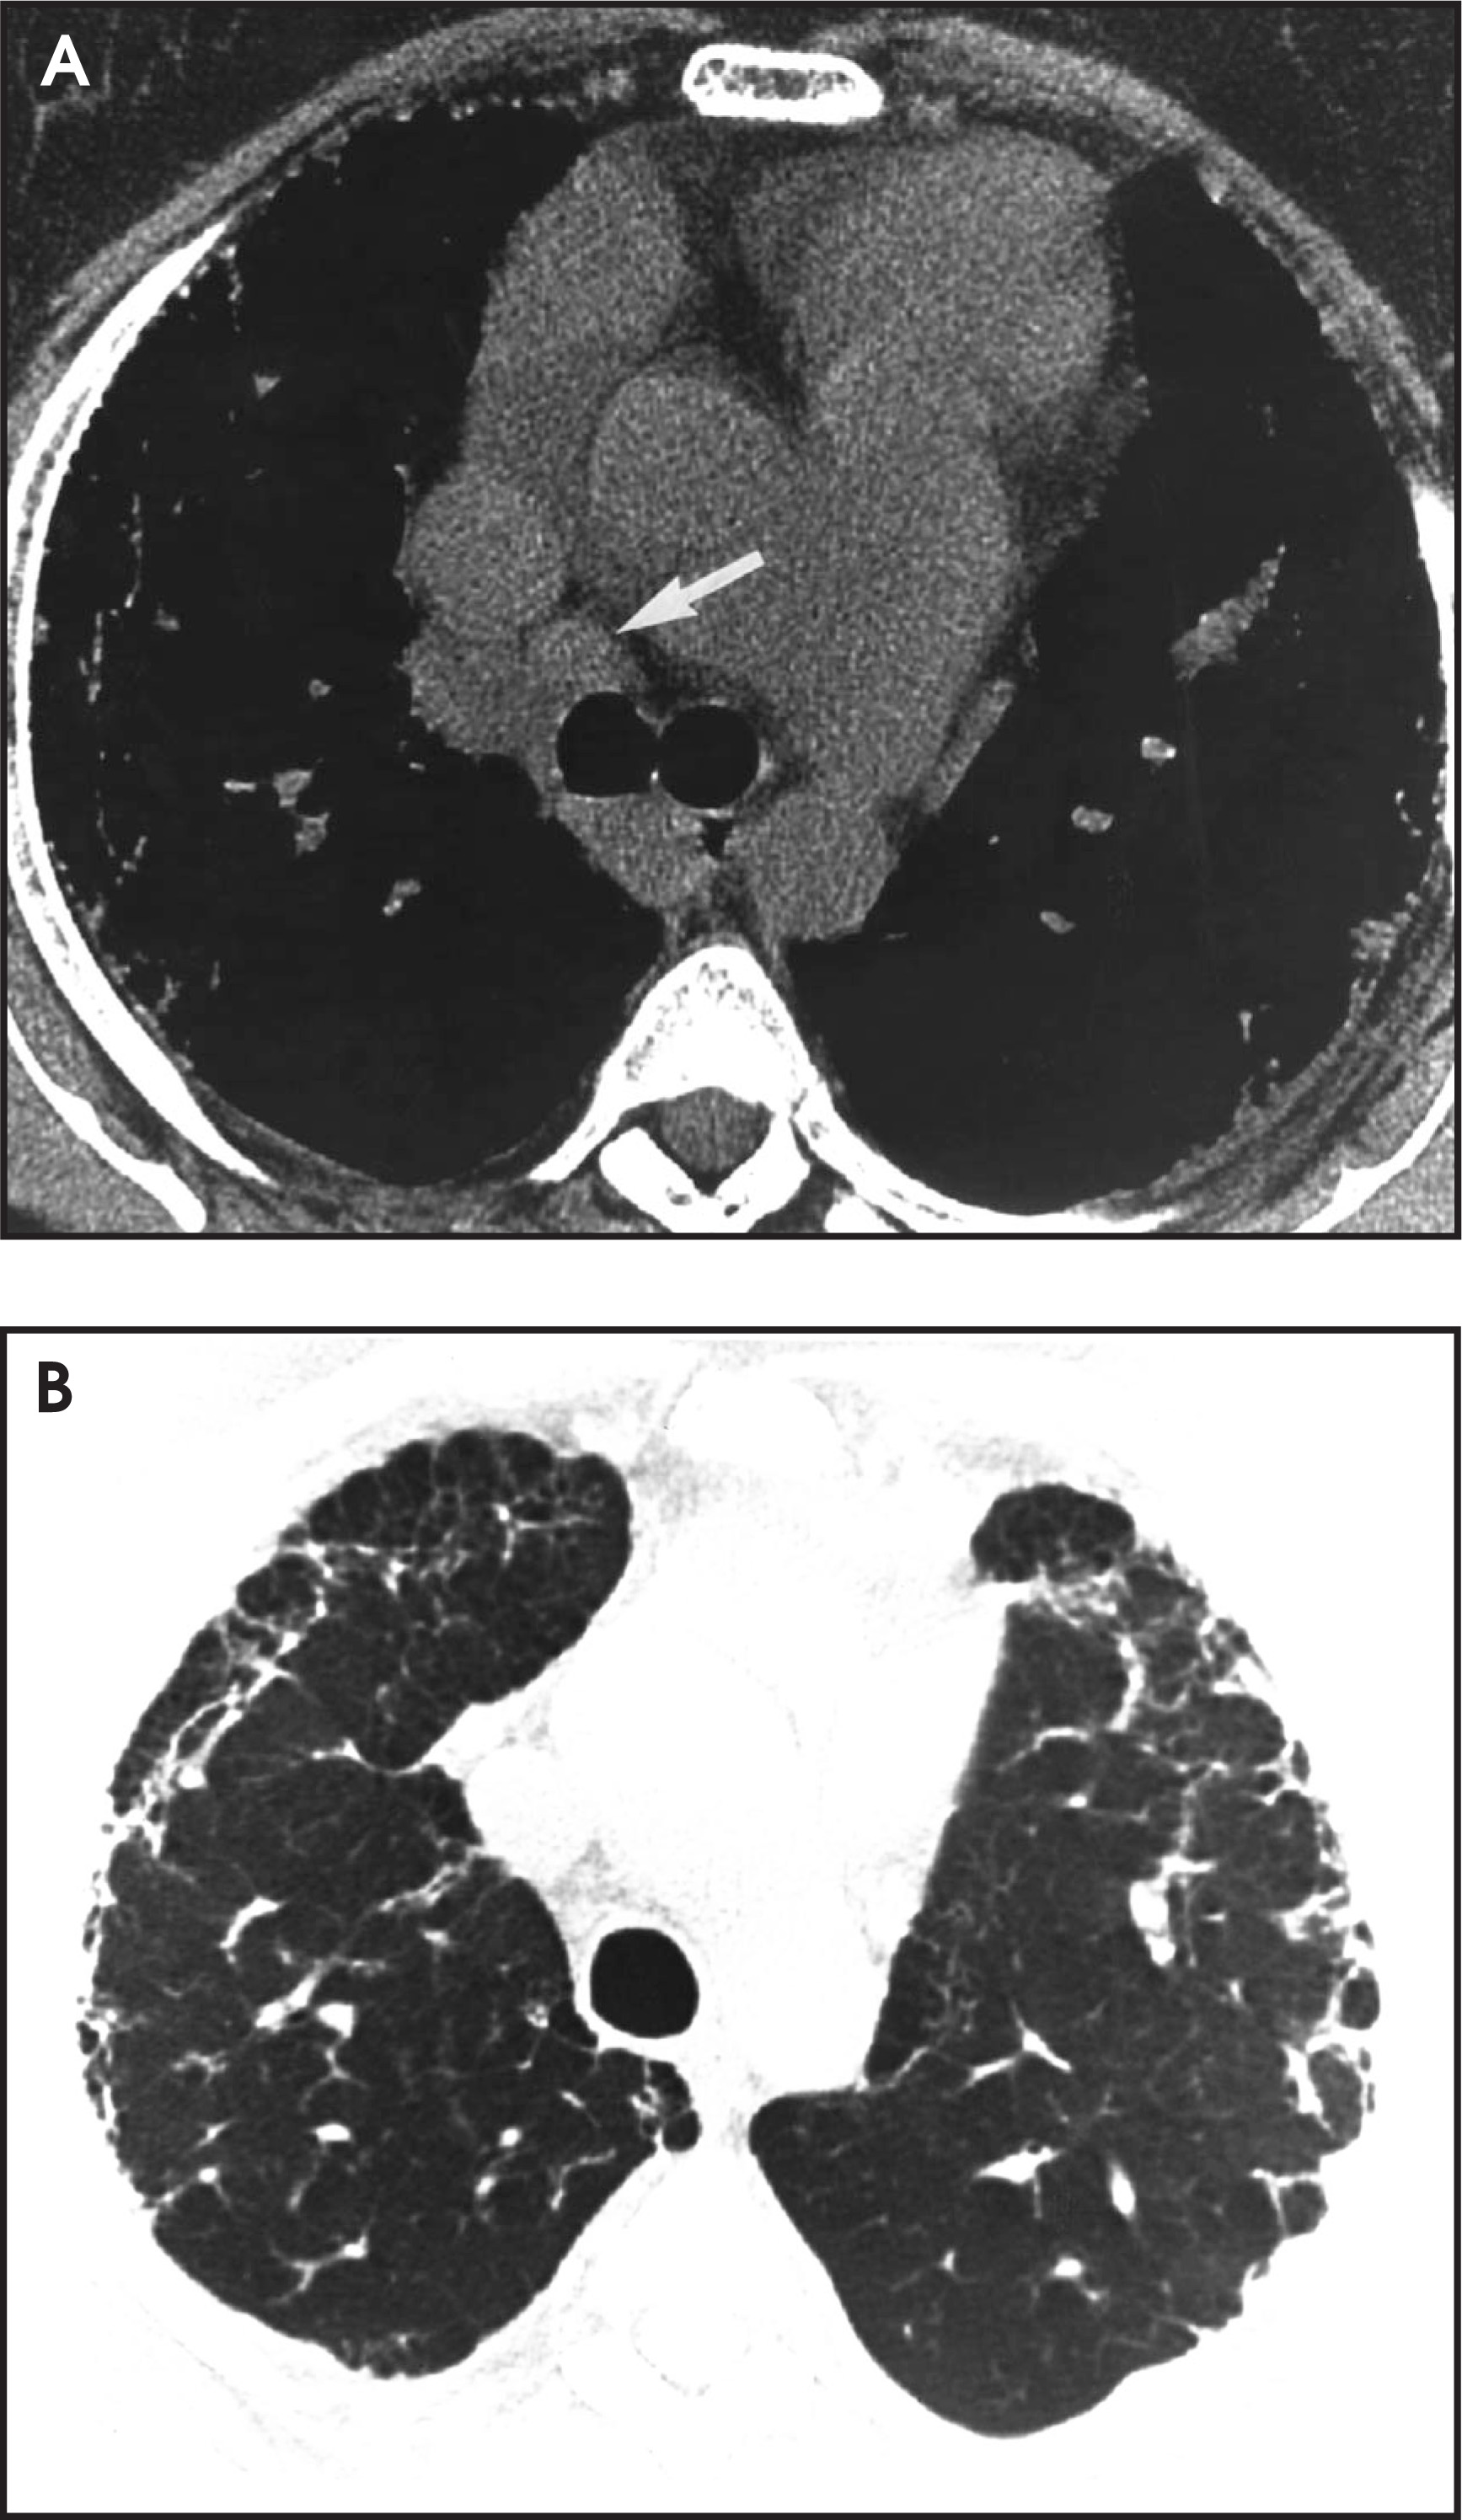
Radiographically demonstrable lymphadenopathy may be seen in association with diseases such as silicosis, sarcoidosis, lymphoma, and lymphangitic carcinomatosis. Computed tomography is more sensitive than radiography in the detection of nodal disease and may demonstrate mildly enlarged nodes in extrinsic allergic alveolitis, various collagen vascular diseases, and lymphangioleiomyomatosis. Mediastinal lymph node enlargement is evident on CT in 79% of patients with idiopathic pulmonary fibrosis and most often involves the lower-right paratracheal regions (figure 7).17,18
Pleural disease
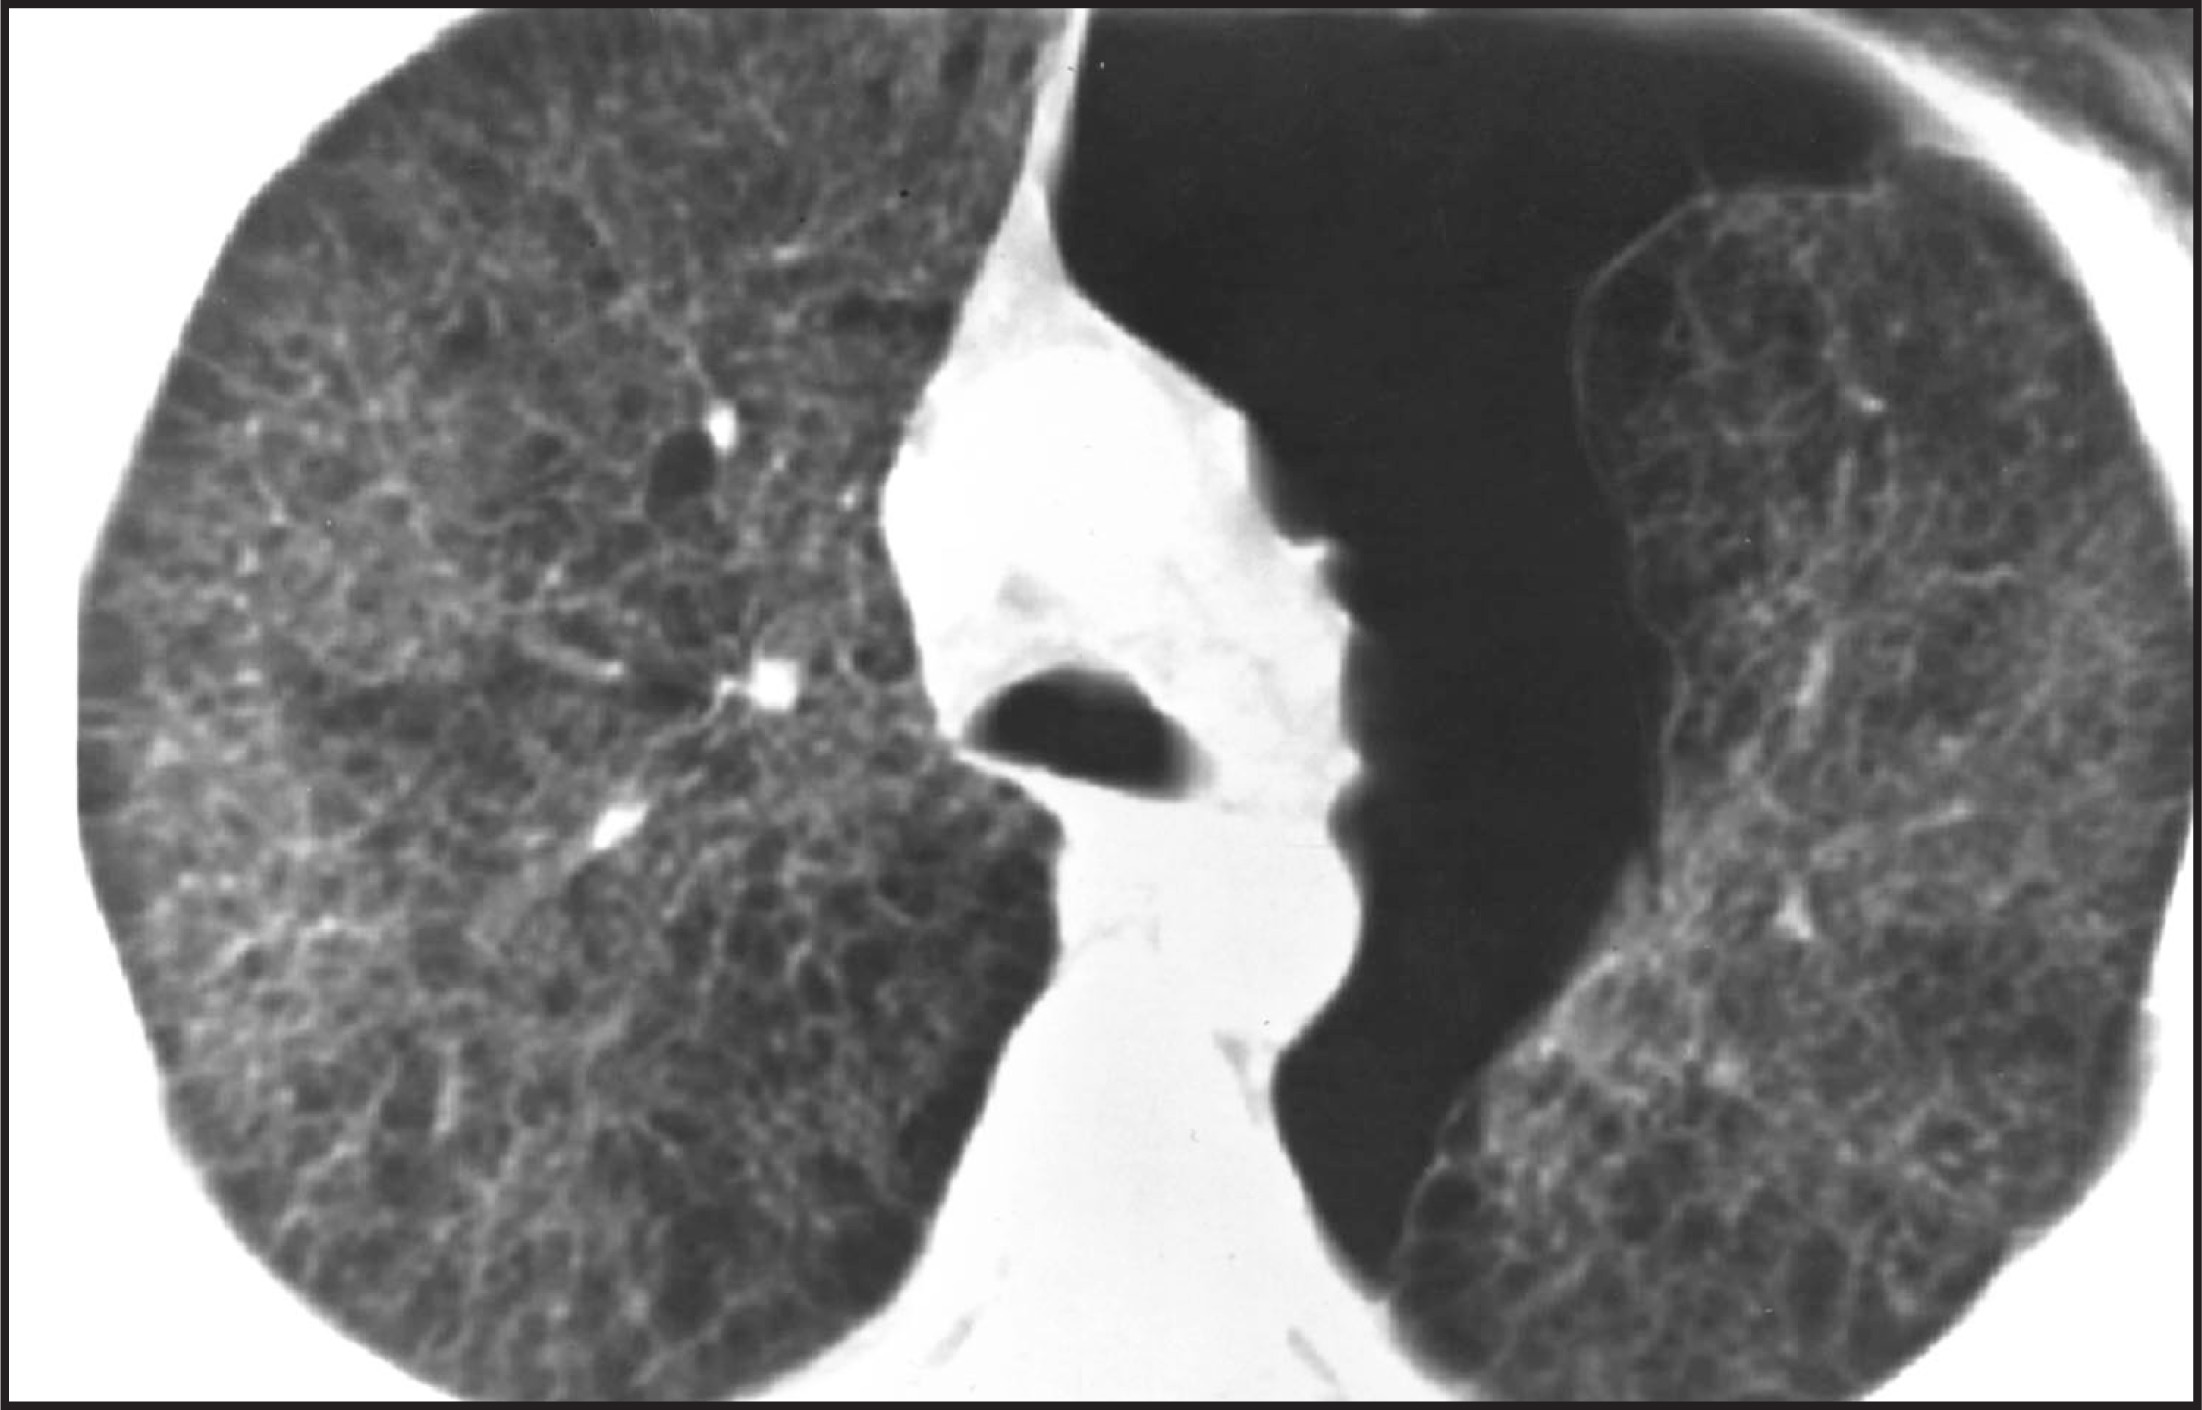
The various manifestations of pleural disease include pneumothorax, effusion, and diffuse pleural thickening. Spontaneous pneumothoraces characteristically occur in as many as 40% of patients with lymphangioleiomyomatosis and 23% of those with Langerhans cell histiocytosis (figure 8).19-22 However, a spontaneous pneumothorax may eventually complicate any end-stage lung disease process. Pleural effusions likewise may complicate lymphangio-leiomyomatosis, seen in up to 60% of patients. These are often recurrent and chylous in nature.21,22 Pleural effusions may also be seen in patients with systemic lupus erythematosis (15% to 75%), Wegener’s granulomatosis (10% to 55%), rheumatoid arthritis (2% to 10%), lymphangitic carcinomatosis (30% to 50%), and complicating pulmonary edema.23-29 Diffuse pleural thickening is often associated with collagen vascular disease and asbestos exposure. Noncalcified and calcified pleural plaques are almost exclusively seen with the latter (figure 9).30 The various pleural manifestations of chronic diffuse infiltrative lung disease are summarized in Table 4.
| Pneumothorax |
| Lymphangioleiomyomatosis |
| Langerhans cell histiocytosis |
| End-stage lung disease |
| Effusion |
| Lymphangioleiomyomatosis |
| Rheumatoid arthritis |
| Systemic lupus erythematosis |
| Mixed connective tissue disorders |
| Wegener’s granulomatosis |
| Lymphangitic carcinomatosis |
| Pulmonary edema |
| Thickening |
| Asbestosis |
| Collagen vascular diseases |
Pattern of disease
Five basic patterns of disease may be seen on HRCT scans in the setting of chronic diffuse infiltrative lung disease: 1) linear (reticular); 2) nodular; 3) cystic; 4) ground glass; and 5) consolidation. One should be aware that the predominant pattern may vary depending on the stage of the disease. Additionally, many diseases may demonstrate a “patchy” distribution with normal regions of lung admixed with damaged regions.31,32 Each pattern will be briefly reviewed.
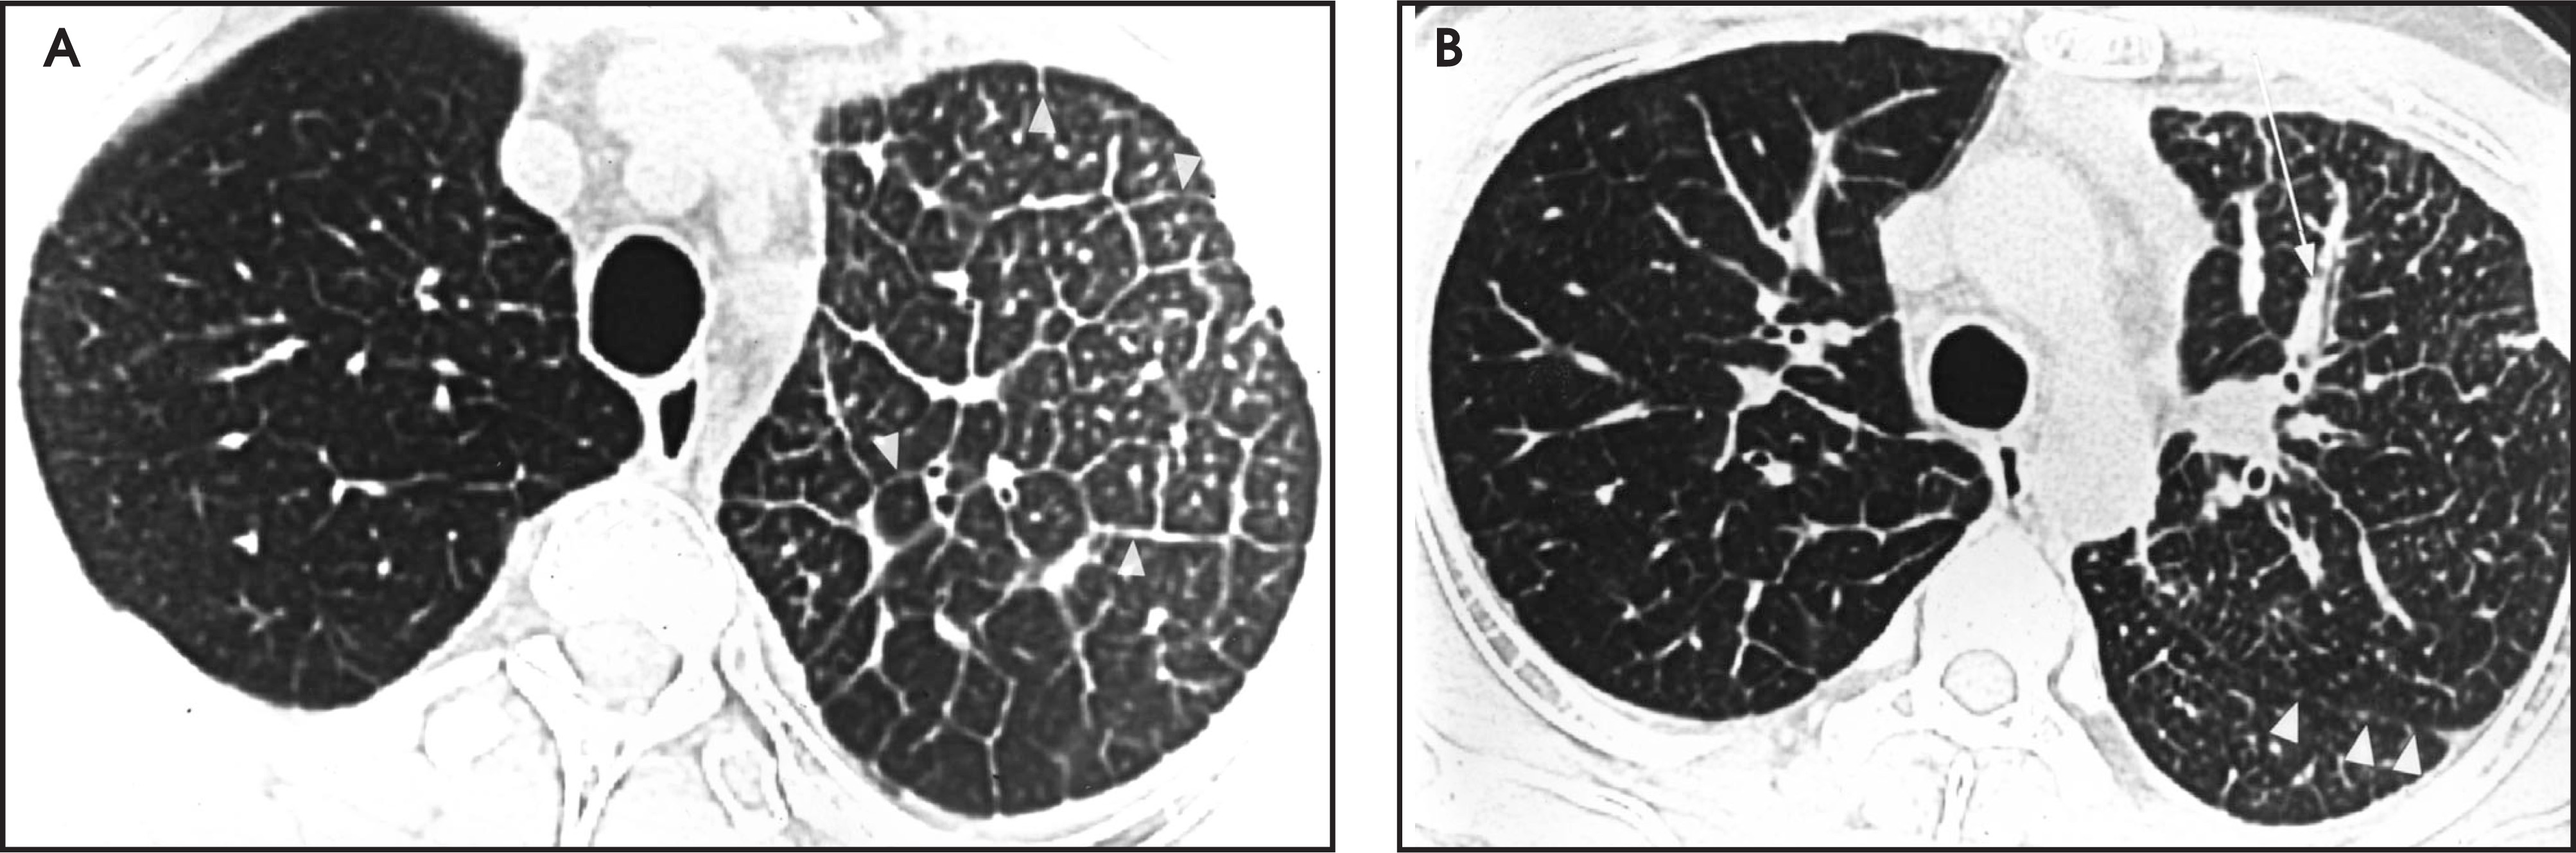
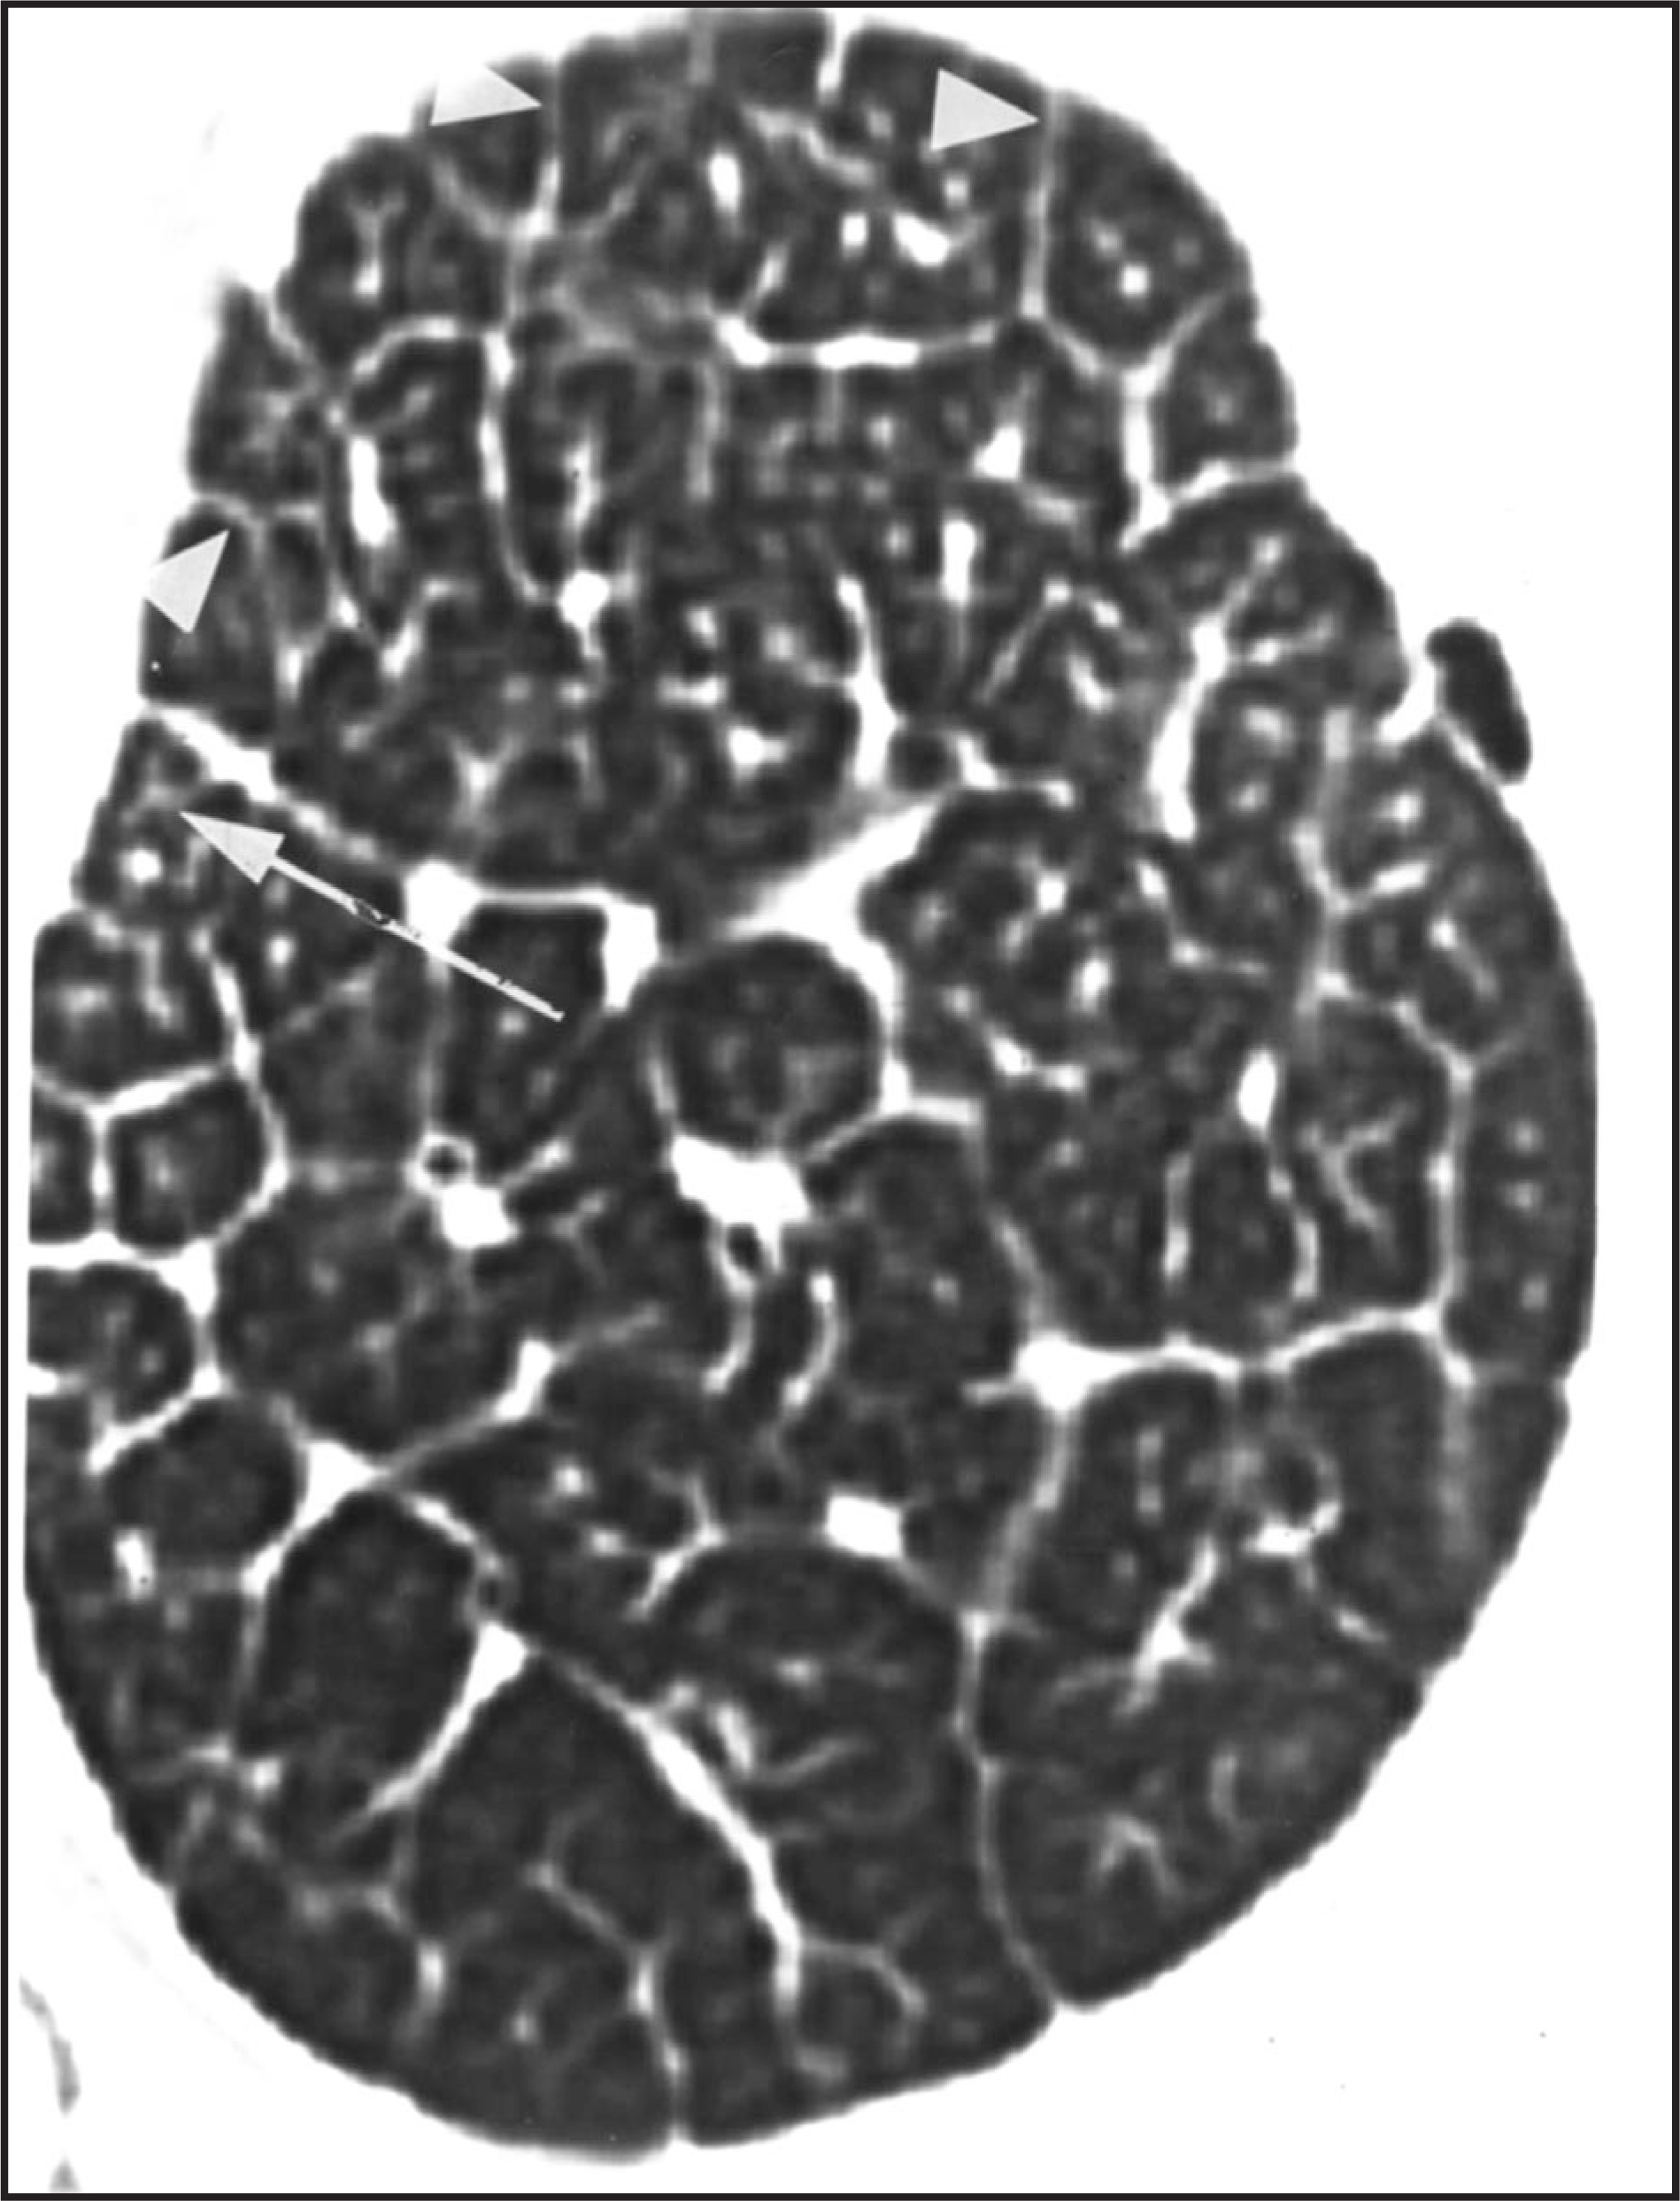
Linear opacities—Irregular linear opacities frequently form a reticular pattern that may be fine or coarse in nature. These opacities result from thickening of the pulmonary interstitium by fluid, cells, or fibrous tissue. Such thickening may involve either the axial or peripheral compartments. Peribronchovascular or axial compartmental thickening may be caused by diseases that affect the bronchus (e.g., asthma, bronchitis, bronchiolitis obliterans, bronchiectasis, cystic fibrosis) or the lymphatics (e.g., hydrostatic edema, sarcoidosis, chronic interstitial pneumonia, pulmonary fibrosis, lymphoma, lymphangitic carcinomatosis). The former will be characterized by thickened, enlarged, or mucusfilled bronchi and the latter by smooth or nodular peribronchovascular bundle thickening. Nodular thickening is more suggestive of sarcoidosis and neoplastic disease. Since lymphatics are present within both the axial and peripheral compartments, such diseases often demonstrate involvement of both (figure 10).8,11,12 Diseases specifically affecting the peripheral compartment may manifest as interlobular or intralobular septal thickening or as subpleural lines. Interlobular septal thickening or septal lines present as 1.0- to 2.0-cm lines perpendicular to the pleural surface, the classic “Kerley B” lines. More centrally, the thickened septa outline the pulmonary lobules, creating polygonal structures 1.0 to 2.0 cm in diameter. Intralobular septal thickening involves the interior of the secondary pulmonary lobule itself. Reticular lines radiate from the central core structures extending to thickened peripheral interlobular septa (figure 11). Curvilinear lines 2 to 3 mm in thickness and <1.0 cm in length paralleling the pleural surface are referred to as subpleural lines and may be the result of dependent atelectasis or asbestosis.31,32
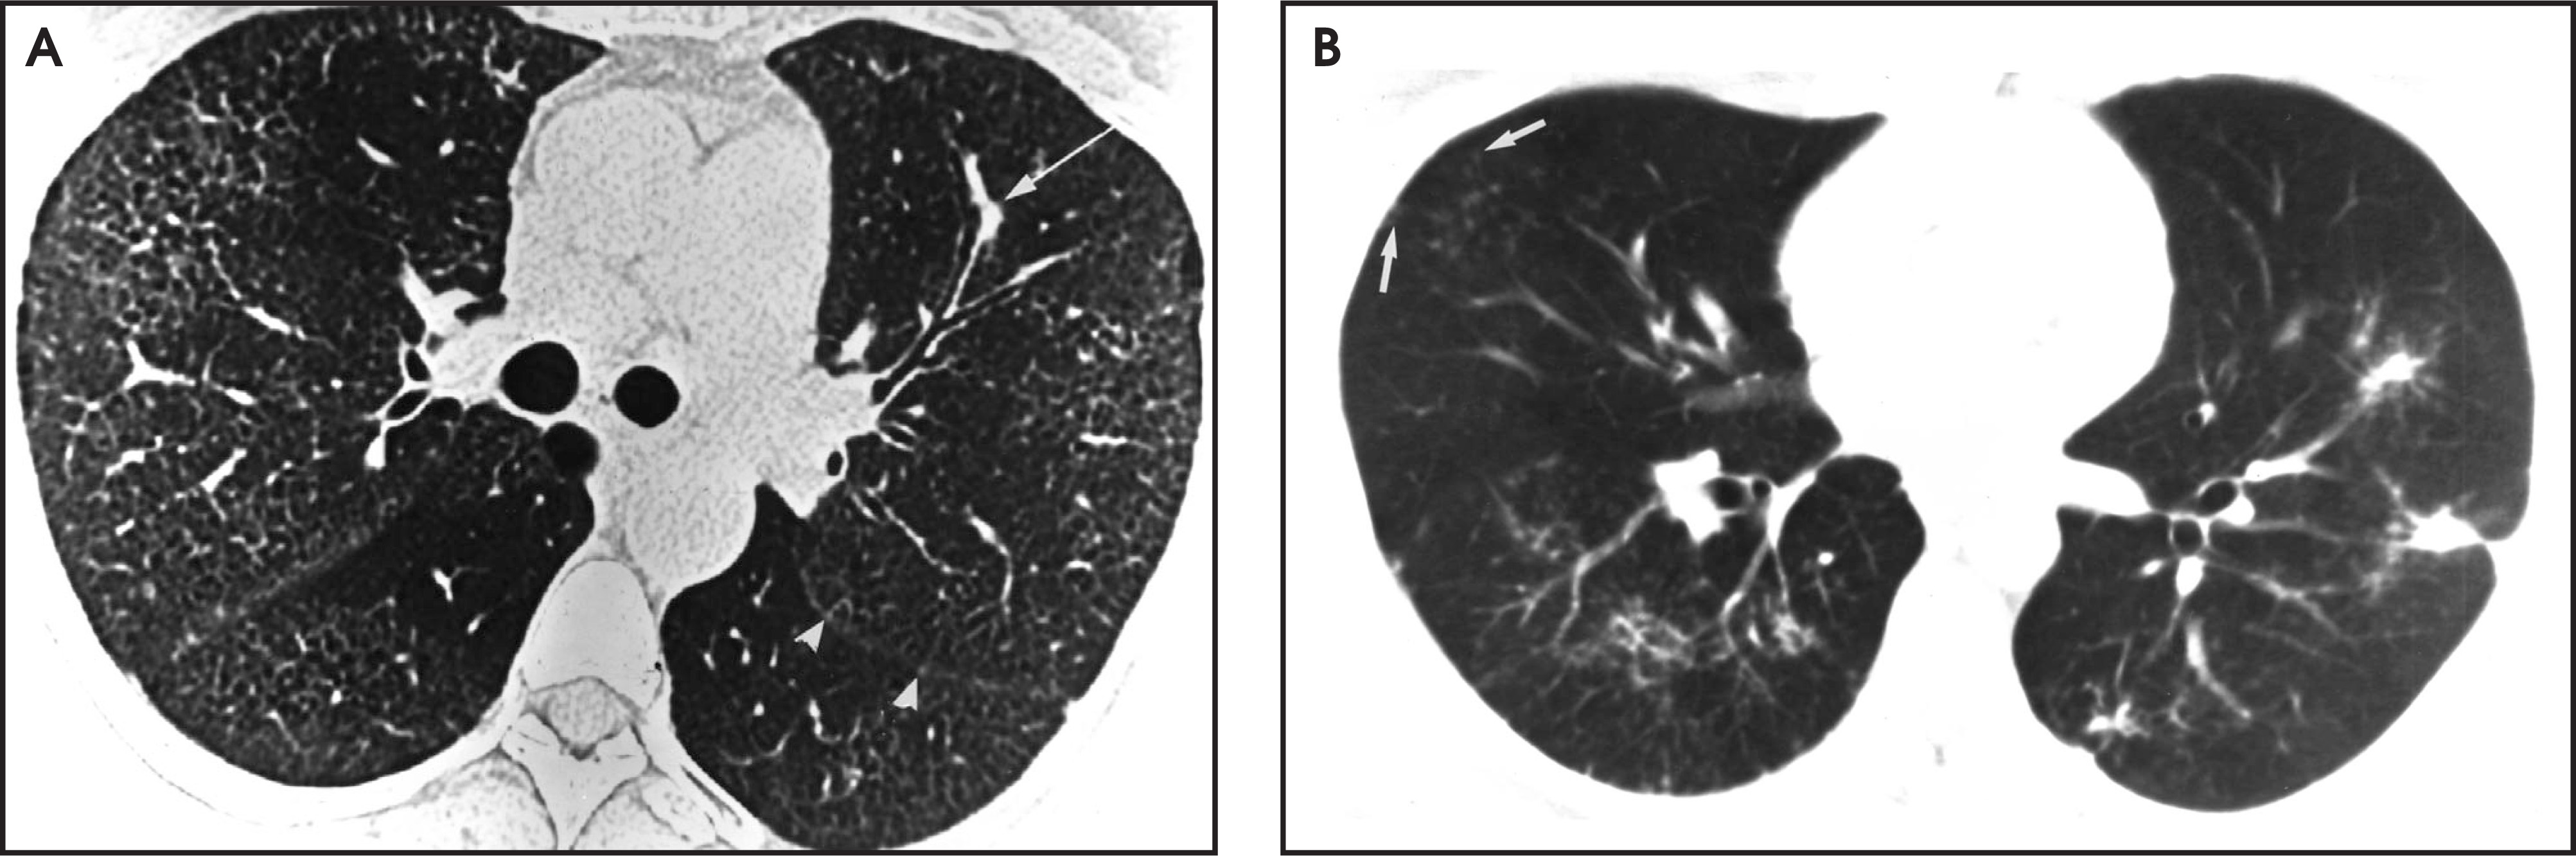
Nodular opacities—Nodular opacities may be of variable size, shape, and morphology. Such opacities may be found in the pulmonary interstitium and/or the acinus. Those located within the interstitium tend to be better defined and may manifest as nodularity along the parahilar peribronchovascular or centrilobular interstitium, interlobular septa, or in a subpleural location adjacent to the fissural surfaces (e.g., sarcoidosis, silicosis) (figure 12). Air-space or acinar nodules are less well-defined, larger, ranging from 6 to 10 mm in diameter, and are often associated with air-space consolidation. These peribronchiolar opacities are often centrilobular and are usually not related to the septa. The subpleural lung is usually spared unless the entire lobule is consolidated. Acinar nodules are frequently seen in patients with lobular pneumonia, endobronchial spread of tuberculosis, bronchiolitis obliterans with organizing pneumonia (BOOP), and edema.8,12,14,33 Those diseases frequently characterized by nodular opacities are summarized in Table 5.
| Sarcoidosis | Langerhans cell histiocytosis |
| Tuberculosis | Coal worker’s pneumoconiosis |
| Lymphoma | Extrinisic allergic alveolitis |
| Silicosis | Idiopathic pulmonary fibrosis |
| Lobular pneumonia | Chronic interstitial pneumonias |
| Bronchoalveolar cell carcinoma | Kaposi’s sarcoma |
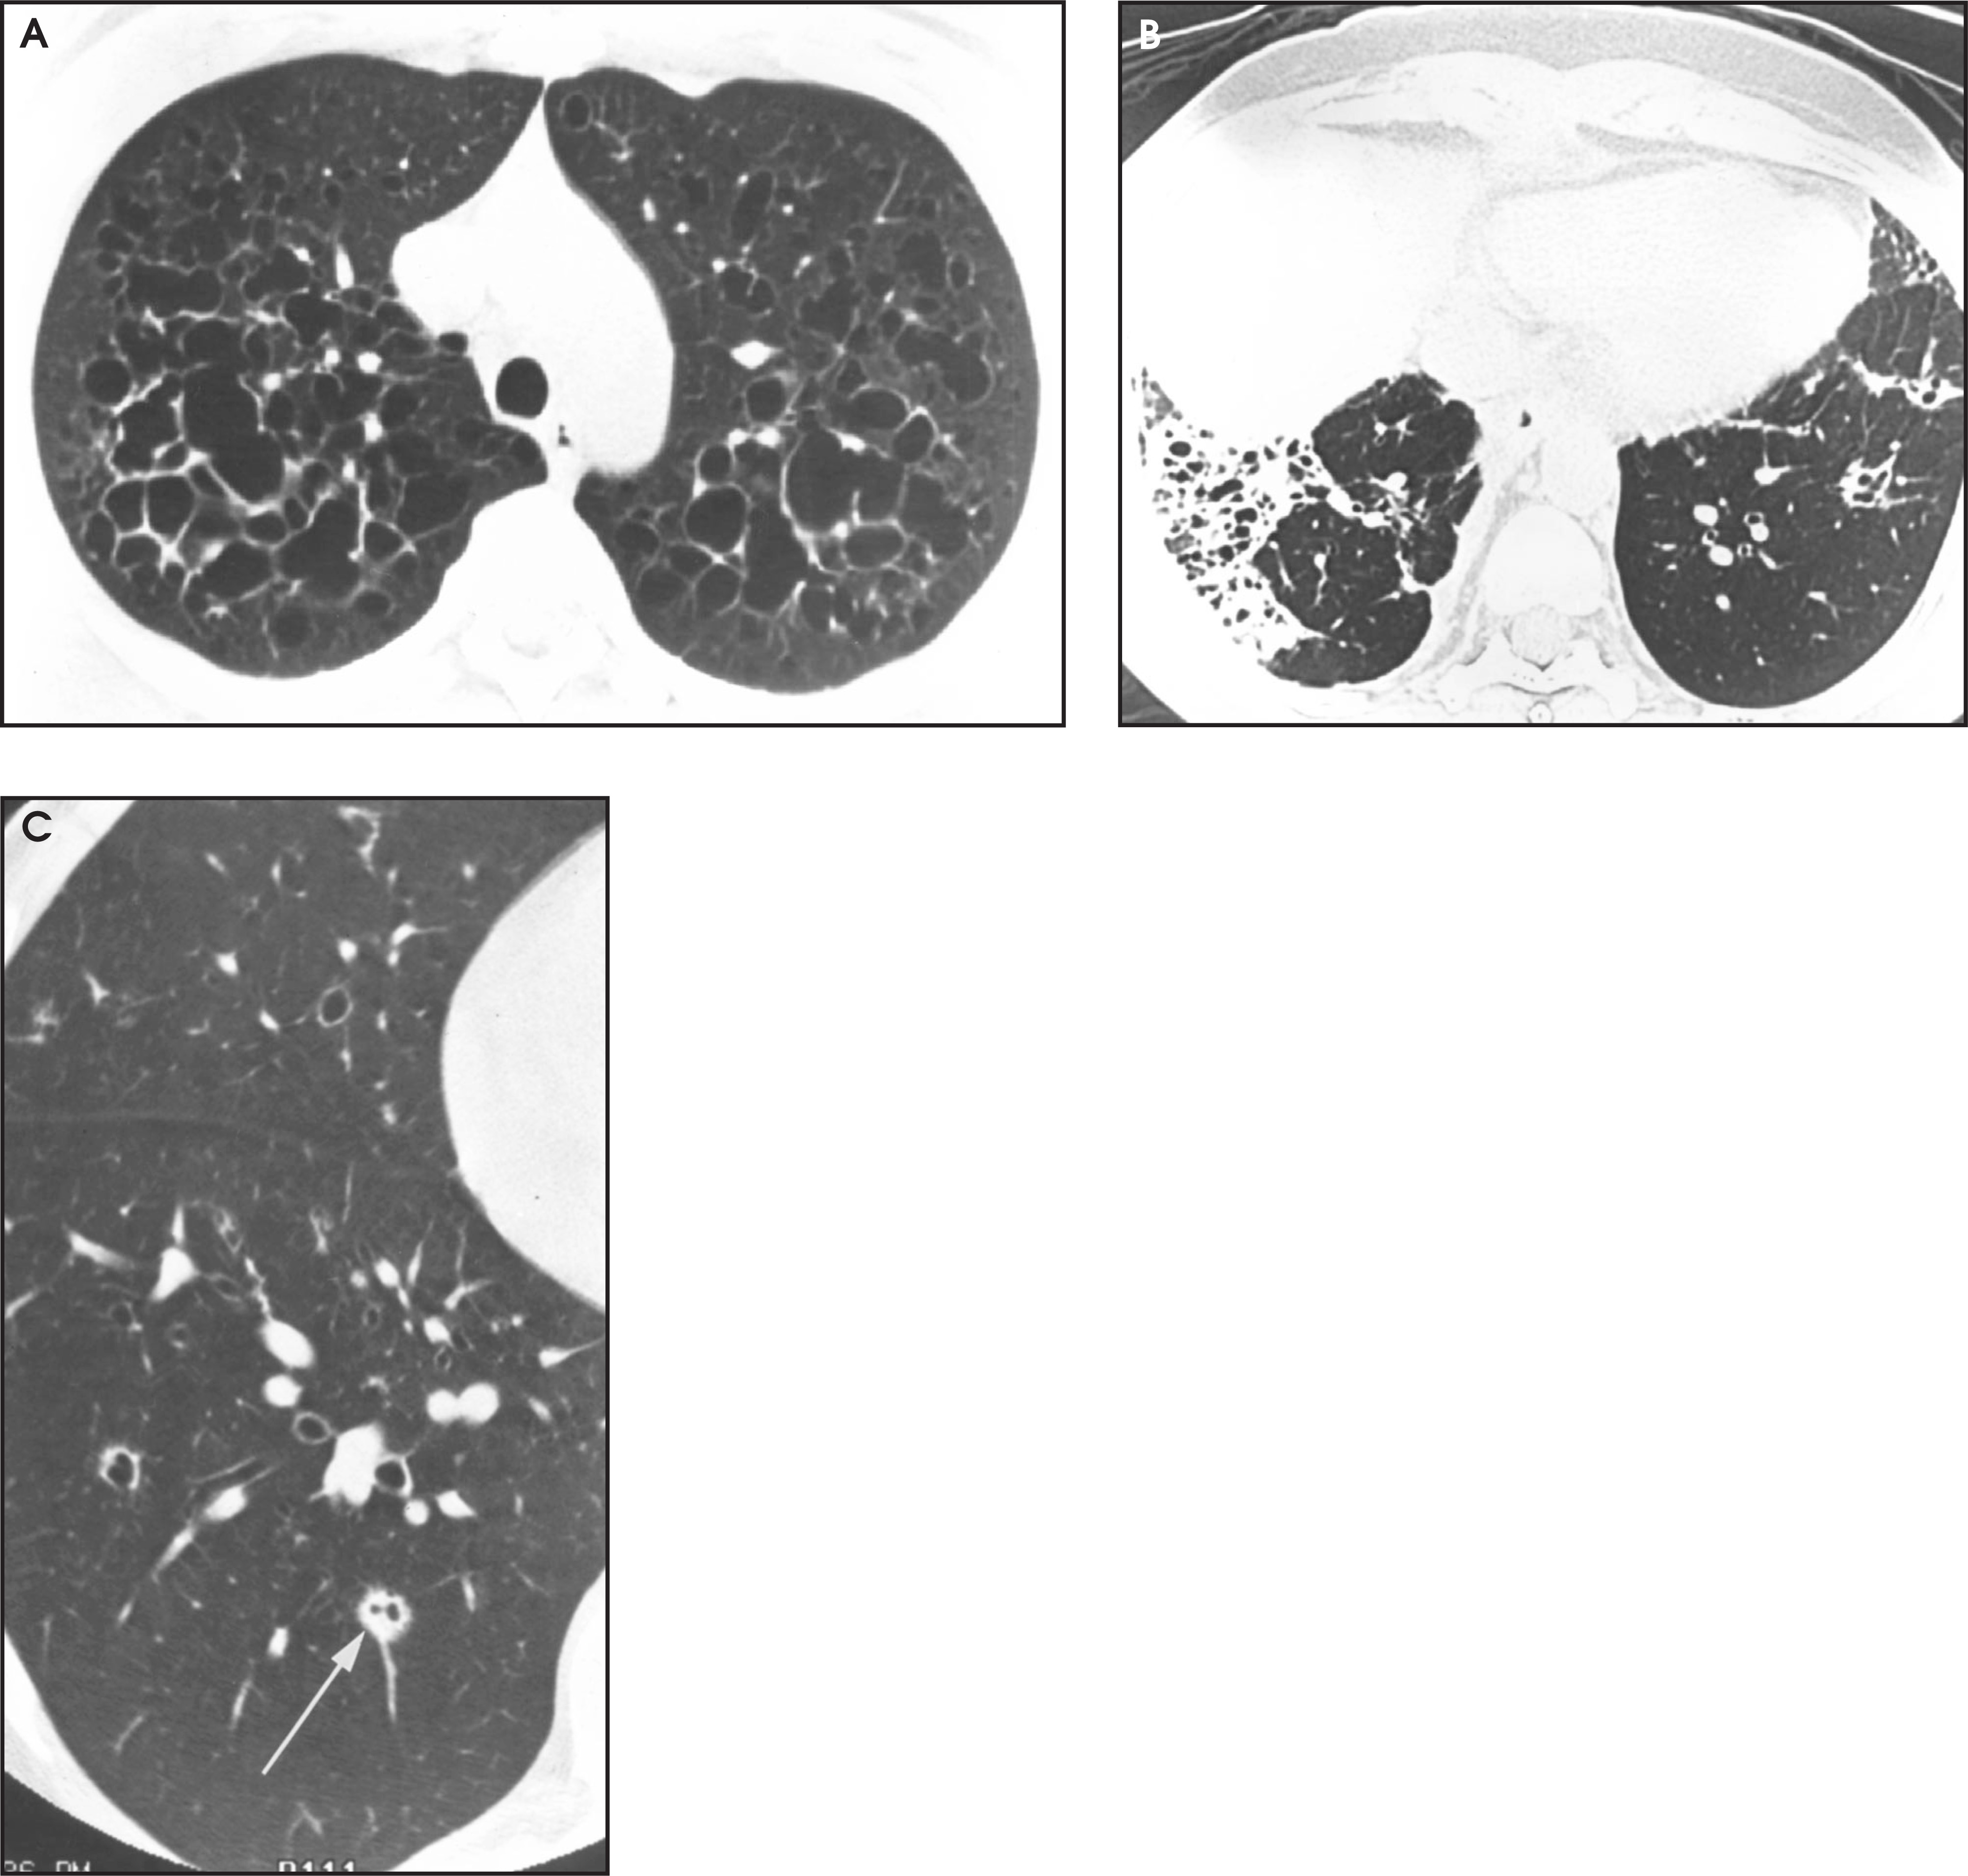
Cystic patterns—Cystic patterns of disease include true parenchymal lung cysts, honeycombing, and cavitary lesions. Lung cysts are sometimes difficult to differentiate from emphysematous bulla and honeycomb lung. Lung cysts tend to be more well-defined and circumscribed than bullae and are often diffusely distributed. Such cysts are often ε1.0 cm in diameter with thin walls <2 mm in thickness. Cysts, such as seen in lymphangioleiomyomatosis and latter stage Langerhans cell histiocytosis, are not associated with fibrosis or architectural distortion. Honeycombing results from the irreversible destruction and dissolution of the alveolar walls. The lesions are peripheral or subpleural in location, are usually ≤ 1.0 cm in diameter, and demonstrate thickened walls. There is associated architectural distortion, fibrosis, and often traction bronchiectasis. However, the pattern itself is nonspecific, representing the final common pathway of most chronic diffuse infiltrative lung diseases. Cavitary lesions may be considered in the spectrum of nodular opacities with thick or irregular walls and may be seen in 10% of patients with early-stage Langerhans cell histiocytosis and up to 50% of patients with Wegener granulomatosis (figure 13).34-37
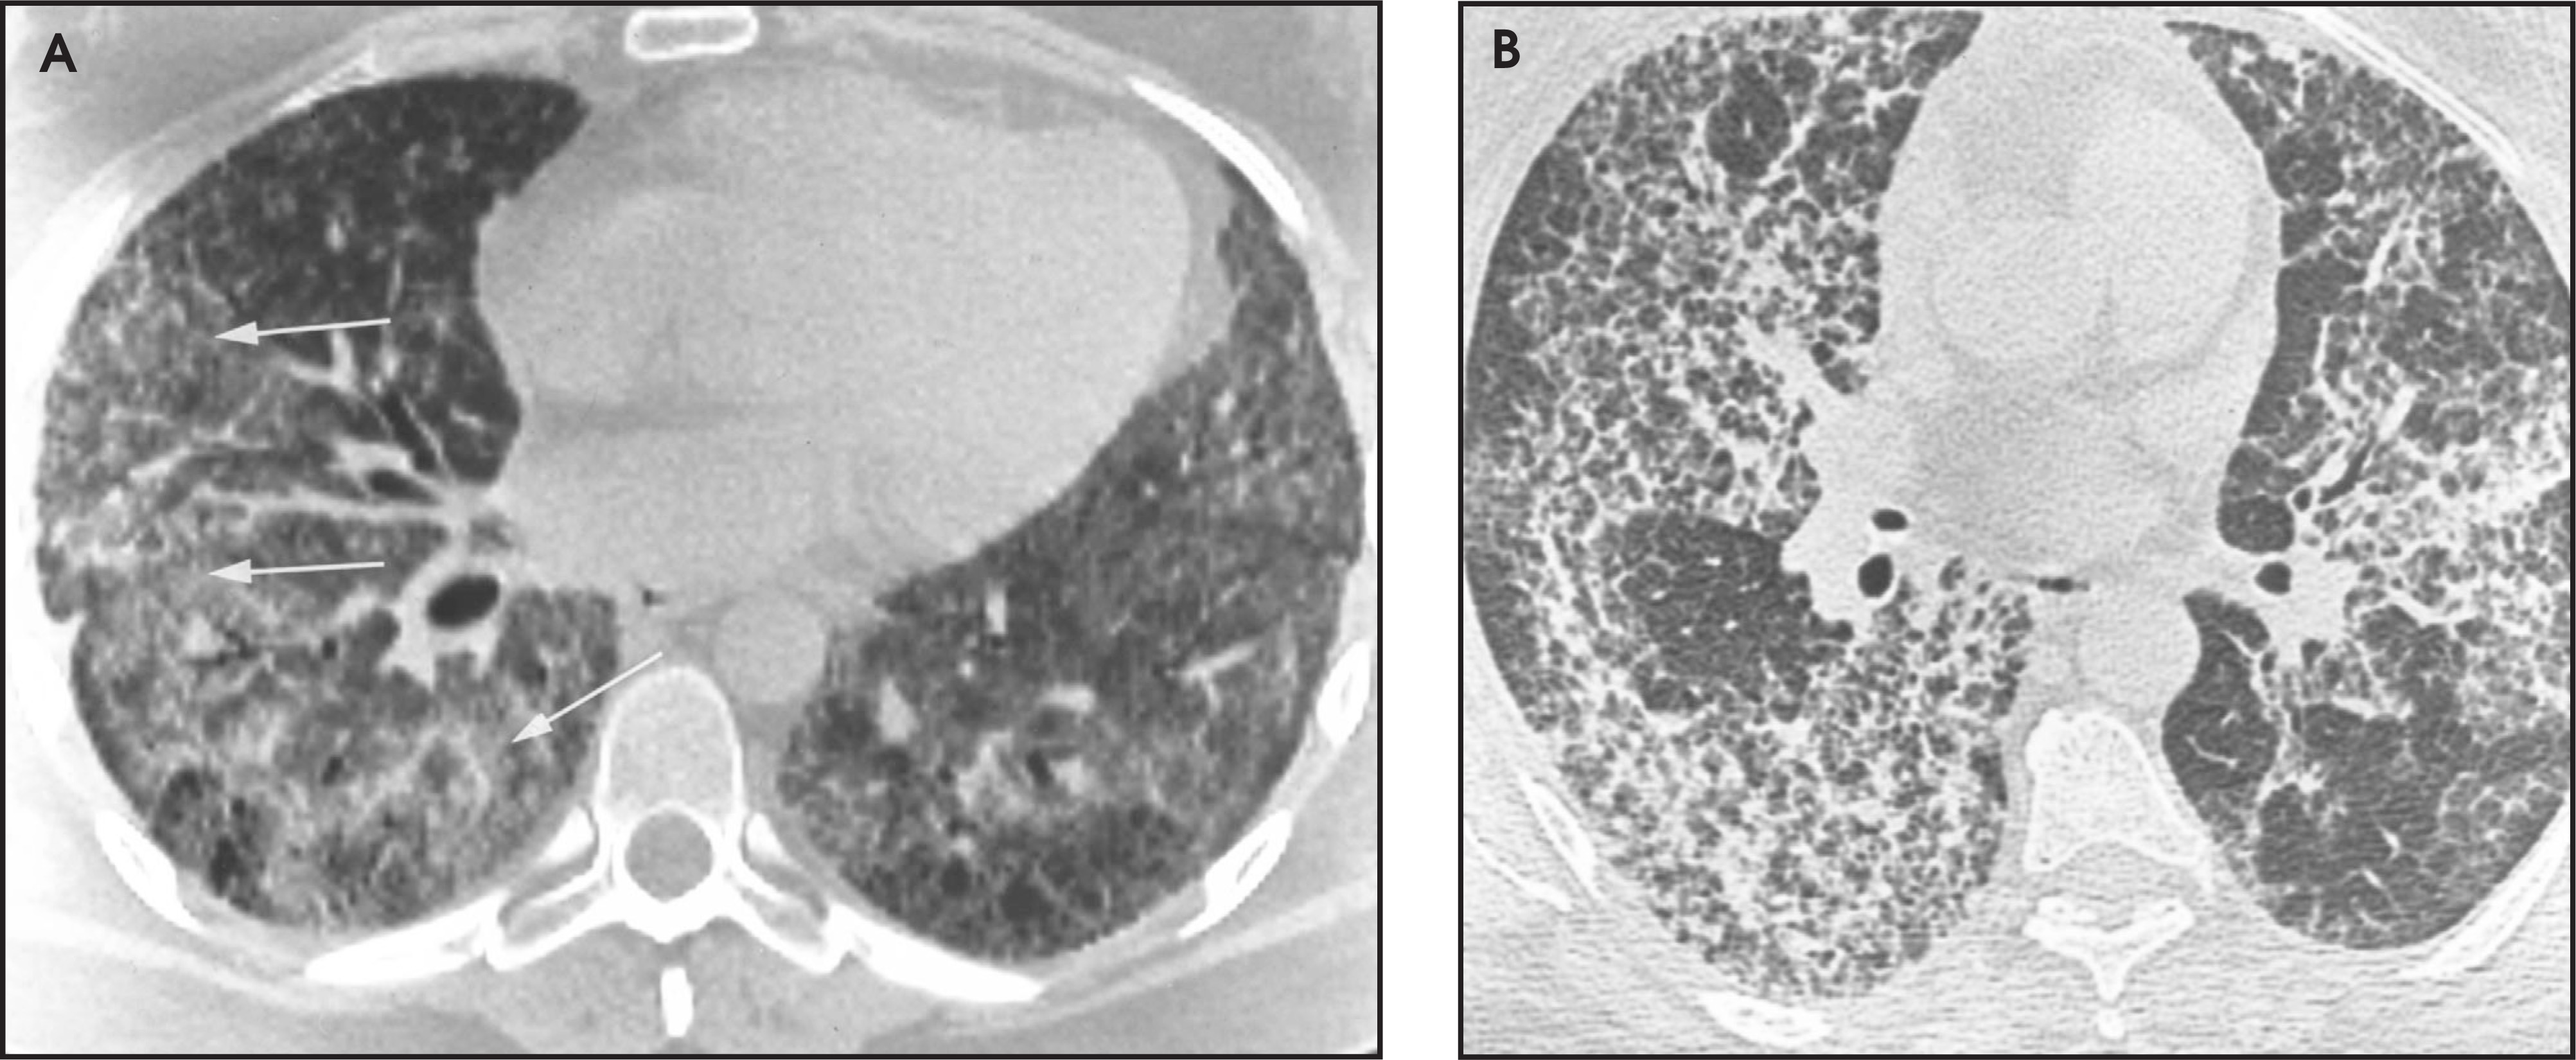
Ground-glass opacities—Groundglass opacities are ill-defined regions of increased attenuation that do not obscure visualization of the underlying vessels or bronchi. Such opacities may occur in isolation, or in association with many of the patterns already addressed. They are frequently geographic in distribution, and may, on occasion, involve large nonsegmental or segmental regions of the lung. Ground-glass opacities result from morphologic abnormalities below the resolution of the CT scan and may be seen in the setting of both alveolar and interstitial diseases, as well as mixed disease processes. Although nonspecific, the presence of such opacities indicate an ongoing, active, potentially treatable and reversible disease process (e.g., desquamative interstitial pneumonia, alveolar proteinosis, subacute extrinsic allergic alveolitis). Therefore, these opacities are often good sites for potential transbronchial and open lung biopsies.38 A variation of the ground-glass pattern may be seen in combination with superimposed septal thickening and is referred to as “crazy paving.” This is characteristic of alveolar phospholipoproteinosis, but may also be seen in other diseases such as exogenous lipoid pneumonias, bacterial pneumonias, adult respiratory distress syndrome, and mucinous bronchoalveolar cell carcinoma (figure 14).39
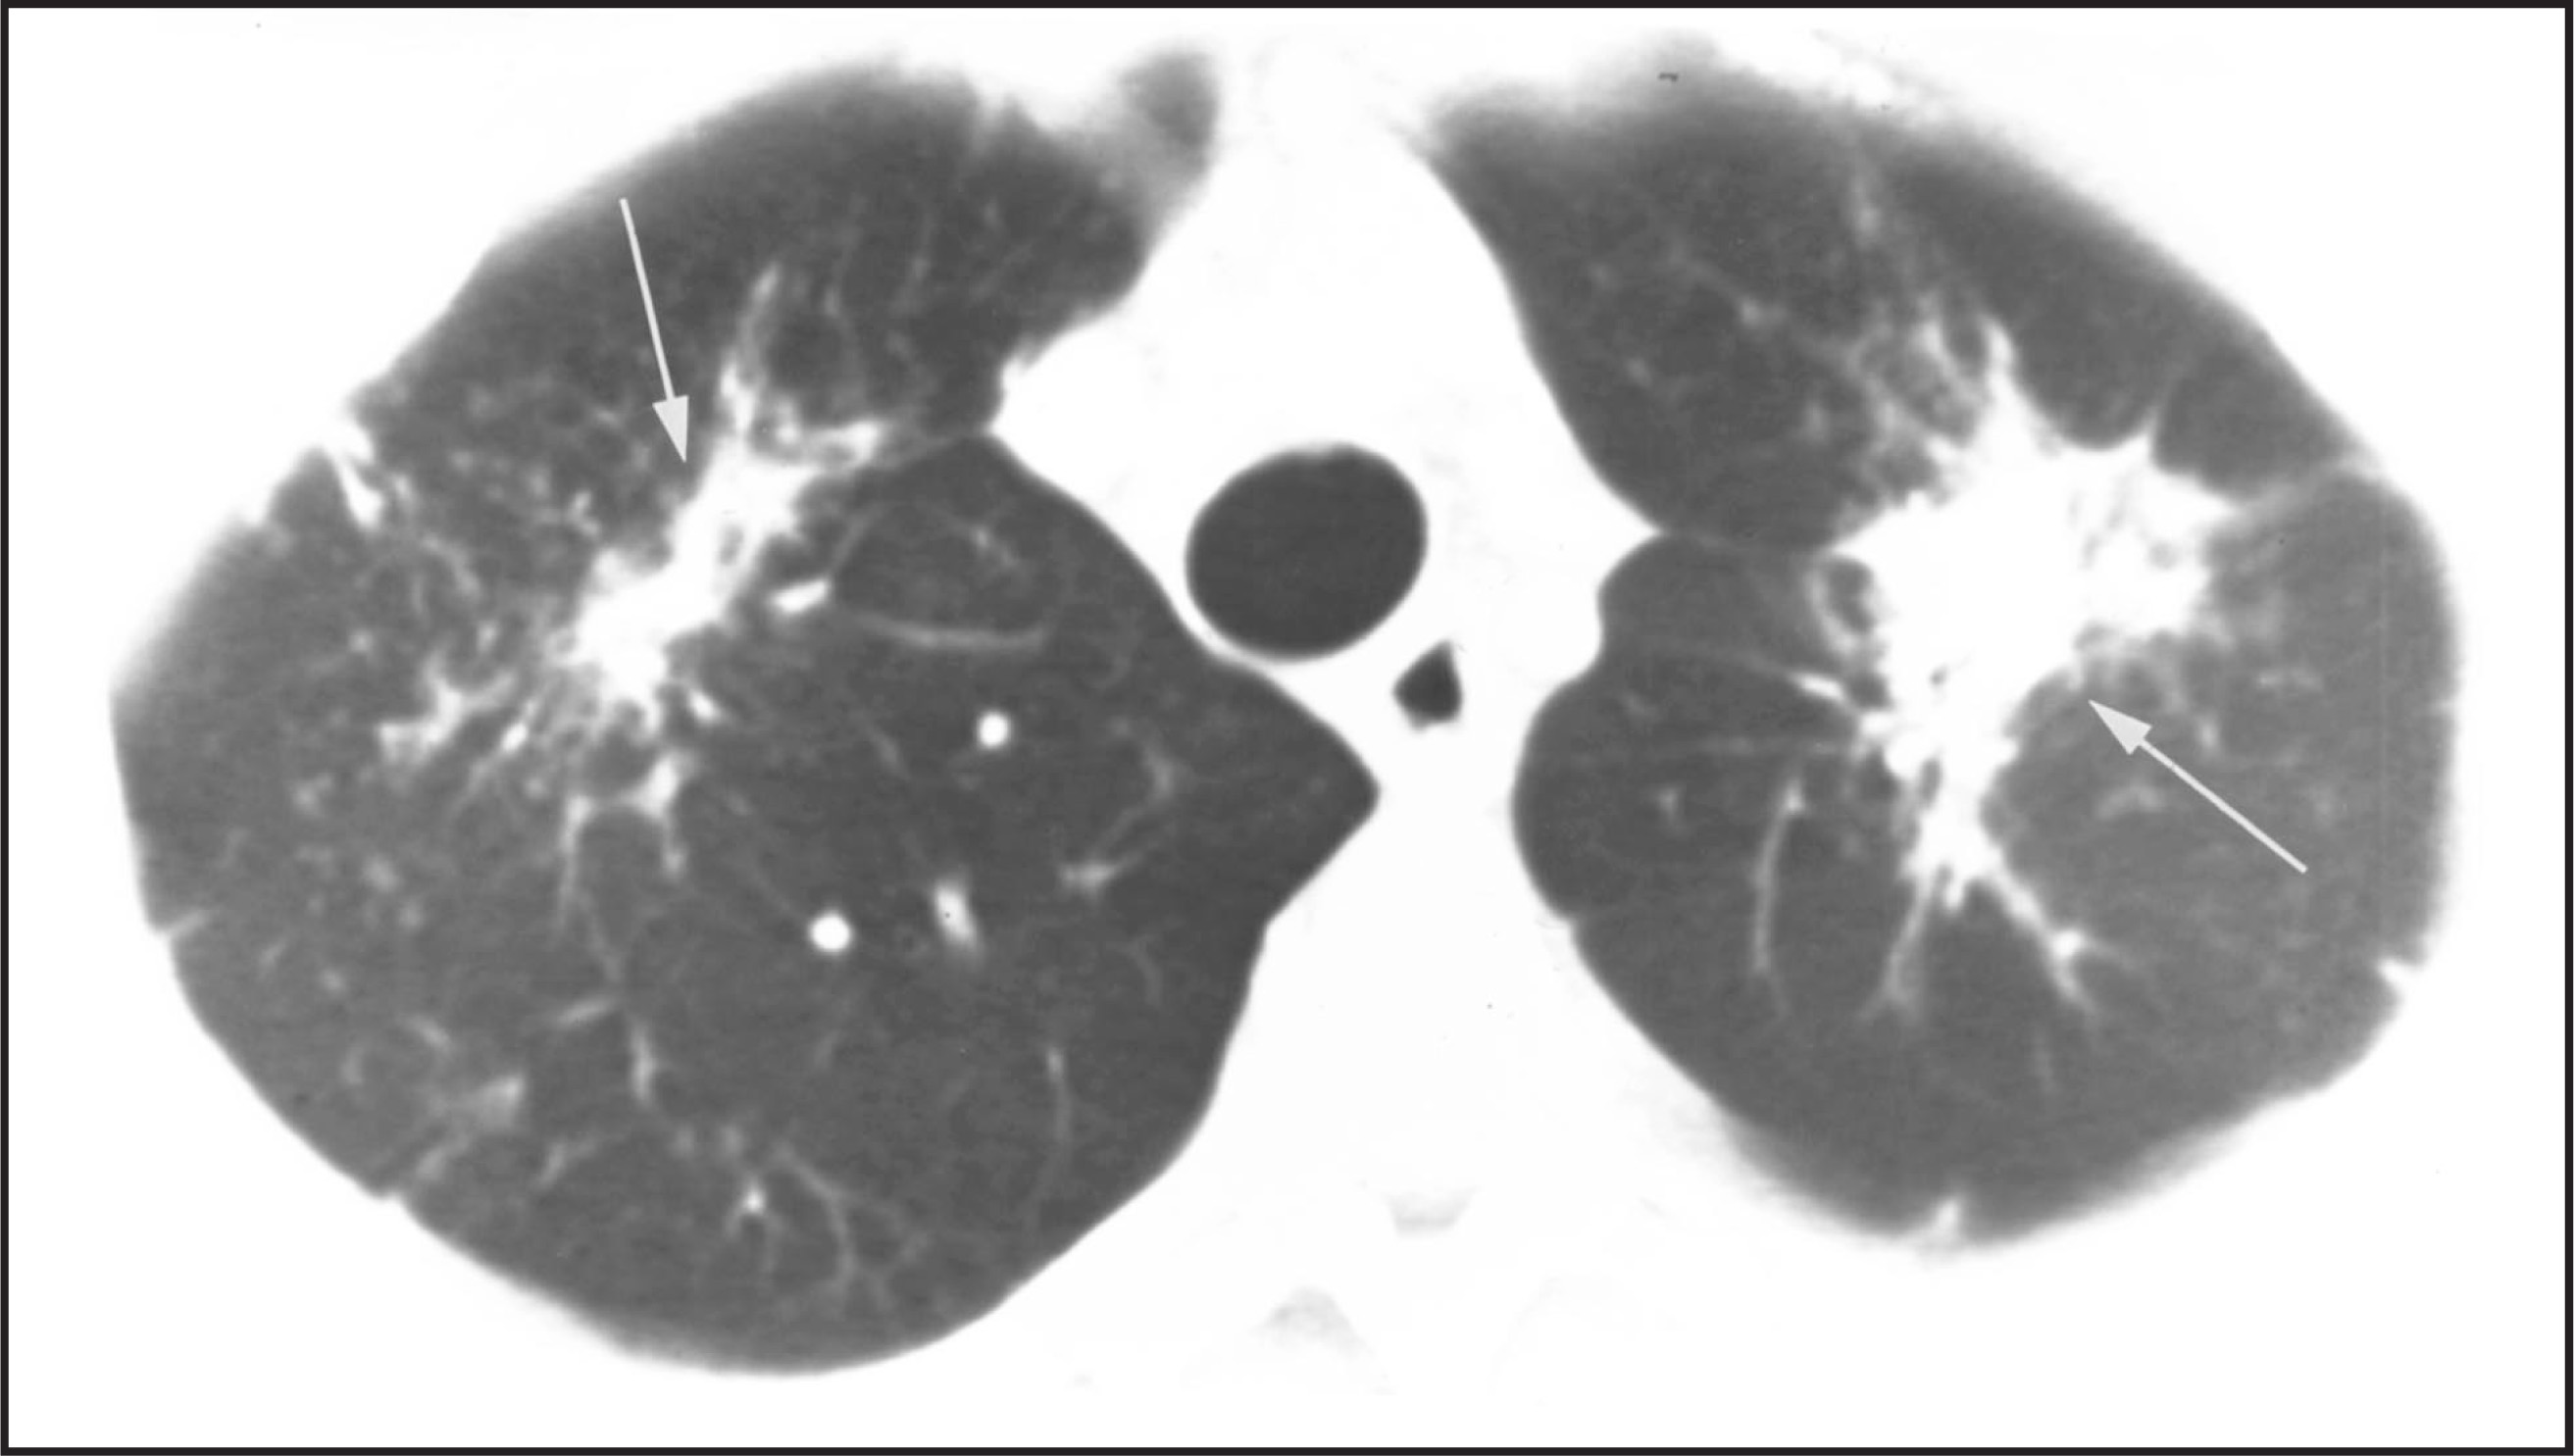
Consolidation—Consolidation, as opposed to ground glass, is characterized by regions of increased attenuation or opacification that do obscure the visualization of underlying bronchial walls and vessels. Air bronchograms are often present. Consolidation represents an air-space replacing process. That is, the air normally present within the alveoli is replaced with another material such as pus, blood, fluid, or cells (e.g., bronchoalveolar cell carcinoma, lymphoma, eosinophilic pneumonia, BOOP) (figure 15).38
Conclusion
Chronic diffuse infiltrative lung diseases are not infrequent causes of progressive dyspnea and debilitation. A thorough history and physical examination, appropriate laboratory correlation, and conventional chest radiograph are often all that is required to establish a diagnosis. In more complicated or perplexing cases, HRCT proves quite useful in the detection and diagnosis of such disease. The identification of specific patterns and distribution of disease aids the radiologist in formulating and narrowing an otherwise quite broad differential diagnosis, guiding potential sites for lung biopsy and following the response to various therapies. AR
Acknowledgement
The author would like to thank Virginia Vaughn and Alison Russell for their assistance in the preparation of the medical illustrations and figures used in this manuscript.
References
- Crystal R, Gadek J, Ferrans V. Interstitial lung disease: Current concepts of pathogenesis, staging and therapy. Am J Med.. 1981;70:542-568.
- Fulmer J, Crystal R. Interstitial lung disease.. Curr Pulmonol.. 1979;1:1-65.
- Weibel E. Looking into the lung: What can it tell us?. AJR Am Roentgenol.. 1979;133:1021-1031.
- Weibel E, Bachofen H, Crystal R, West J. The Lung. 1991;1:787-794.
- Weibel E, Crystal R, Crystal R, West J. The Lung. 1991;1:369-380.
- Mayo J, Webb W, Gould R. High-resolution CT of the lungs: An optimal approach. Radiology.. 1987;163:507-510.
- Murata K, Khan A, Rojas K, Herman P. Optimization of computed tomography technique to demonstrate the fine structure of the lung. Invest Radiol.. 1988;23:170-175.
- Webb W. High resolution CT of lung parenchyma. Radiol Clin North Am.. 1989;27:1085-1097.
- Heitzman E, Markarian B, Berger I, Dailey E. The secondary pulmonary lobule: A practical concept for interpretation of chest radiographs. Radiology.. 1969;93:507-519.
- Heitzman E. The Lung. 1984:546.
- Bergin C, Roggli V, Coblentz C, Chiles C. The secondary pulmonary lobule; Normal and abnormal CT appearances. AJR Am Roentgenol.. 1988;15:21-25.
- Murata K, Khan A, Herman P. Pulmonary parenchymal disease: Evaluation with high-resolution CT. Radiology.. 1989;170:629-635.
- Webb W, Stein M, Finkbeiner W. Normal and diseased isolated lungs: High-resolution CT. Radiology.. 1988;166:81-87.
- Murata K, Itoh H, Todo G. Centrilobular lesions of the lung: Demonstration by high-resolution CT and pathologic correlation. Radiology.. 1987;161:641-645.
- Gurney J, Schroeder B. Upper lobe lung disease: Physiologic correlates. Radiology.. 1988;167:359-366.
- Bergin C, Müller N. CT of interstitial lung disease: A diagnostic approach. AJR Am Roentgenol.. 1987;148:8-15.
- Niimi H, Kang E, Kwong J, Müller N. CT of chronic infiltrative lung disease: Prevalence of mediastinal lymphadenopathy. J Comput Assist Tomogr.. 1996;20:305.
- Bergin C, Castellino R. Mediastinal lymph node enlargement on CT scans in patients with usual interstitial pneumonitis. AJR Am J Roentgenol.. 1990;154:251.
- Lacronique J, Roth C, Battesti J. Chest radiological features of pulmonary histiocytosis X: A report based on 50 adult cases. Thorax.. 1982;37:104-109.
- Friedman P, Liebow A, Sokoloff J. Eosinophilic granuloma of the lung: Clinical aspects of primary pulmonary histiocytosis in the adult. Medicine.. 1981;60:385-396.
- Müller N, Chiles C, Kullnig P. Pulmonary lymphangiomyomatosis: Correlation of CT with radiographic and functional findings. Radiology.. 1990;175:335-339.
- Kitaichi M, Nishimura K, Itoh H. Pulmonary lymphangioleiomyomatosis: A report of 46 patients including a clinicopathologic study of prognostic factors. Am J Respir Crit Med.. 1995;151:527-533.
- Fishman A. Pulmonary Diseases and Disorders. 1988:2149.
- Elborn J, Conn P, Roberts S. Refractory massive pleural effusion in systemic lupus erythematosis treated by pleurectomy. Ann Rheum Dis.. 1987;46:77-80.
- Cordier J, Valeyre D, Guillevin L. Pulmonary Wegener’s granulomatosis: A clinical and imaging study of 77 cases. Chest.. 1990;97:906-912.
- Maskell G, Lockwood C, Flower C. Computed tomography of the lung in Wegener’s granulomatosis. Clin Radiol.. 1993;48:377-380.
- Janower M, Blennerhassett J. Lymphangitic spread of metastatic cancer to the lung: A radiologic-pathologic classification. Radiology.. 1971;101:267-273.
- Munk P, Müller N, Miller R, Ostrow D. Pulmonary lymphangitic carcinomatosis: CT and pathologic findings. Radiology.. 1988;166:705-709.
- Fraser R, Müller N, Colman N, Paré P. Diagnosis of Diseases of the Chest. 1999:1959-1972.
- Fraser R, Müller N, Colman N, Paré P. Diagnosis of Diseases of the Chest. 1999:2796-2801.
- Webb W, Müller N, Naidich D. Standardized terms for high-resolution computed tomography of the lung: A proposed glossary. J Thoracic Imaging.. 1993;8:167-175.
- Corcoran H, Renner W, Milstein M. Review of high-resolution CT of the lung. Radiographics.. 1992;12:917-939.
- Müller N, Kullnig P, Miller R. CT findings of pulmonary sarcoidosis: Analysis of 25 patients. AJR Am J Roentgenol.. 1989;152:1179-1182.
- Nadich D. High-resolution computed tomography of cystic lung disease. Semin Roentgenol.. 1991;26:151-174.
- Aberle D, Hansell D, Brown K, Tashkin D. Lymphangiomyomatosis: CT, chest radiographic, and functional correlations. Radiology.. 1990;176:381-387.
- Moore A, Godwin J, Müller N. Pulmonary histiocytosis X: Comparison of radiographic and CT findings. Radiology.. 1989;172:249-254.
- Fraser R, Müller N, Colman N, Paré P. Diagnosis of Diseases of the Chest. 1999:683-685.
- Nadich D, Zerhouni E, Hutchins G. Computed tomography of the pulmonary parenchyma. I. Distal air-space disease. J Thorac Imaging.. 1985;1:39-53.
- Johkoh T, Itoh H, Müller N. Crazypaving appearance at thin-section CT: Spectrum of disease and pathologic findings. Radiology.. 1999;211:155-160.
Citation
. Chronic diffuse infiltrative lung disease: Differential diagnosis and high-resolution CT imaging. Applied Radiology. 2001;30(11):28-38. doi:10.37549/AR1052.