Contrast usage for liver imaging in the era of MSCT, MDCT: Part II
Applied Radiology — Vol. 32 , Issue 6 , pp. 24 -30
DOI: 10.37549/AR1194
Published: June 1, 2003
Categories
[Note: Part I of this article was published in the May 2003 issue of Applied Radiology: Silverman PM, Szklaruk J, Tamm E. Contrast usage for liver imaging in the era of multislice (MSCT), multidetector (MDCT) CT: Part I. Appl Radiol. 2003;32(5):30-38.]
In the early 1990s, dual or split detector systems became available allowing the acquisition of 2 slices during a single gantry rotation. In 1998, the first multislice systems were introduced with 4 data channels providing a quantum leap in CT technology.1-5 These scanners have been referred to by various names, including multidetector, multidetector row, and, most appropriately, multislice CT (MSCT). In the past couple of years, 8-slice, 16-slice, and even 32-slice detector systems have been developed, and manufacturers are now testing the incorporation of flat-panel detectors in scanners in an attempt to extend this technology to near-instantaneous data acquisition with volumetric data acquisition.
Scanners already allow the acquisition of multislice data sets with sub-second scan times.6 These advances allow the acquisition of thinner slices, shorter scanning times, and greater volumetric coverage in the z-axis (Figure 1). Depending on the specific clinical application, relative trade-offs between speed and collimation are tailored to create optimal protocols for multislice CT.2,4 The development of MSCT has also allowed for near-isotropic and, in the past year, isotropic voxels that can provide the ability to image in multiple planes without loss of resolution. Three-dimensional (3D) imaging is not only practical but results in extremely high-quality images devoid of previous stair-step artifacts. Reconstructions from very thinly collimated images provide exquisite depiction of anatomy when coupled with optimized timing of scanning with contrast enhancement usually using bolus-tracking approaches. Three-dimensional images readily performed in the arterial and venous phases are valuable for staging tumors, as well as for the evaluation for vascular anomalies and vascular disease as part of a detailed preoperative assessment. Such imaging is also of great value in planning X-ray therapy.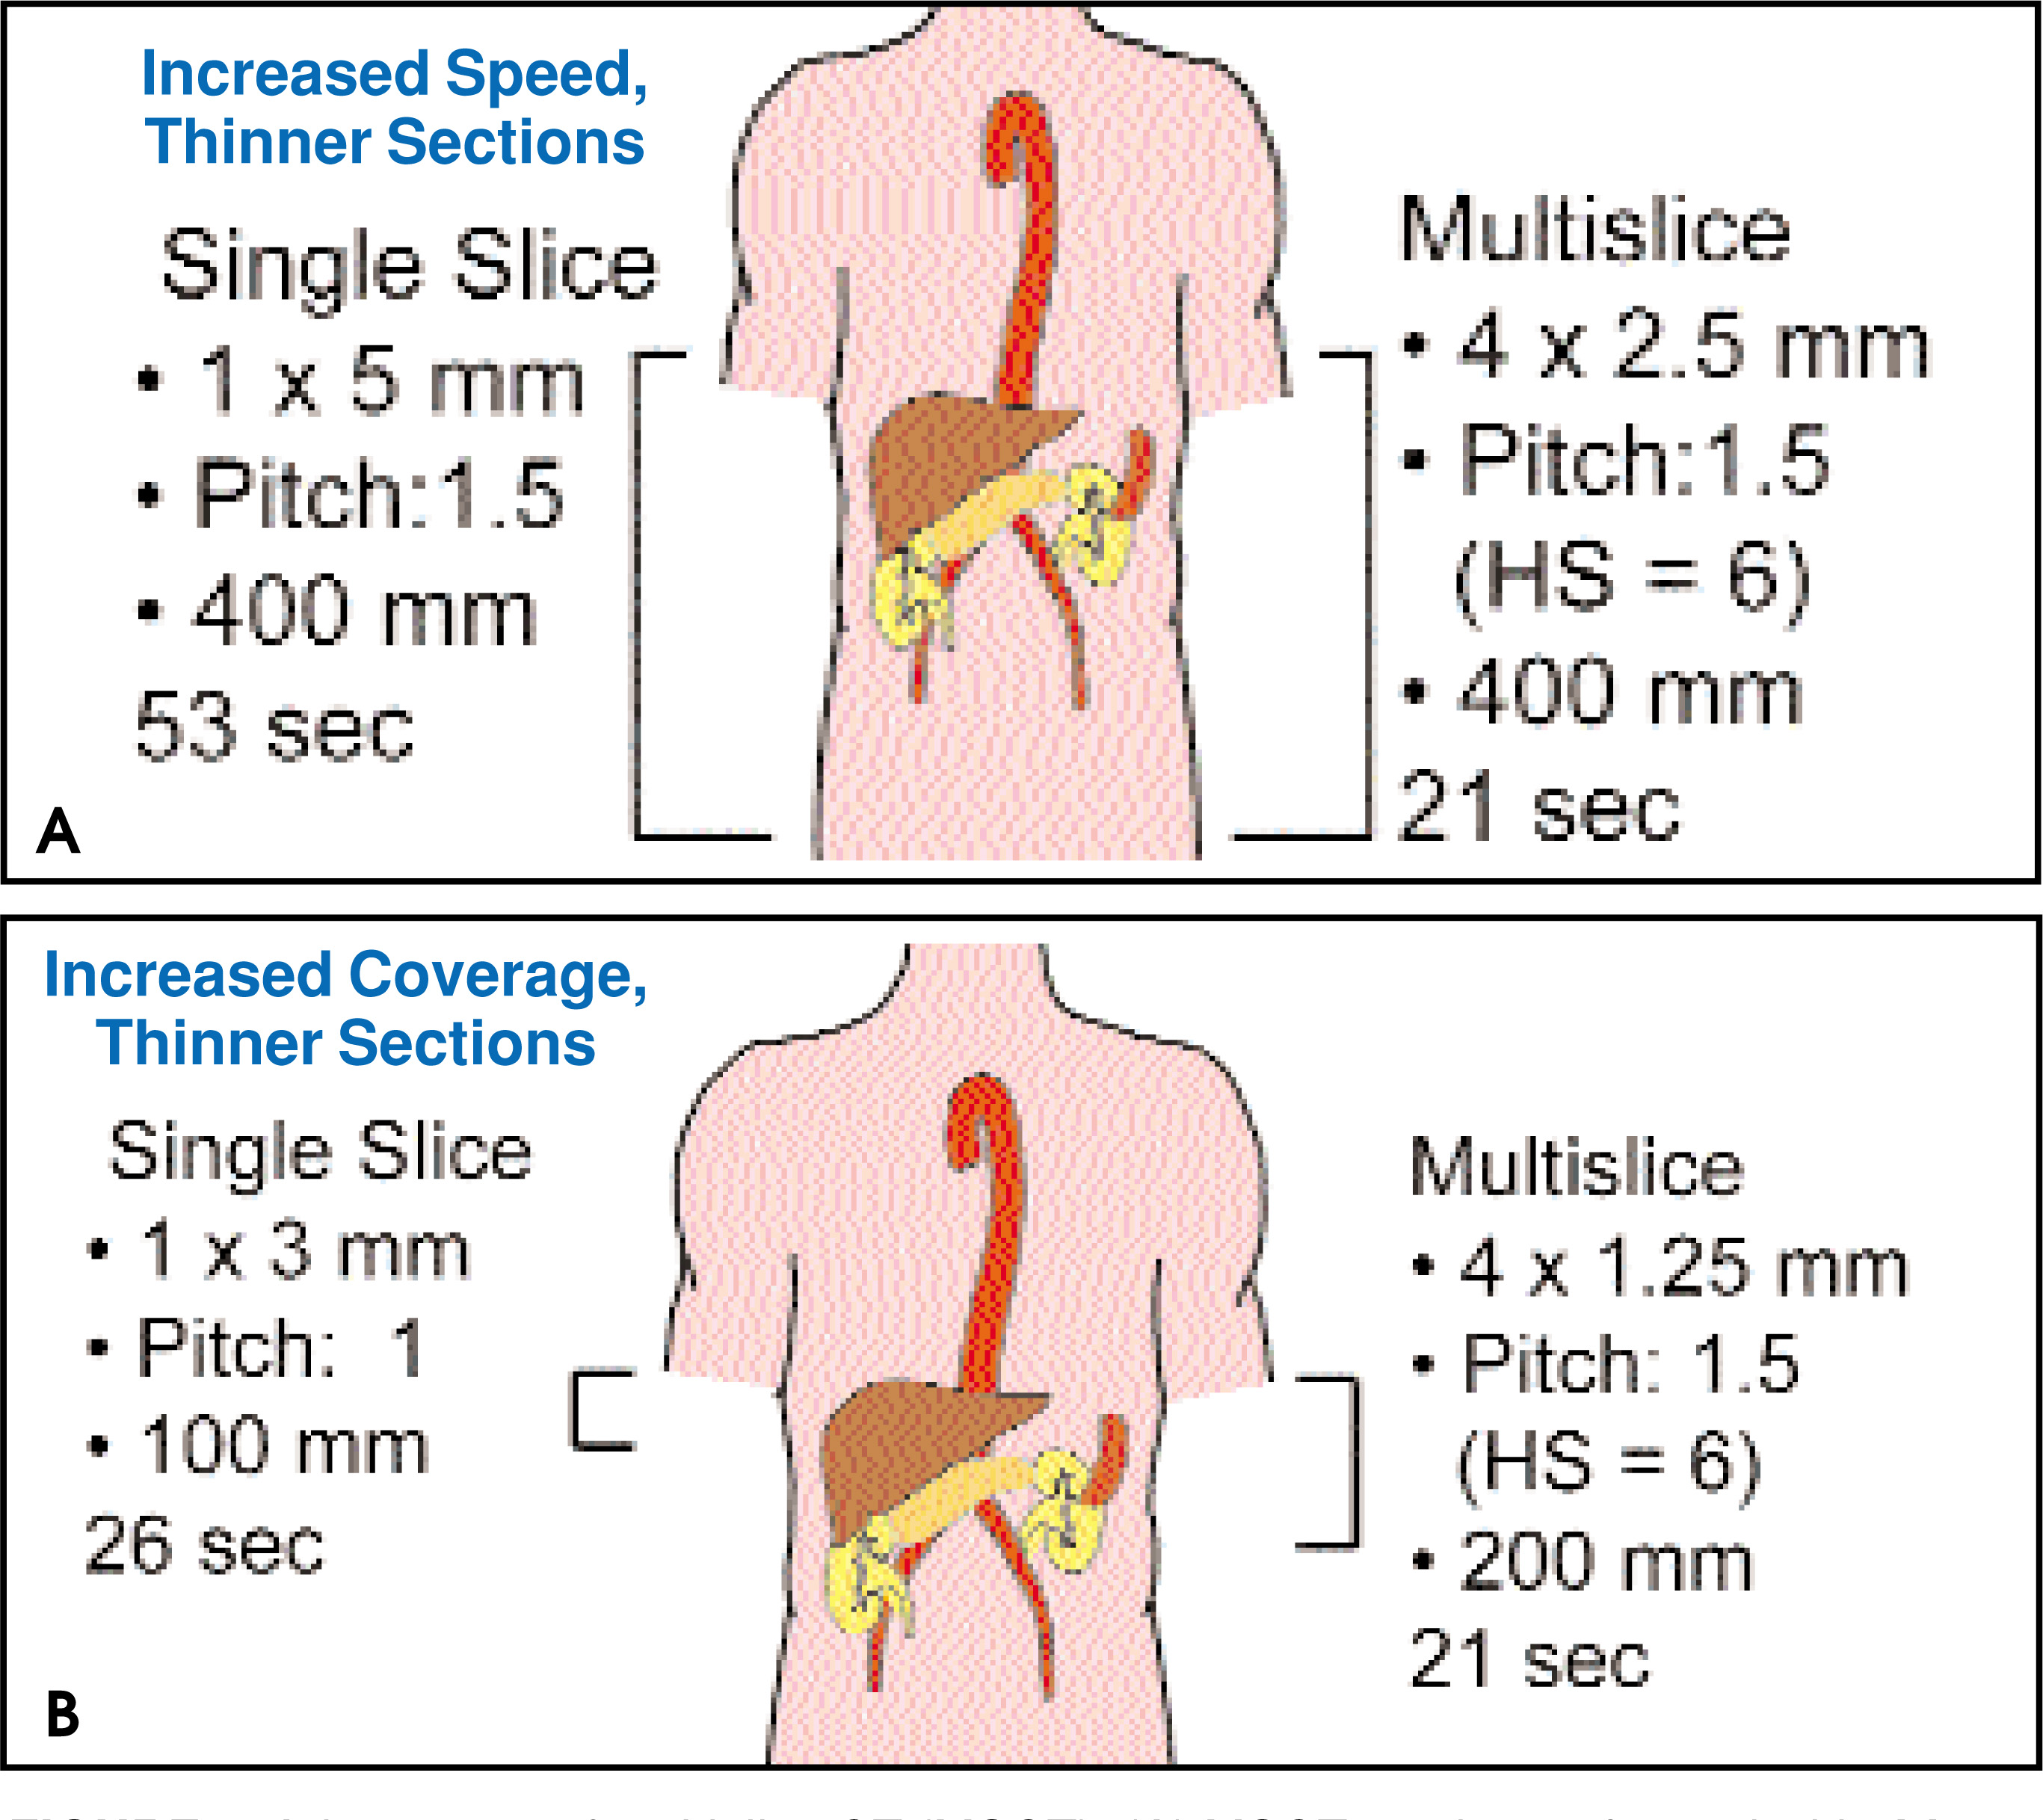
Contrast dynamics
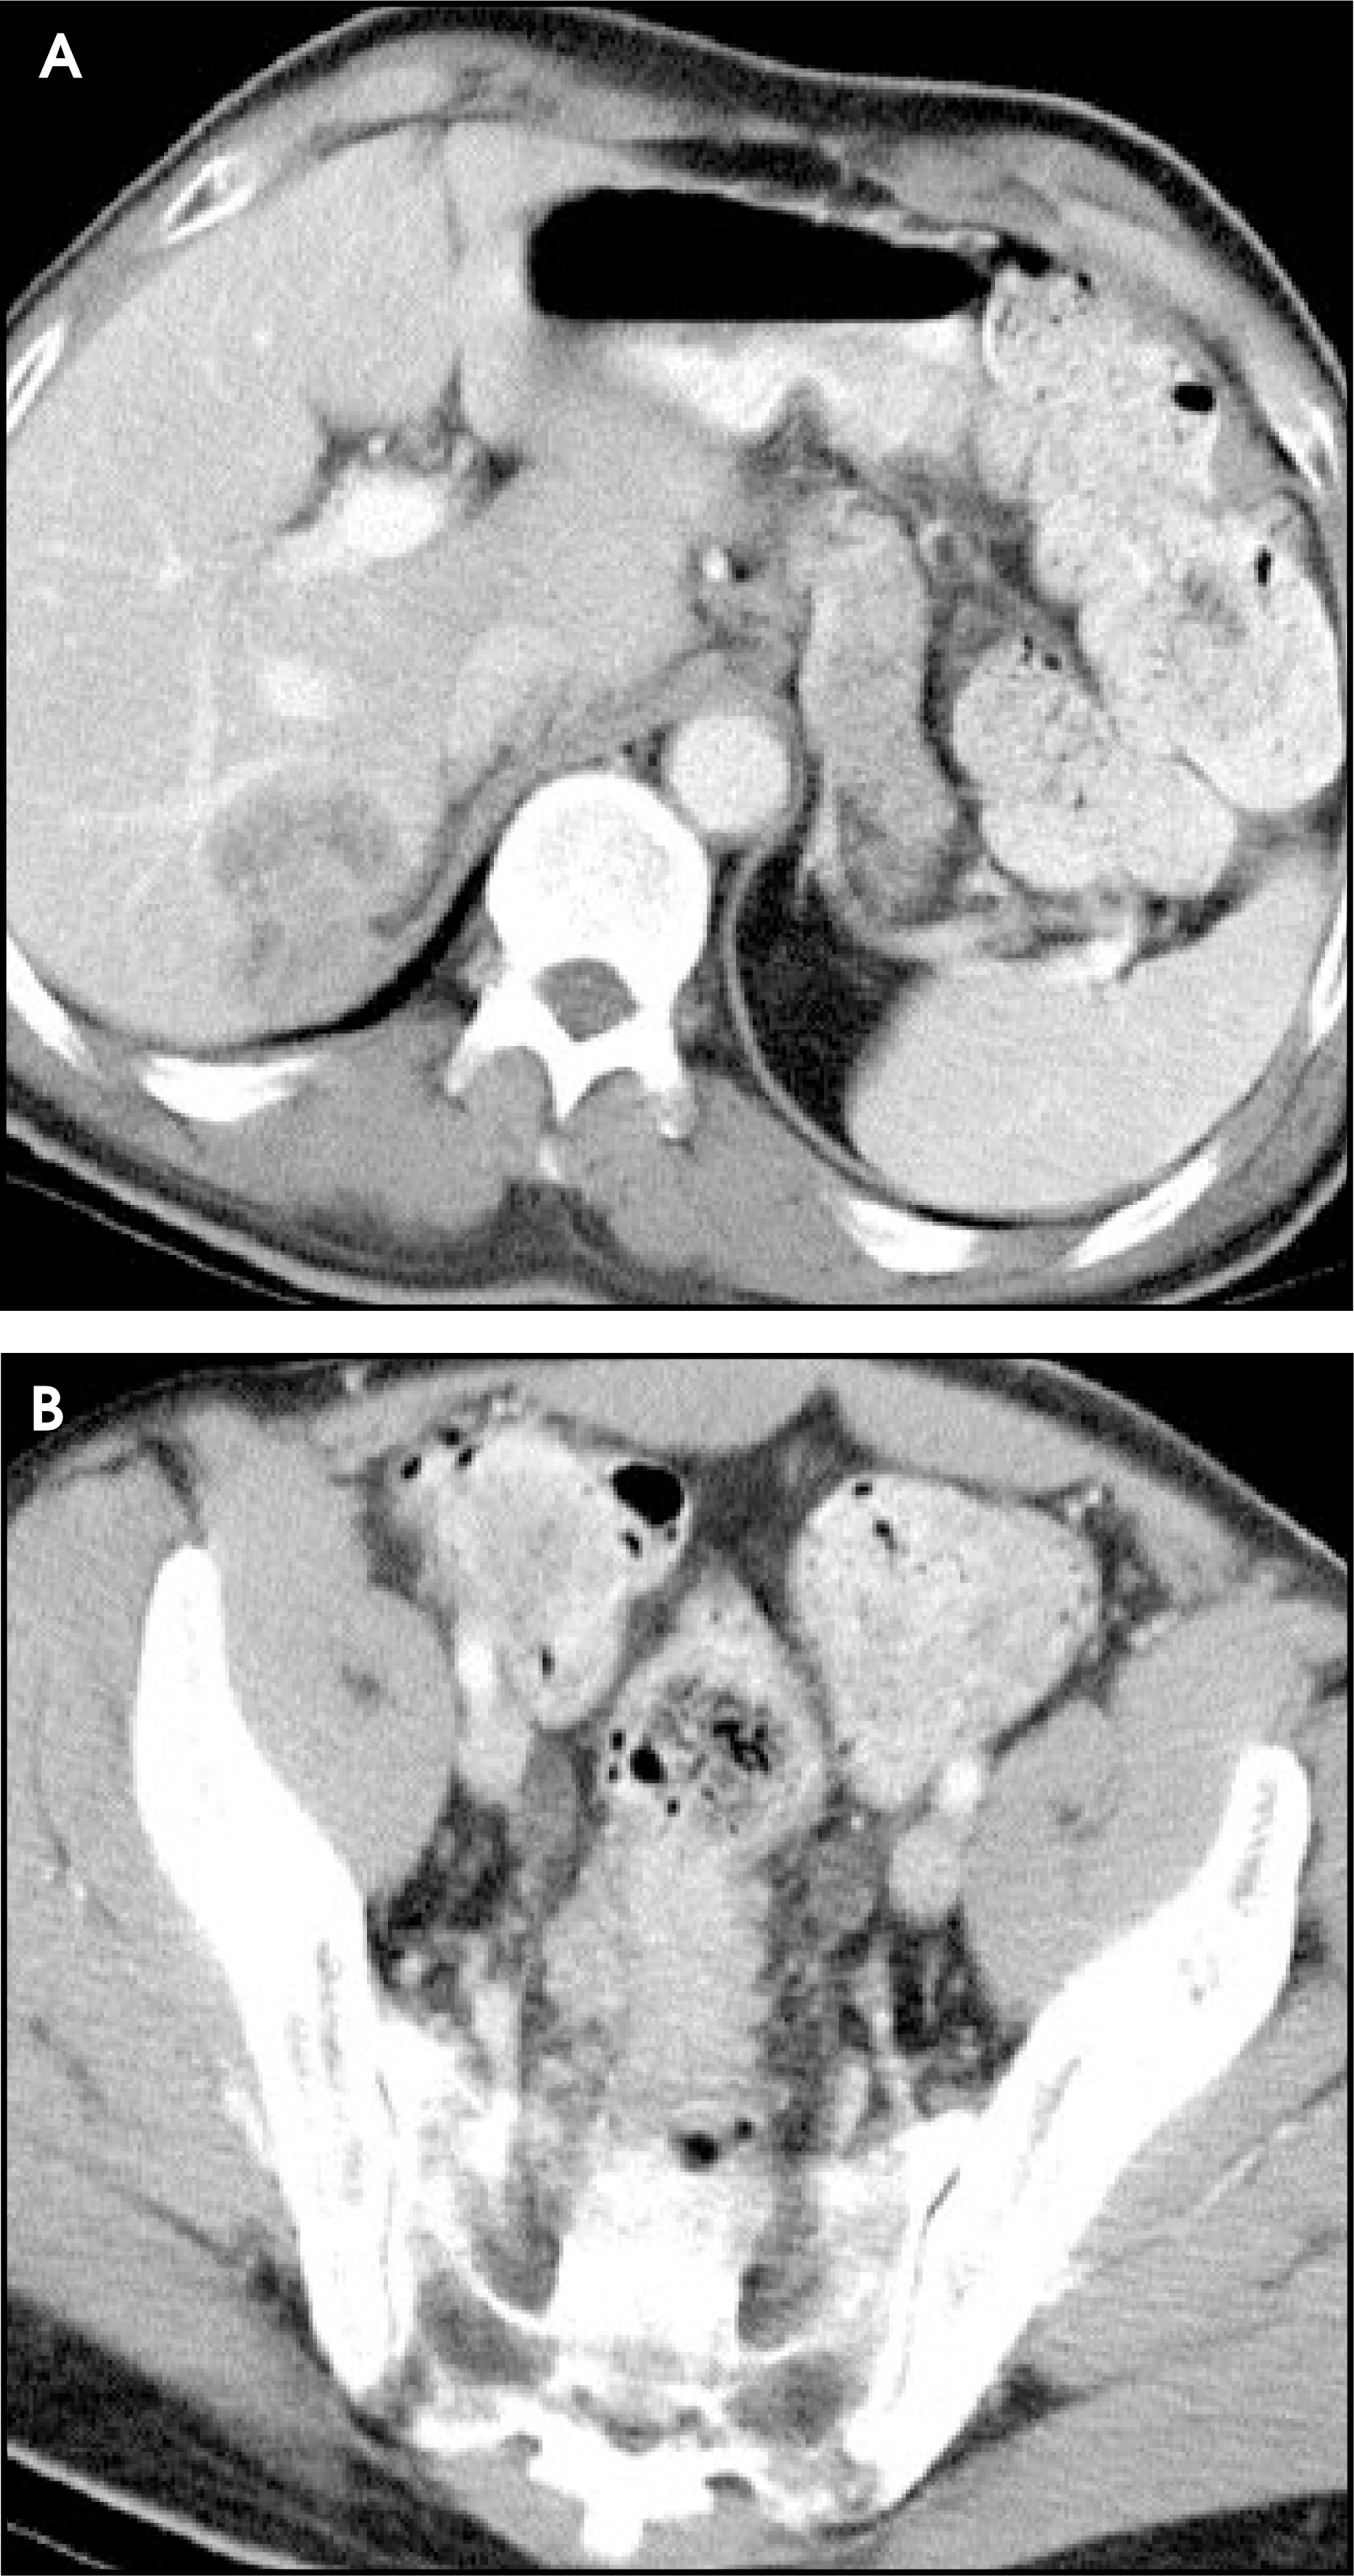
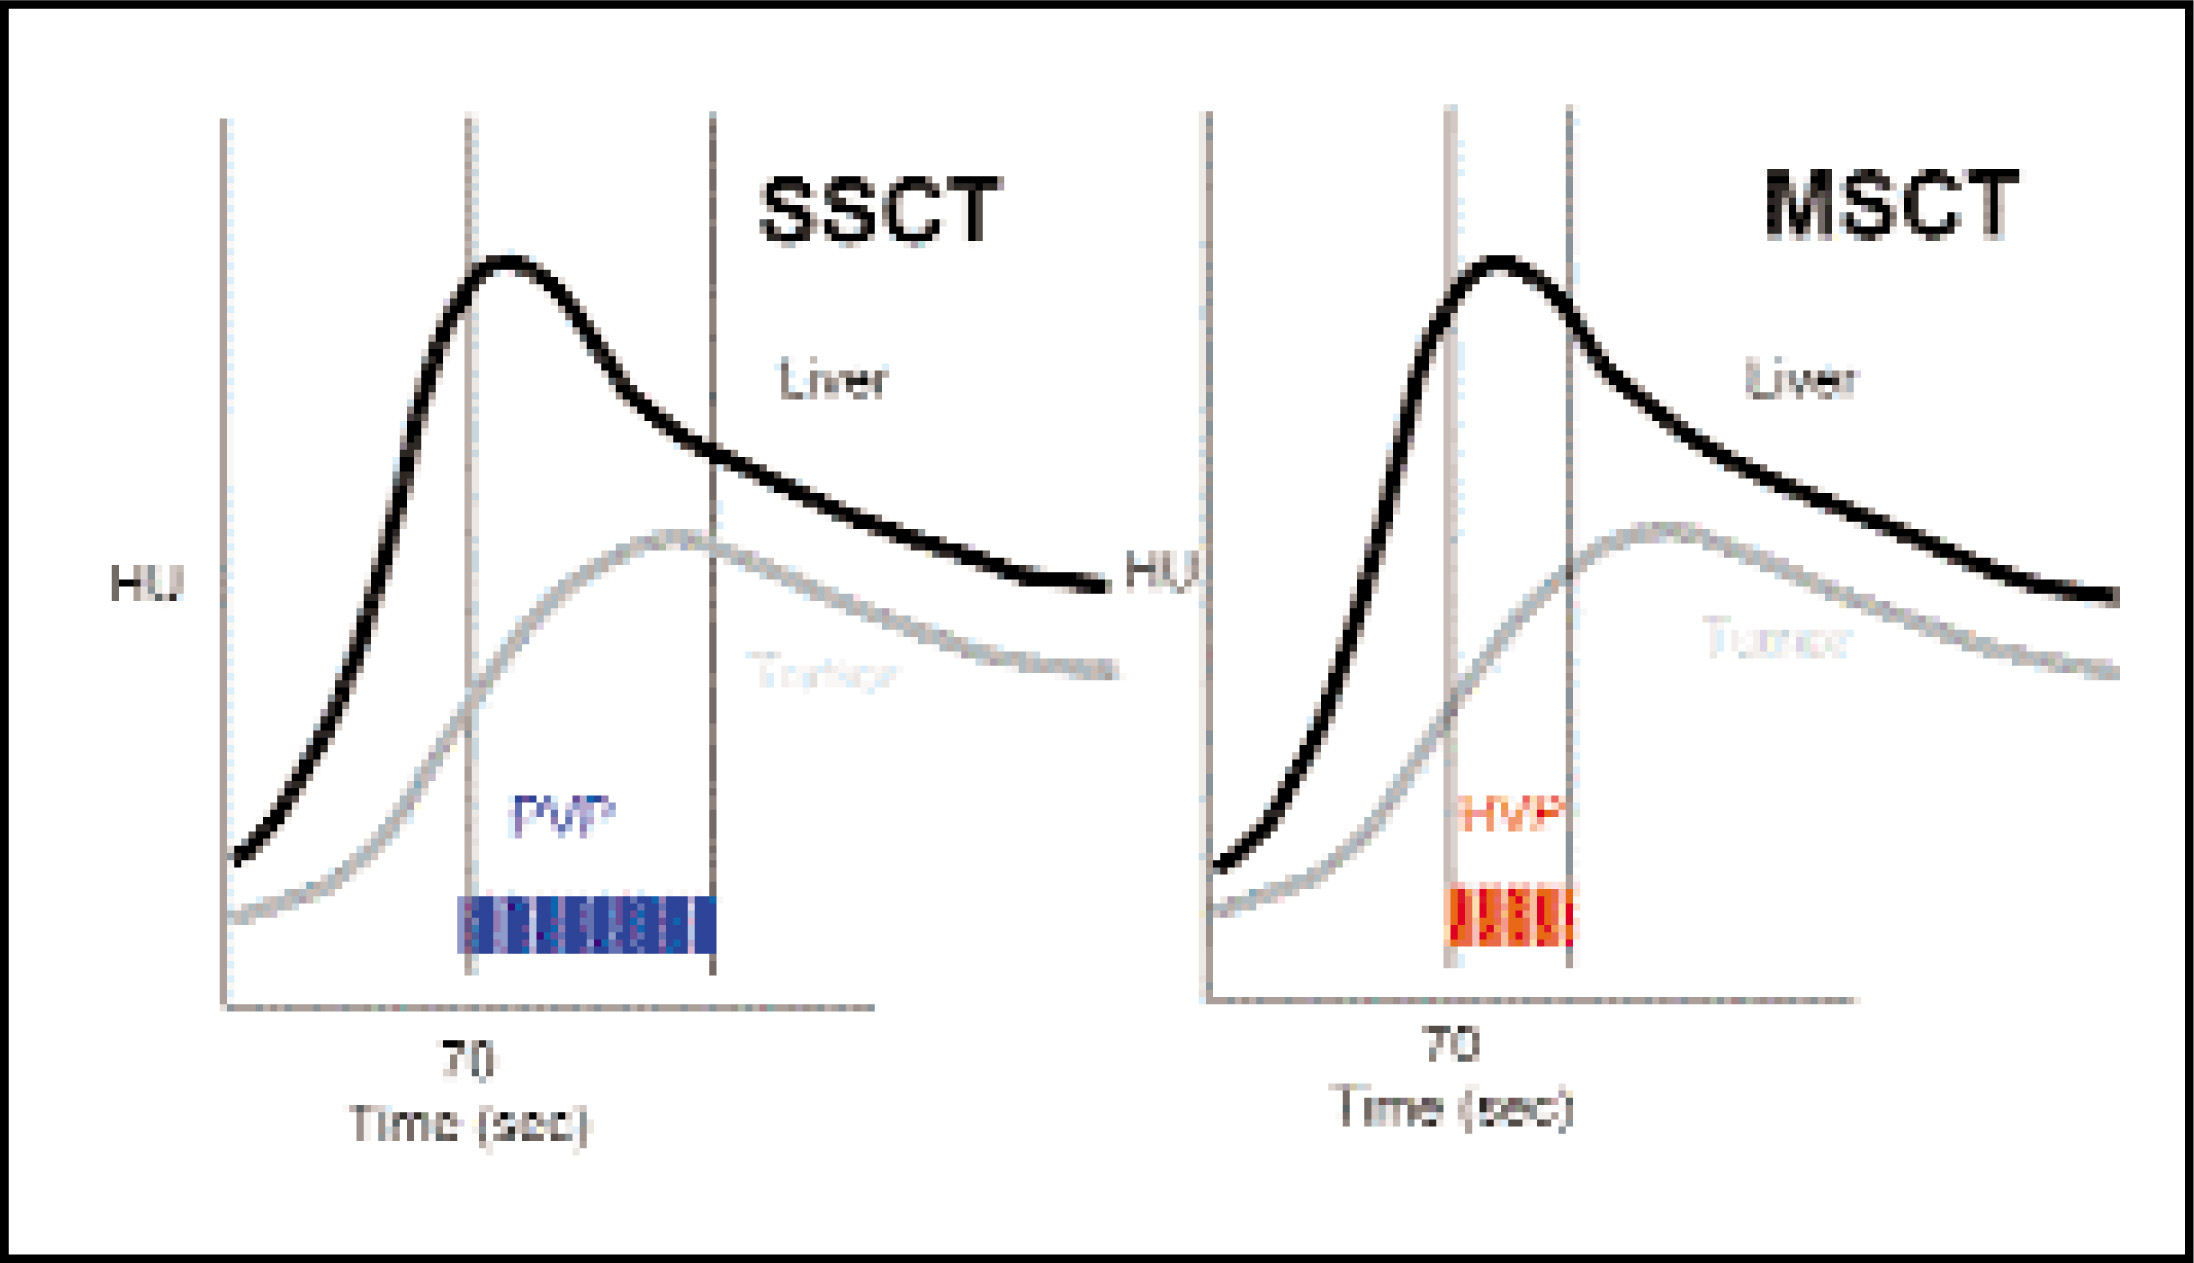
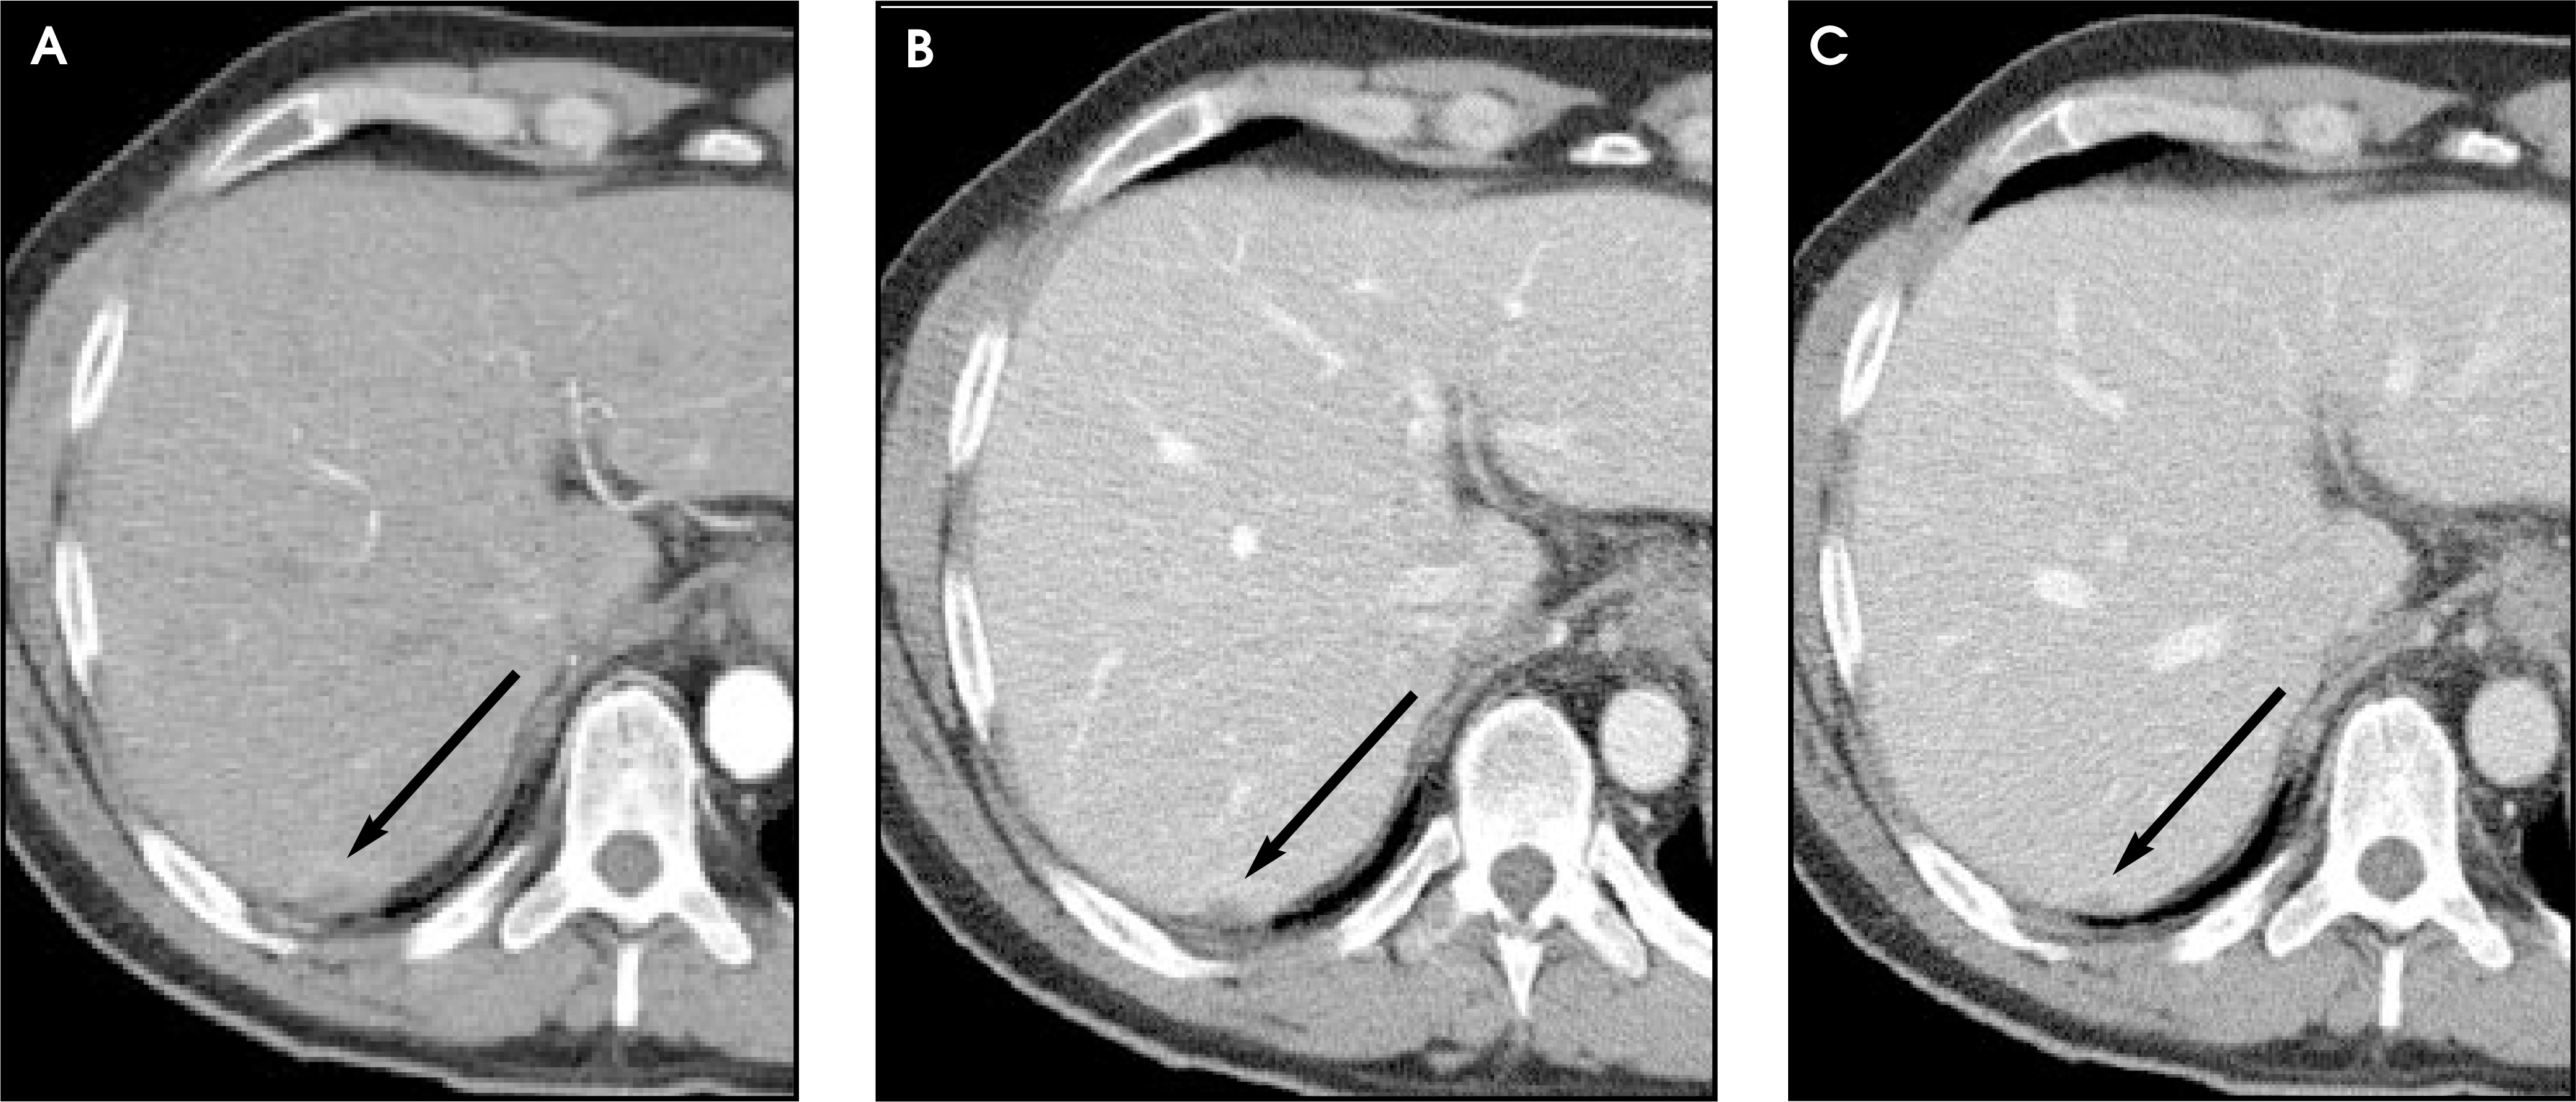
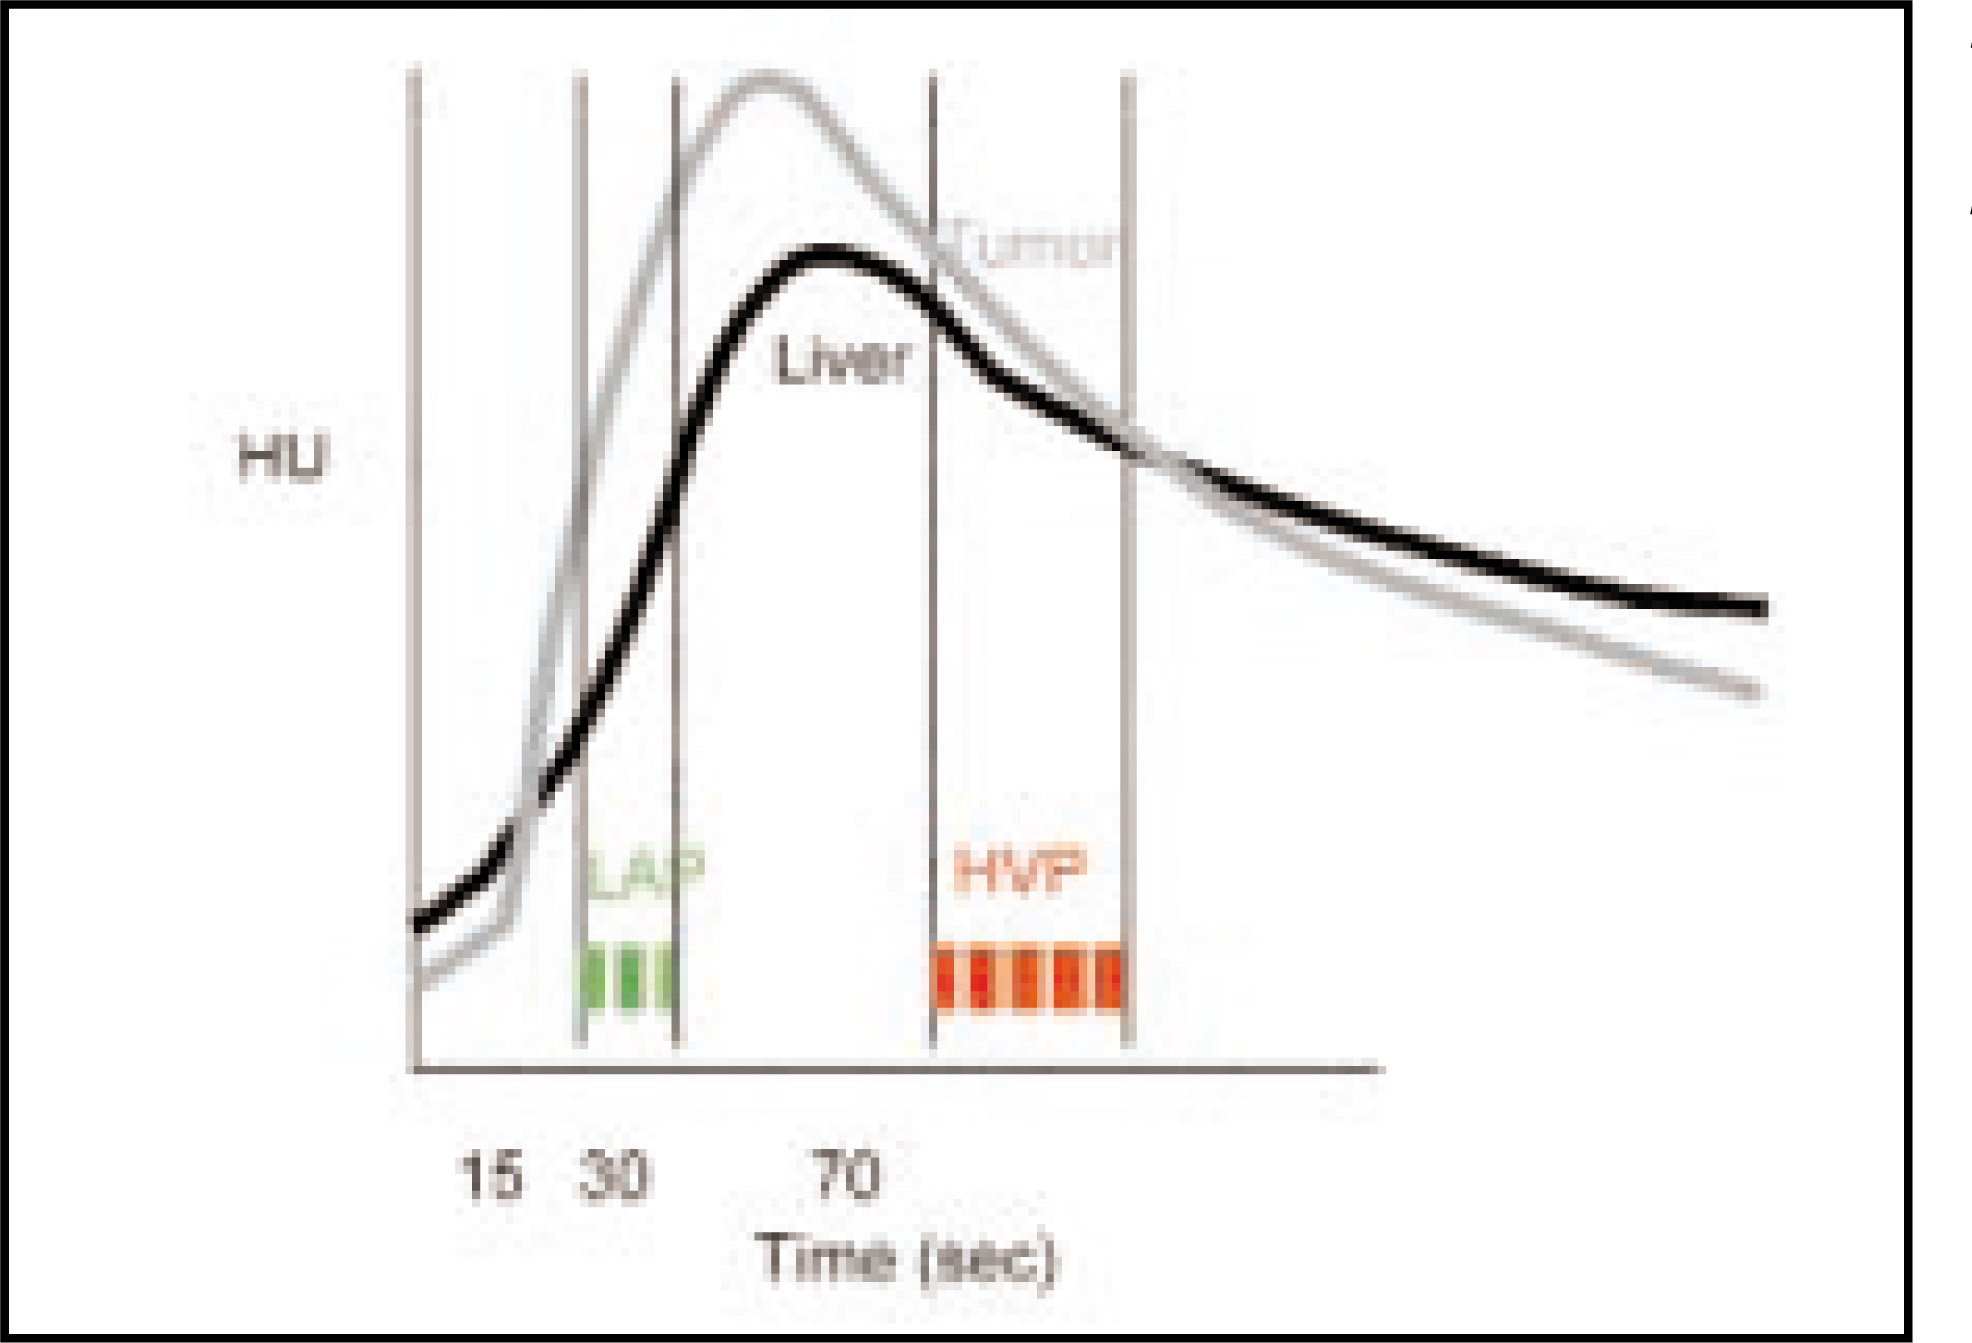
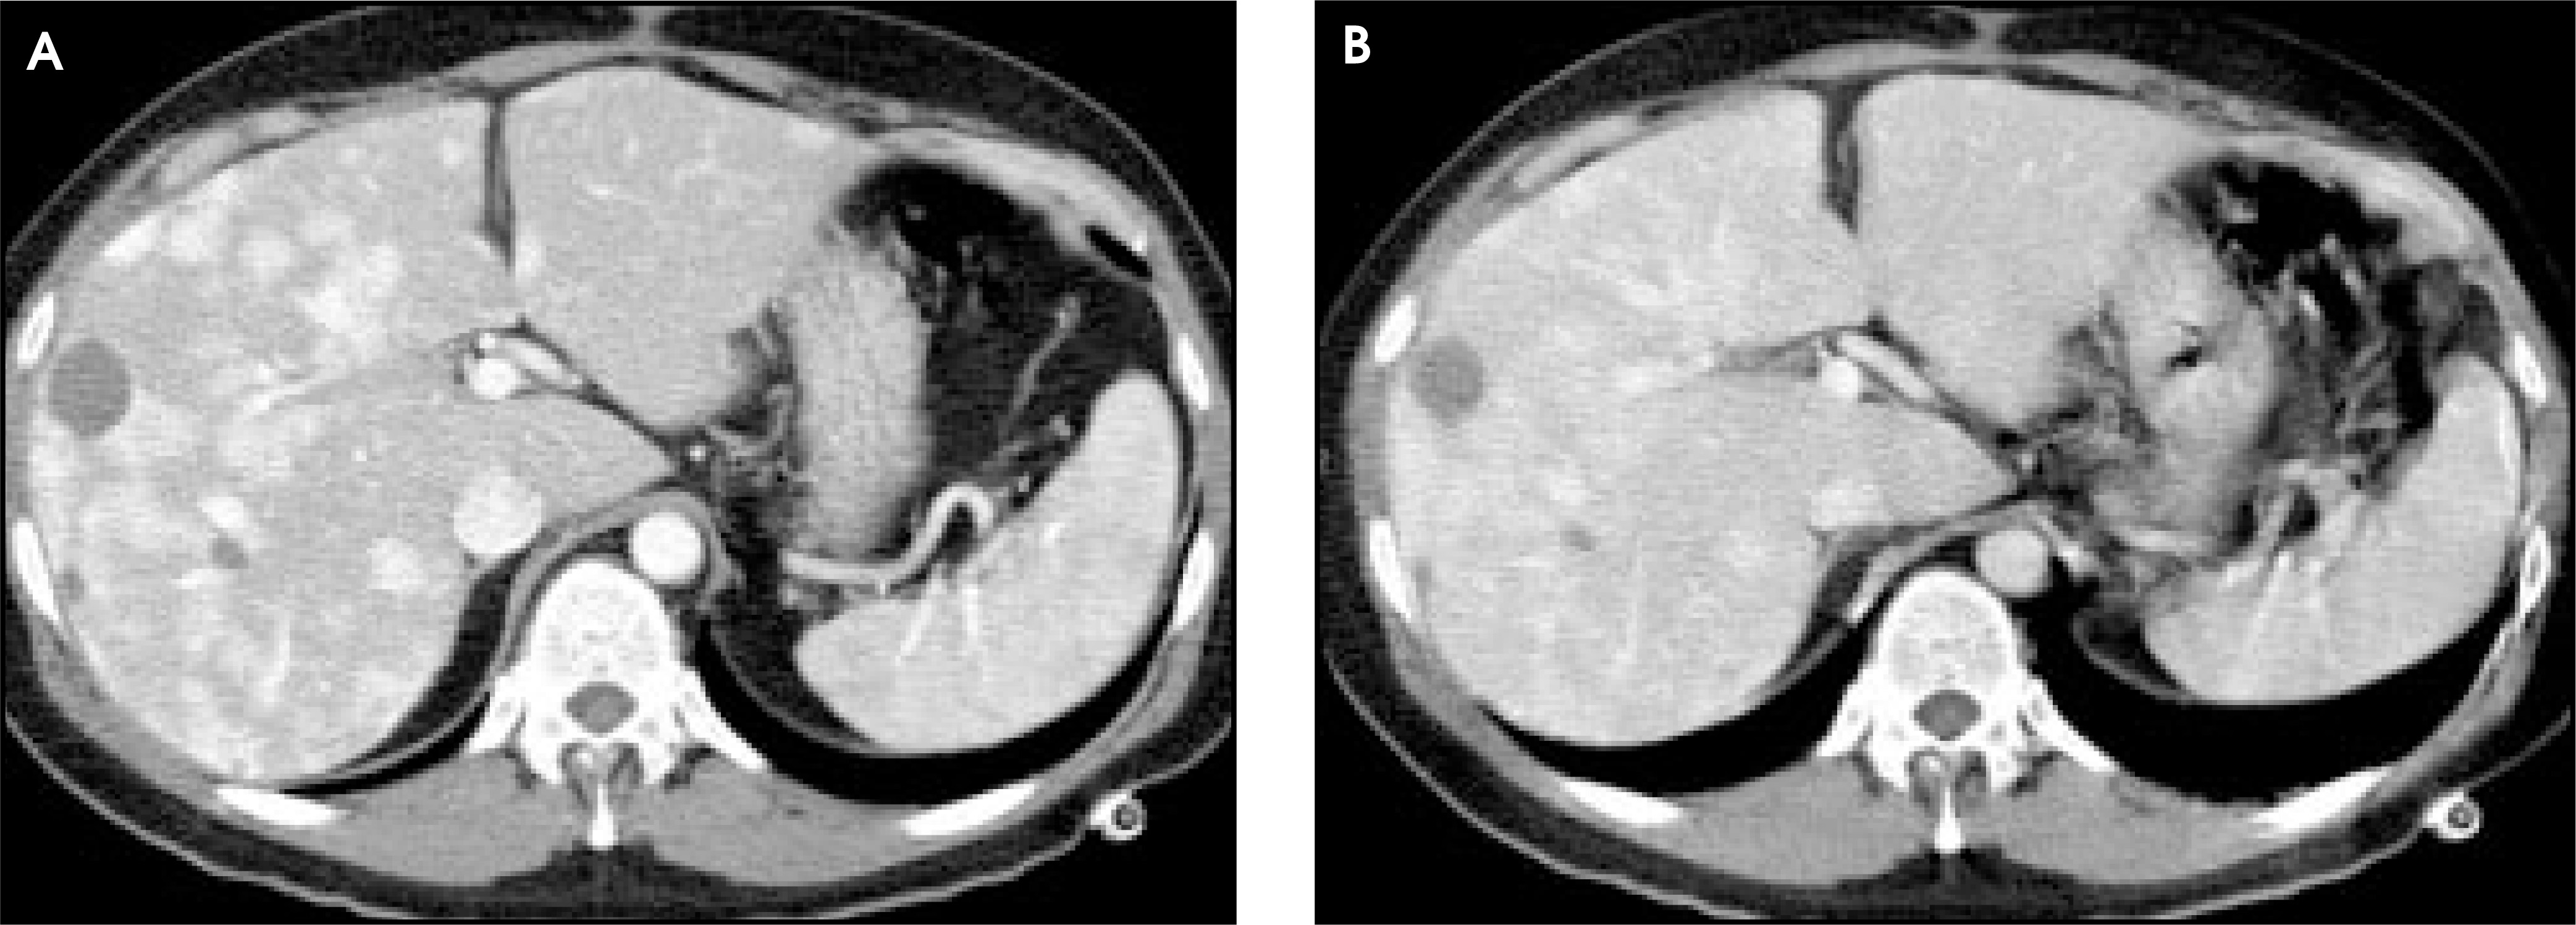
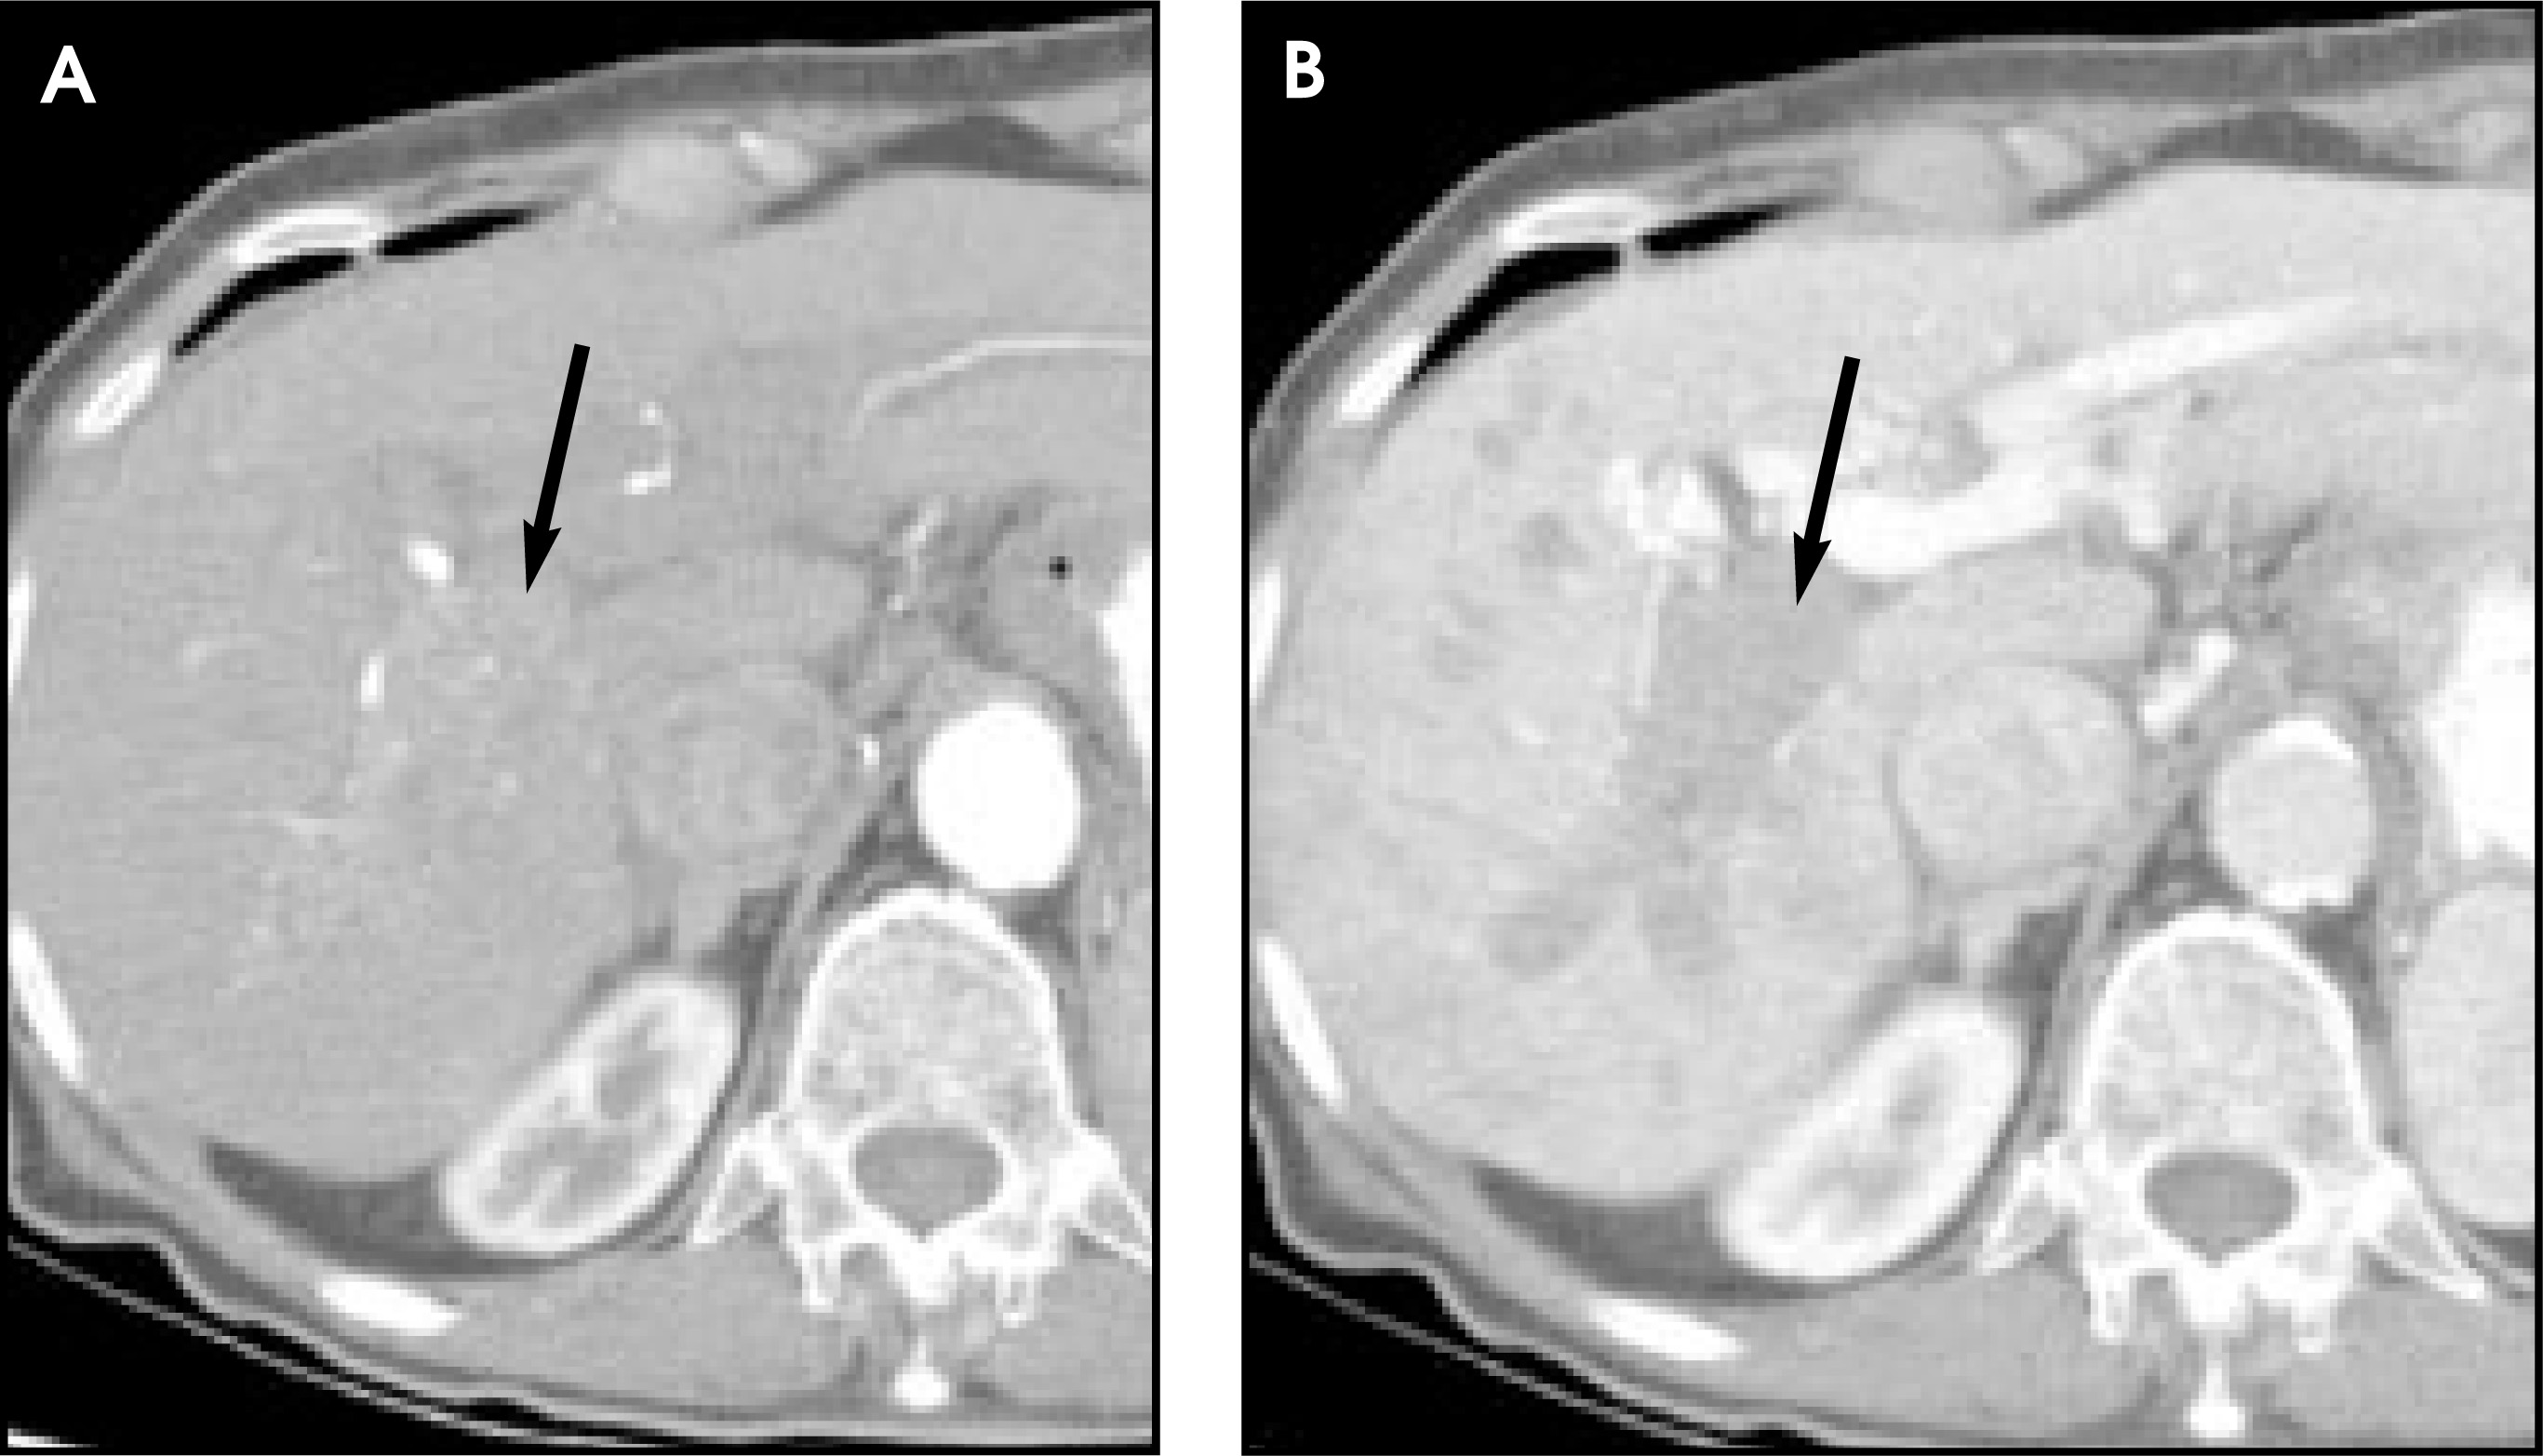
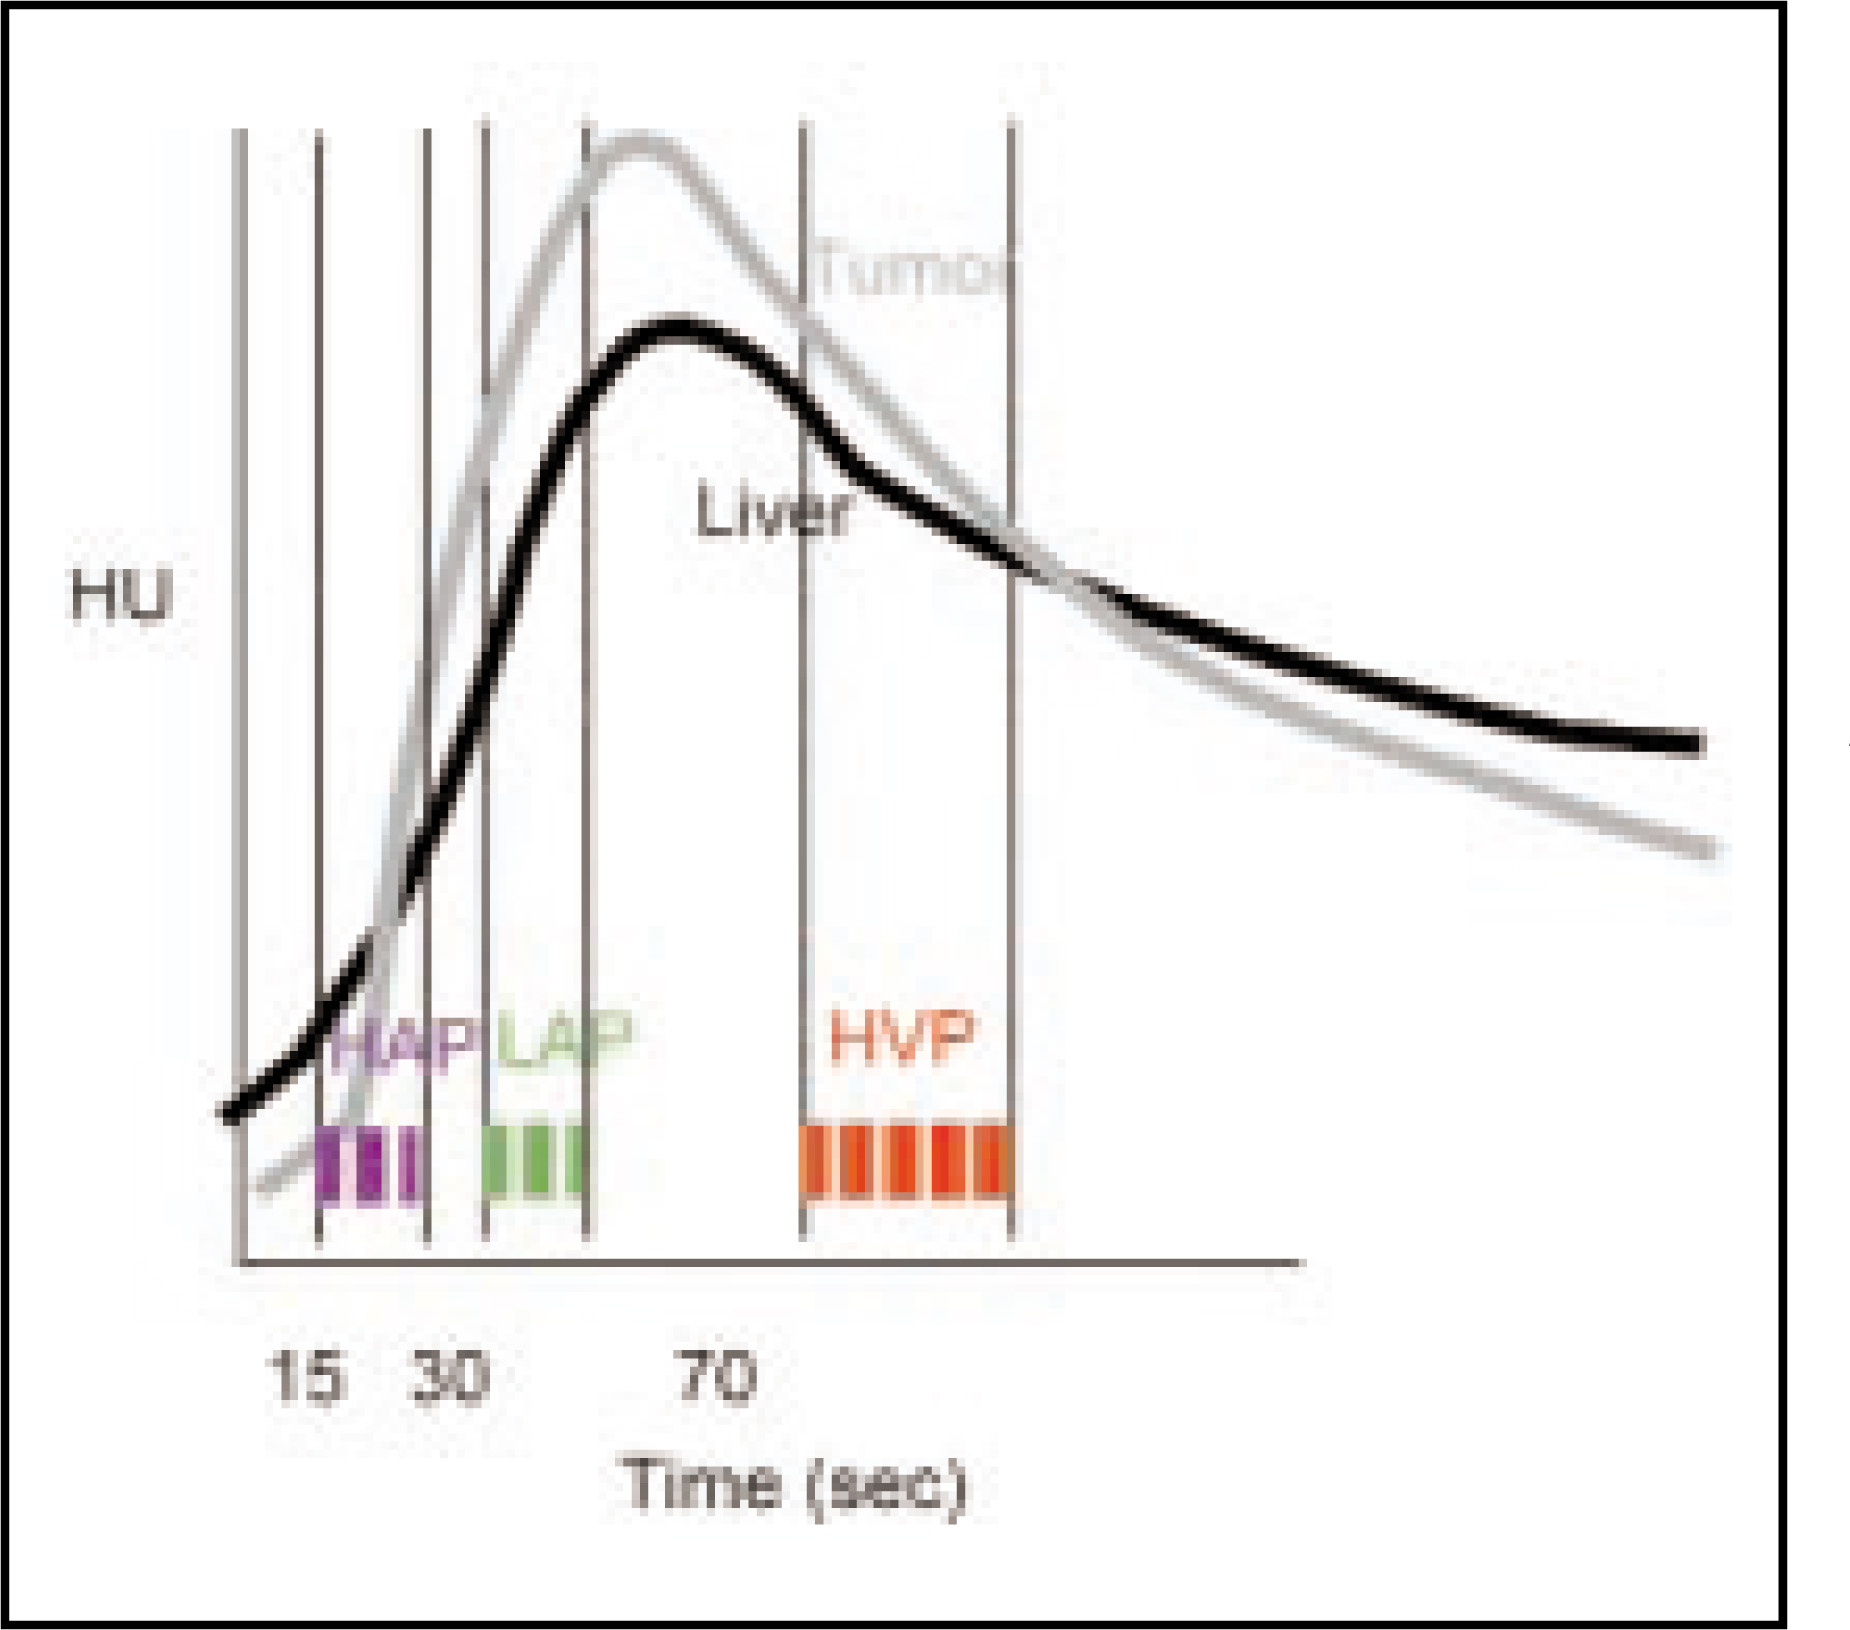
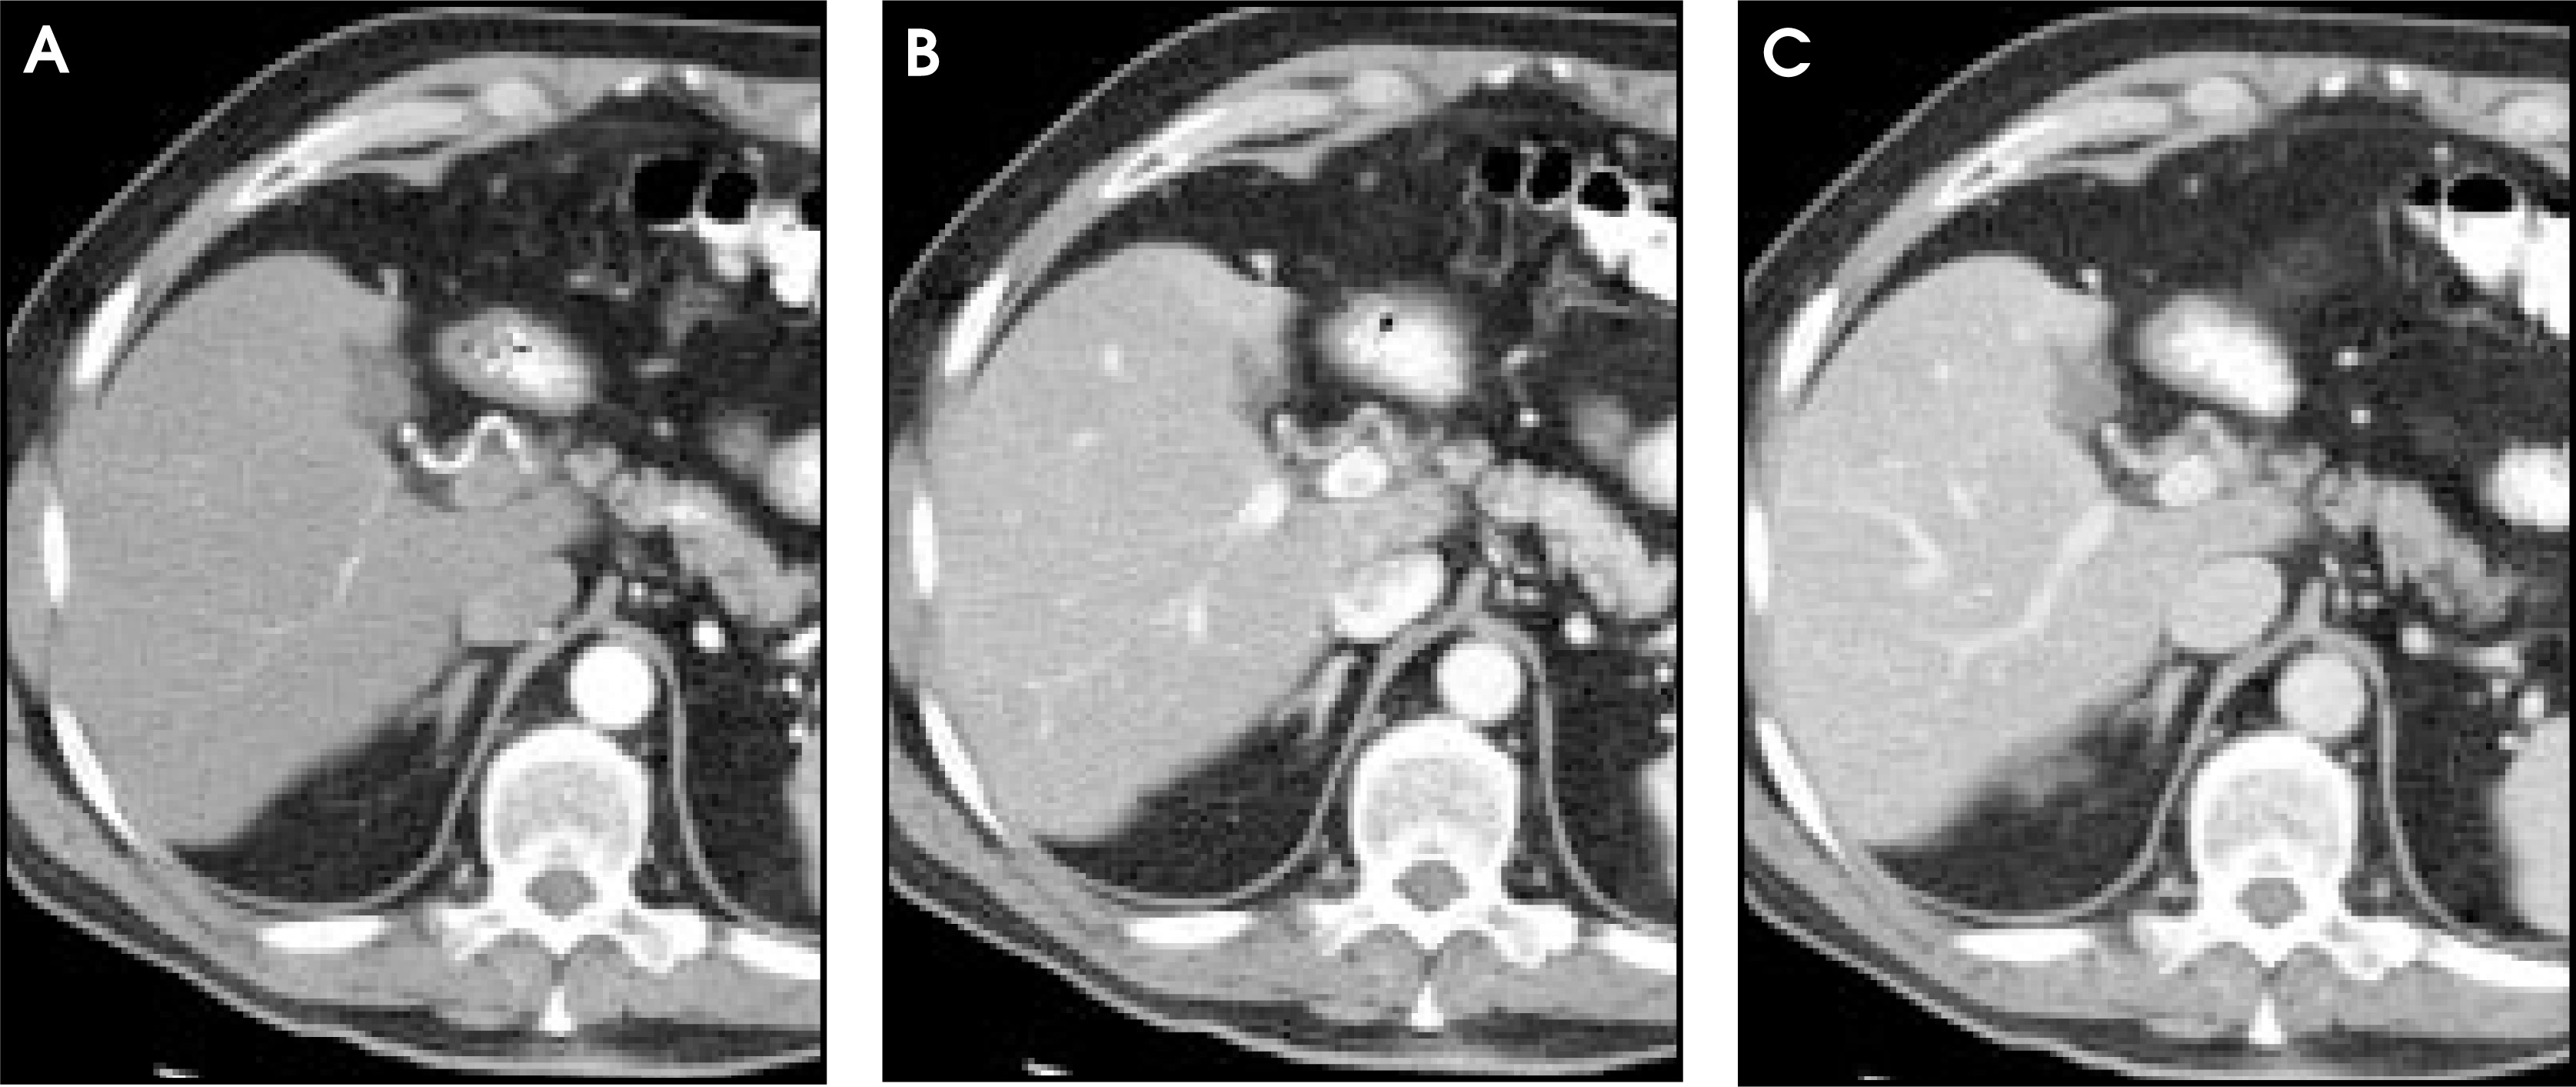
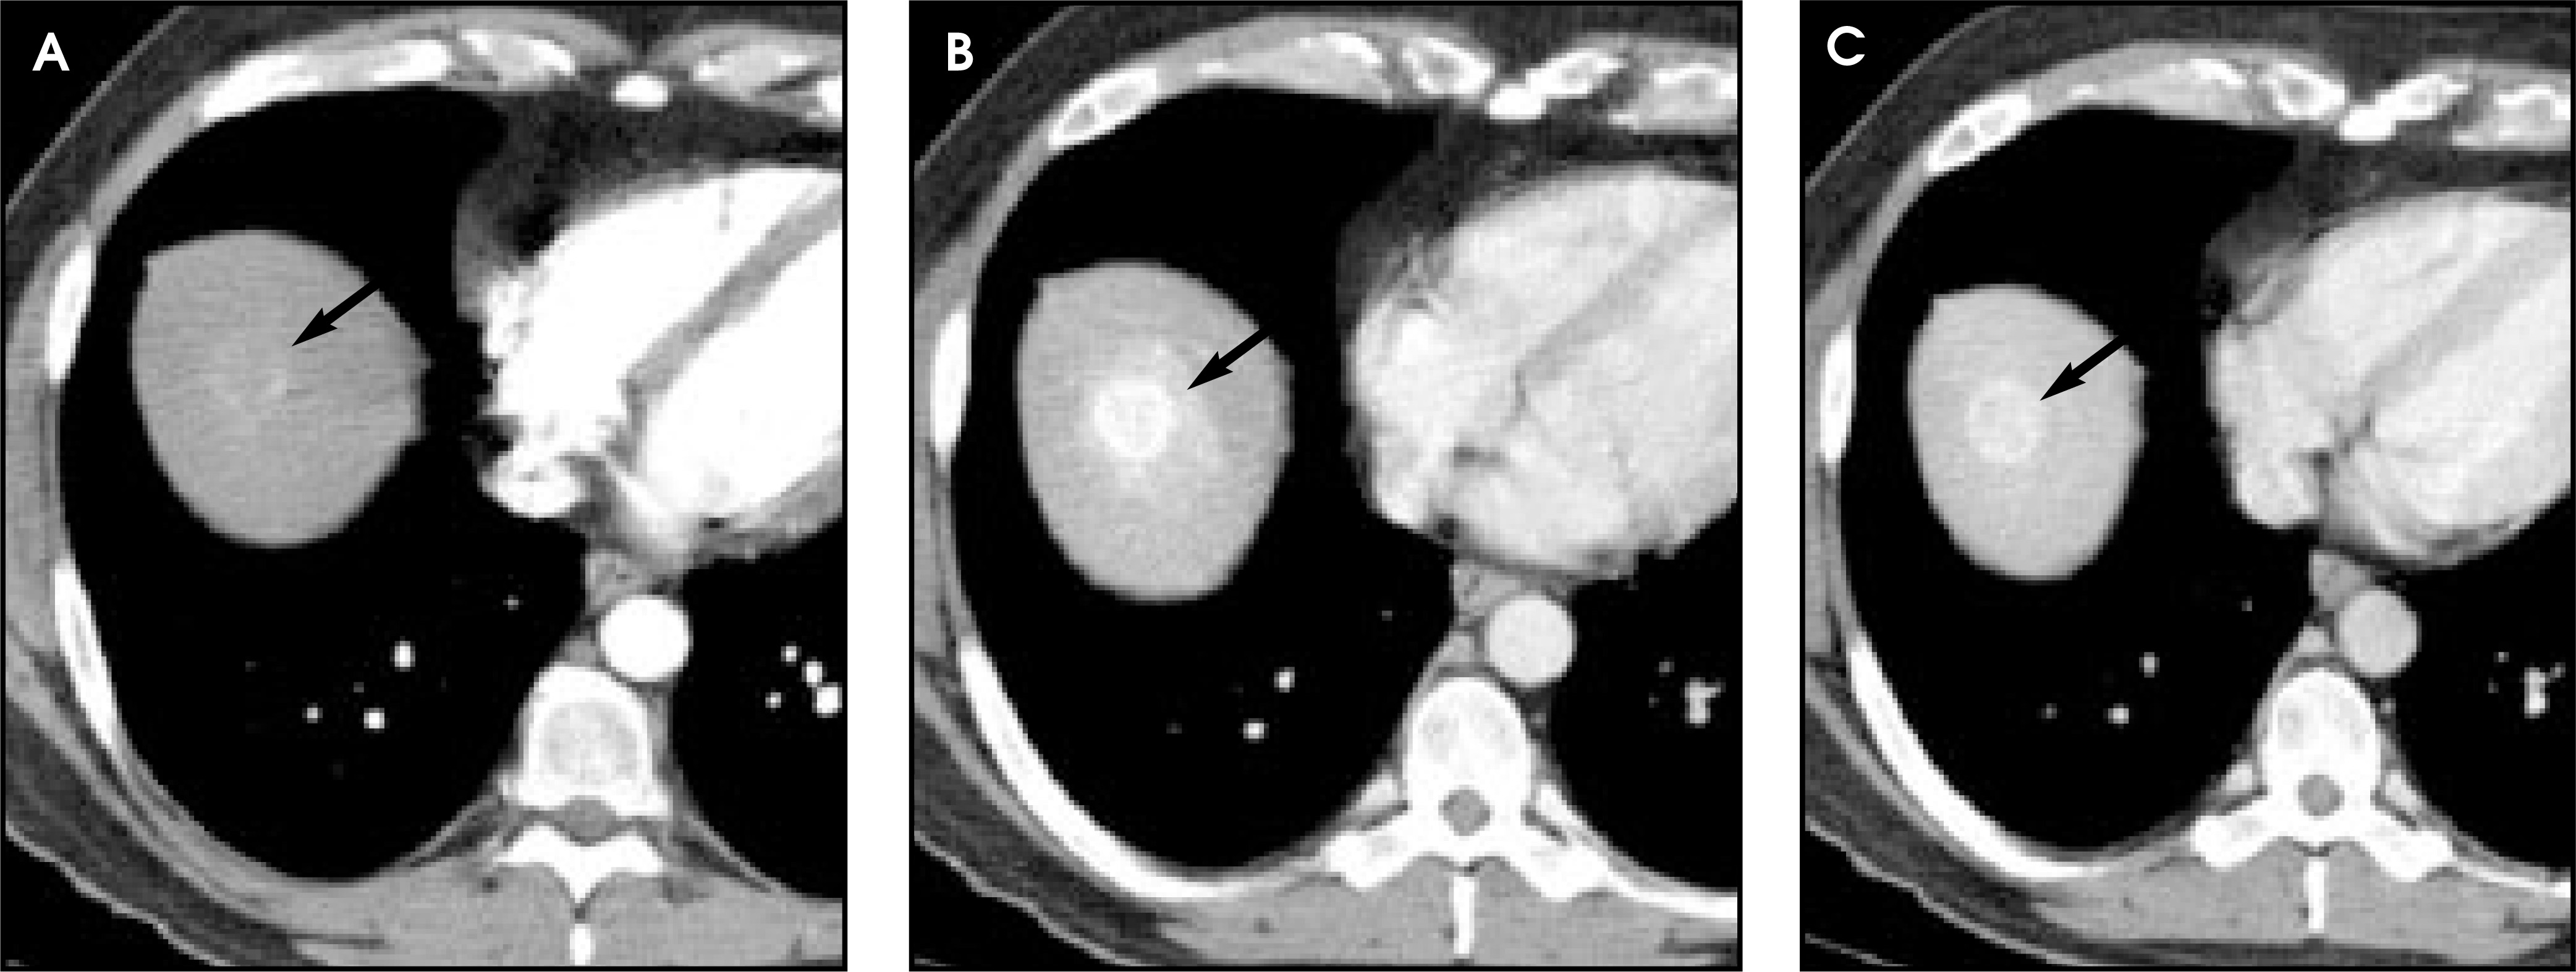
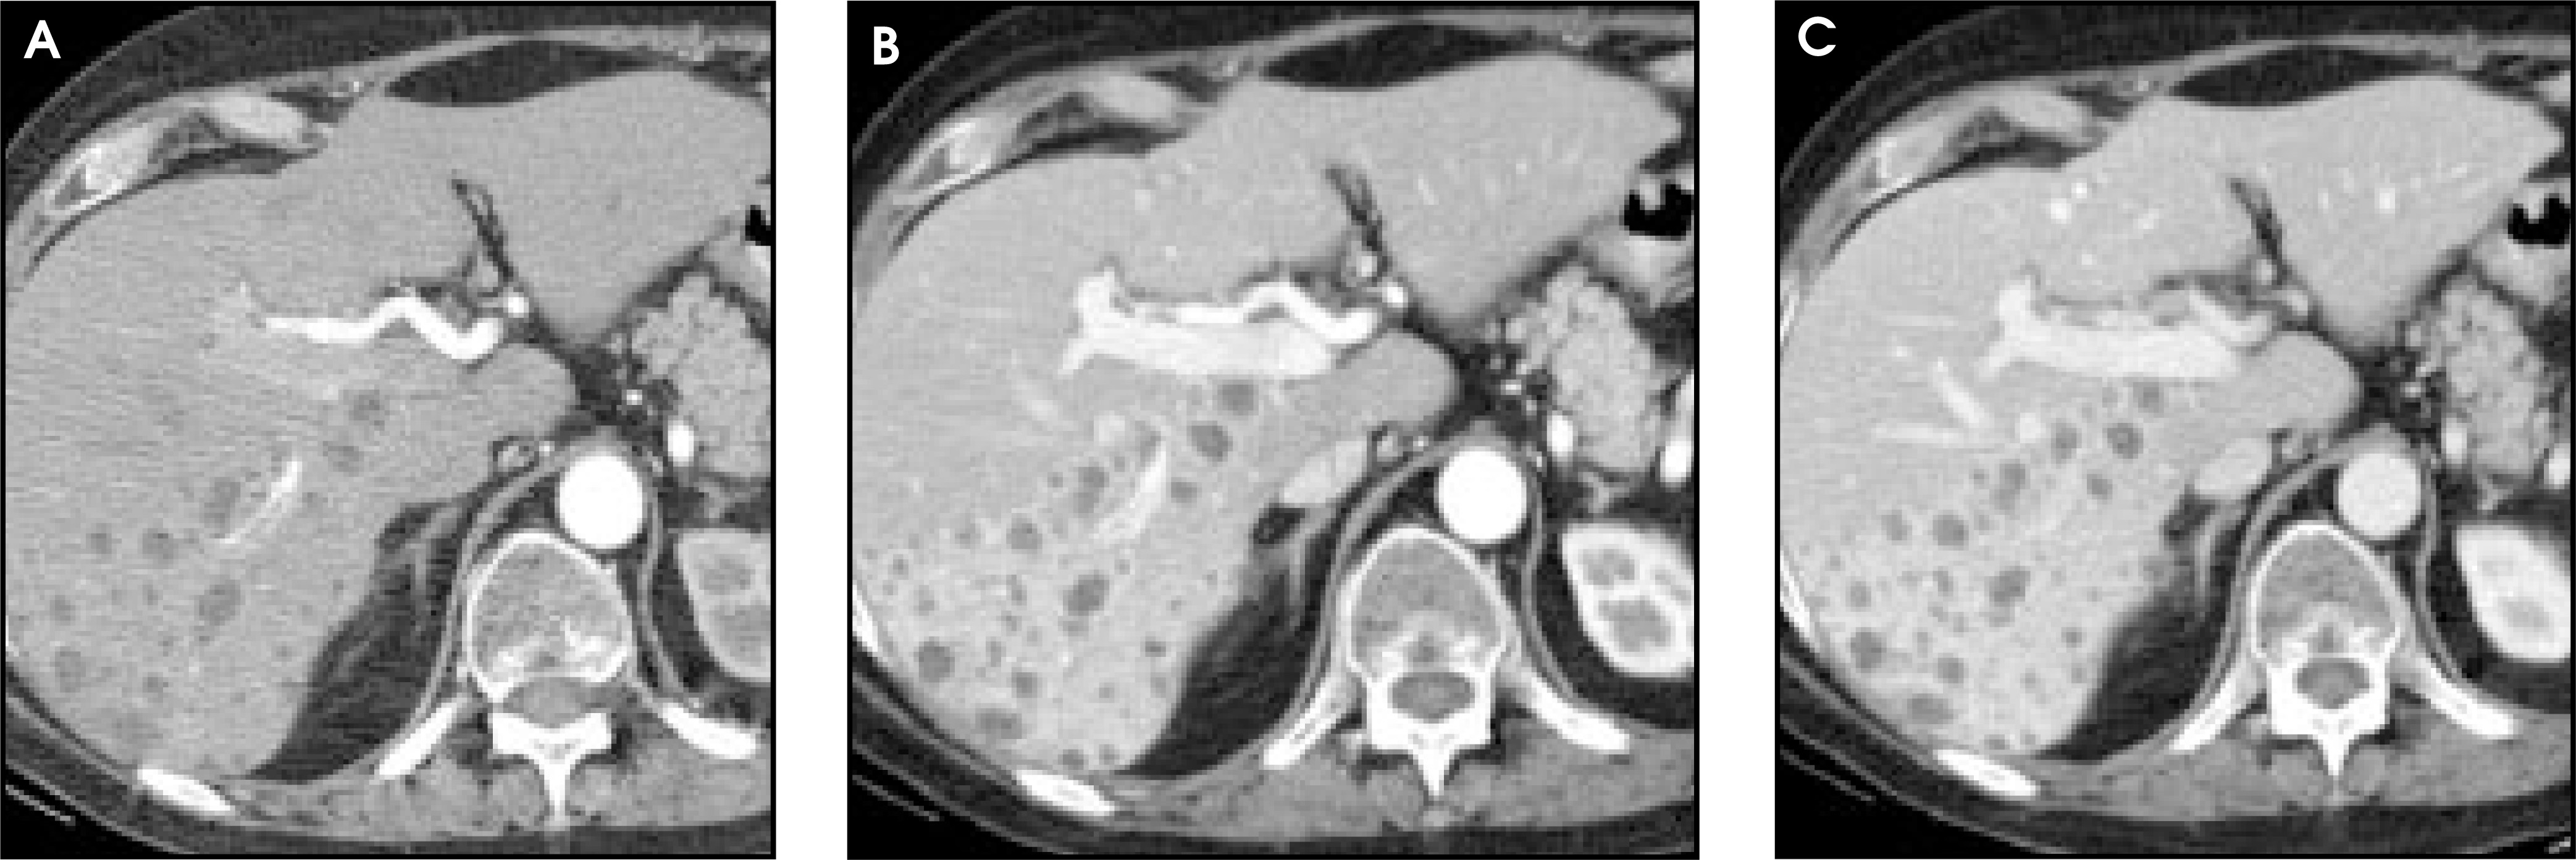
The liver, because of its unique dual blood supply (20% from the hepatic artery and 80% from the portal venous system), remains just as much or more of a challenge for optimizing protocols in the current era of MSCT. These scanners offer a quantum leap in speed and flexibility when compared with even standard single-slice helical scanners. The previously termed portal venous phase (PVP) for single-slice CT (SSCT) has now been more appropriately named the hepatic venous phase (HVP) on MSCT, as this phase captures the opacification of these veins and maximal liver enhancement (Figures 2 through 8).6,7 The main impact of MSCT scanners has been to provide the ability to examine an organ, such as the liver, in multiple phases of contrast dynamics with the hope of allowing increased detection of lesions as well as improved lesion characterization.7-10 Optimizing protocols for multiphasic imaging includes adding phase(s) to the HVP (ie, dual-phase imaging) and/or inclusion of a very early arterial phase for 3D imaging of the vascular system, (ie, triple-phase imaging). In contrast to helical SSCT, MSCT is able to define three distinct phases of contrast enhancement, rather than just two. With SSCT, the two phases are the hepatic arterial dominant phase (HADP) and the PVP; with MSCT these phases have been termed the hepatic arterial phase (HAP), late arterial phase (LAP) or portal venous inflow phase (PVIP), and a hepatic venous phase (HVP).7 The first two phases were incorporated in the HADP described with SSCT (Figures 9 through 12). The ability to scan rapidly with MSCT allows one to separate these and scan in two phases what could only be done in one phase previously. Hypervascular lesions, either primary or metastatic, are usually best seen in the LAP; however, some lesions are seen only in either the HAP or LAP phases (Figures 13 through 15). Hypervascular lesions have always presented a challenge to the radiologist.10 Failing to image hypervascular lesions during the HAP results in an insensitive examination similar to failing to image hypovascular lesions in the PVP. The HAP is best identified 10 to 20 seconds after the administration of contrast and is characterized by enhancement of the hepatic artery. The LAP is best identified 25 to 30 seconds after injection and shows enhancement of the hepatic artery and some enhancement of the portal venous structures. The HVP is marked by opacification of the hepatic veins at the dome of the liver and enhancement of the portal veins. The speed results in one of the most important challenges in developing optimized protocols for this new, robust technology. Although multiphasic studies could be performed with helical scanners, high-quality, whole-organ imaging with multiple phases awaited the introduction of MSCT.11-15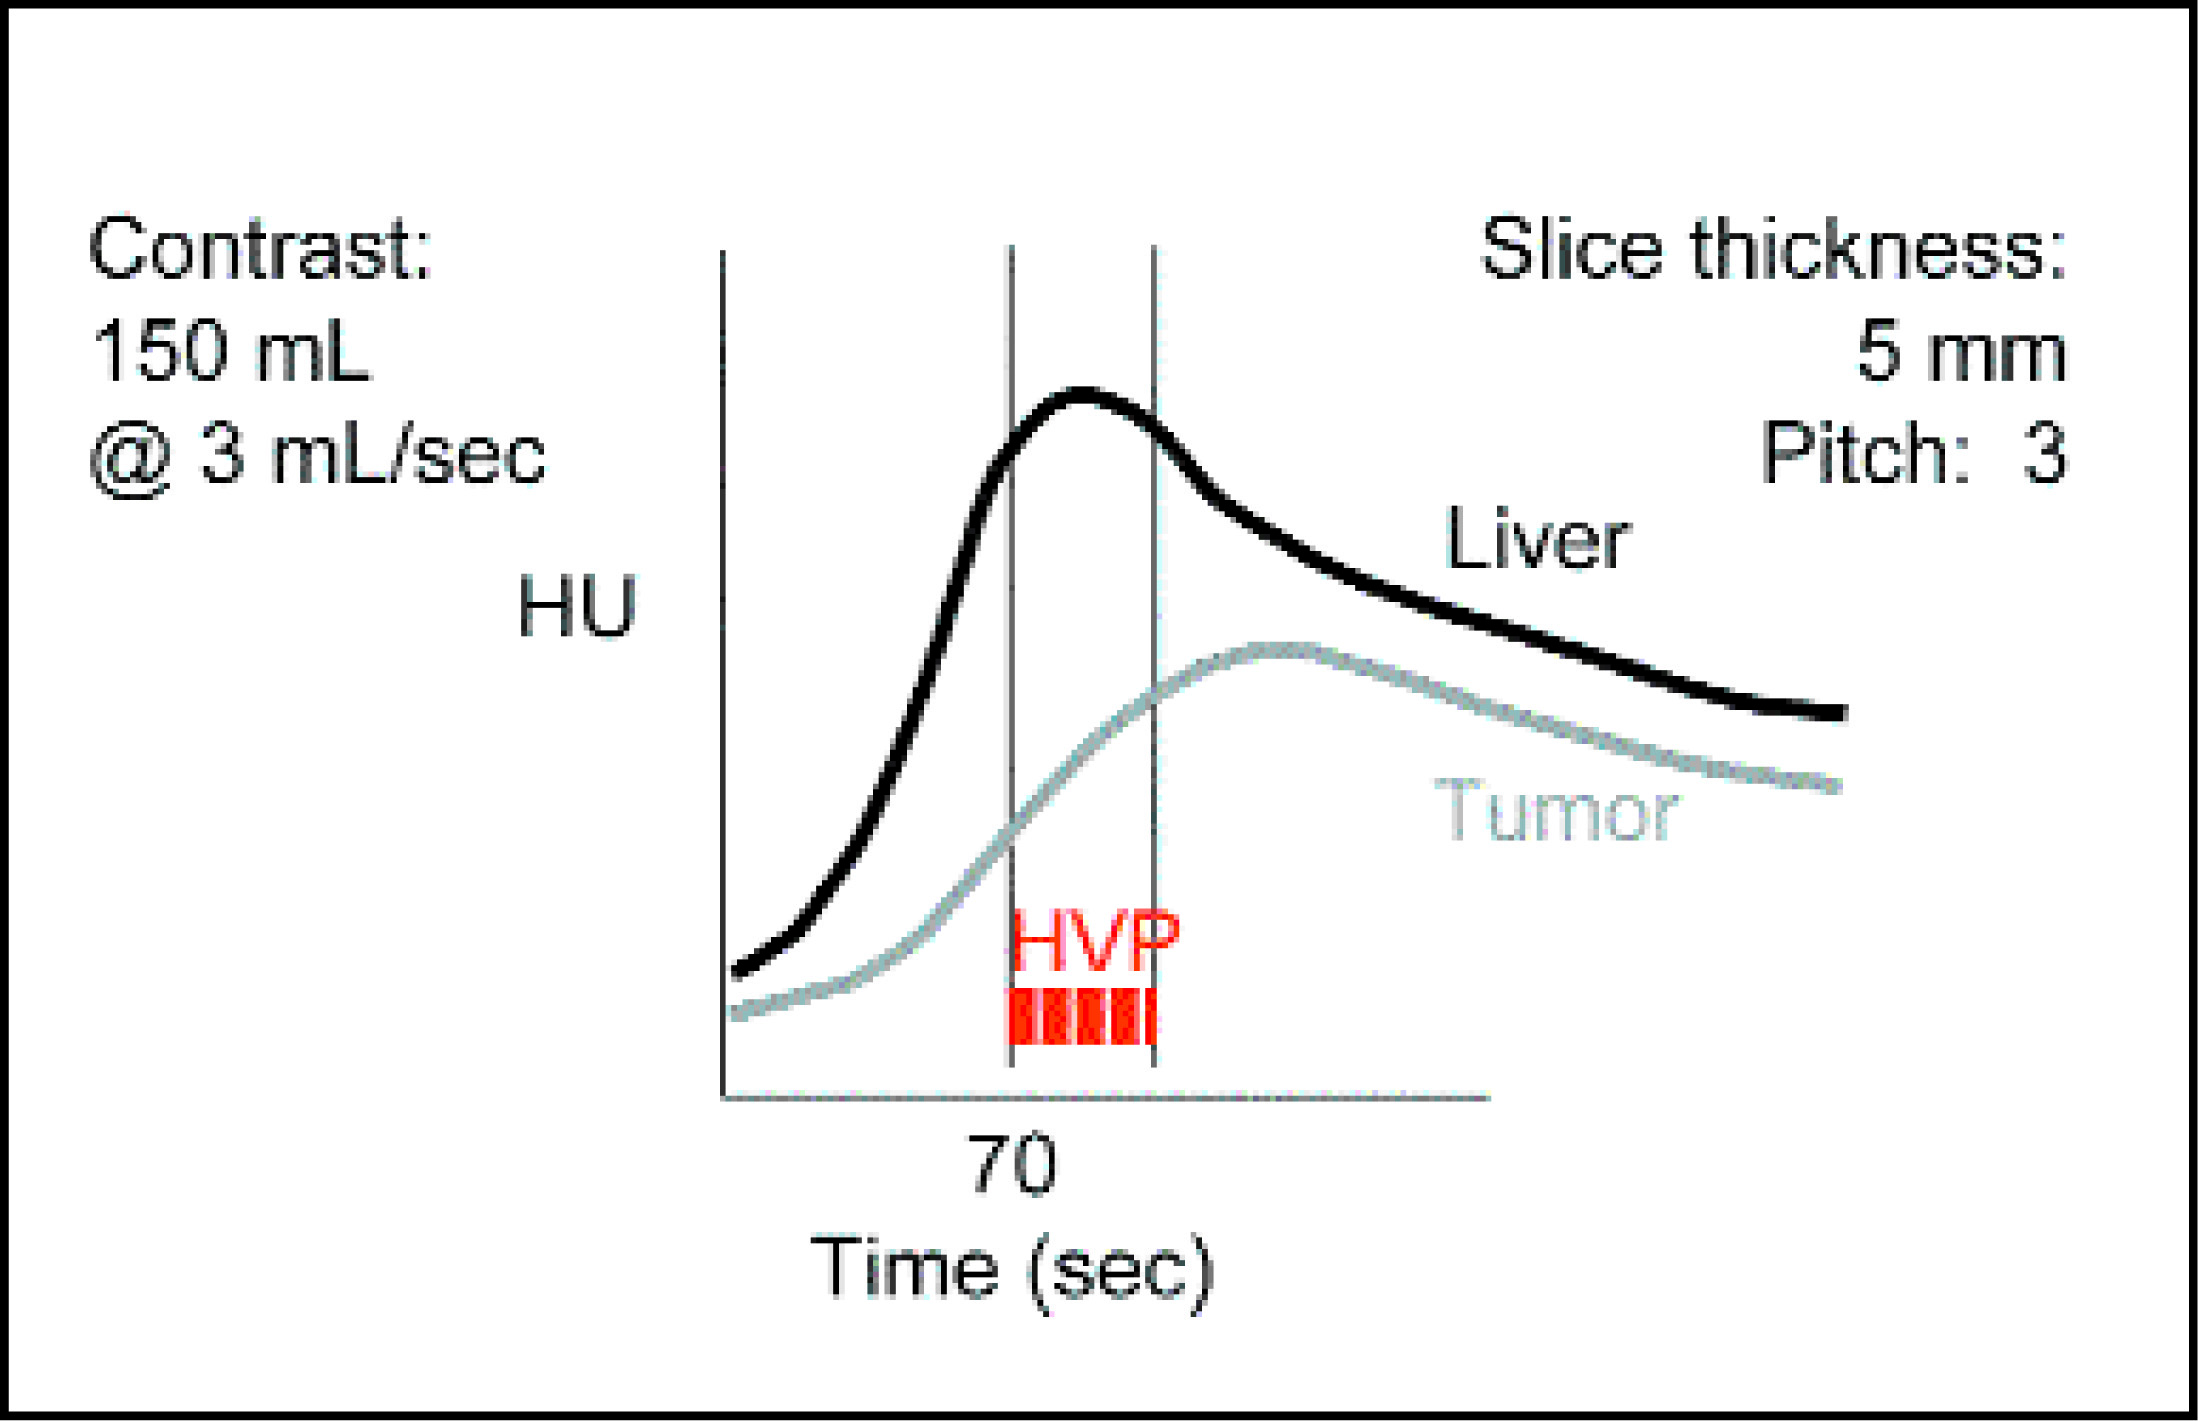
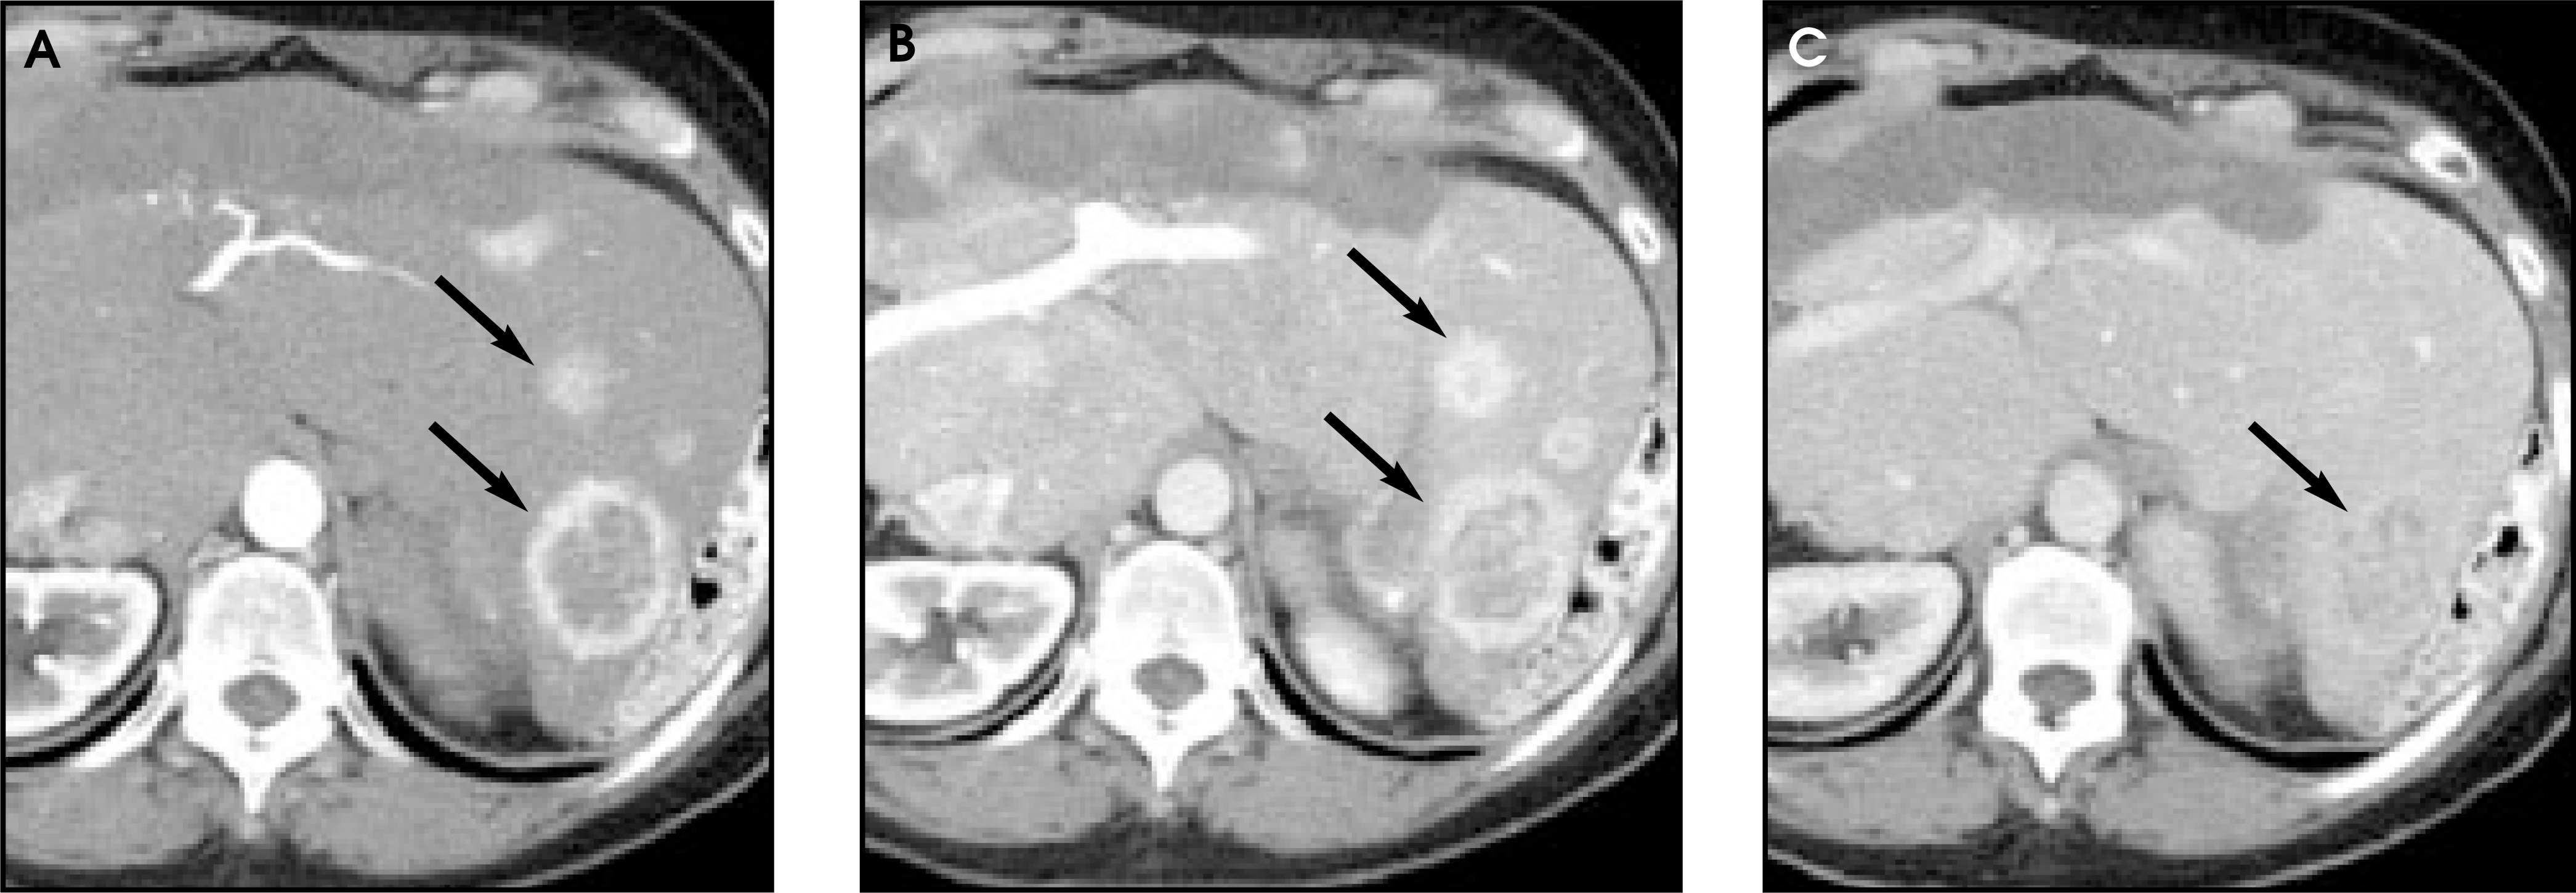
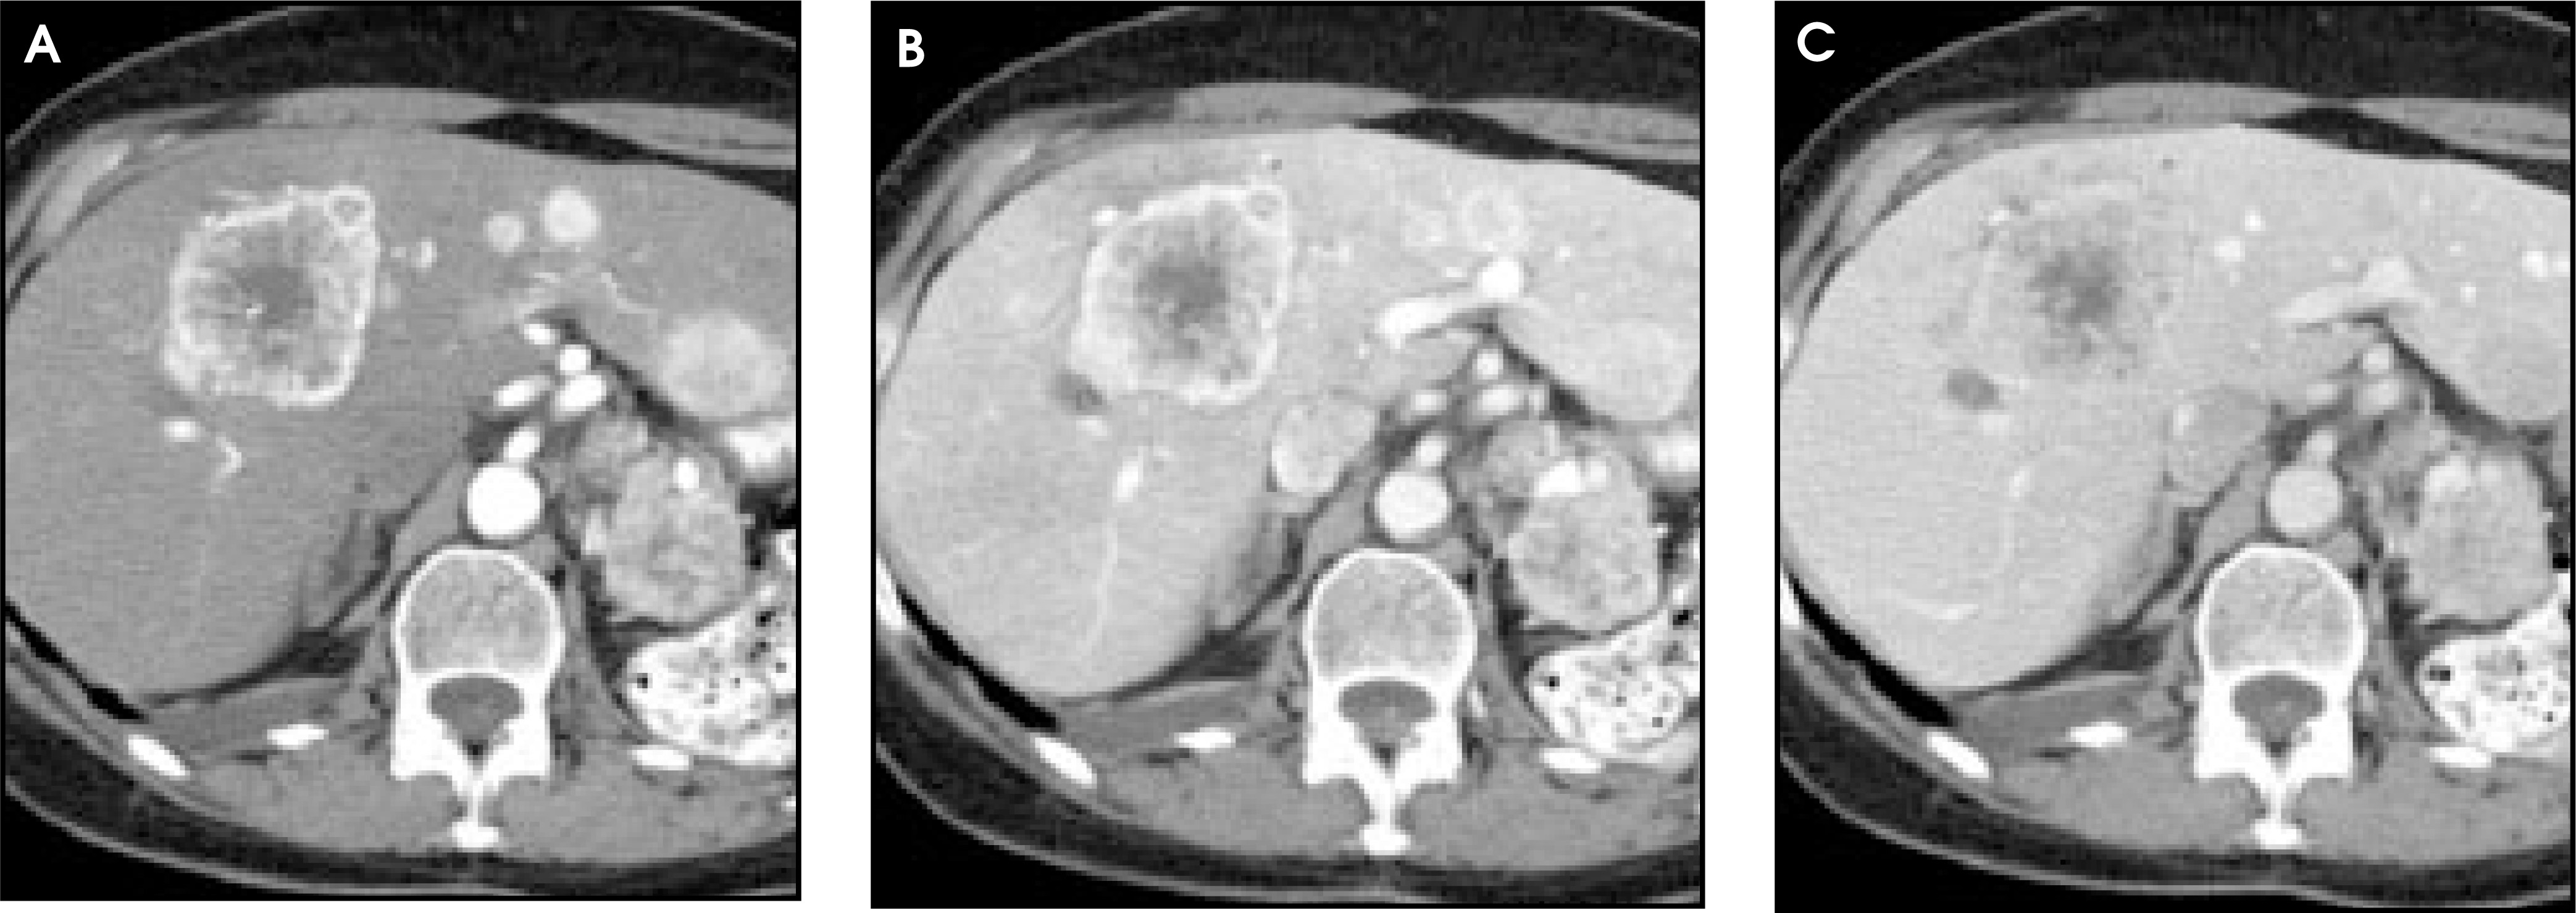
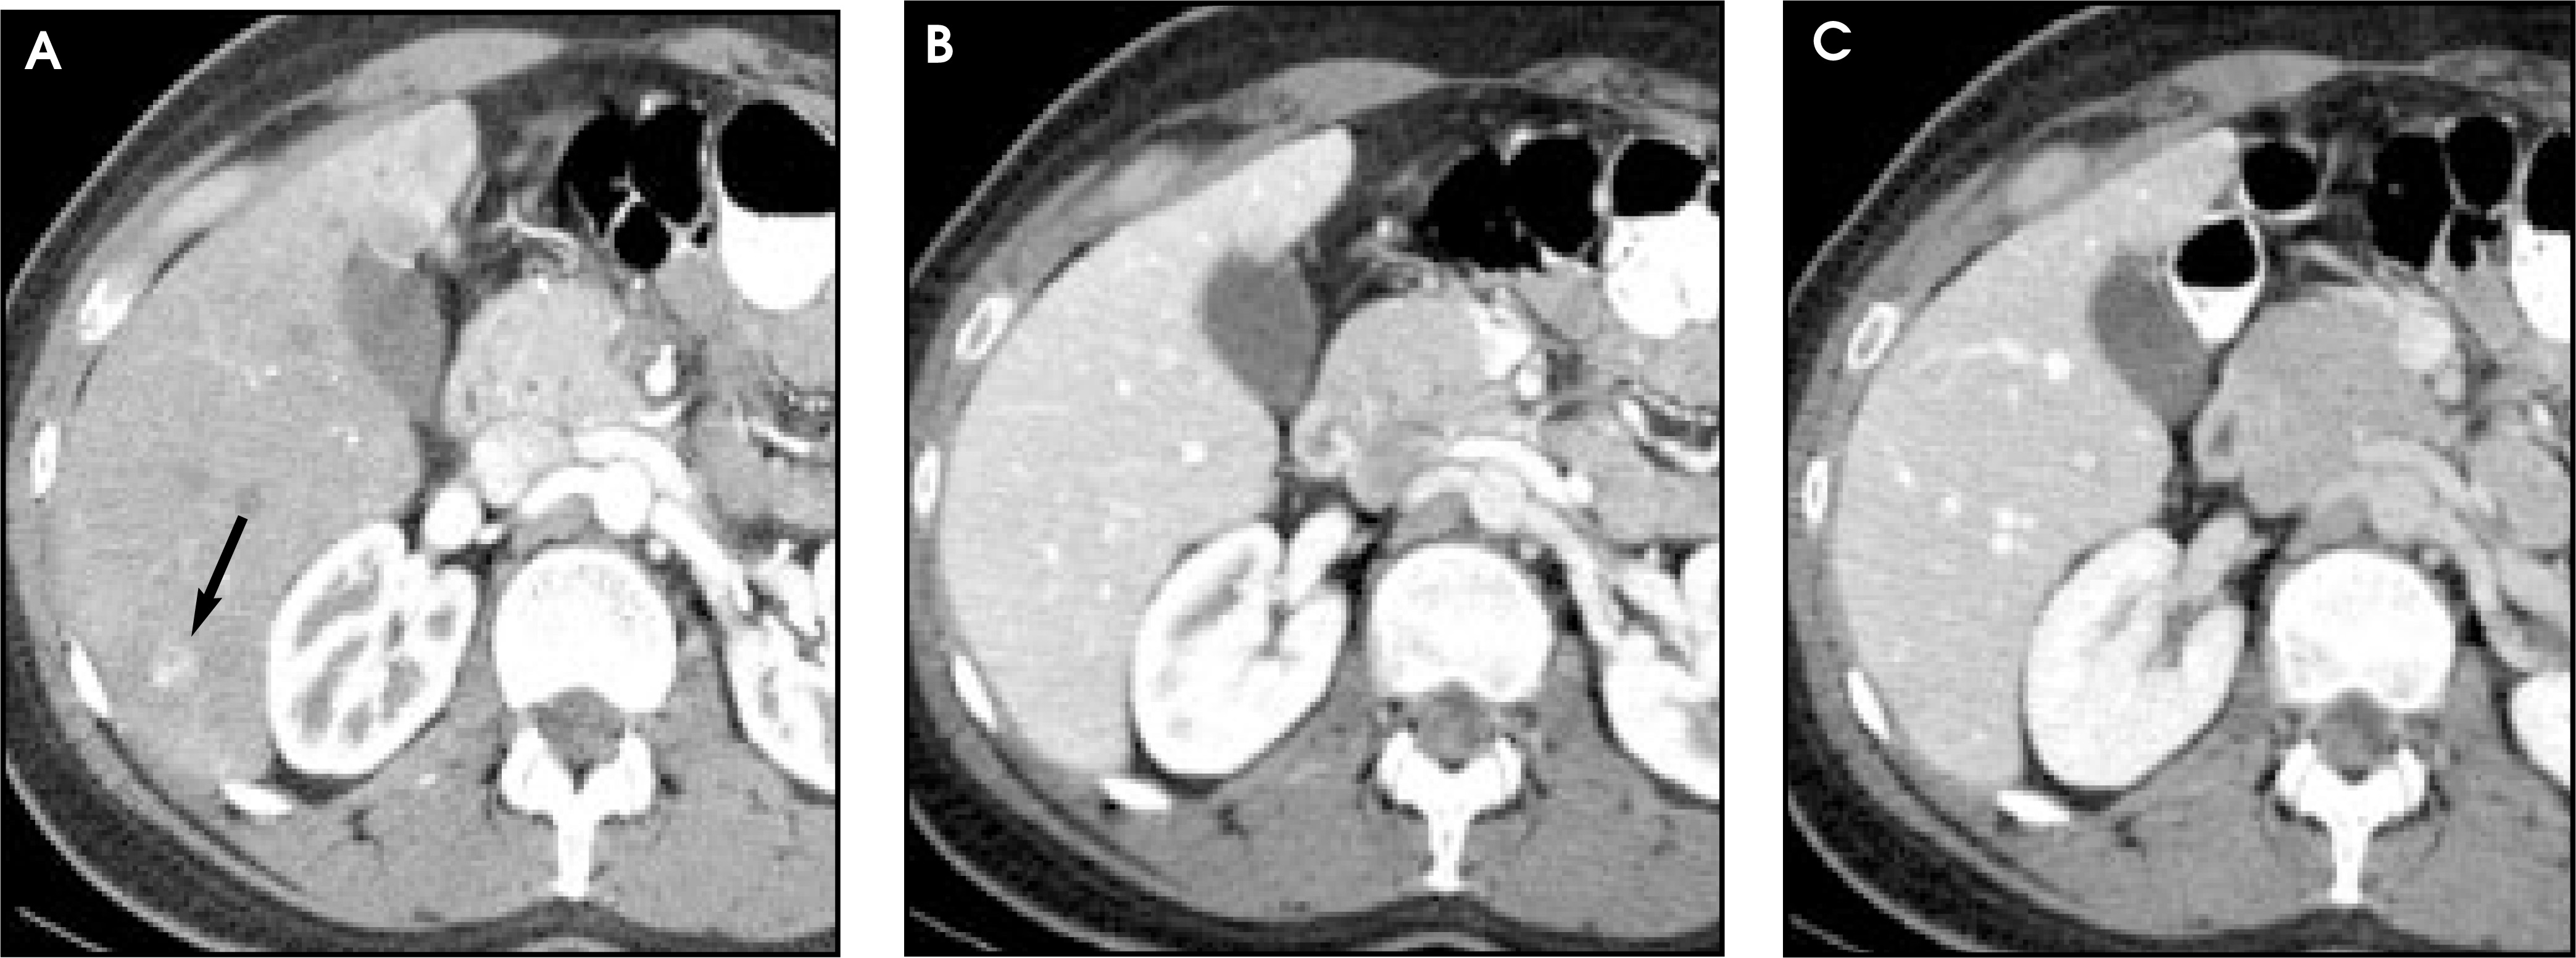
Higher concentration contrast in multislice CT
Detection of liver lesions is dependent on scanning during the phase that optimally distinguishes normal from abnormal tissue as discussed. Optimized imaging requires using adequate amounts of contrast, ie, grams of iodine.16 The grams of iodine have a direct impact on the difference in hepatic attenuation relative to lesion detection that defines the relative conspicuity of lesions (normal hepatic attenuation – liver lesion attenuation = lesion conspicuity).
Most recently, with the rapid proliferation of MSCT technology, the concept of using higher concentrations of contrast material has begun to be explored.16-18 The impetus for this has been that the standard contrast concentrations of 300 to 320 mg I/mL have required volumes on the order of 150 mL to deliver adequate grams of iodine to image the liver effectively. This is in contrast to examining other areas of the body, such as the chest, where the dose and volume of iodinated contrast can be significantly reduced (ie, 150 to 100 mL [helical CT] to 60 to 75 mL [MSCT]). Imaging of liver lesions requires more precise protocols. Studies of the liver with less than optimal contrast enhancement result in compromised lesion detectability. Fortunately, to date, prices of contrast material are not directly tied to grams of iodine within the product, but are most closely linked with the volume of contrast. Thus, if we can use lower volumes and higher concentrations of contrast, it has the additional benefit of becoming highly cost effective. With SSCT and helical scanning, protocols for body CT required volumes of contrast in the range of 150 mL with 300 mg I/mL and 320 mg I/mL to be able to have optimal enhancement of the liver and also provide adequate enhancement of abdominal and pelvic structures. With MSCT, this can be accomplished without requiring such large volumes since scans can be completed so rapidly. Thus, it becomes the challenge for radiologists to adopt new protocols to take advantage of this continually evolving technology.
Higher concentrations of contrast, 350, 370, and even 400 mg I/mL, have been developed and are being used clinically. If a target range of 37 to 48 grams of iodine is considered to image the liver, then this can be achieved by a number of different permutations of volume and concentration of contrast (Table 1). Higher concentrations of contrast also allow contrast delivery of the same grams of iodine per second to the target organ at lower rates. For example, the administration of 150 mL of 300 mg I/mL at 5 mL/sec delivers an iodine dose of 1.5 g/sec whereas the administration of 100 mL of 370 mg I/mL at only 4 mL/sec delivers essentially the same iodine dose of 1.48 g/sec. The ability to decrease the total volume of contrast will result in overall substantial cost savings in a busy clinical CT service.
Conclusion
The introduction of MSCT has created a new challenge for radiologists. These very fast scanners provide a great deal of flexibility for body imaging, especially in the liver. It also provides for very high-quality 3D vascular imaging, which can aid in surgical and therapeutic planning. It is only by understanding the flexibility of this new technology and new developments made by contrast companies in providing a variety of concentrations of contrast material that we can take full advantage and harness its potential for the benefit of our patients. AR
References
- Silverman P, Kalender W, Hazle J. Common terminology for single and multislice helical CT [commentary].. AJR Am J Roentgenol.. 2001;176:1135-1136.
- Silverman P. Multislice Computed Tomography: A Practical Approach to Clinical Protocols.. 2002.
- McCollough C, Zink F. Performance evaluation of a multislice CT system.. Med Phys.. 1999;26:2223-2230.
- Nelson R, Silverman P. Multislice CT: A new era. Basic technical aspects and clinical capabilities.. Helical (Spiral) CT Today.. 2000;6((1)):2-3.
- Ji H, McTavish J, Mortele K. Hepatic imaging with multidetector CT.. RadioGraphics.. 2001;21((suppl)):S71-S80.
- Klingenbeck-Regn K, Schaller S, Flohr T. Subsecond multislice computed tomography: Basics and applications.. Eur J Radiol.. 1993;31:110-124.
- Foley W, Mallisee T, Hehenwalter M. Multiphase hepatic CT with a multirow detector CT scanner.. AJR Am J Roentgenol.. 2000;175:679-685.
- Lu D, Vedantham S, Krasny R. Two-phase helical CT for pancreatic tumors: Pancreatic versus hepatic phase enhancement of rumor, pancreas, and vascular structures.. Radiology.. 1996;199:697-701.
- Weg N, Scheer M, Gabor M. Liver lesions: Improved detection with dual-detector-array CT and routine 2.5-mm thin collimation.. Radiology.. 1998;209:417-426.
- Kadota M, Yamashita Y, Nakayama Y. Valuation of small hepatocellular carcinoma with multidetector-row helical CT of the liver: The value of dual phase arterial scanning [abstract].. Radiology.. 1999;213((P)):124.
- Nelson R, Brink J, Silverman P, Silverman P. Multislice Computed Tomography: Principles, Practice, and Clinical Protocols.. 2002:169-230.
- Berland L, Smith J. Multidetector-array CT: Once again, technology creates new opportunities.. Radiology.. 1998;209:327-329.
- Hu H, He H, Foley W, Fox S. Four multidetector-row helical CT: Image quality and volume coverage speed.. Radiology.. 2000;215:55-62.
- Rubin G. Data explosion: The challenge of multidetector-row CT.. Eur J Radiol.. 2000;36:74-80.
- McCullough C, Bruesewitz M, Zink F, Johnson C. CT colonography (CTC) using a multislice scanner: Optimization of scan acquisition parameters [abstract].. Radiology.. 1999;213((P)):97.
- Silverman P. Optimizing contrast use in multislice CT.. Appl Radiol.. 2002;31((3 suppl)):10-12.
- Nelson R. High-concentration contrast delivers in hepatic imaging.. Appl Radiol.. 2002;31((3 suppl)):13-16.
- Foley D. CTA of extremities: New approaches to scanning, contrast use.. Appl Radiol.. 2002;32((3 suppl)):30-33.
Citation
. Contrast usage for liver imaging in the era of MSCT, MDCT: Part II. Applied Radiology. 2003;32(6):24-30. doi:10.37549/AR1194.