Contrast usage for liver imaging in the era of multislice (MSCT), multidetector (MDCT) CT: Part I
Applied Radiology — Vol. 32 , Issue 5 , pp. 28 -34
DOI: 10.37549/AR1184
Published: May 1, 2003
Categories
In the 1970s, while employing traditional “step-and-shoot” computed tomographic (CT) technology, significant efforts were made to prolong contrast administration so that it continued for the duration of the scan.1-5 Thus, examinations that required long scanning times (ie, excessive coverage in the z-axis) necessitated the use of relatively large volumes of contrast (150 to 175 mL) at slow rates. In order to achieve adequate contrast enhancement of the liver, a bolus followed by a drip infusion or multiple injection rates using a power injector were used. Biphasic injections with an initial fixed rate of 1 to 3 mL/sec for the early portion of the examination and even slower rates for the latter portion of the study were common.6,7 Concentrations of iodinated contrast rarely exceeded 300 mg I/mL. Higher-concentration contrast materials were, in fact, detrimental, since the volume needed would result in delivery of excessive grams of iodine. The use of power injectors was found to provide a greater level of consistency for contrast enhancement compared with a manual injection technique, but the rate of contrast injection was limited because of slow scanner technology and a general inexperience by practicing radiologists.8,9 Significant safety concerns regarding the adverse effects of extravasation of commonly used ionic contrast media were recognized.10-13
Helical CT contrast dynamics
The introduction of single-slice helical (spiral) CT scanning in the 1980s allowed for the elimination of the standard interscan delay of 6 to 7 seconds between slices. The continuous acquisition of slices with a scan time of 1 second and breath-hold acquisitions ranging from 15 to 30 seconds had a profound impact on allowing imaging during optimal phases of contrast enchancement.14-19
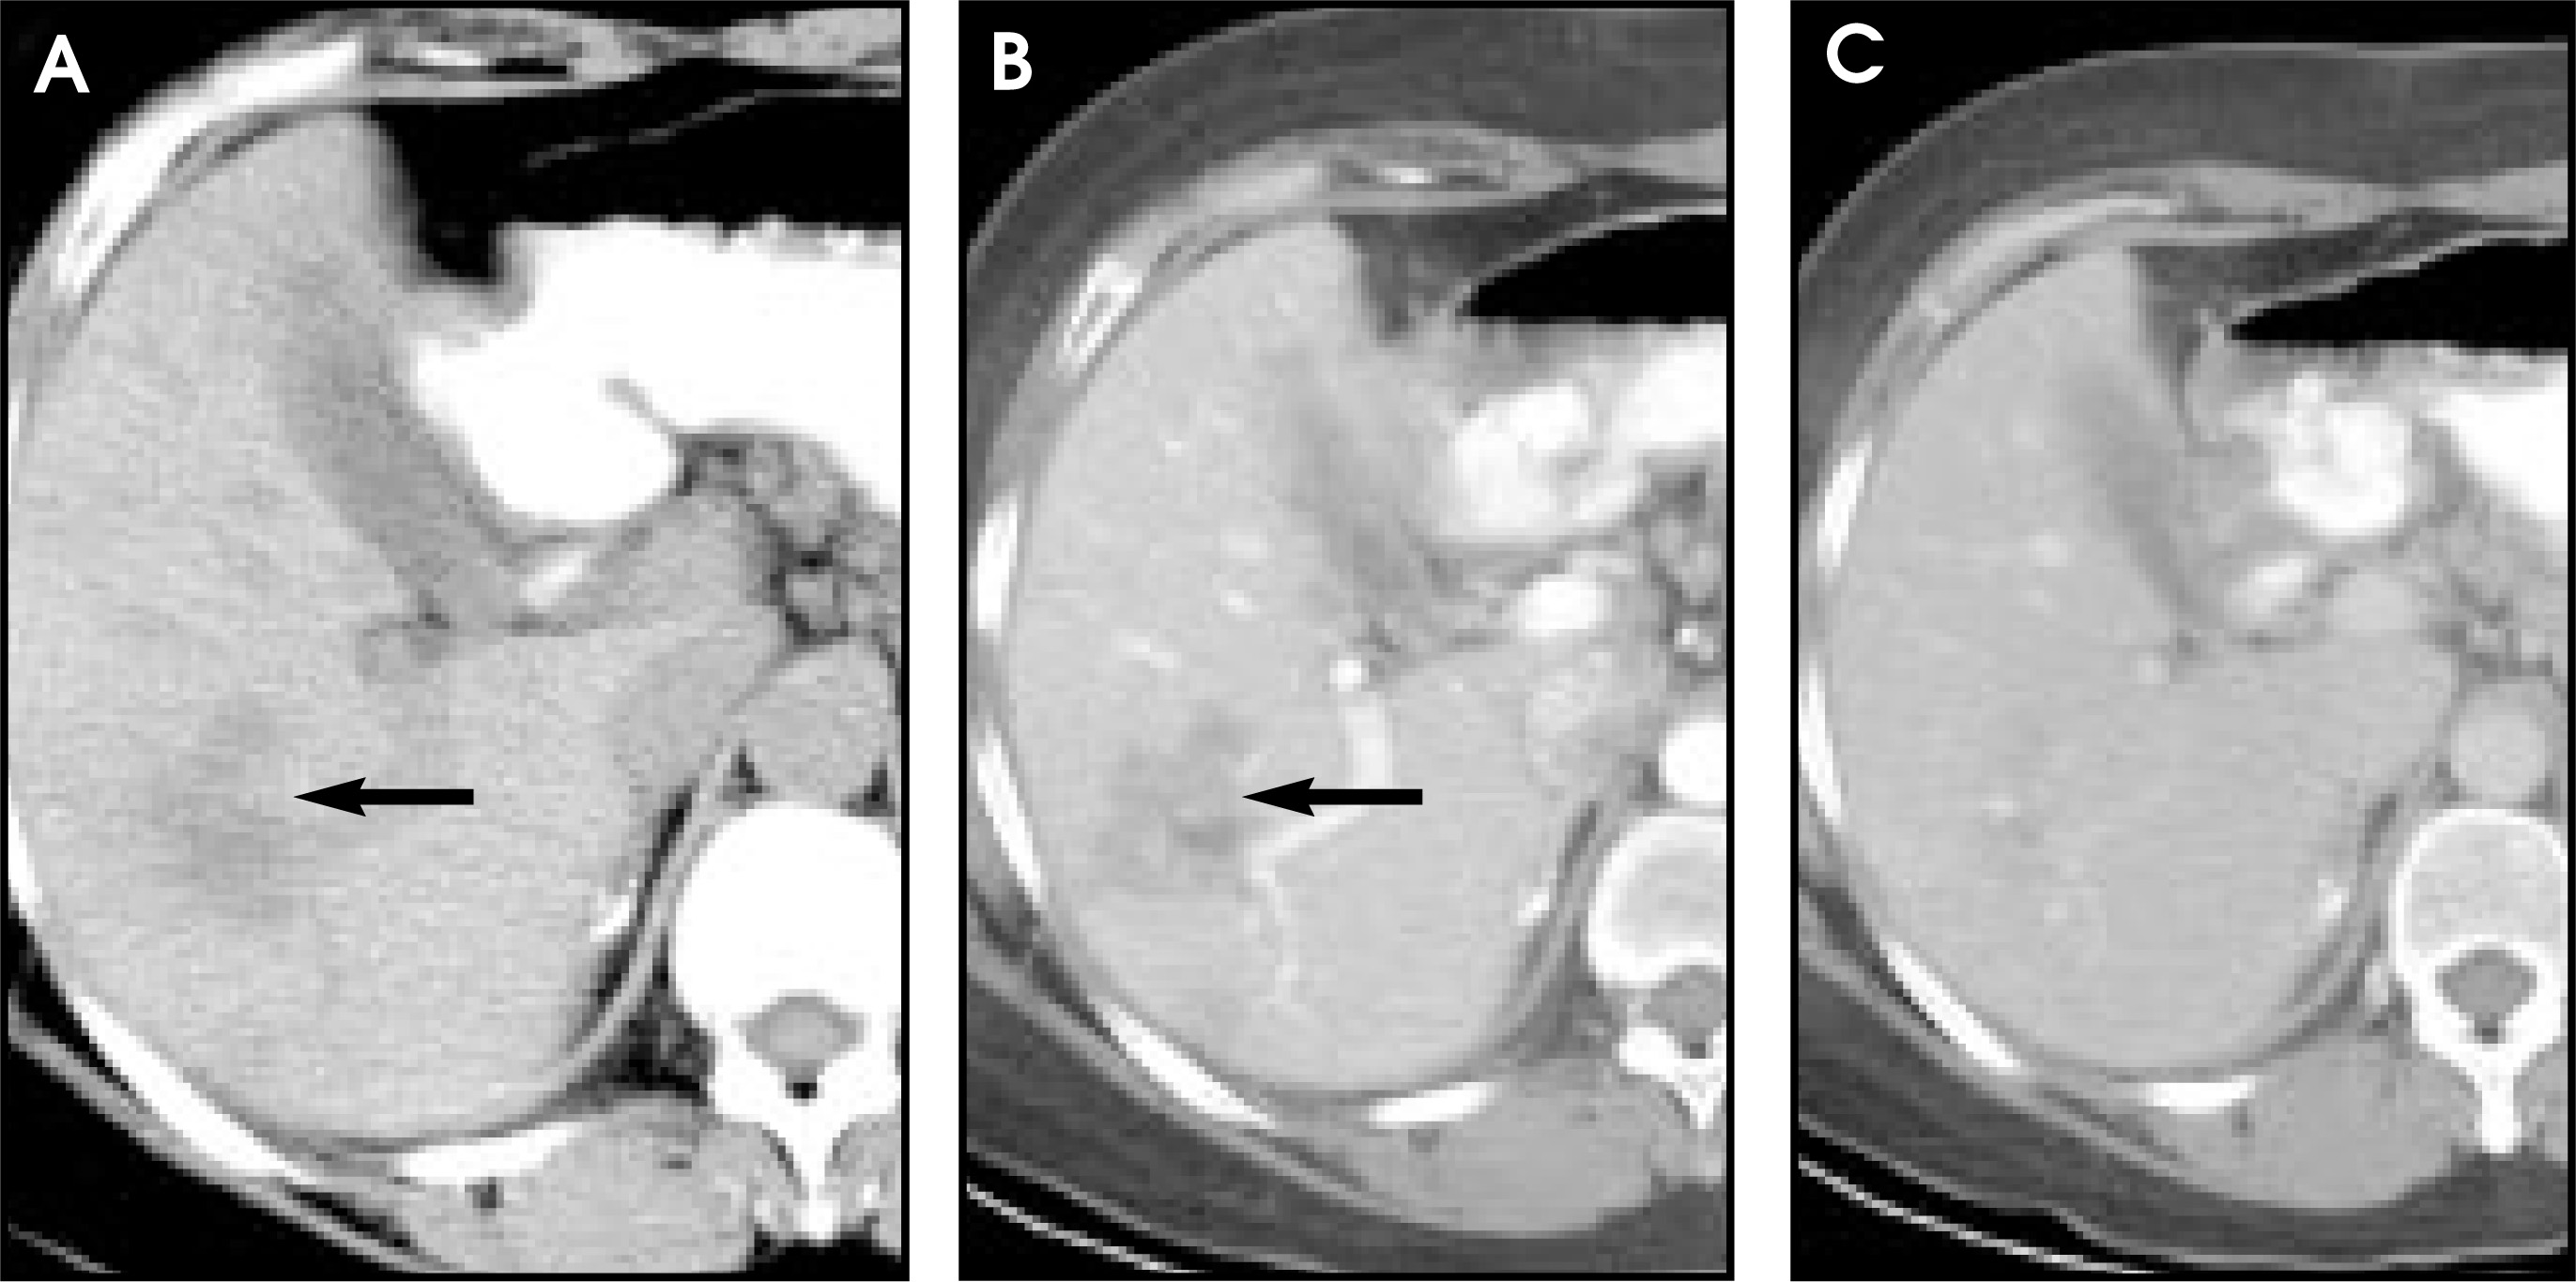
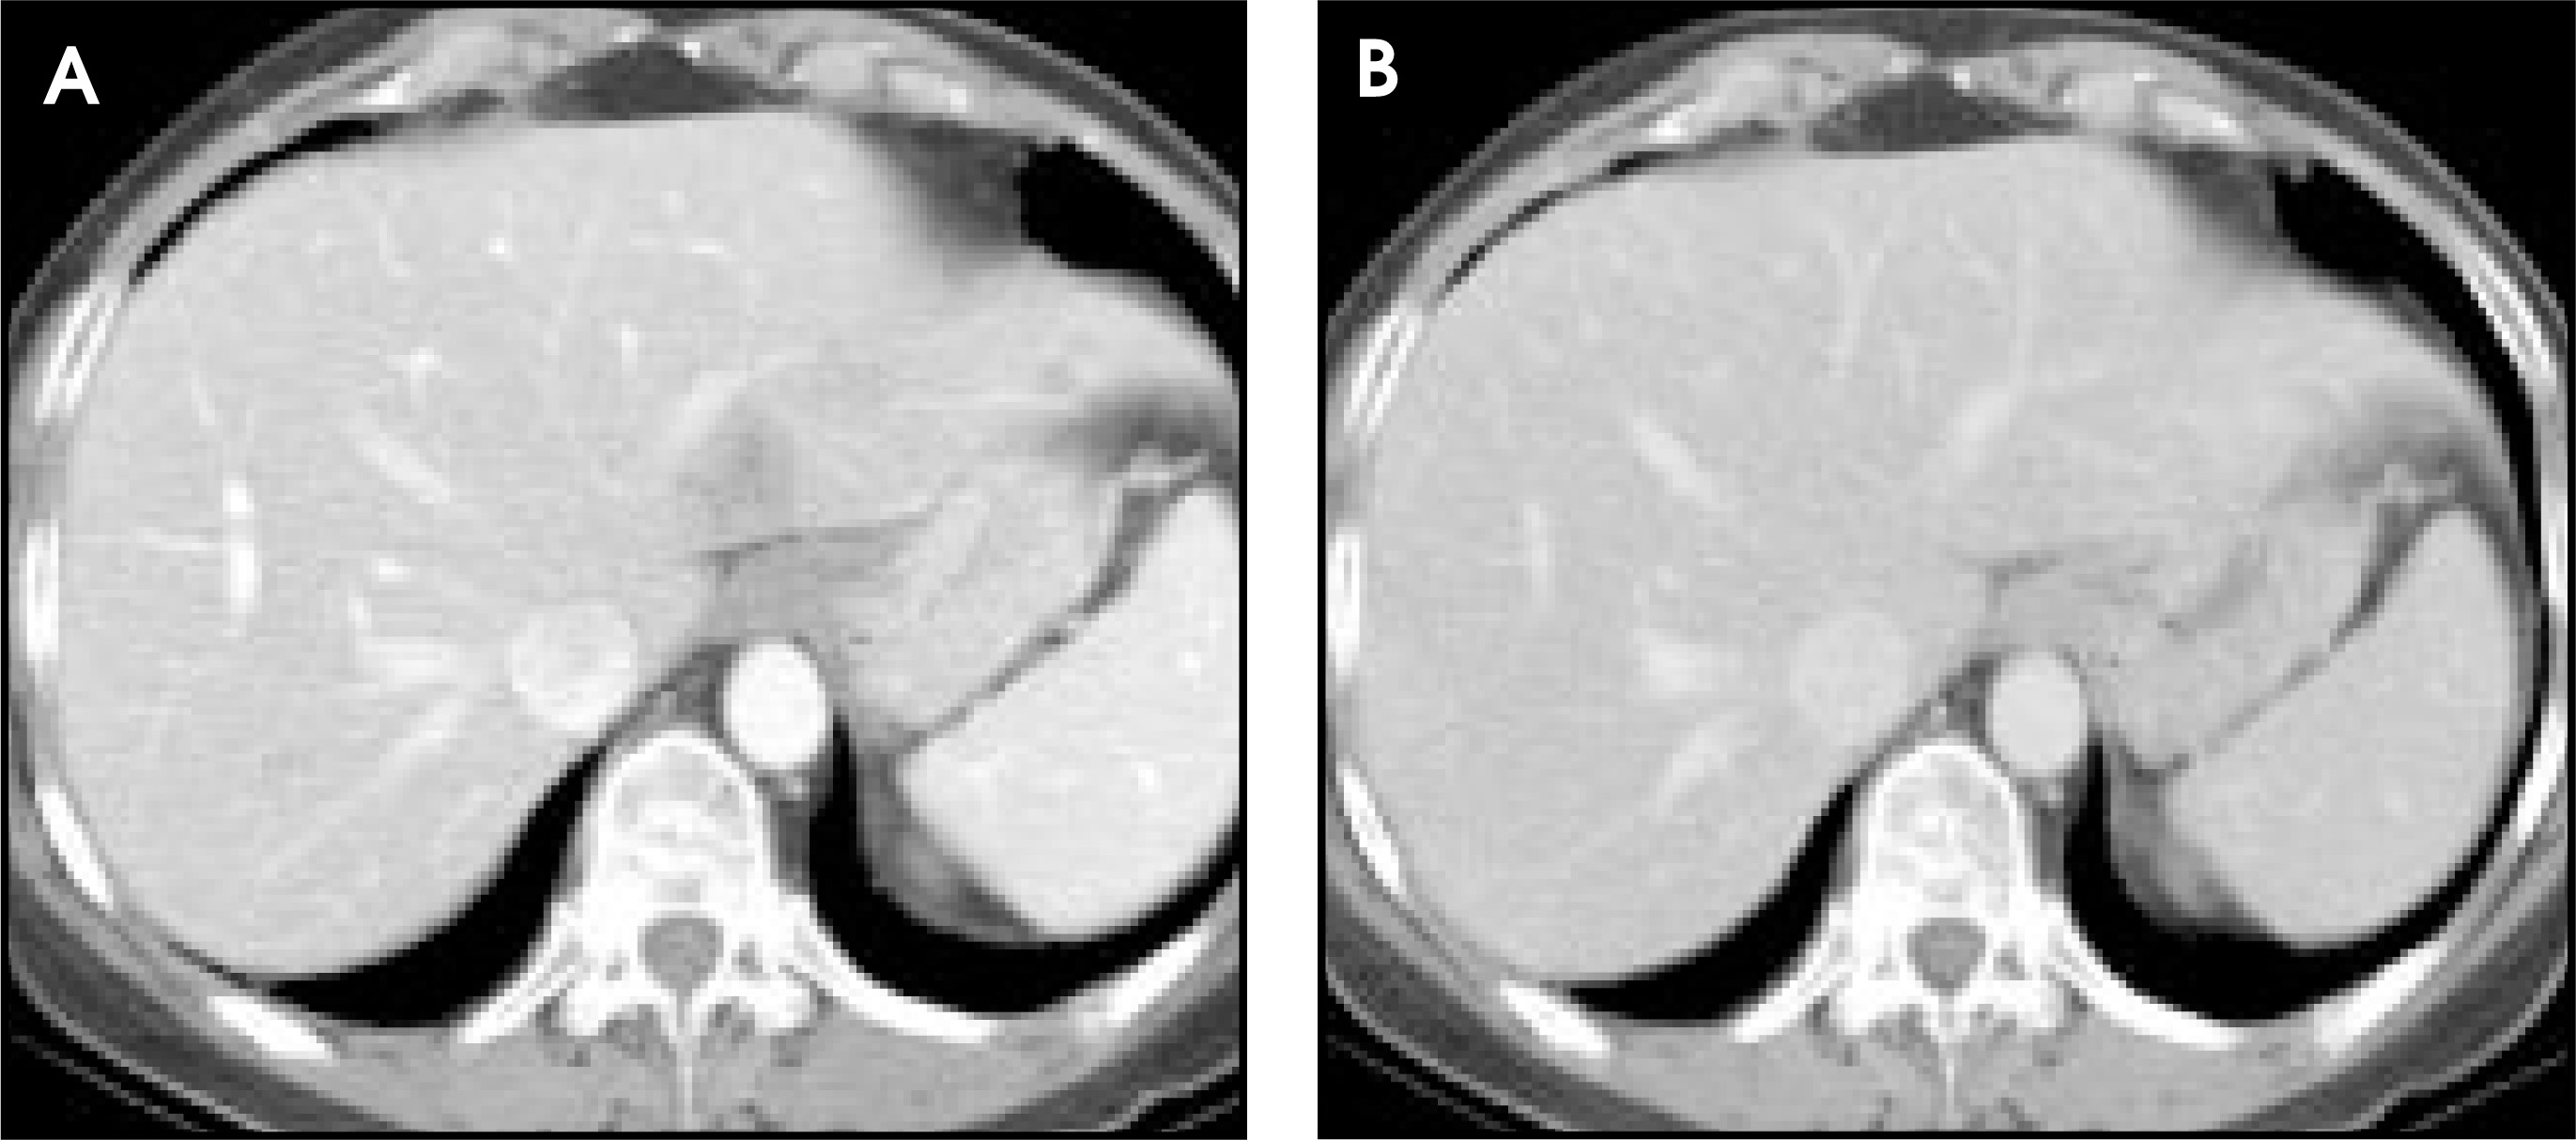
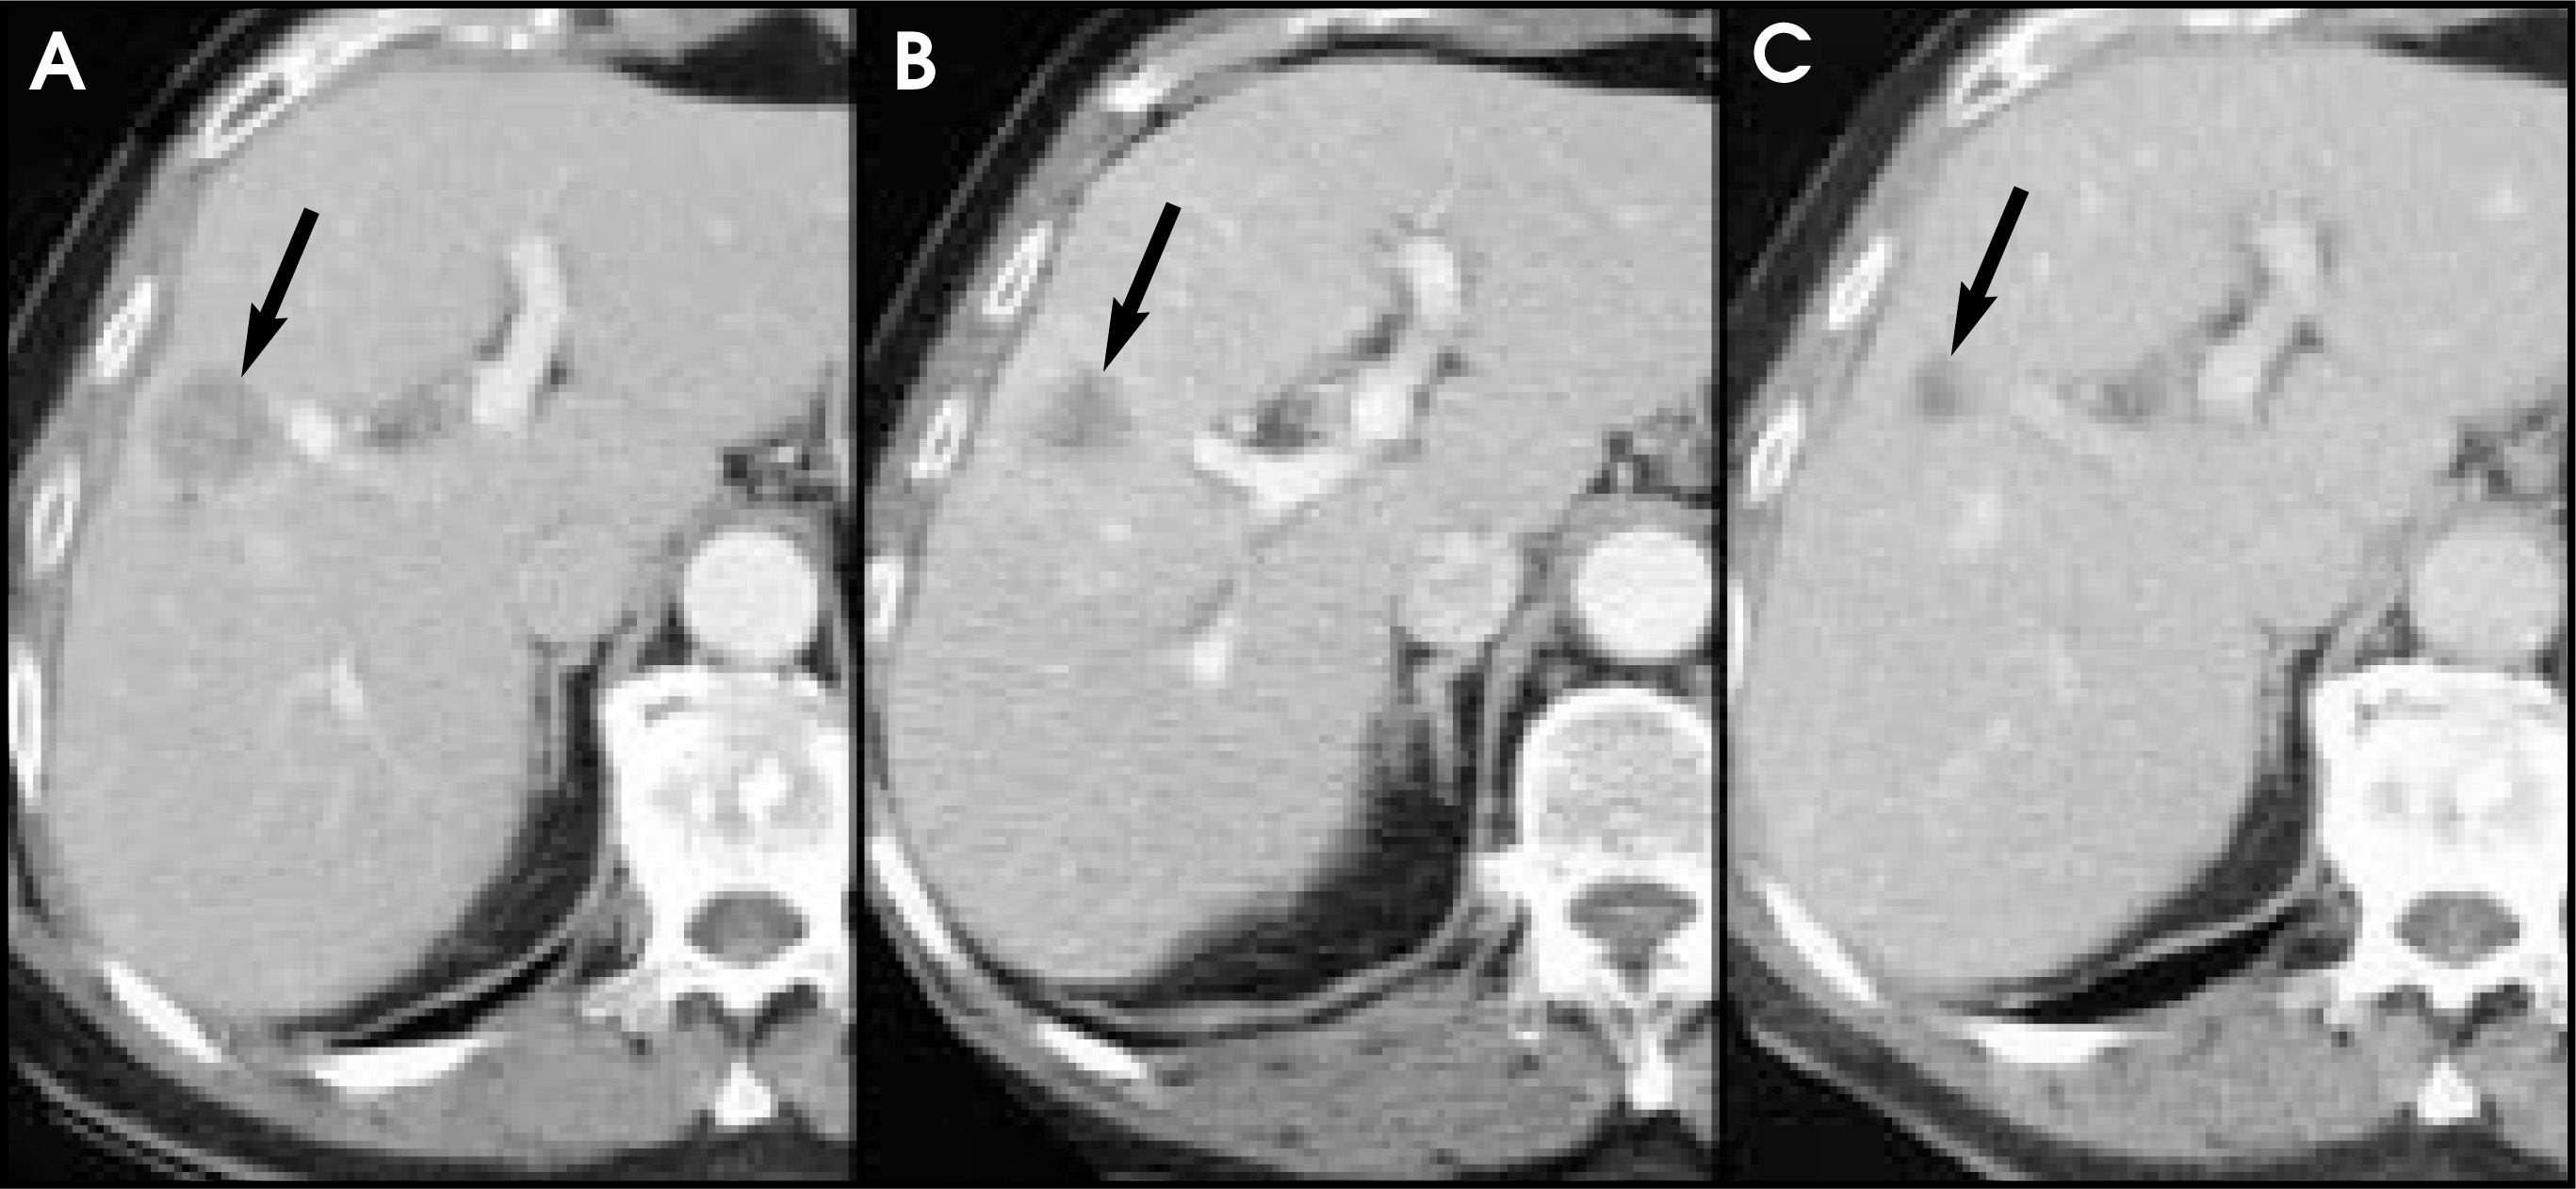
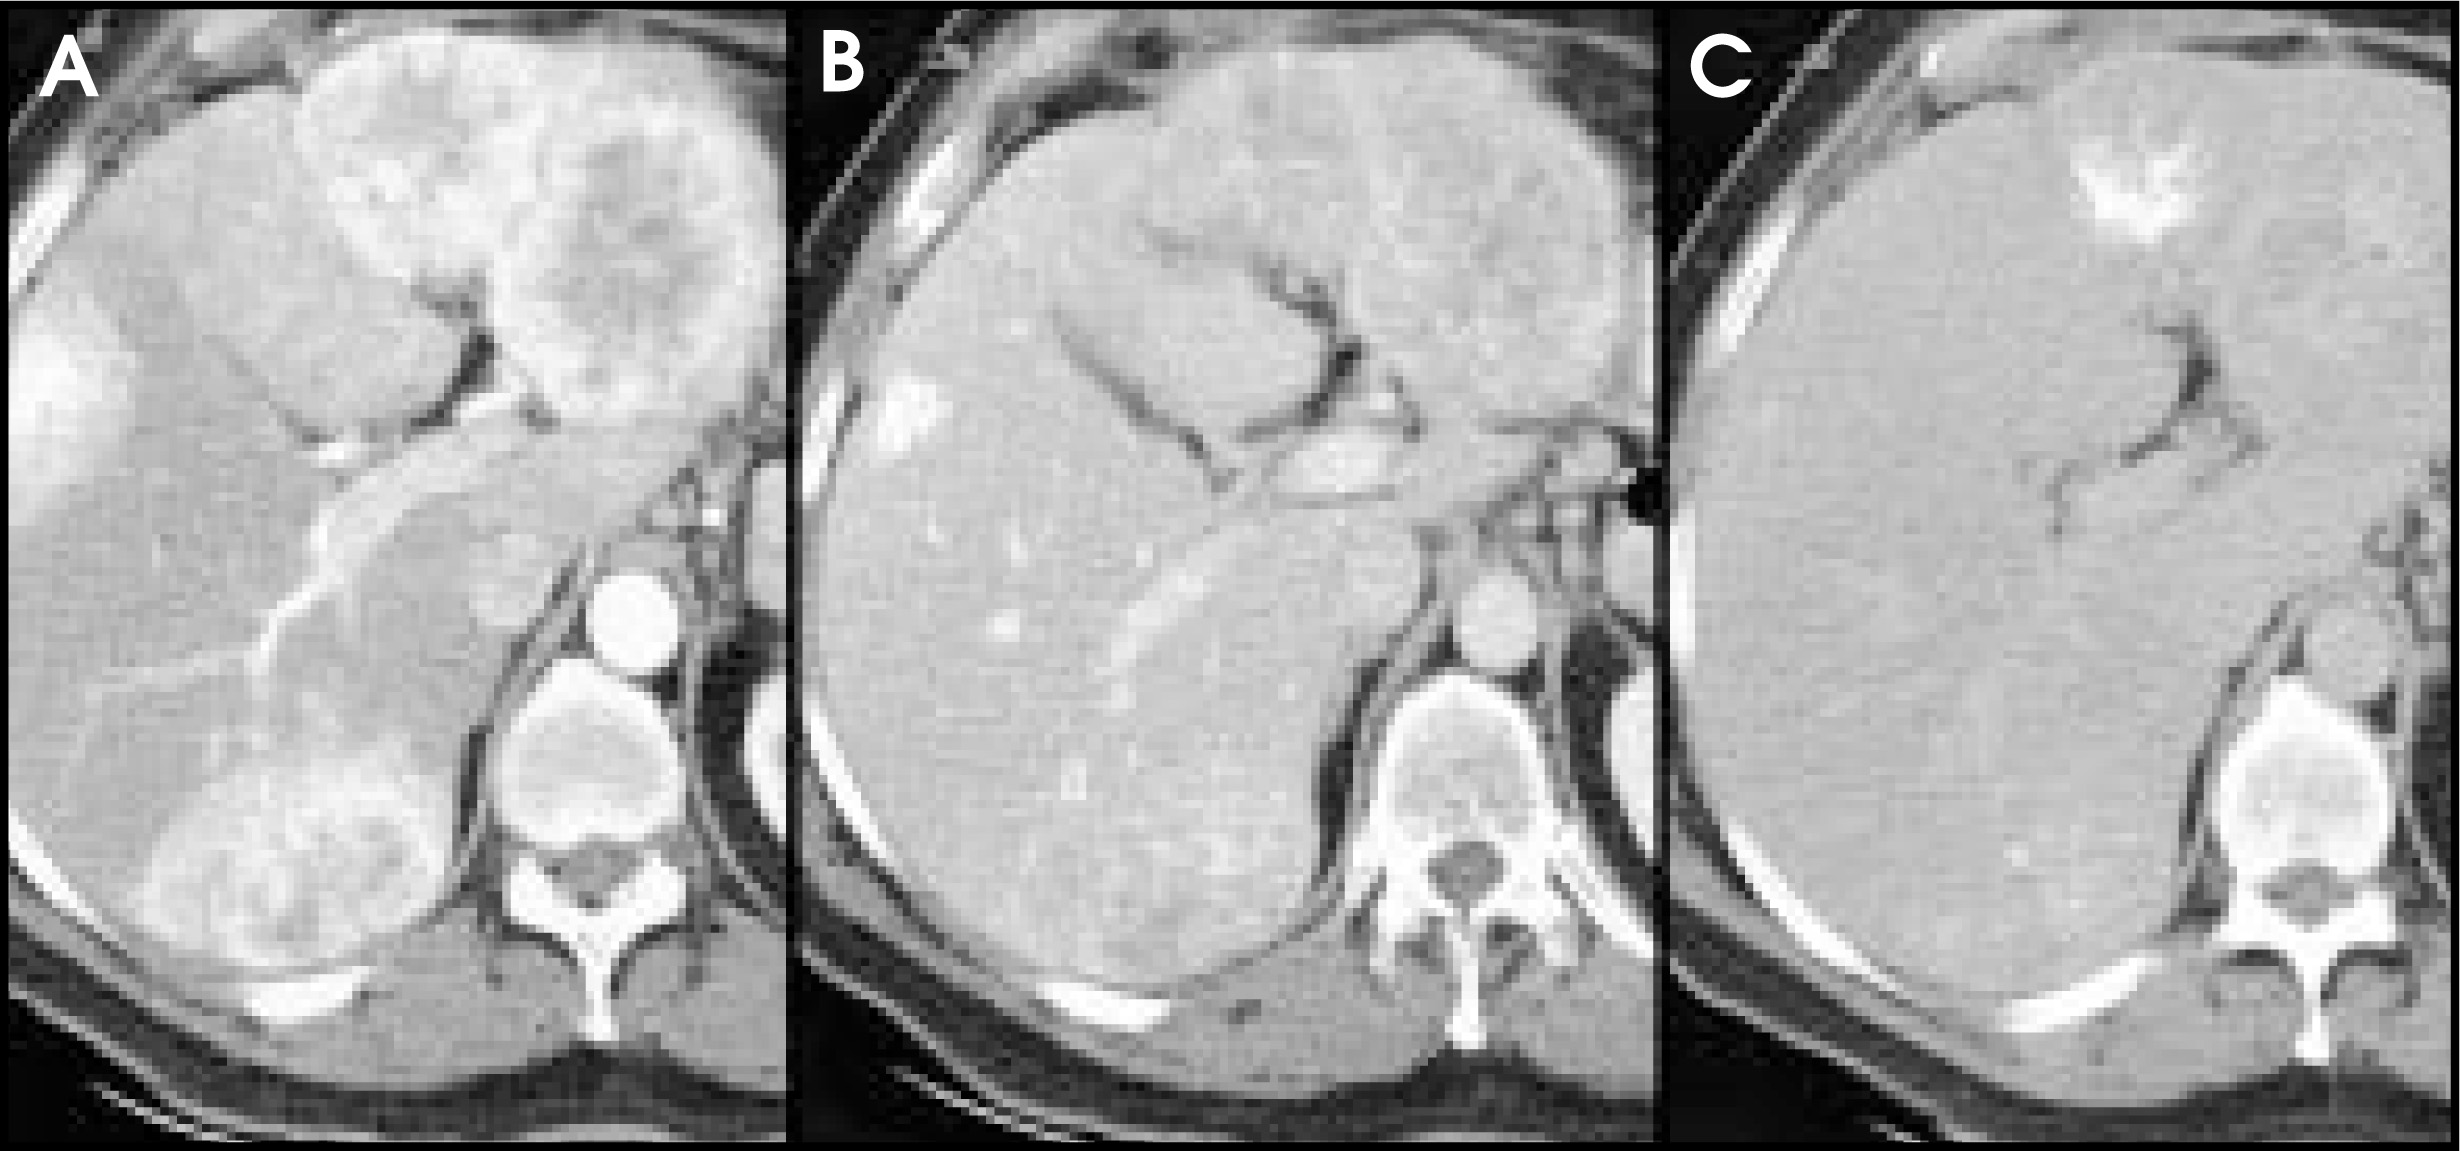
The organ for which this impact was most profound was the liver. With the introduction of helical scanning, the entire liver could be imaged during the portal venous phase (PVP). This was ideal for detecting the vast majority of liver lesions, which are hypovascular in nature and can be detected by virtue of their lower density compared with the surrounding densely enhanced liver parenchyma (Figure 1). Radiologists could perform examinations of the entire liver, avoiding the “equilibrium phase” during which lesions often become less visible or even isodense and invisible to detection (Figures 2 and 3). Whole-organ scanning became a near-reality.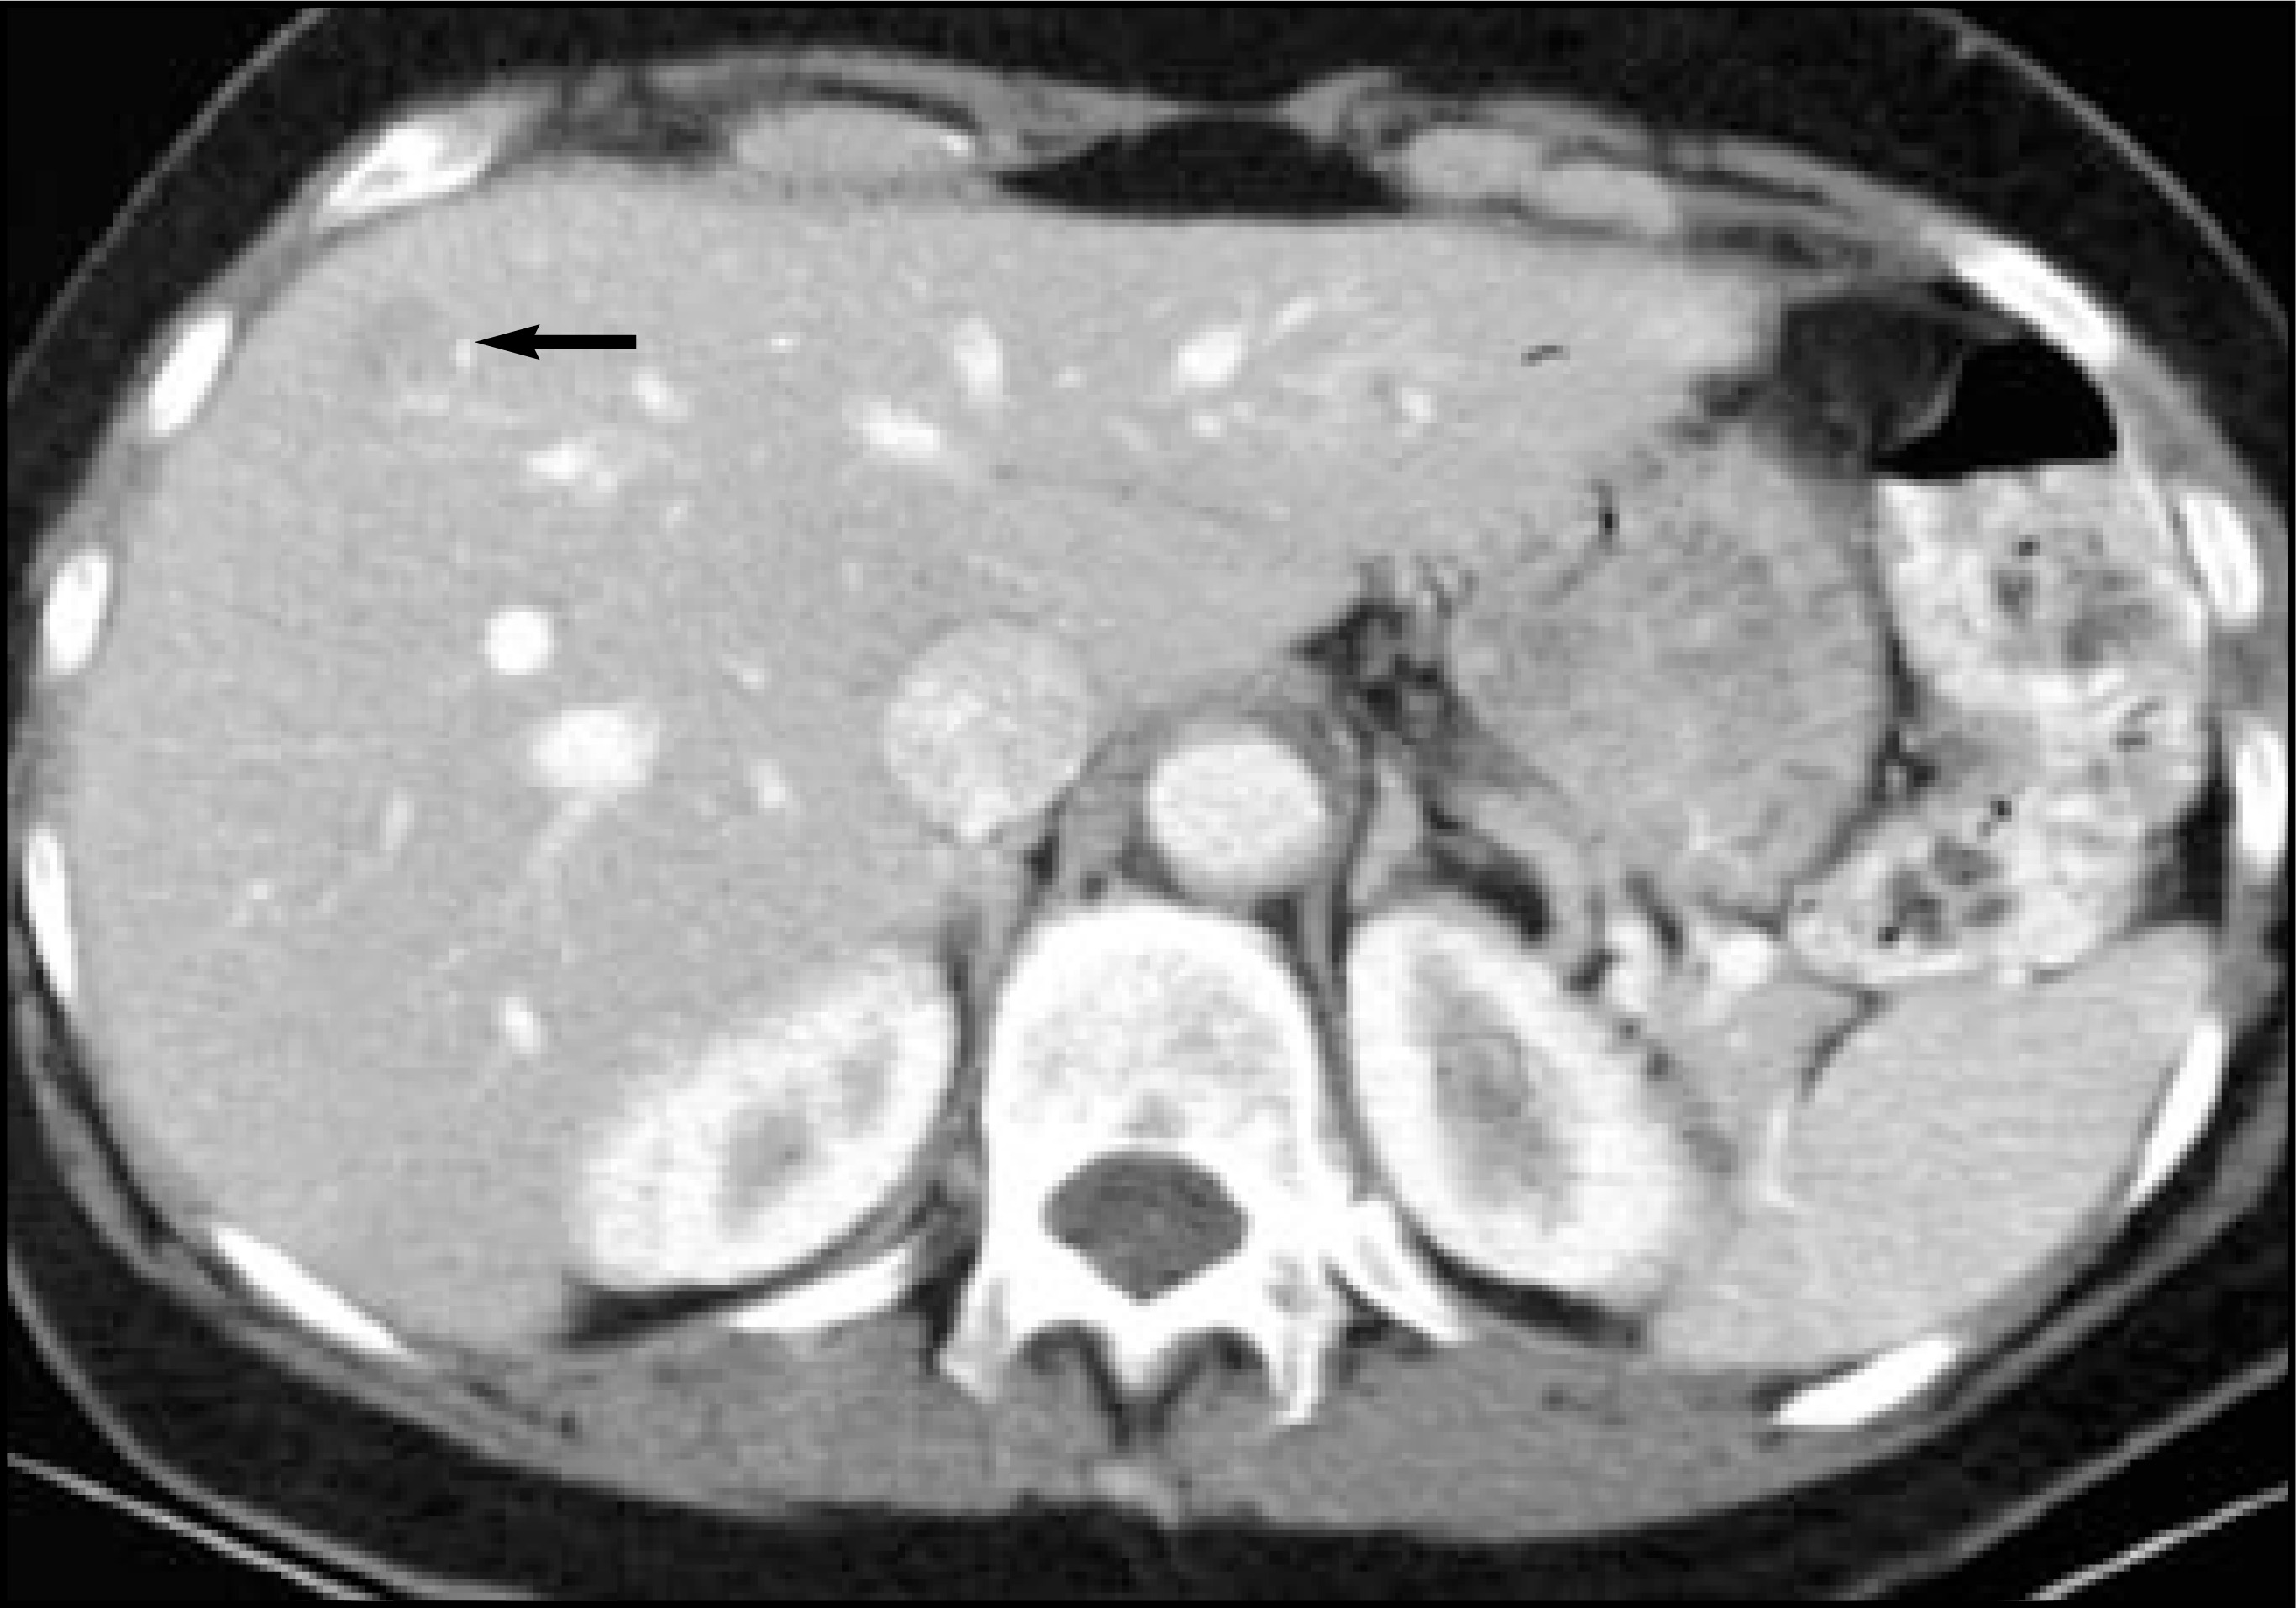
With helical CT and subsecond helical scan times, optimal liver imaging was combined with improved image quality. It also allowed for extended examinations of the lower abdomen, pelvis, and chest with decreased motion artifact. The standard contrast agents used in the early years of CT were still primarily ionic, high-osmolar contrast material (HOCM), which had the benefit of being relatively inexpensive.20-22 However, with more widespread availability of newer and safer nonionic, low-osmolar contrast material (LOCM) and a concomitant decrease in their price, these new nonionic agents were used selectively. With the widespread use of power injectors, increased rates of contrast administration were employed to match faster scanners. In order to avoid even mild adverse reactions, which could ruin an entire helical acquisition, LOCM began to be used more widely, almost universally.20
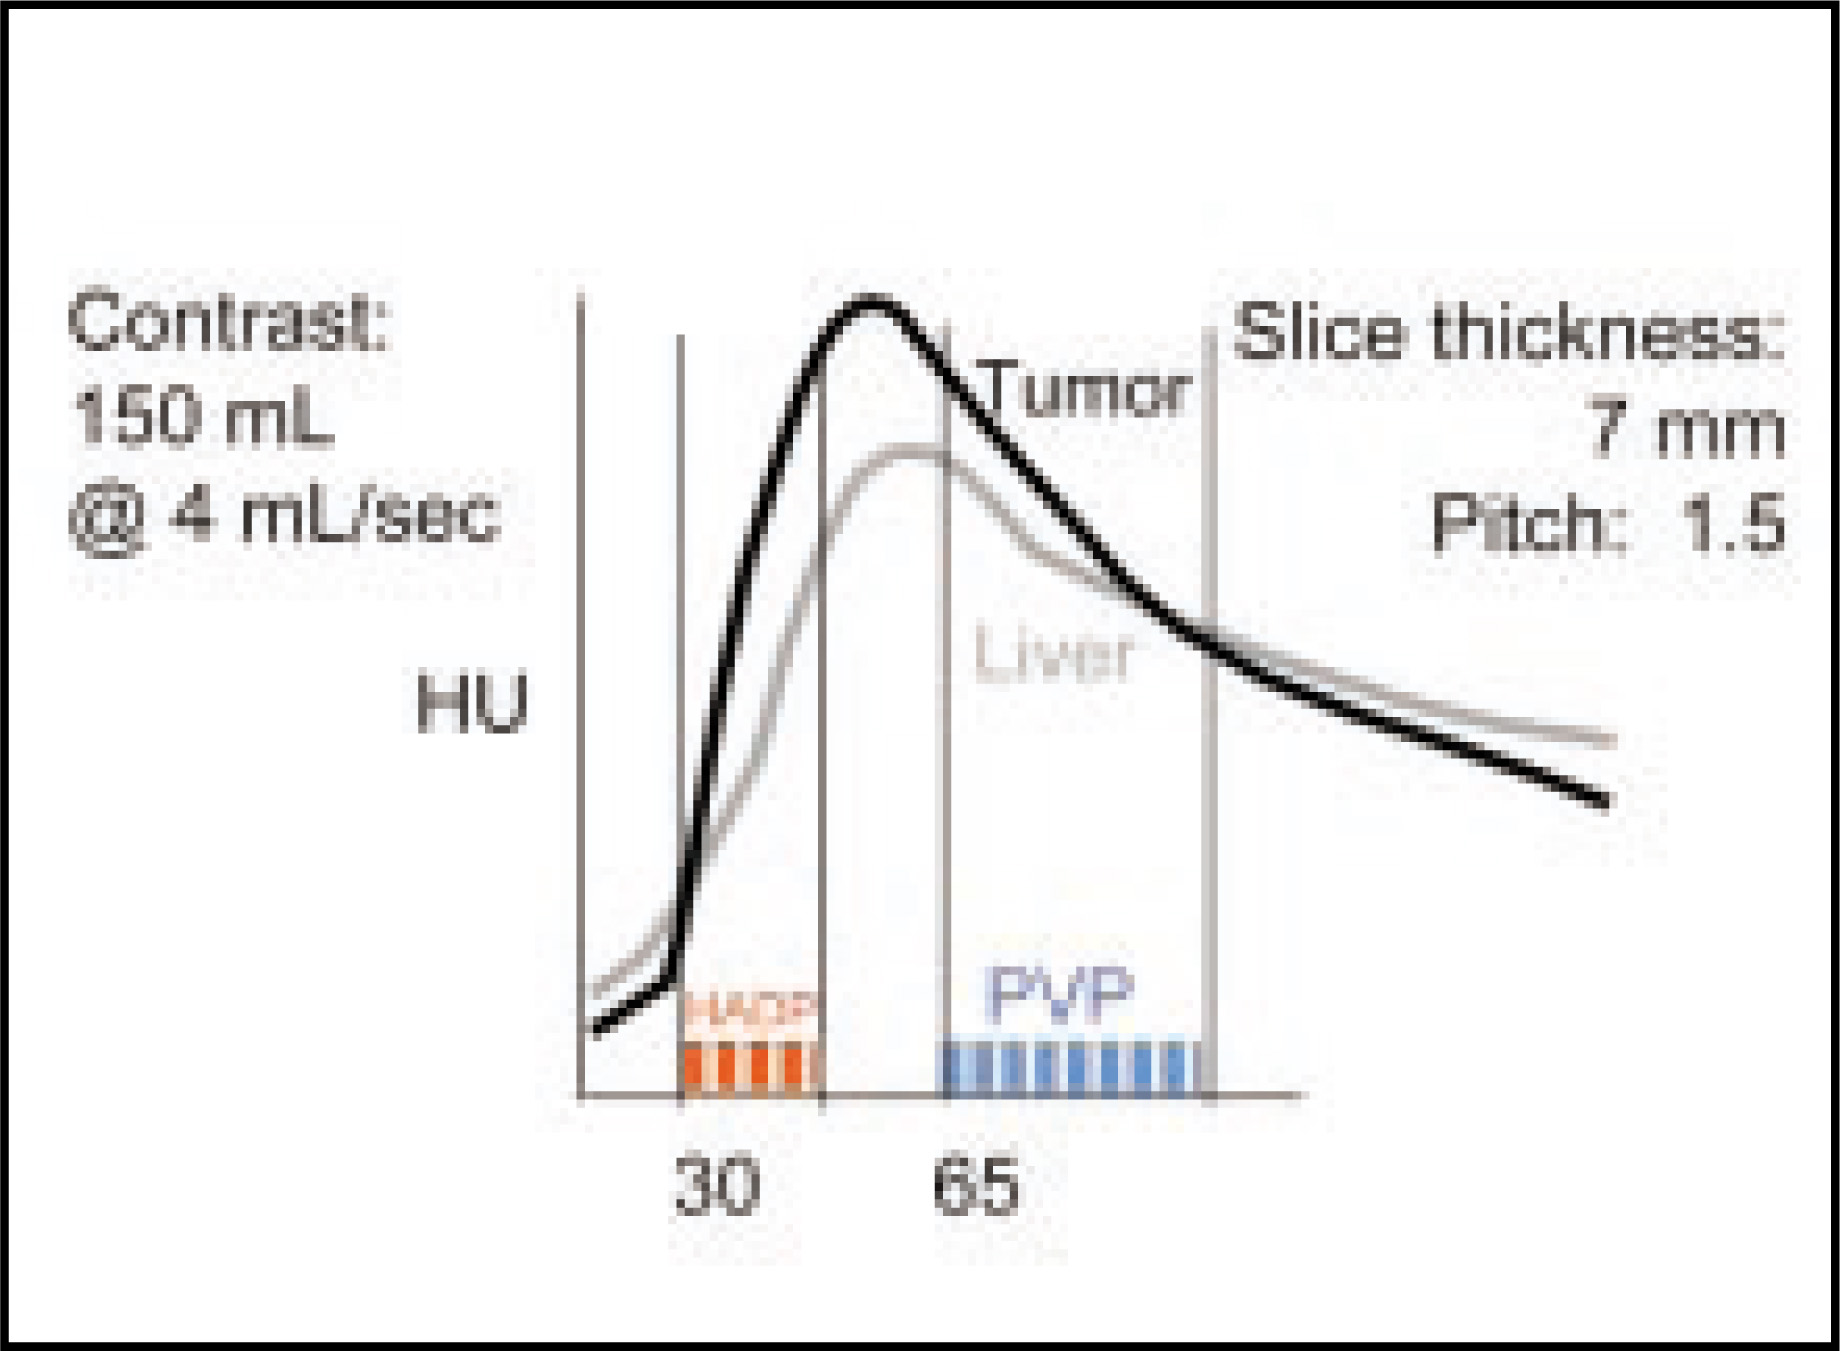
Understanding the contrast dynamics in a structure as complex as the liver became important with the new scanning flexibility afforded by single-slice helical CT. Time-density curves of the liver and lesions became more prevalent as a means to understanding how protocols could be developed to better detect liver lesions with this new technology (Figure 4).23-26 The liver enhancement curve is characterized by a fairly steep uprise, although not as dramatic an uprise as an aortic enhancement curve. It reaches a plateau followed by a slow and prolonged downward curve. When a curve is made of tumor enhancement for hypovascular lesions, the vast majority of metastases generally have a slower upswing with a longer time to peak enhancement, which is shorter than the time to peak enhancement of the liver. Hypovascular metastases then have a slow degradation of enhancement. The point at which the liver and tumor enhancement curves begin to parallel each other and decline is the “equilibrium phase.”24,27,28 Although it is not truly representative of equilibration of contrast at the cellular level, this phase does illustrate an important phenomenon. It is during this phase that it is most dangerous to image the liver, since lesions are less easily discriminated from the surrounding liver. This can result in erroneous interpretation of disease becoming smaller for technical reasons without a true improvement of the disease (ie, regression or cure) (Figure 5).29-34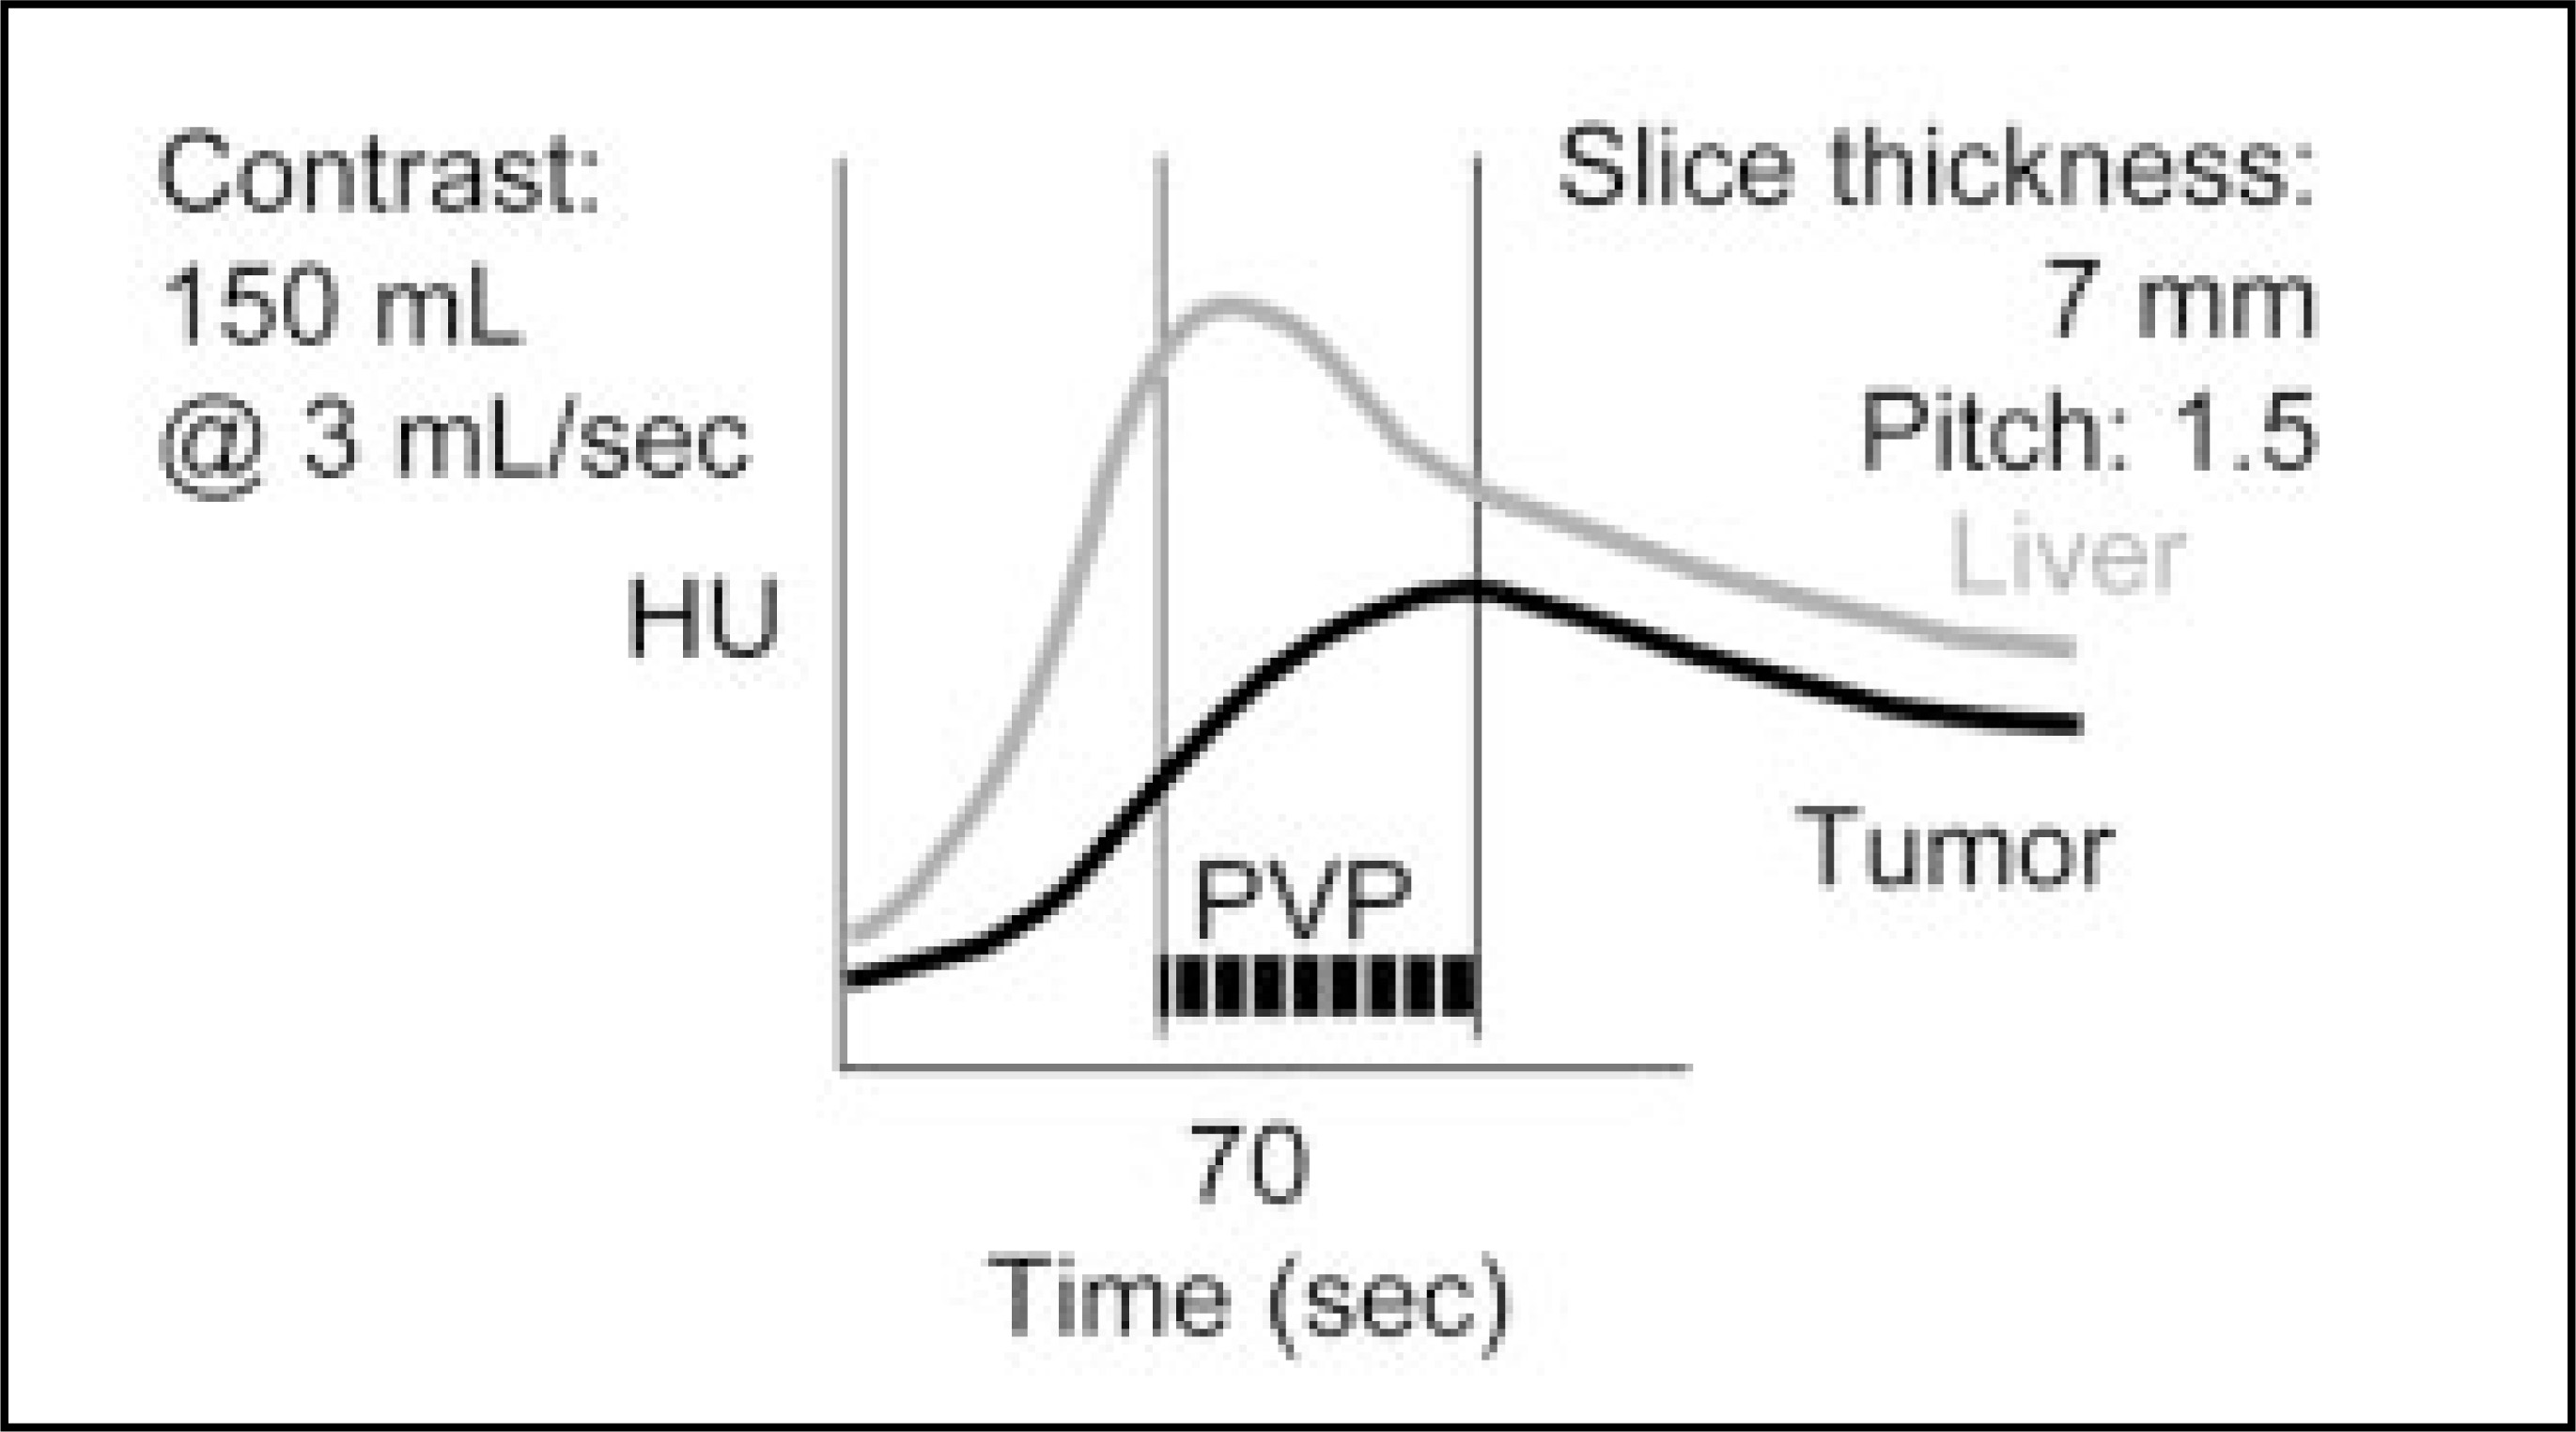
Contrast-enhancement protocols for helical CT
Optimal characterization of lesions mandates careful technique. It is imperative that routine hepatic scanning be performed during the optimal PVP, which occurs approximately 70 seconds after the initiation of injection and extends just to the point prior to the beginning of the equilibrium phase. For optimal imaging, one would like to have the maximal difference in enhancement between the liver and the lesion during the time the scans of the liver are performed. The faster the scanner, the more easily one can image purely during this phase, eliminating the equilibrium phase and the chance of liver lesions becoming less conspicuous.
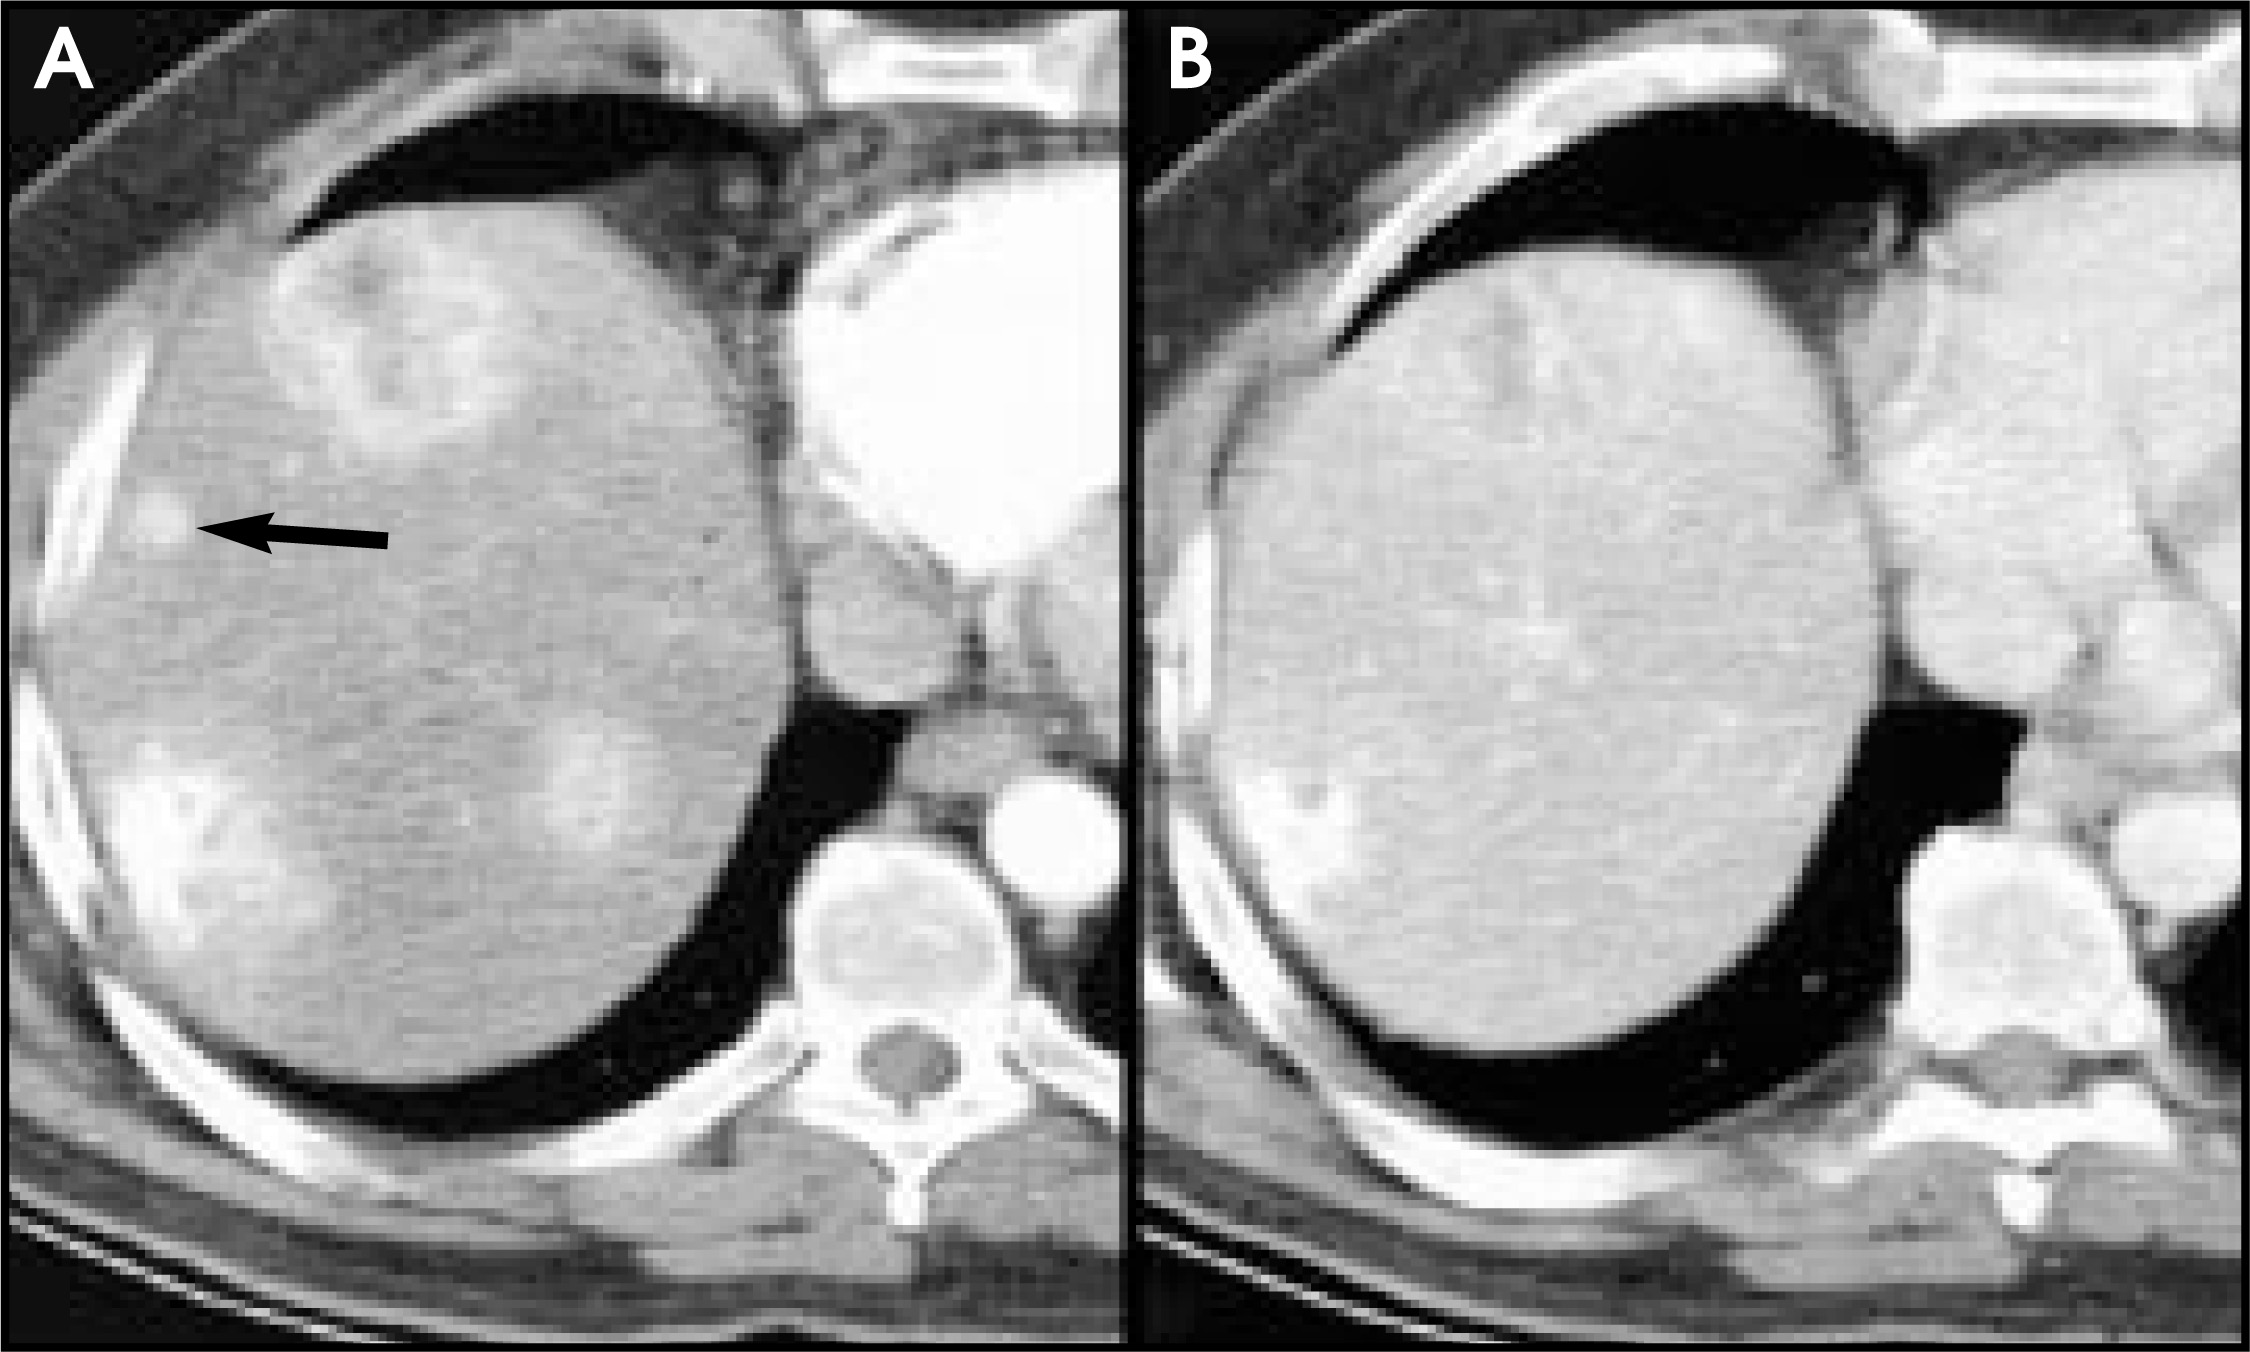
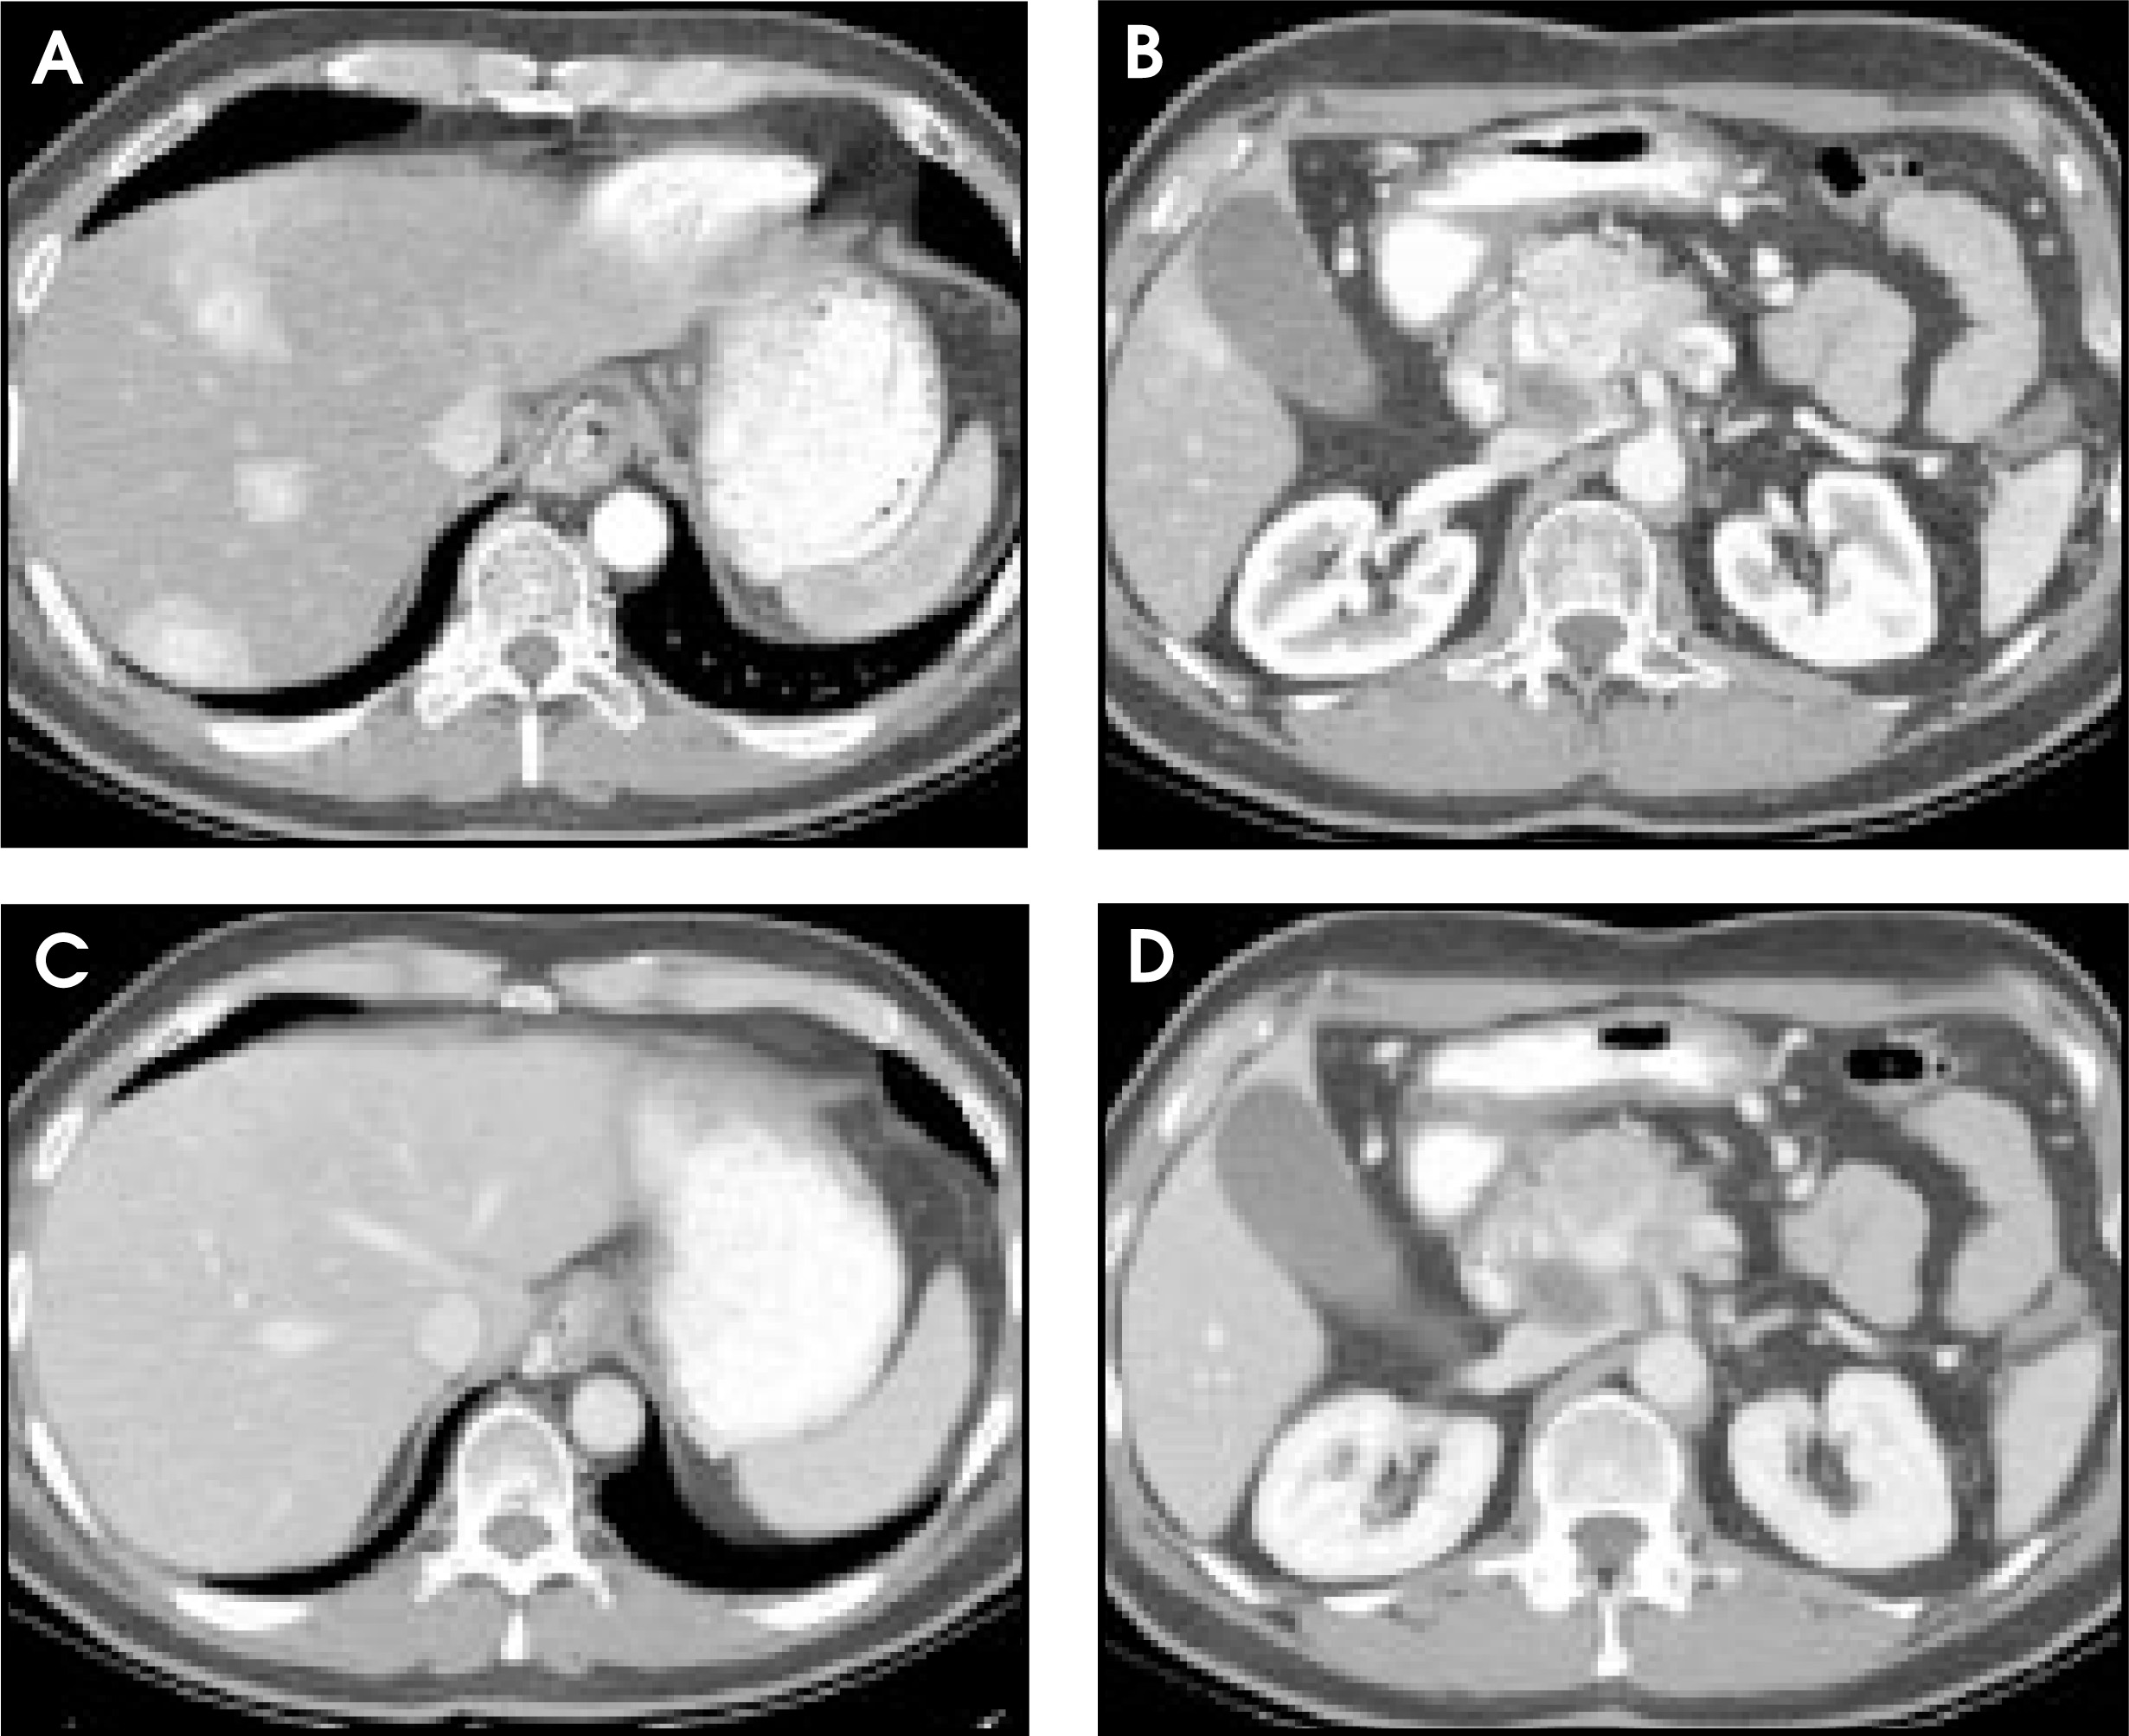
Understanding contrast enhancement protocols, especially for liver imaging, became more critical with helical scanning, since it provided the flexibility of imaging during the optimal PVP to detect hypovascular liver lesions.35 Also, for the first time, exploitation of multiphasic imaging was possible, allowing the behavior of lesions to be followed over time. Characterization of benign lesions (such as cavernous hemangioma, adenoma, and focal nodular hyperplasia) became a common role for CT (Figure 6). With the use of multiphasic imaging, scanning could be performed early in the bolus, the hepatic arterial dominant phase (HADP), 15 to 20 seconds after contrast administration, and then later at 65 to 70 seconds to catch the PVP (Figures 7 through 10). Detection of hypervascular lesions by CT could also be achieved utilizing early scans prior to peak liver enhancement.25,33-34 Malignant hypervascular lesions include primary tumors, such as hepatocellular carcinoma, hemangioendothelioma, and angiosarcoma. Hypervascular metastases include renal cell carcinoma, carcinoid, thyroid carcinoma, neuroendocrine tumors, choriocarcinoma, melanoma, and, in some cases, breast cancer. All of these hypervascular tumors are best imaged when an early enhancement phase, HADP, is included; frequently, these tumors can be imaged only in this early phase.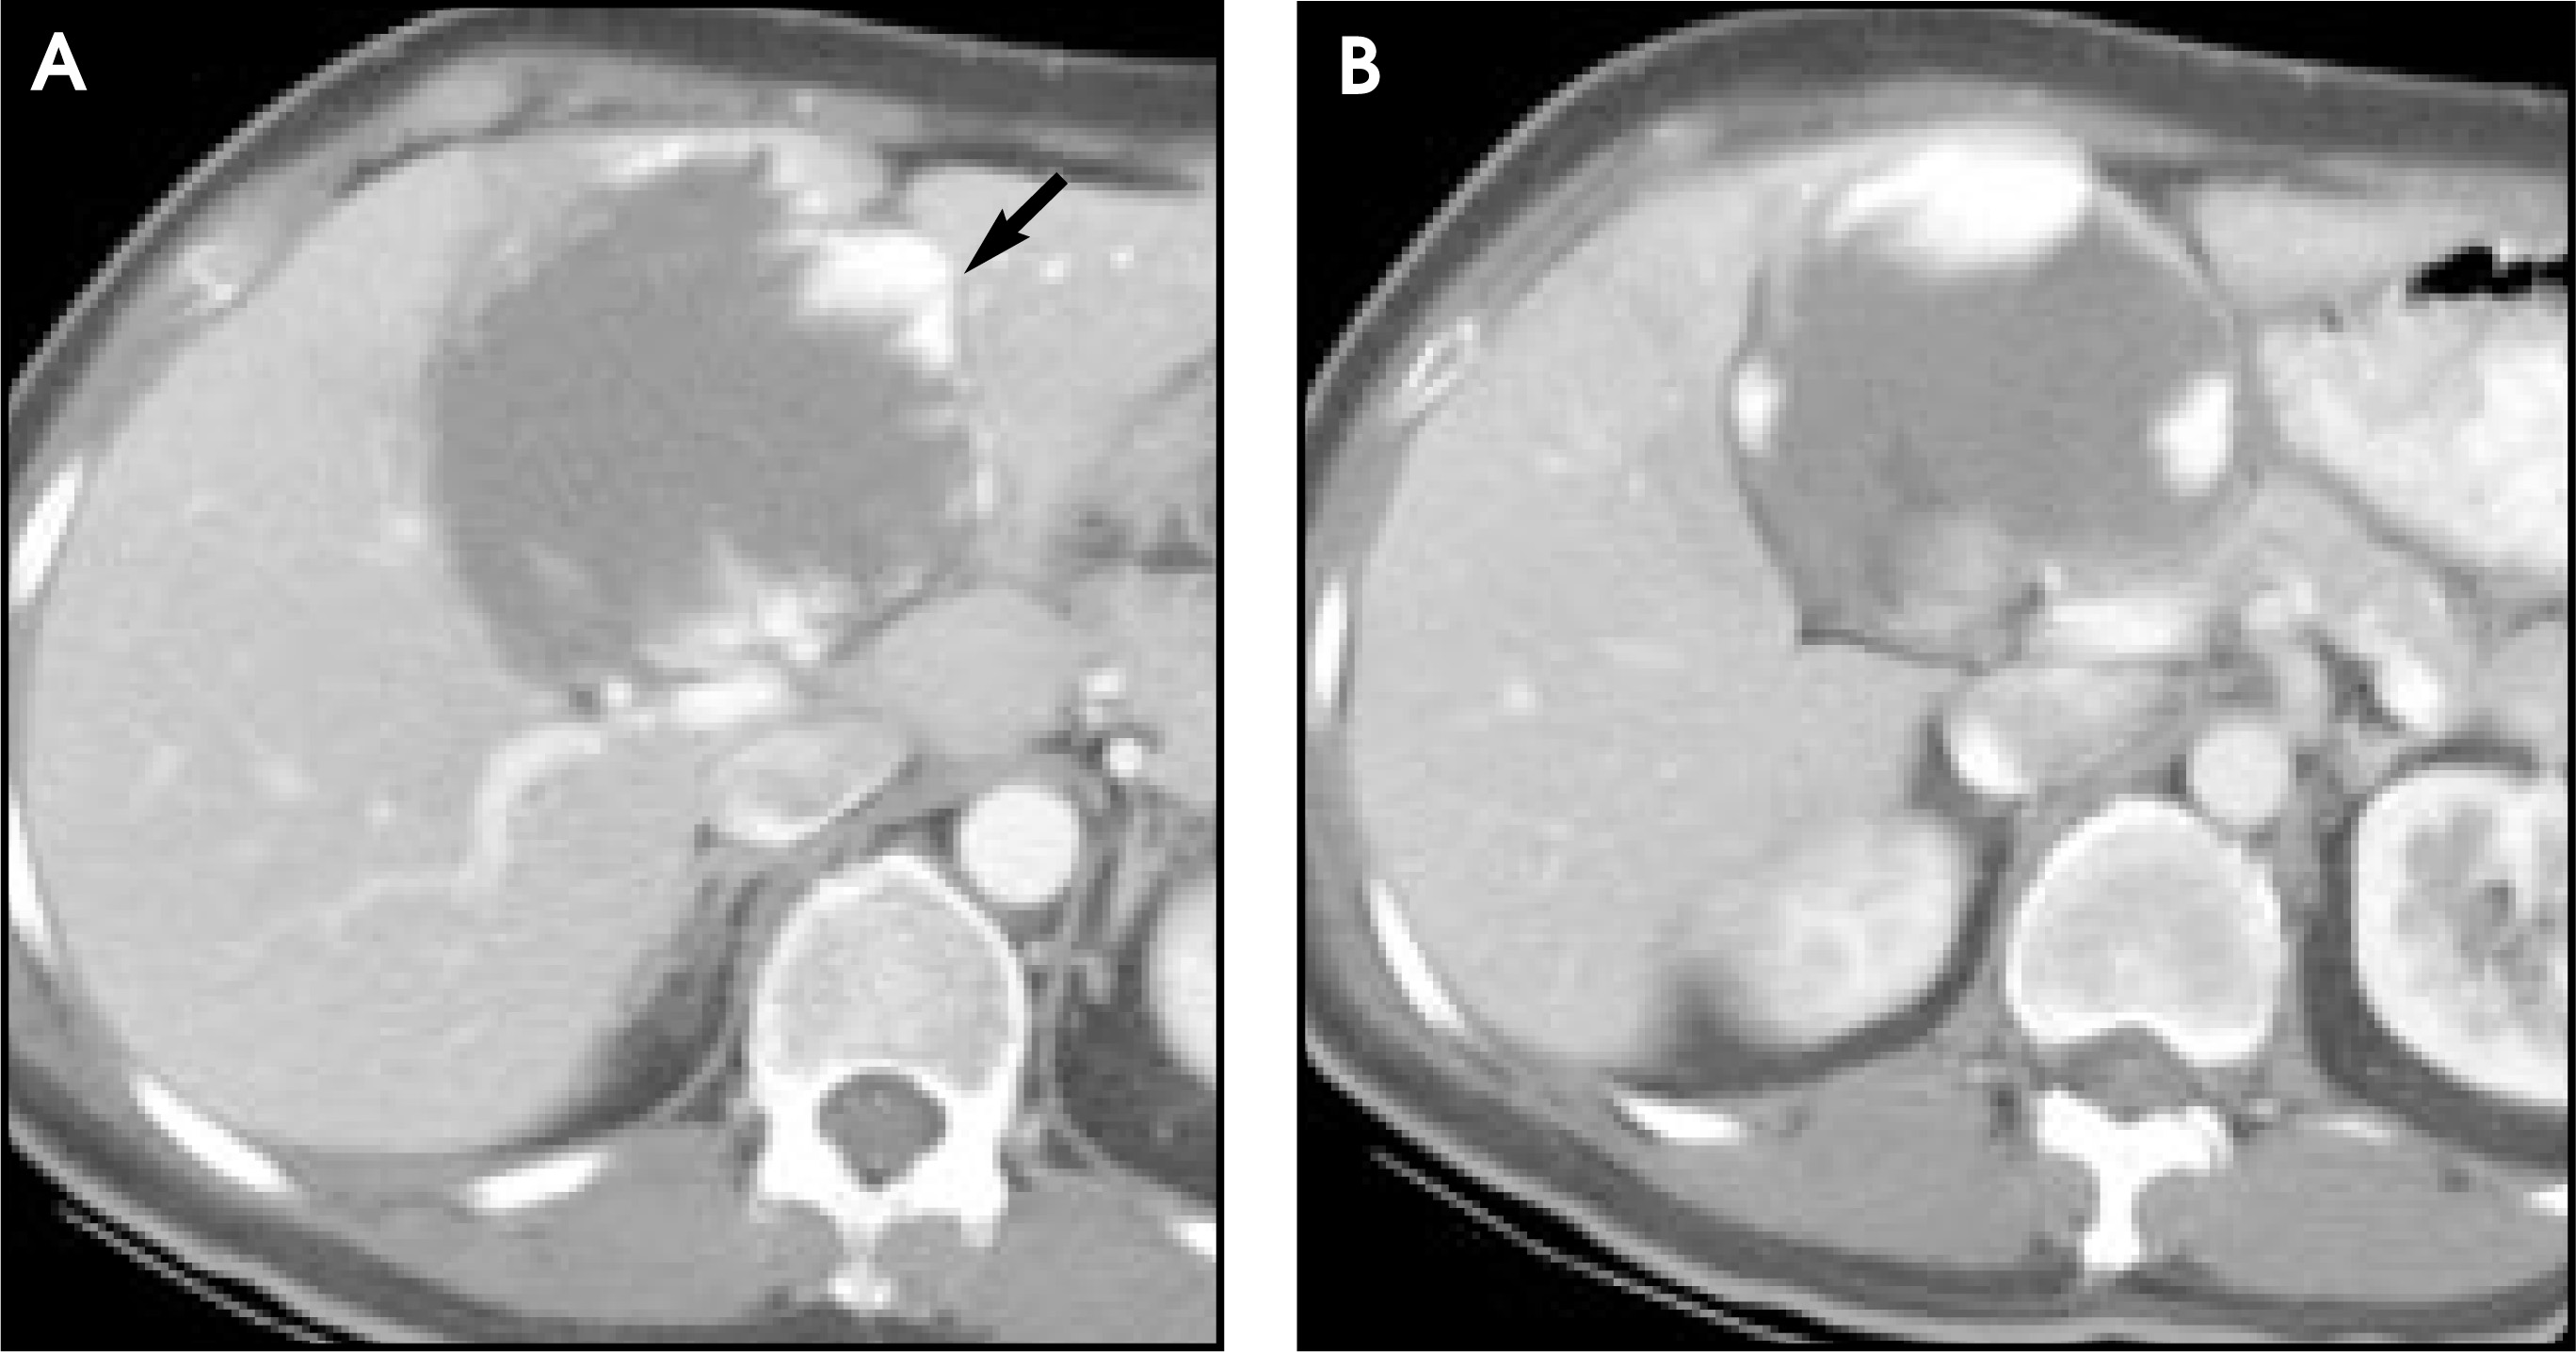
Computer-automated scanning technology and bolus tracking
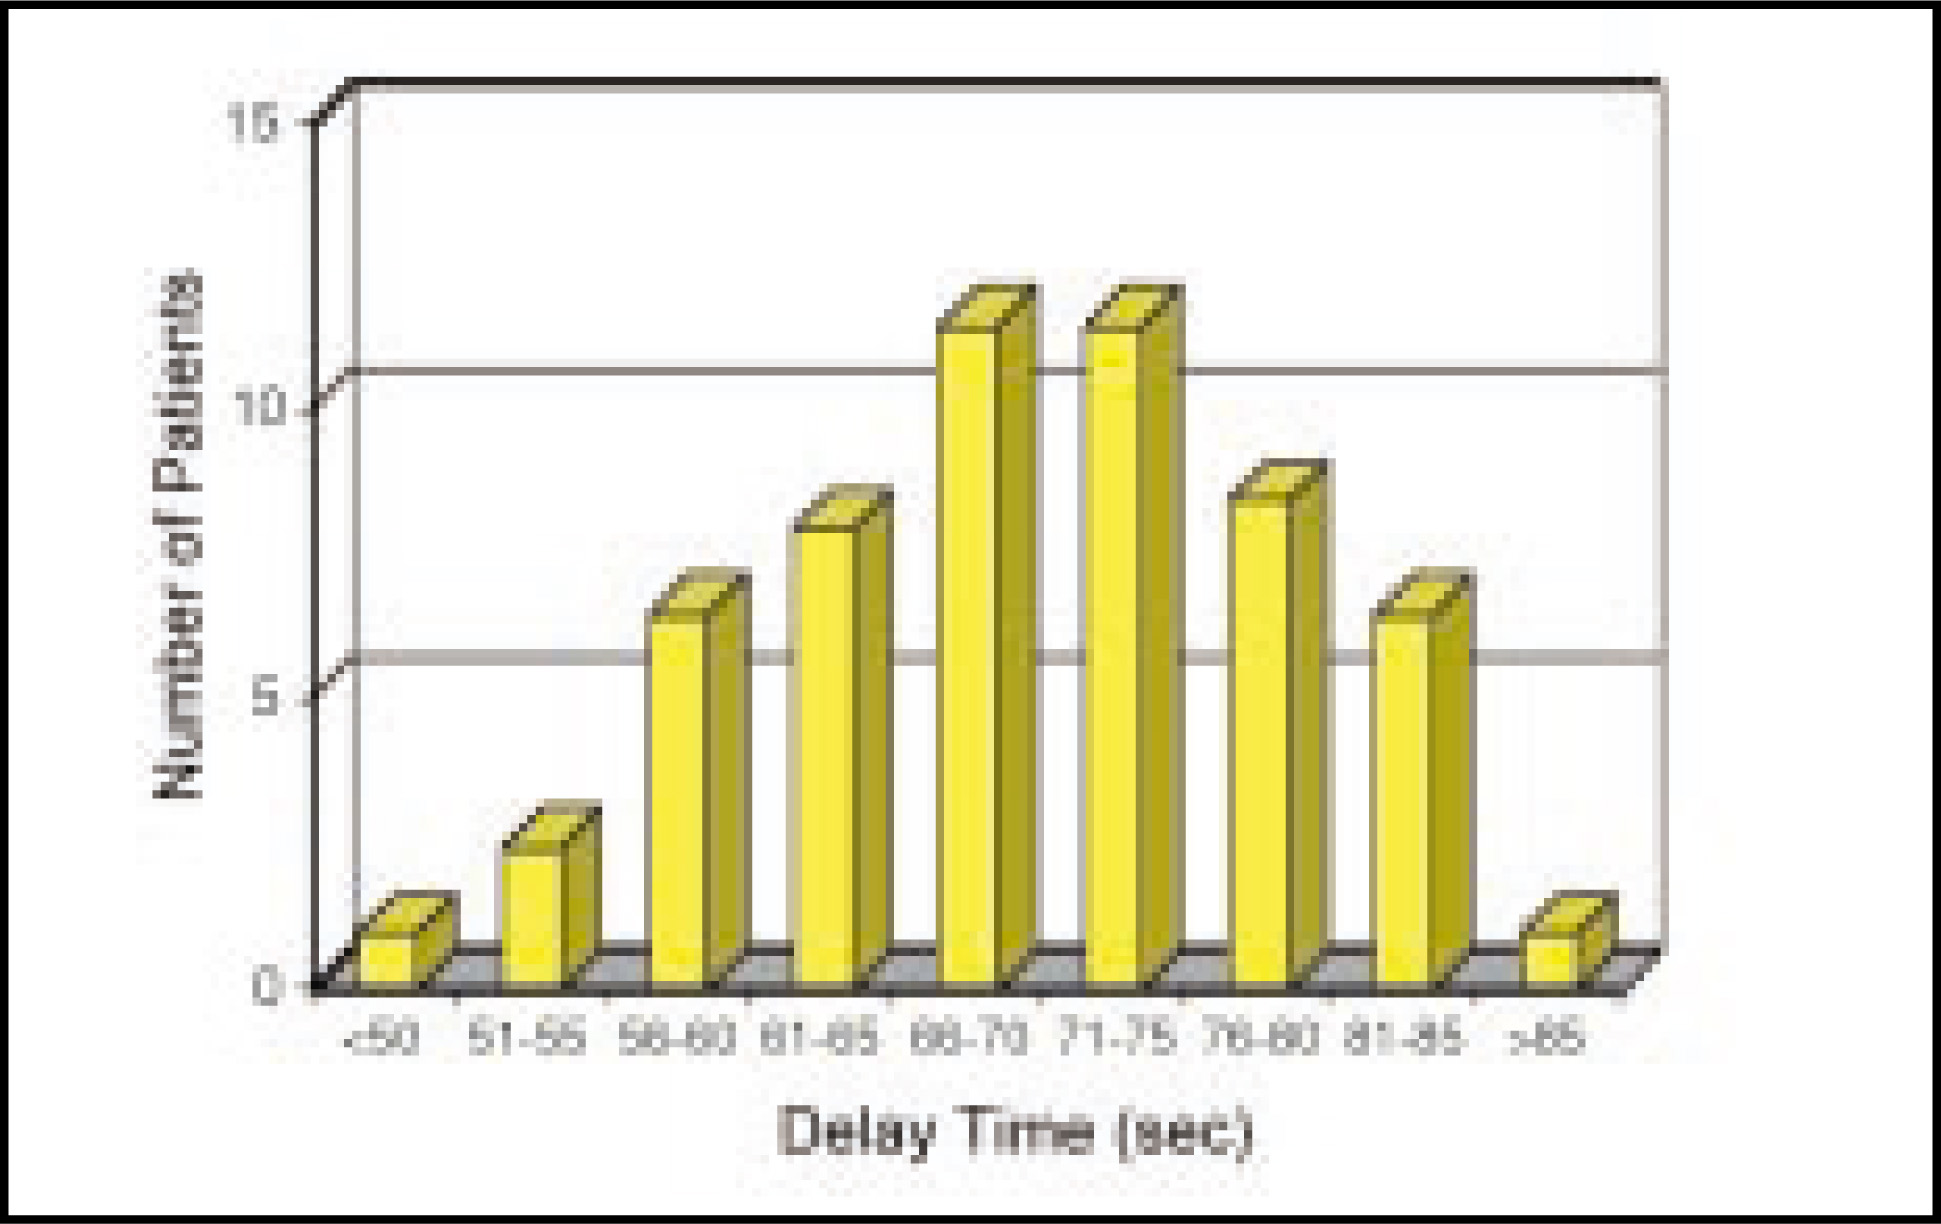
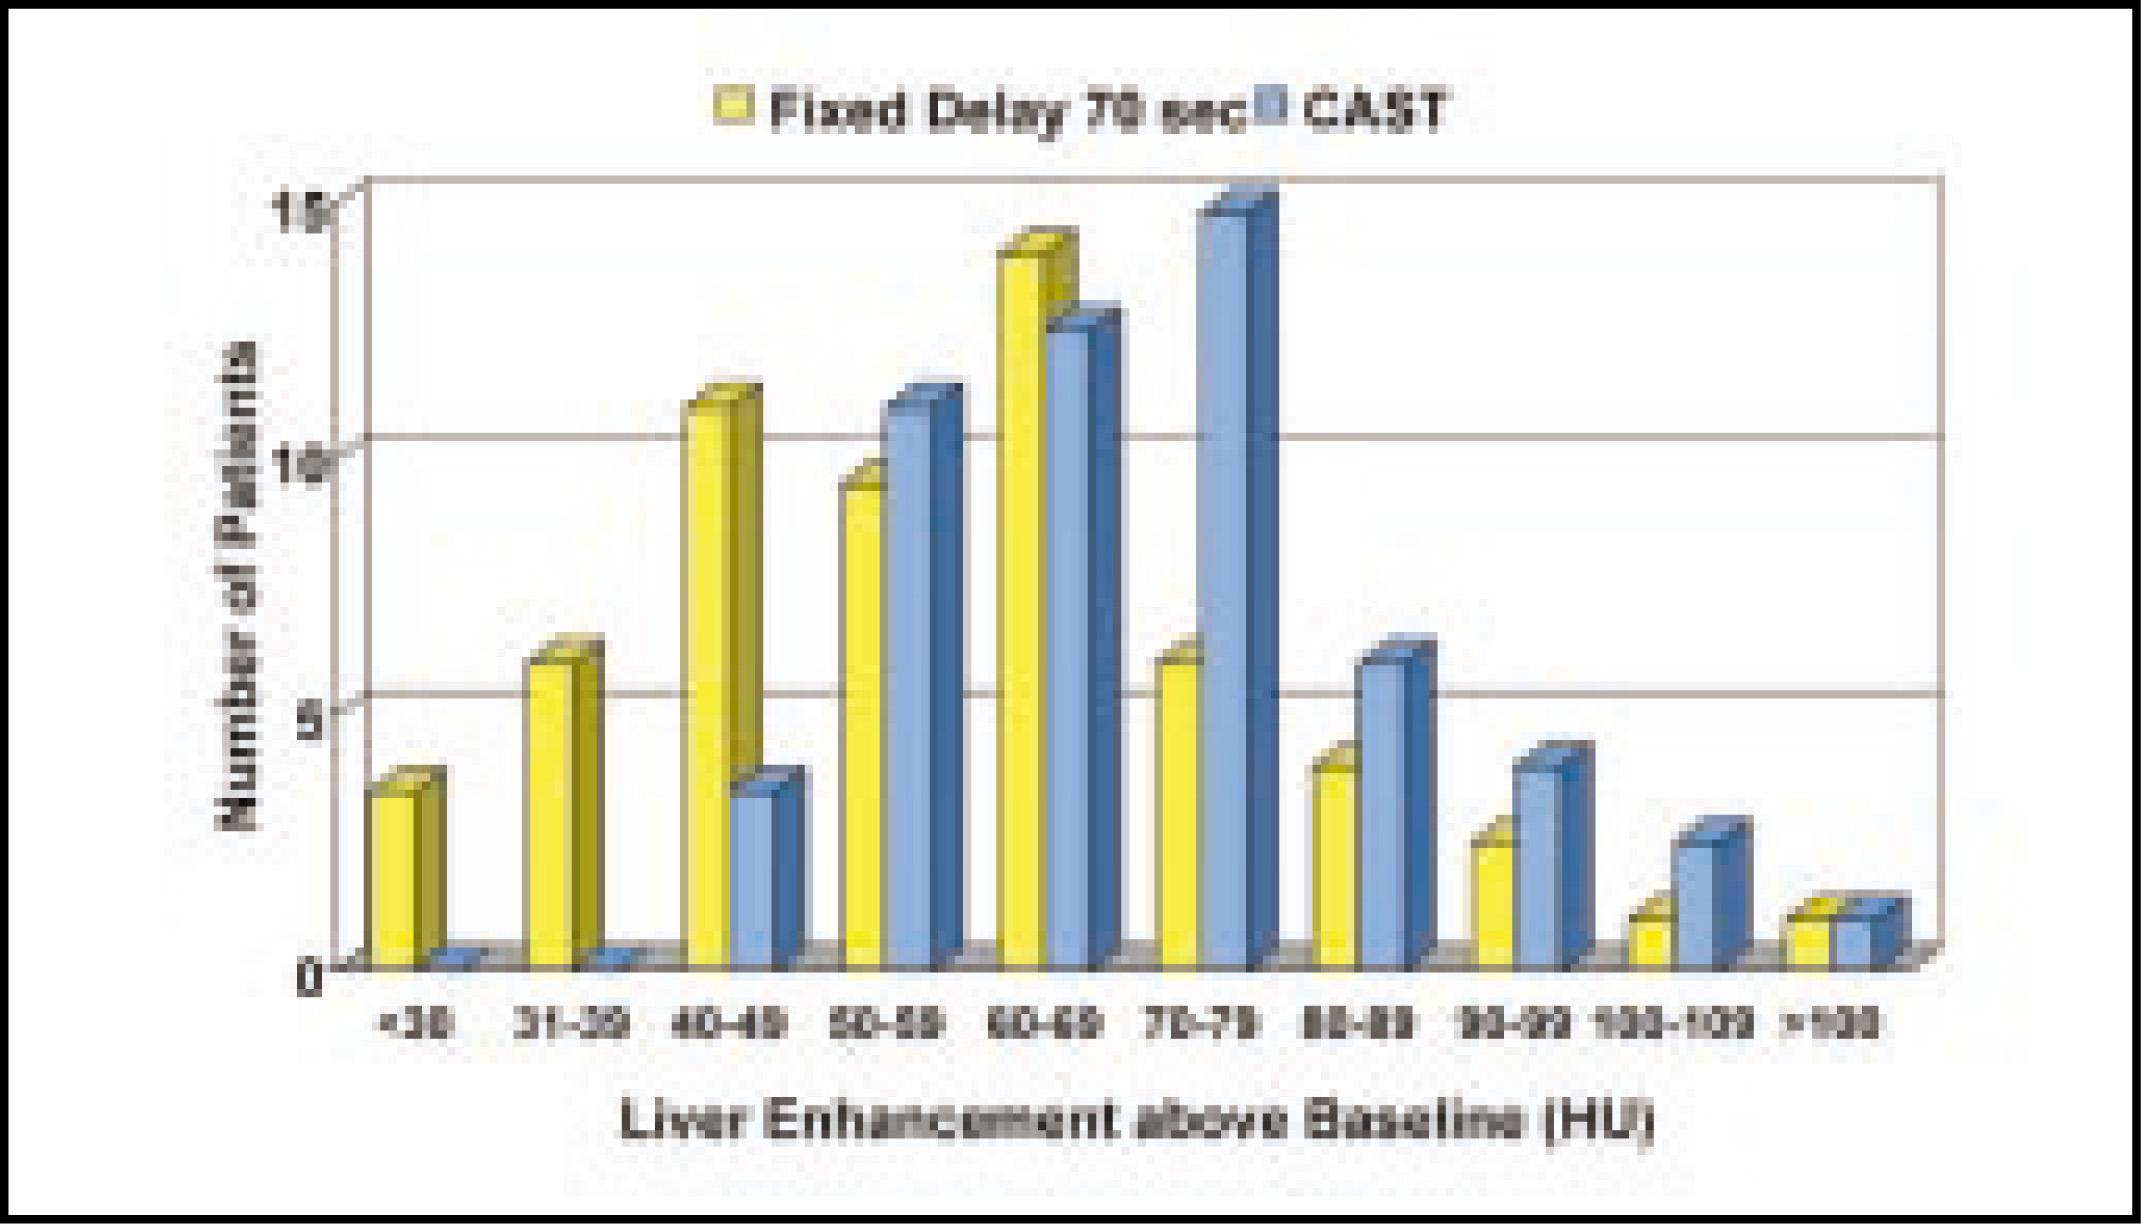
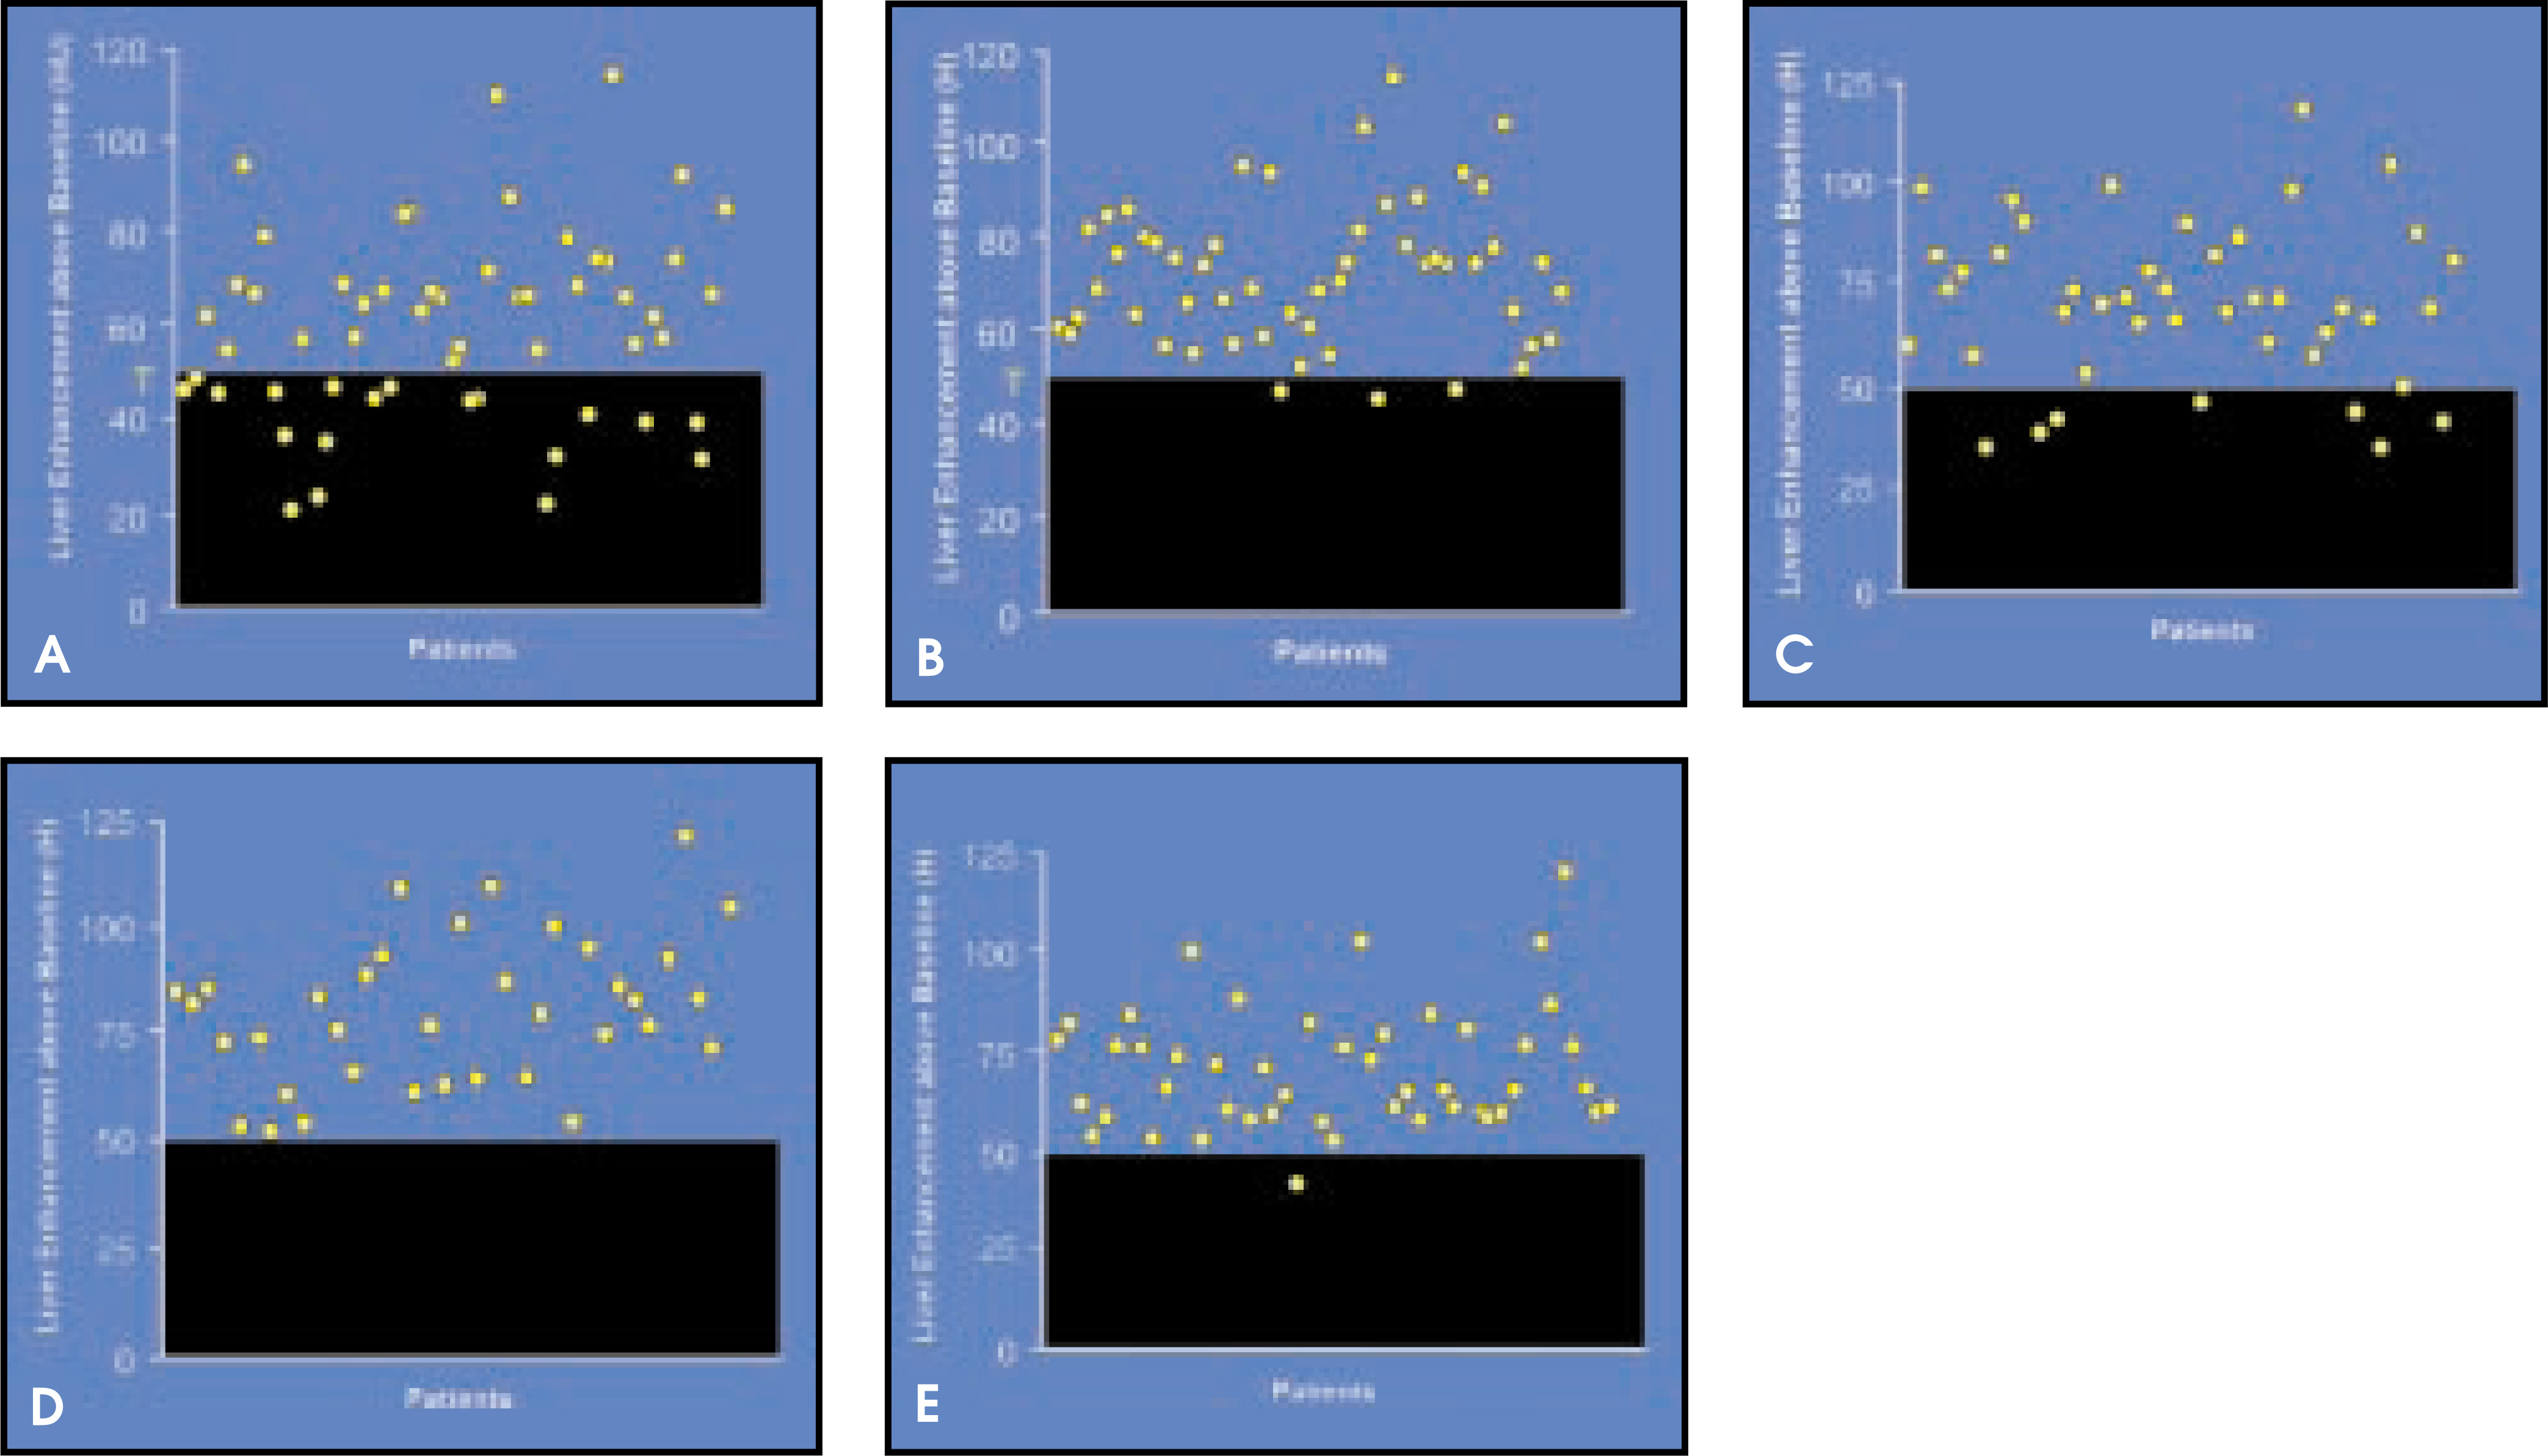
Body-imaging protocols have been primarily constructed with significant attention to optimizing imaging of the main target organ, the liver. For liver imaging, the delay time prior to the initiation of scanning has generally been fixed and has ranged in different practices from 60 to 70 seconds between the onset of injection of contrast and the initiation of diagnostic scanning. Unfortunately, patients vary significantly in body mass, and there can also be significant changes in cardiac output and circulation time, depending on the clinical status of individual patients and variations in an individual patientfrom scan to scan. Thus, “one size does not fit all” (Table 1). A specific delay time for one individual may not be optimal for the next individual. This becomes most critical with the faster scanning provided with the evolution of multislice CT (MSCT). Research on this problem has demonstrated that a bolus-tracking computer-automated scanning technology (CAST) can be highly effective in allowing scanning during optimal enhancement for critical organs such as the liver.35 This technology has been called various names by different manufacturers, including SmartPrep (GE Medical Systems, Milwaukee, WI) and Care (Siemens Medical Systems, Iselin, NJ). Employing CAST, multiple low-radiation-dose scans can be performed at the mid-level of the liver during the administration of contrast material using the available software. Cursors denoting regions of interest (ROI) can be placed on the liver and the aorta, and the enhancement of the structures is tracked automatically on a graph (Figure 11). Switching to routine diagnostic scanning when the enhancement of the liver reaches 50 Houndsfield Units (HU) allows optimal imaging of the liver by capturing the optimal level of enhancement. This method allows for better and more reliable enhancement of the liver and associated abdominal structures (Figures 12 and 13). It has also been found that an equivalent degree of enhancement can even be achieved using less contrast material, and that a higher degree of enhancement can be achieved using the same amount of contrast that would be normally used with a standard, fixed-delay time period (Figure 14). This technology, when incorporated with MSCT, can allow for precise timing to capture different phases of contrast enhancement. Though most frequently used to time the hepatic venous phase, which occurs for 65 to 75 seconds, it has also been used in scanning the liver for hypervascular metastatic disease by optimally timing for the arterial contrast phase.25,34,40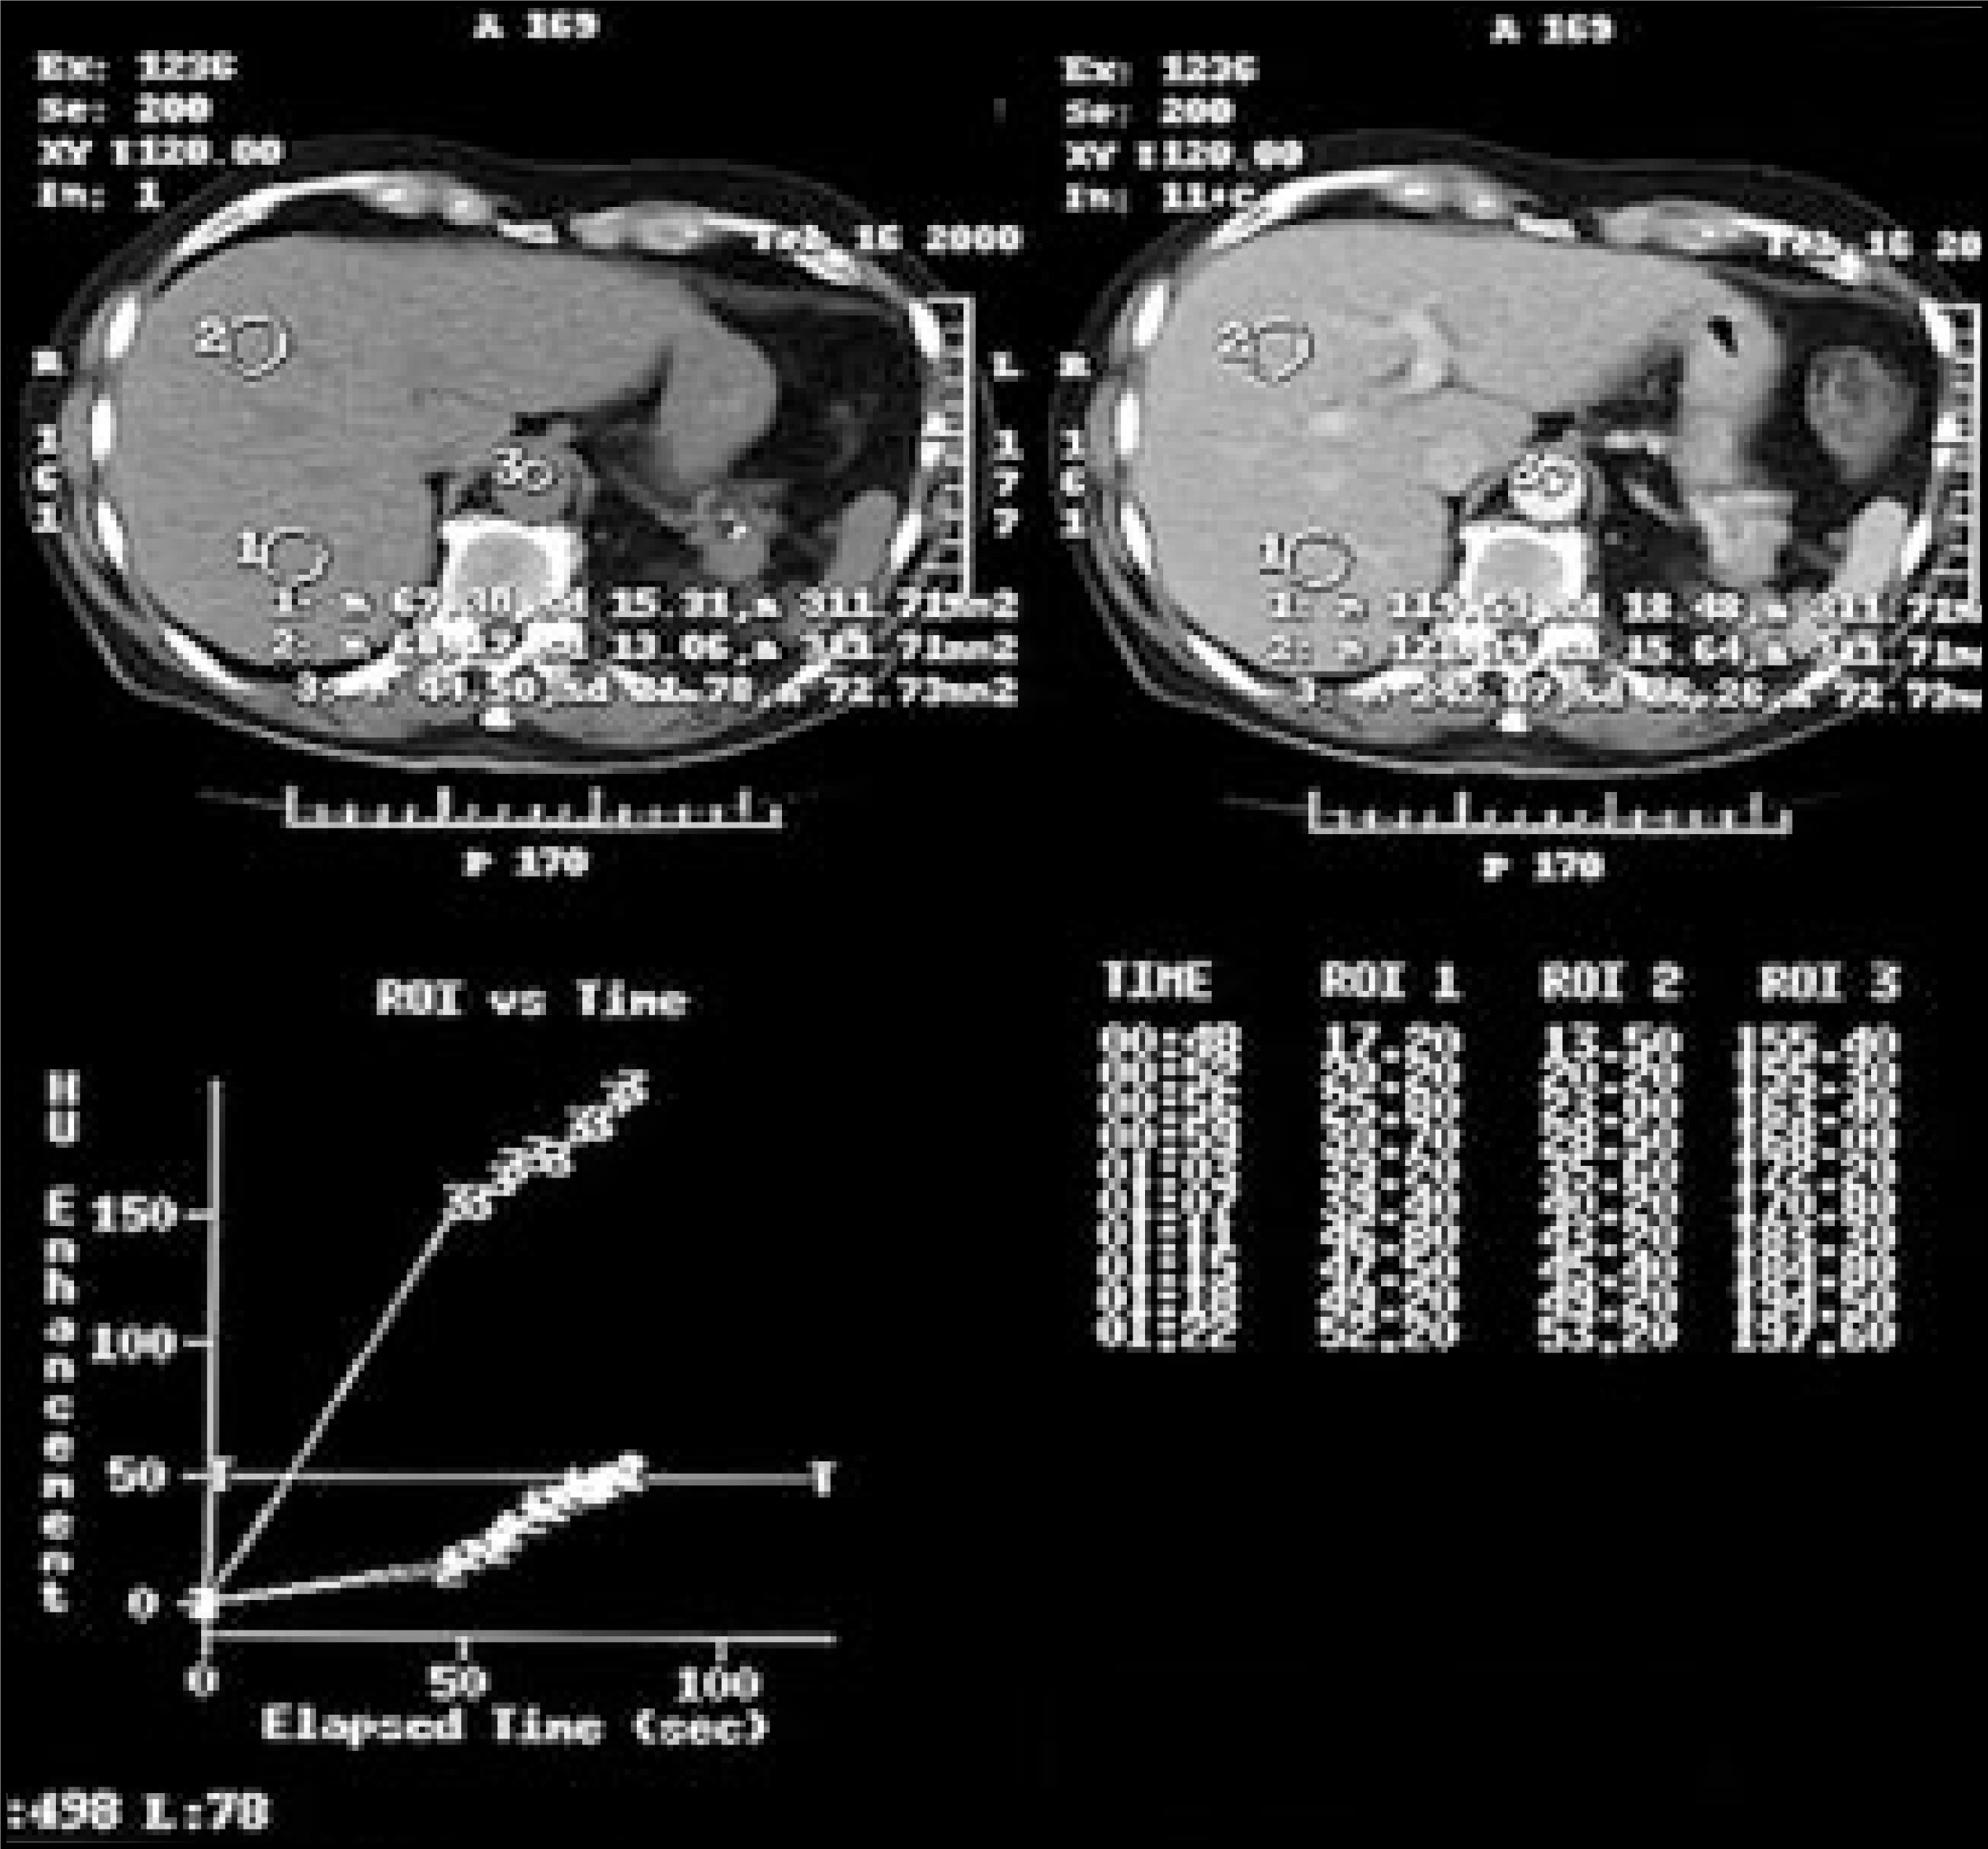
Conclusion
Helical CT has greatly enhanced our understanding of the pharmacokinetics of contrast administration for imaging of the liver. The ability of helical scanning to scan more rapidly through the liver has allowed better detection of hypovascular lesions. For the first time, hypervascular lesions can be adequately assessed by scanning through the liver during the hepatic arterial dominant phase as well as during the portal venous phase. With the technological advance of MSCT, truly practical multiphasic imaging has become feasible. AR
Part II of this article will address the introduction of multislice technology and will be published in the June 2003 issue of Applied Radiology.
References
- Dodd G, Baron R. Investigation of contrast enhancement in CT of the liver: The need for improved methods. AJR Am J Roentgenol. 1993;160:643-646.
- Dean P, Violante M, Mahoney J. Hepatic contrast enhancement: Effect of dose, duration of infusion, and time elapsed following infusion. Invest Radiol. 1980;15:158-161.
- Burgener F, Hamlin D. Contrast enhancement in abdominal CT: Bolus vs. infusion. AJR Am J Roentgenol. 1981;137:351-358.
- Claussen C, Bander D, Pfretzschner C. Bolus geometry and dynamics after intravenous contrast medium injection. Radiology. 1984;153:365-368.
- Berland L. Additional comment: Dynamic hepatic CT. Radiology. 1991;181:22-23.
- Silverman P, Cooper C, Zeman R. Imaging of the liver: A survey update of prevailing techniques for conventional CT scanning. Abdom Imaging. 1995;20:348-352.
- Silverman P, Kohan L, Ducic I. Imaging of the liver with helical CT: A survey of scanning techniques. AJR Am J Roentgenol. 1998;170:149-152.
- Zeman R, Baron R, Jeffrey R. Helical body CT: Evolution of scanning protocols. AJR Am J Roentgenol. 1998;170:1427-1438.
- Foley W, Hoffmann R, Quiroz F. Hepatic helical CT: Contrast material injection protocol. Radiology. 1994;192:367-371.
- Katayama H, Kozuka T, Takashima T. . 1988.
- Amin M, Cohan R, Dunnick M. Ionic and nonionic contrast media: Current status and controversies. Appl Radiol. 1993;22(11):41-54.
- Spring D, Quesenberry C. Cost of low-osmolar contrast media. JAMA. 1991;266:1081-1082.
- McClennan B. Low-osmolality contrast media: Premises and promises. Radiology. 1987;162(1 Pt 1):1-8.
- Brink J. Technical aspects of helical (spiral) CT. Radiol Clin North Am. 1995;33:825-841.
- Brink J, McFarland E, Heiken J. Helical/spiral computed body tomography. Clin Radiol. 1997;52:489-503.
- Heiken J, Brink J, Vannier M. Spiral (helical) CT. Radiology. 1993;189:647-656.
- Oliver J, Baron R, Federle M, Rockette H. Detecting hepatocellular carcinoma: Value of unenhanced or arterial phase CT imaging or both used in conjunction with conventional portal venous phase contrast-enhanced CT imaging. AJR Am J Roentgenol. 1996;167:71-77.
- Hollett M, Jeffrey R, Nino-Murcia M. Dual-phase helical CT of the liver: Value of arterial phase scans in the detection of small malignant hepatic neoplasms. AJR Am J Roentgenol. 1995;164:879-884.
- Foley W. Helical CT: Clinical performance and imaging strategies. RadioGraphics. 1994;14:894-904.
- Silverman P. Universal versus selective use of low-osmolality contrast media in the 1990s: A radiologist’s perspective. Radiology. 1997;203.
- Silverman P. Ionic versus nonionic contrast media, implications of choice on contrast extravasation. AJR Am J Roentgenol. 1997;168:1620-1621.
- Silverman P. Selective use of low-osmolality contrast media in biphasic helical CT of the liver: A response. Radiology. 1998;207:827-829.
- Foley W. Dynamic hepatic CT. Radiology. 1989;170:617-22.
- Foley W, Berland L, Lawson T. Contrast enhancement technique for dynamic hepatic computed tomographic scanning. Radiology. 1983;147:797-803.
- Silverman P, Cooper C, Mahmud S. Establishing the optimal temporal window for liver CT using a time density analysis: Implications for helical CT. J Comput Assist Tomogr. 1995;19:73-79.
- Garcia P, Bonaldi V, Bret P. Effect of rate of contrast medium injection on hepatic enhancement at CT. Radiology. 1996;199:185-189.
- Dean P, Kivisaari L, Kormano M. The diagnostic potential of contrast enhancement pharmacokinetics. Invest Radiol. 1978;13:533-540.
- Dean P, Violante M, Mahoney B. Hepatic CT contrast enhancement: Effect of dose, duration of infusion, and time elapsed following infusion. Invest Radiol. 1980;15:158-161.
- Moss A, Schrumpf J, Schnyder P. Computed tomography of focal hepatic lesions: A blind clinical evaluation of the effect of contrast enhancement. Radiology. 1979;131:427-430.
- Berland L, Lawson T, Foley D. Comparison of pre- and post-contrast CT in hepatic masses. AJR Am J Roentgenol. 1992;138:853-858.
- Walkey M. Dynamic hepatic CT: How many years will it take 'til we learn?. Radiology. 1991;181:17-18.
- Oliver J, Baron R, Federle M, Rockette H. Detecting hepatocellular carcinoma: Value of unenhanced or arterial phase CT imaging or both used in conjunction with conventional portal venous phase contrast-enhanced CT imaging. AJR Am J Roentgenol. 1996;167:71-77.
- van Leeuwen M, Noordzij J, Feldberg M. Focal liver lesions: Characterization with triphasic spiral CT. Radiology. 1996;201:327-336.
- Silverman P, O’Malley J, Tefft M. Conspicuity of hepatic metastases on helical CT: Effect of different time delays between contrast administration and scanning. AJR Am J Roentgenol. 1995;164:619-623.
- Silverman P, Roberts S, Ducic I. Assessment of a technology that permits individualized scan delays on helical hepatic CT: A technique to improve efficiency and use of contrast material. AJR Am J Roentgenol. 1996;167:79-84.
- Silverman P, Brown B, Wray H. Optimal contrast enhancement of the liver using helical (spiral) CT: Value of SmartPrep. AJR Am J Roentgenol. 1995;164:1169-1171.
- Ruess L, Bulas D, Kushner D. Peak enhancement of the liver in children using power injection and helical CT. AJR Am J Roentgenol. 1998;170:677-681.
- Kopka L, Funke M, Fischer U. Parenchymal liver enhancement with bolus-triggered helical CT: Preliminary clinical results. Radiology. 1995;195:282-284.
- Kopka L, Rodenwaldt J, Fischer U. Dual-phase helical CT of the liver: Effects of bolus tracking and different volumes of contrast material. Radiology. 1996;201:321-326.
- Silverman P, Roberts S, Tefft M. Helical CT of the liver: Clinical application of an automated computer technique, SmartPrep, for obtaining images with optimal contrast enhancement. AJR Am J Roentgenol. 1995;165:73-78.
Citation
. Contrast usage for liver imaging in the era of multislice (MSCT), multidetector (MDCT) CT: Part I. Applied Radiology. 2003;32(5):28-34. doi:10.37549/AR1184.