CT and MRI of adrenal masses
Applied Radiology — Vol. 35 , Issue 8 , pp. 10 -26
DOI: 10.37549/AR1444
Published: August 1, 2006
Categories
The incidentally discovered adrenal mass is a reasonably common finding that occurs in up to 1.9% of patients at computed tomography (CT).1 Both CT and magnetic resonance imaging (MRI) are excellent methods for visualizing and characterizing adrenal lesions. The selection of specific CT and MRI protocols (Tables 1 and 2) will allow for an accurate diagnosis of such masses in many instances, especially when the imaging findings can be correlated with clinical data. This article reviews the CT and MRI appearances of the most common entities that may involve the adrenal glands in the adult population. In particular, the authors address the common practical scenario of differentiating adenoma from metastasis in patients with a known primary cancer and review the CT and MRI criteria for diagnosing adrenal adenoma.
Normal adrenal gland
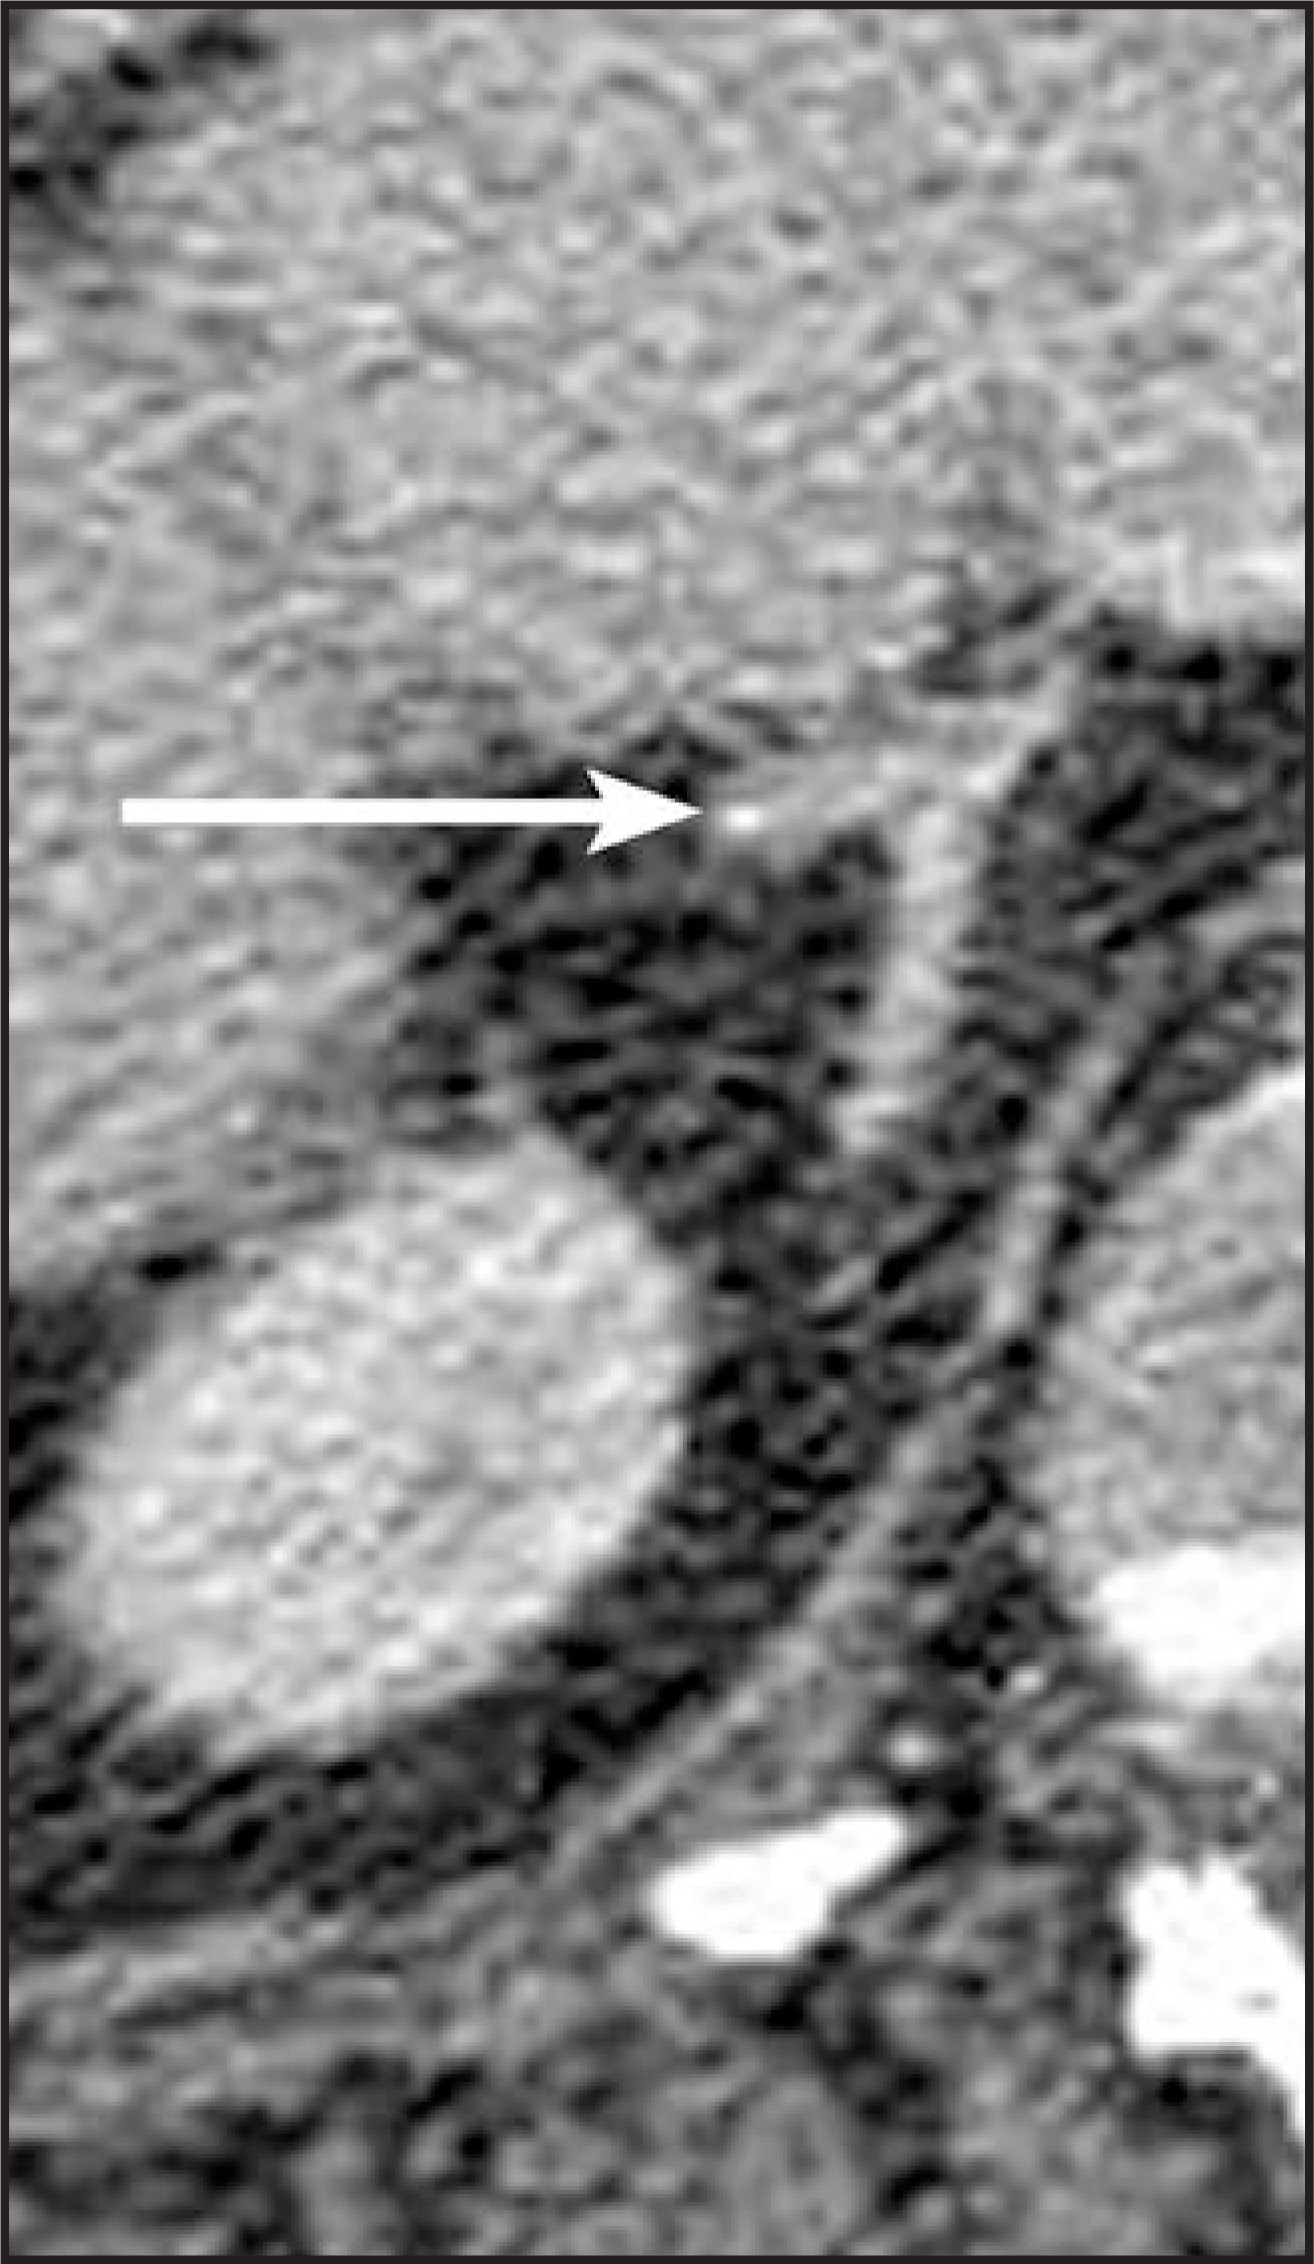
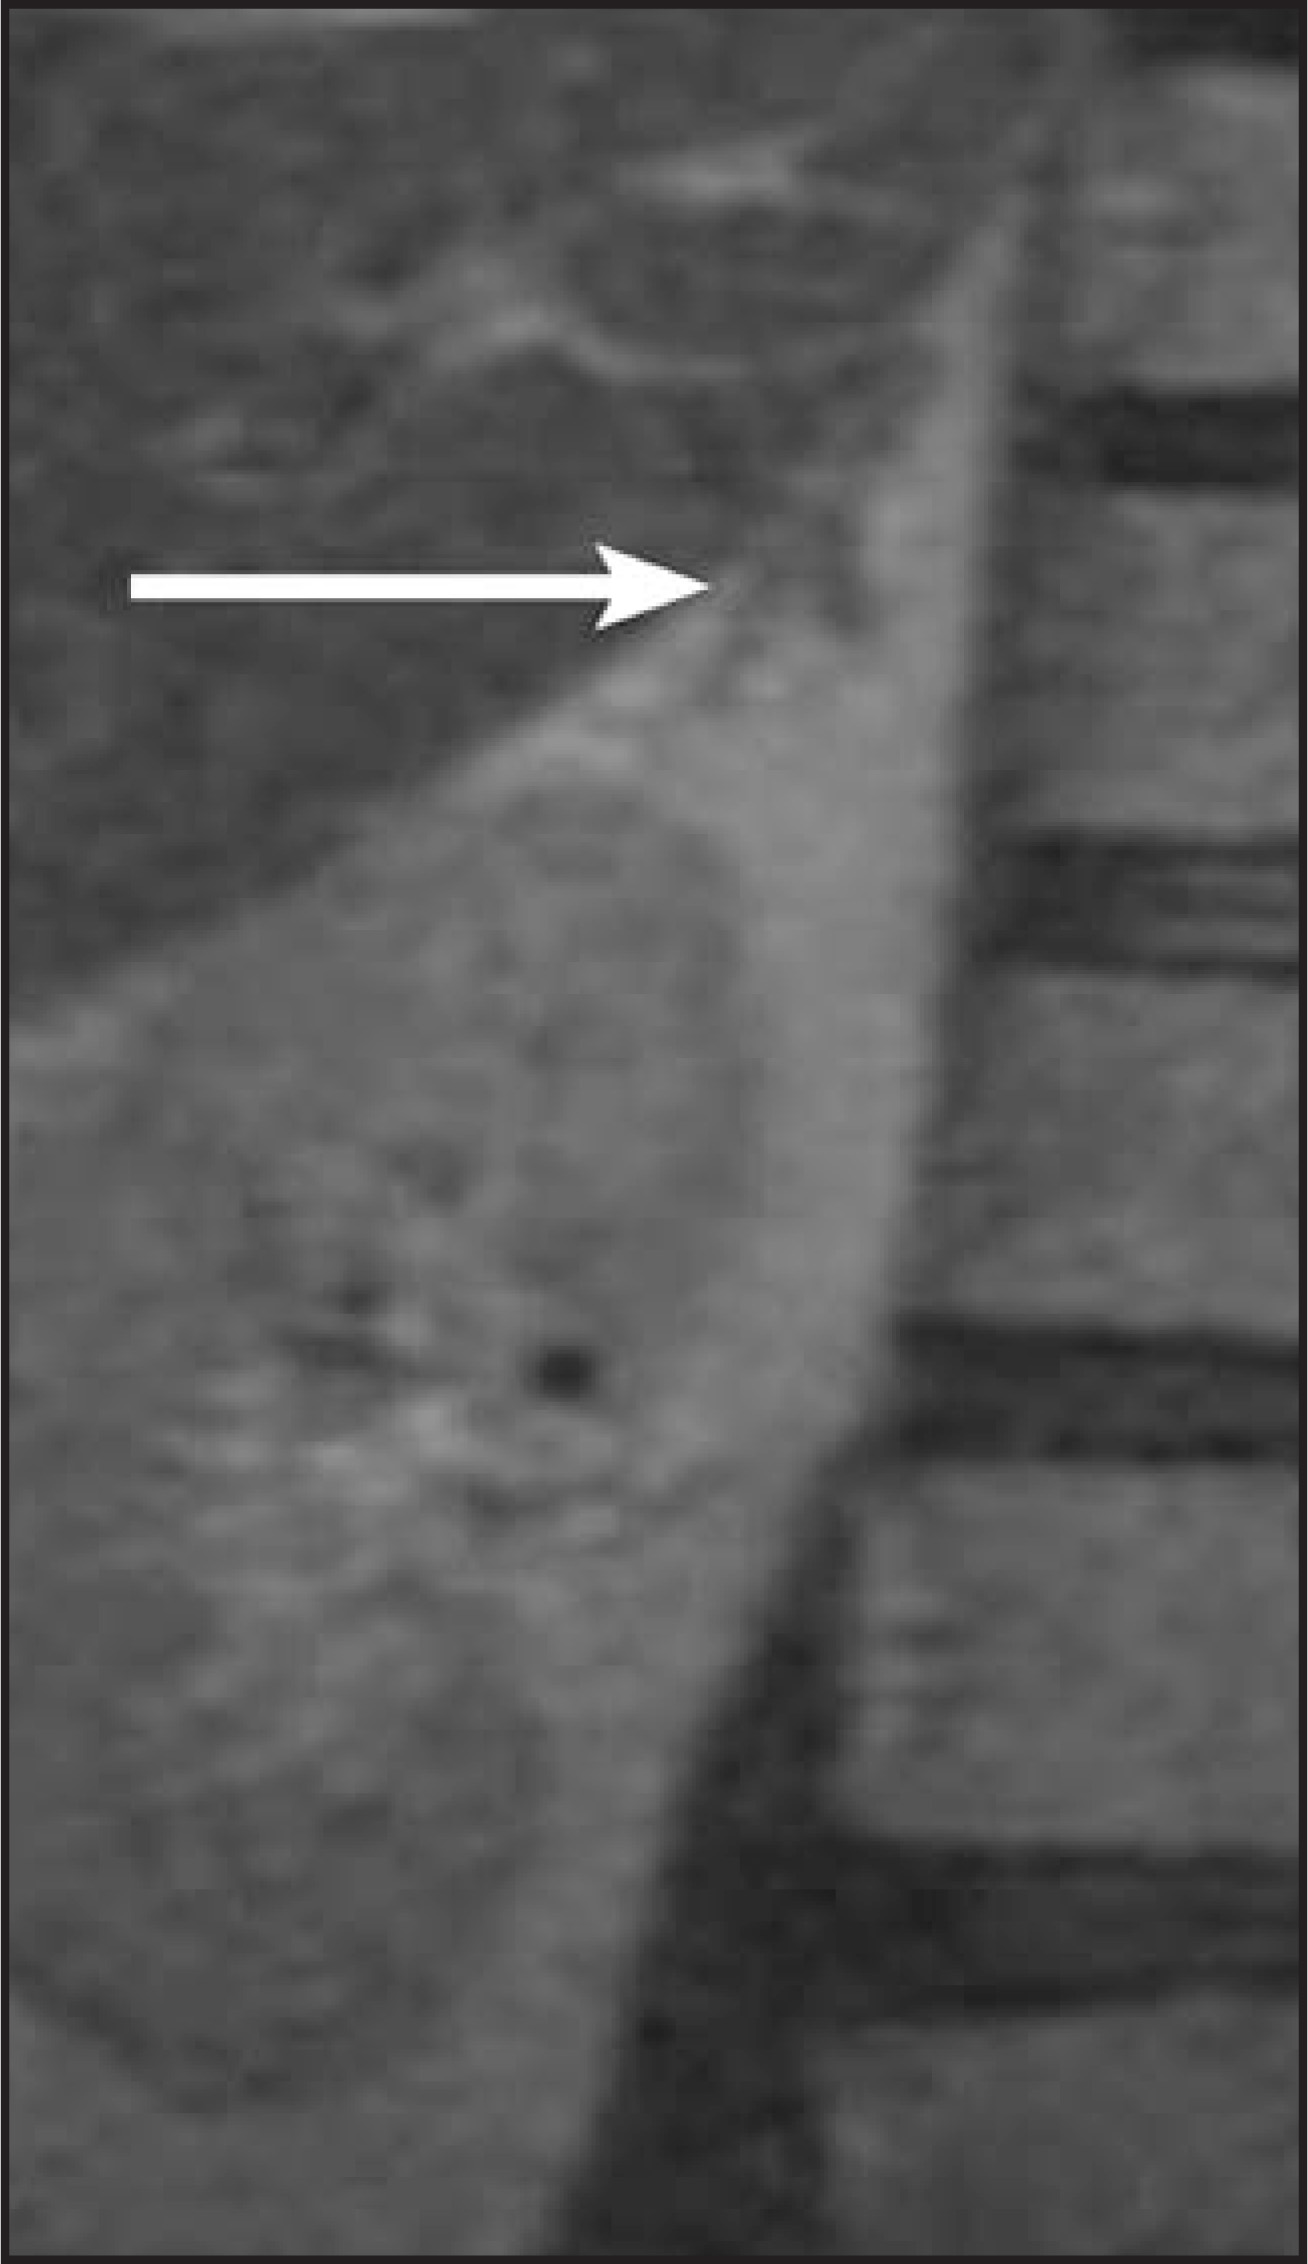
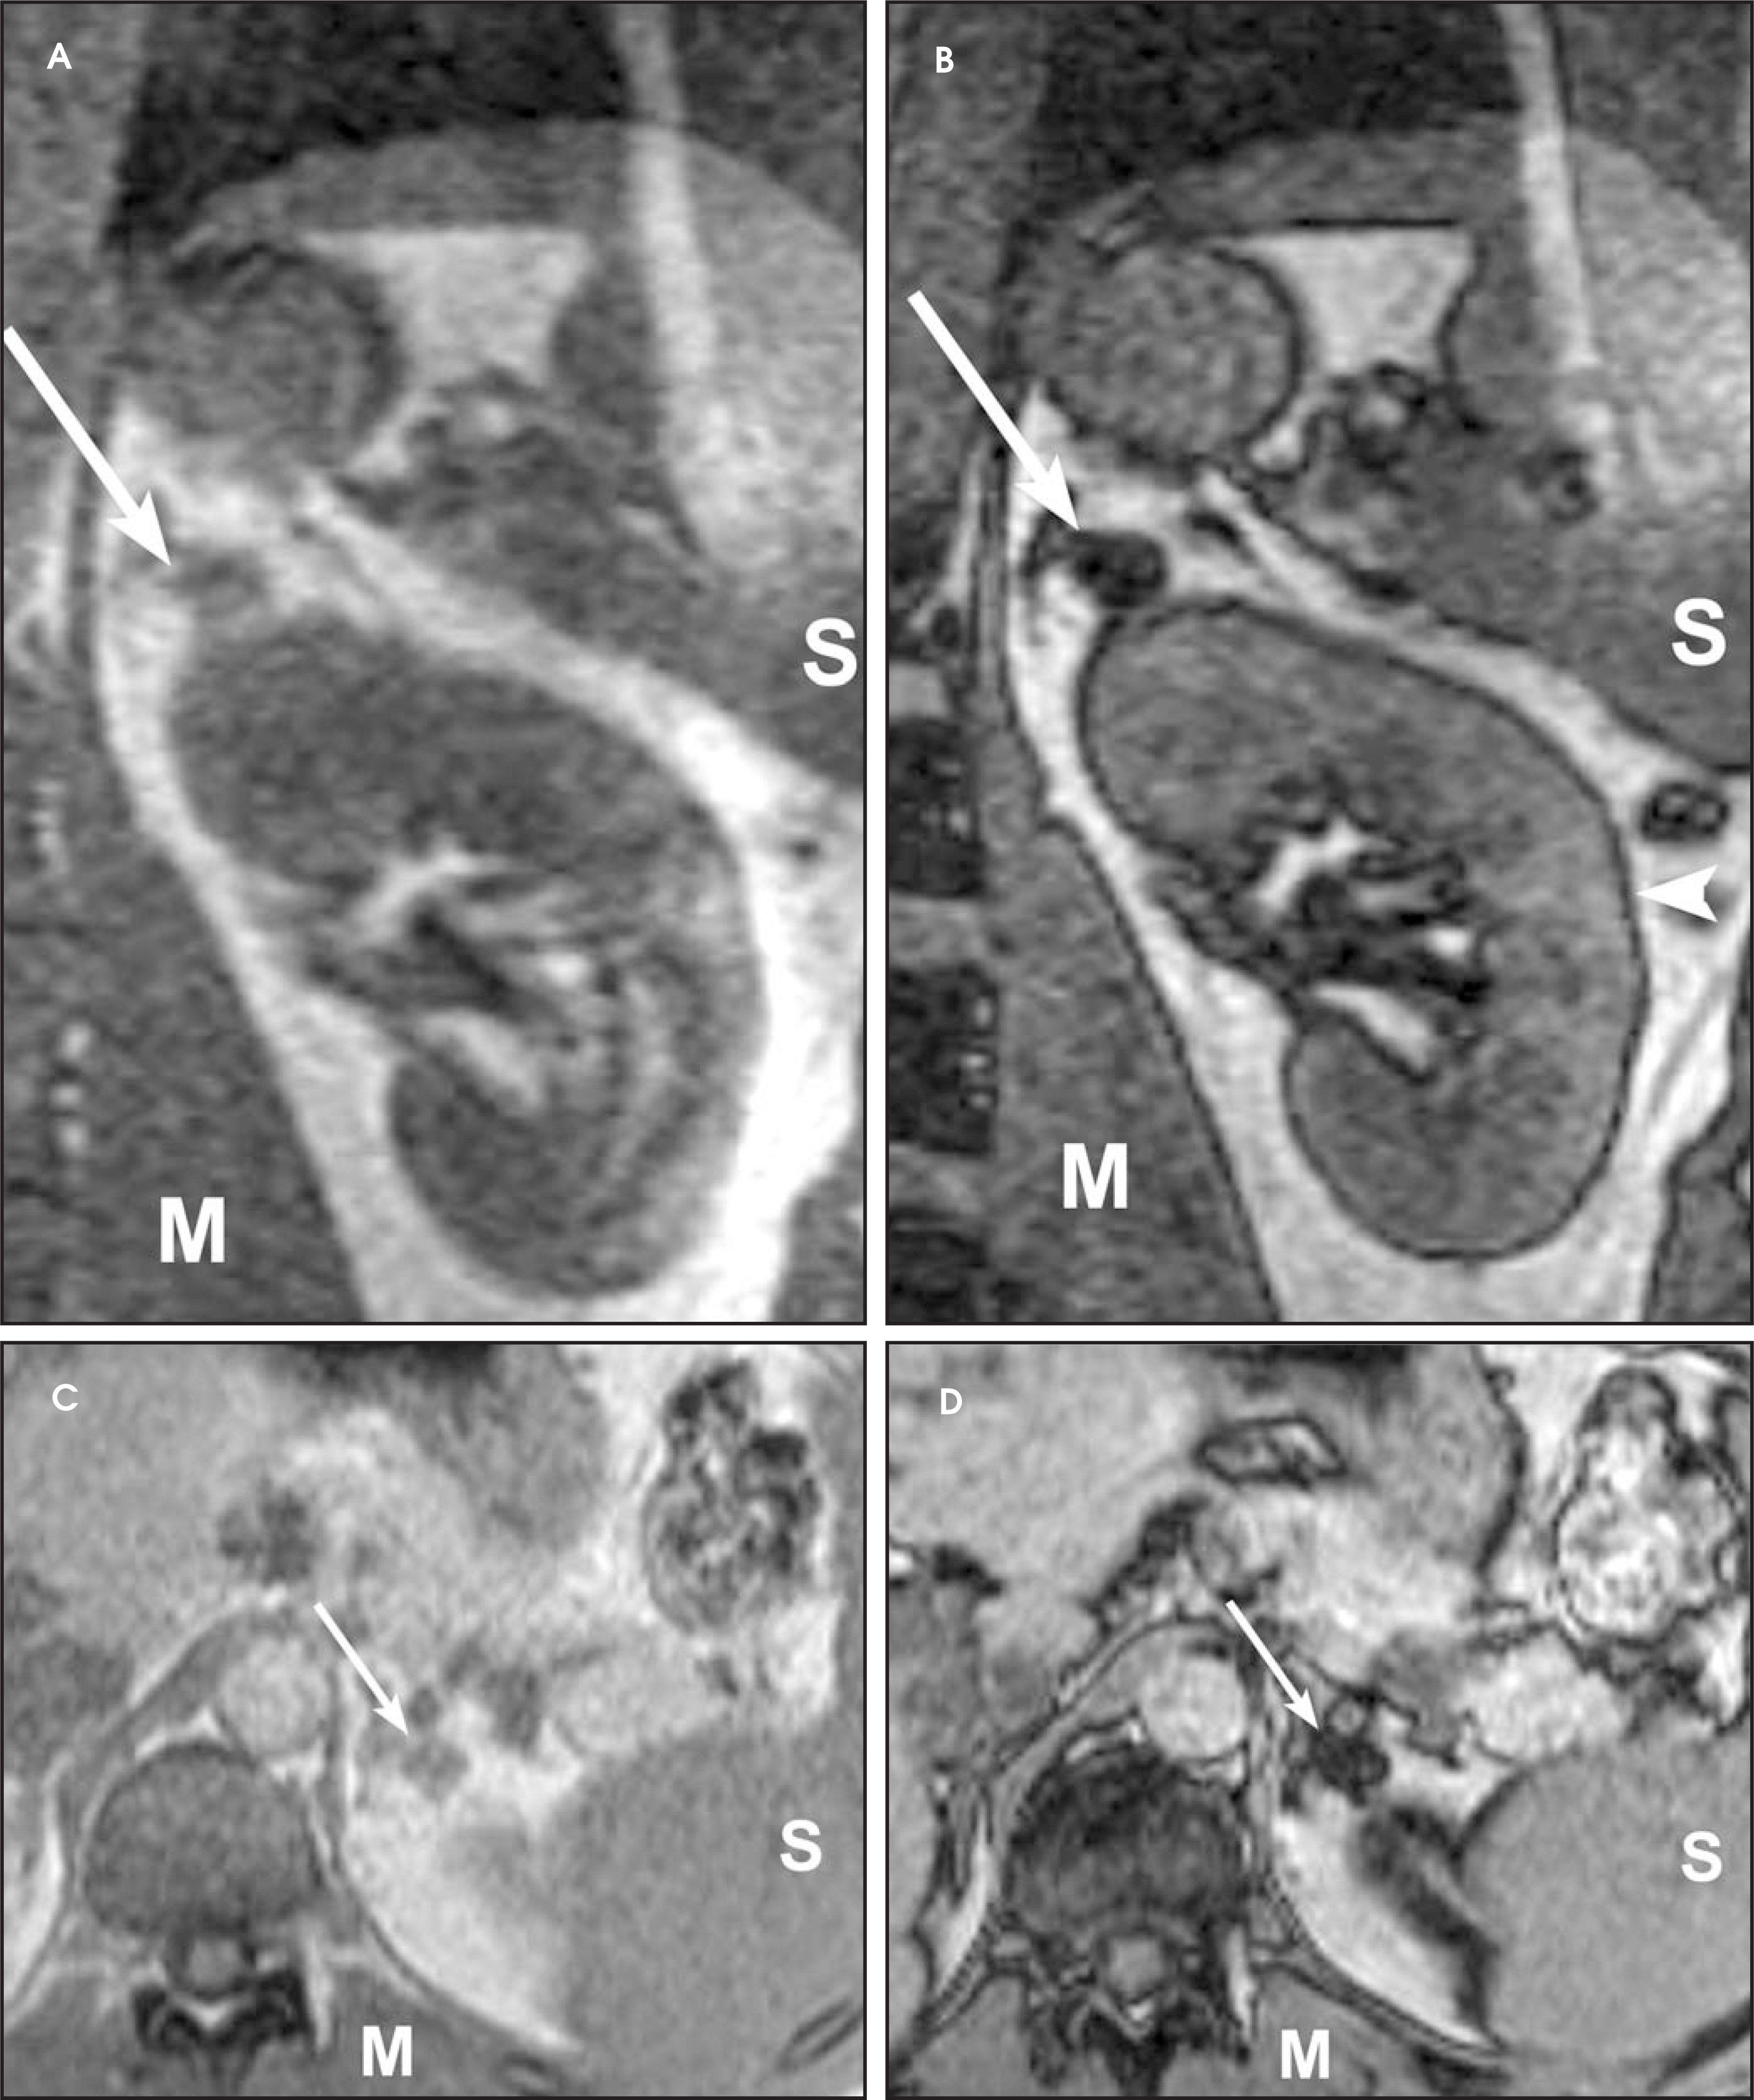
The adrenal glands are small organs, weighing approximately 5.0 g each, on average, and measuring approximately 30.0 mm in width, 50.0 mm in length, and up to 10.0 mm in thickness. They have a linear “V” or “Y” shape and are located anterosuperiorly to the kidneys (Figures 1 and 2). The glands receive arterial supply from the superior, middle, and inferior suprarenal arteries, which are branches of the inferior phrenic arteries, abdominal aorta, and renal arteries, respectively. Venous drainage is through the suprarenal veins, into the inferior vena cava and left renal vein. On gross sections, the adrenal glands have a golden-yellow cortex and a reddish-brown medulla.2
One gland, 2 functions
Although the adrenal gland is considered a single organ, it carries out 2 distinct endocrine functions. The cortex is of mesodermal origin and is composed of 3 zones: zona reticularis, zona fasciculata, and zona glomerulosa.2 The cortex produces steroid hormones, including aldosterone, cortisol, and androgens. The medulla derives from ectoderm (neural crest cells) and is responsible for the secretion of catecholamines (epinephrine and norepinephrine). The production of ≥1 of these substances by hyperfunctioning tumors results in clinical syndromes such as Cushing’s or Addison’s disease.3,4
Benign masses
Cysts
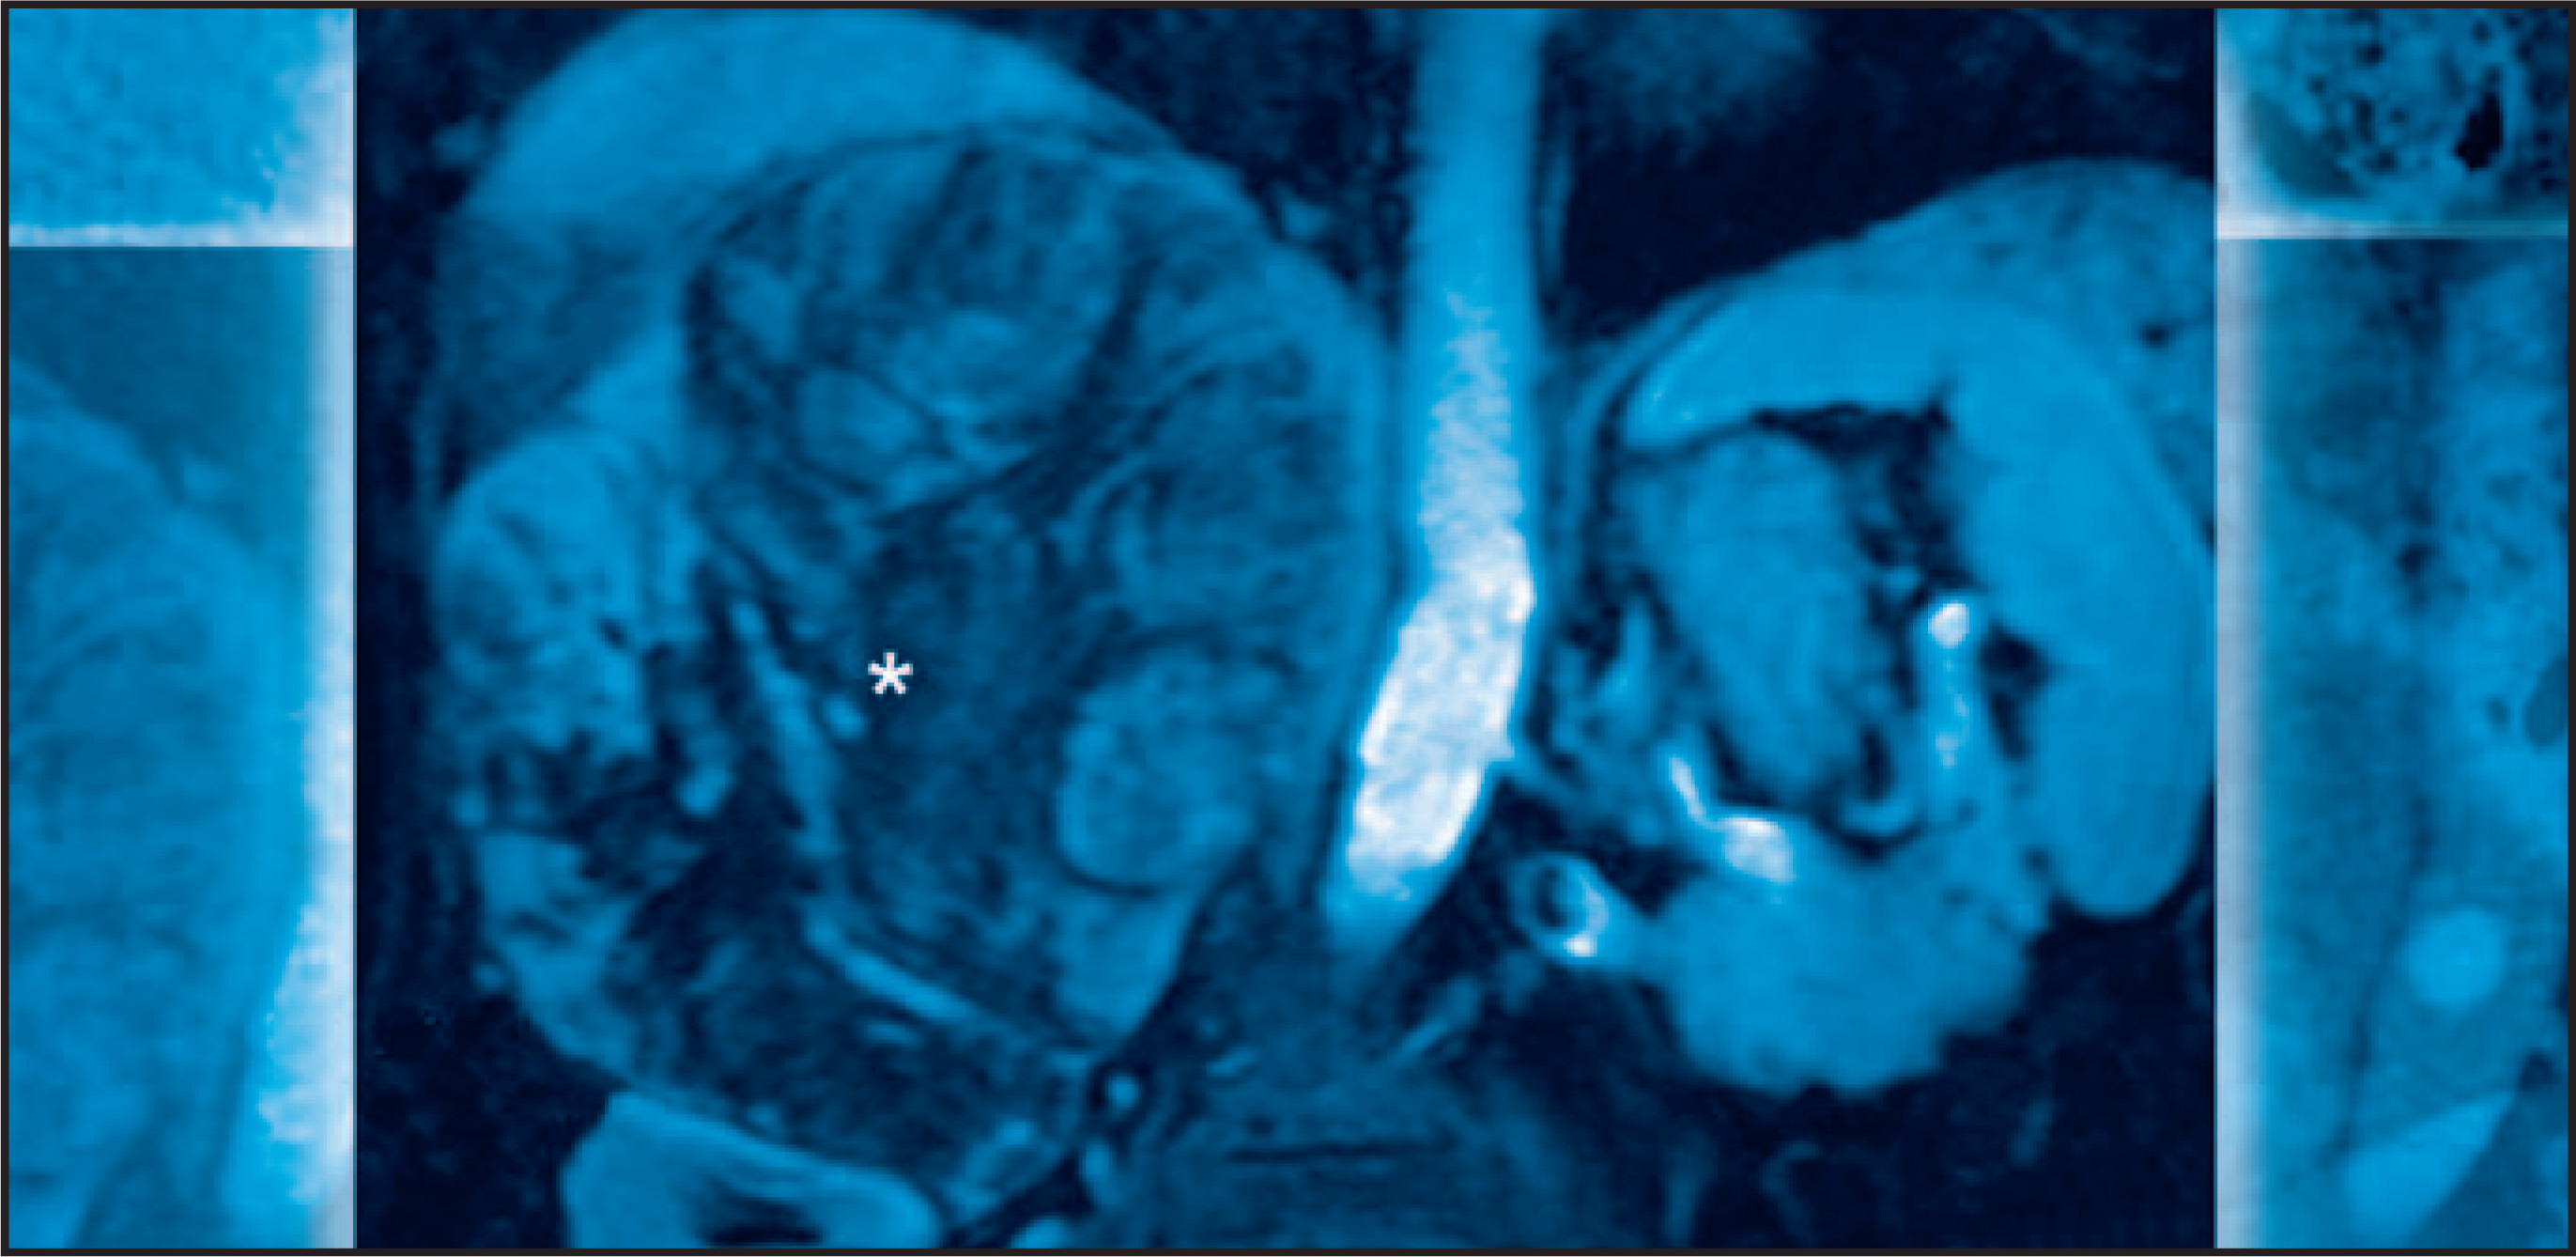
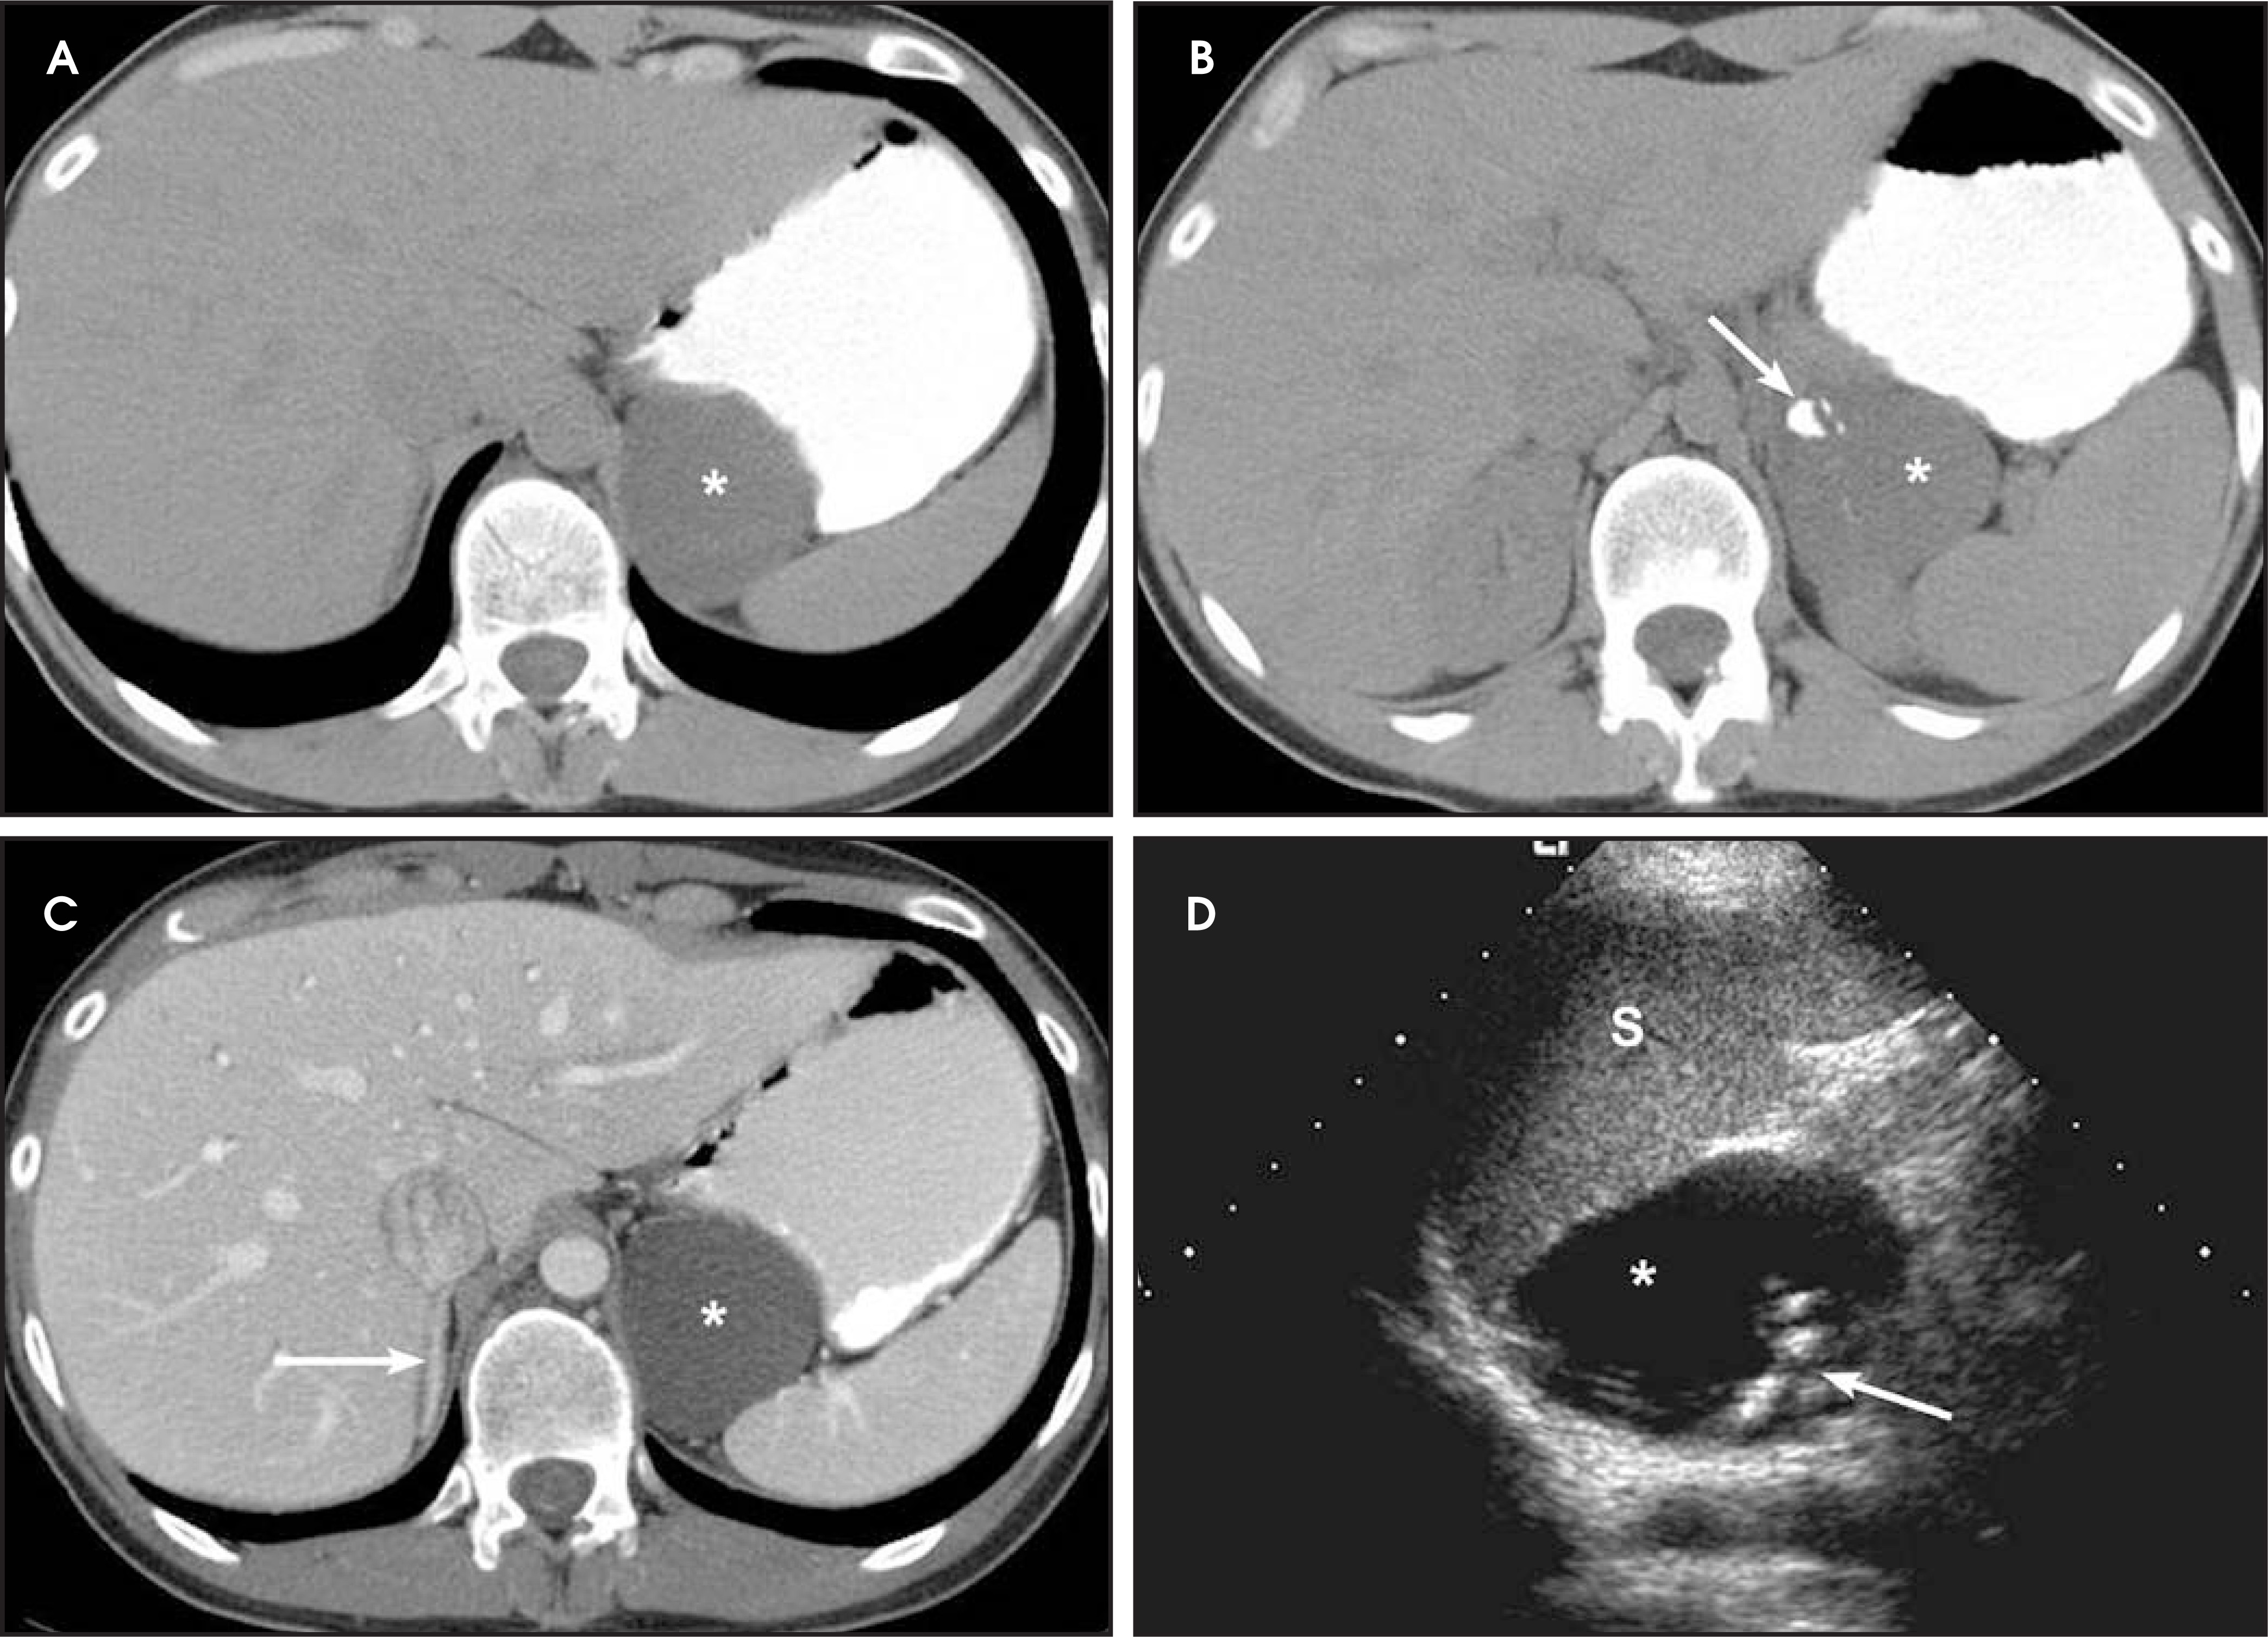
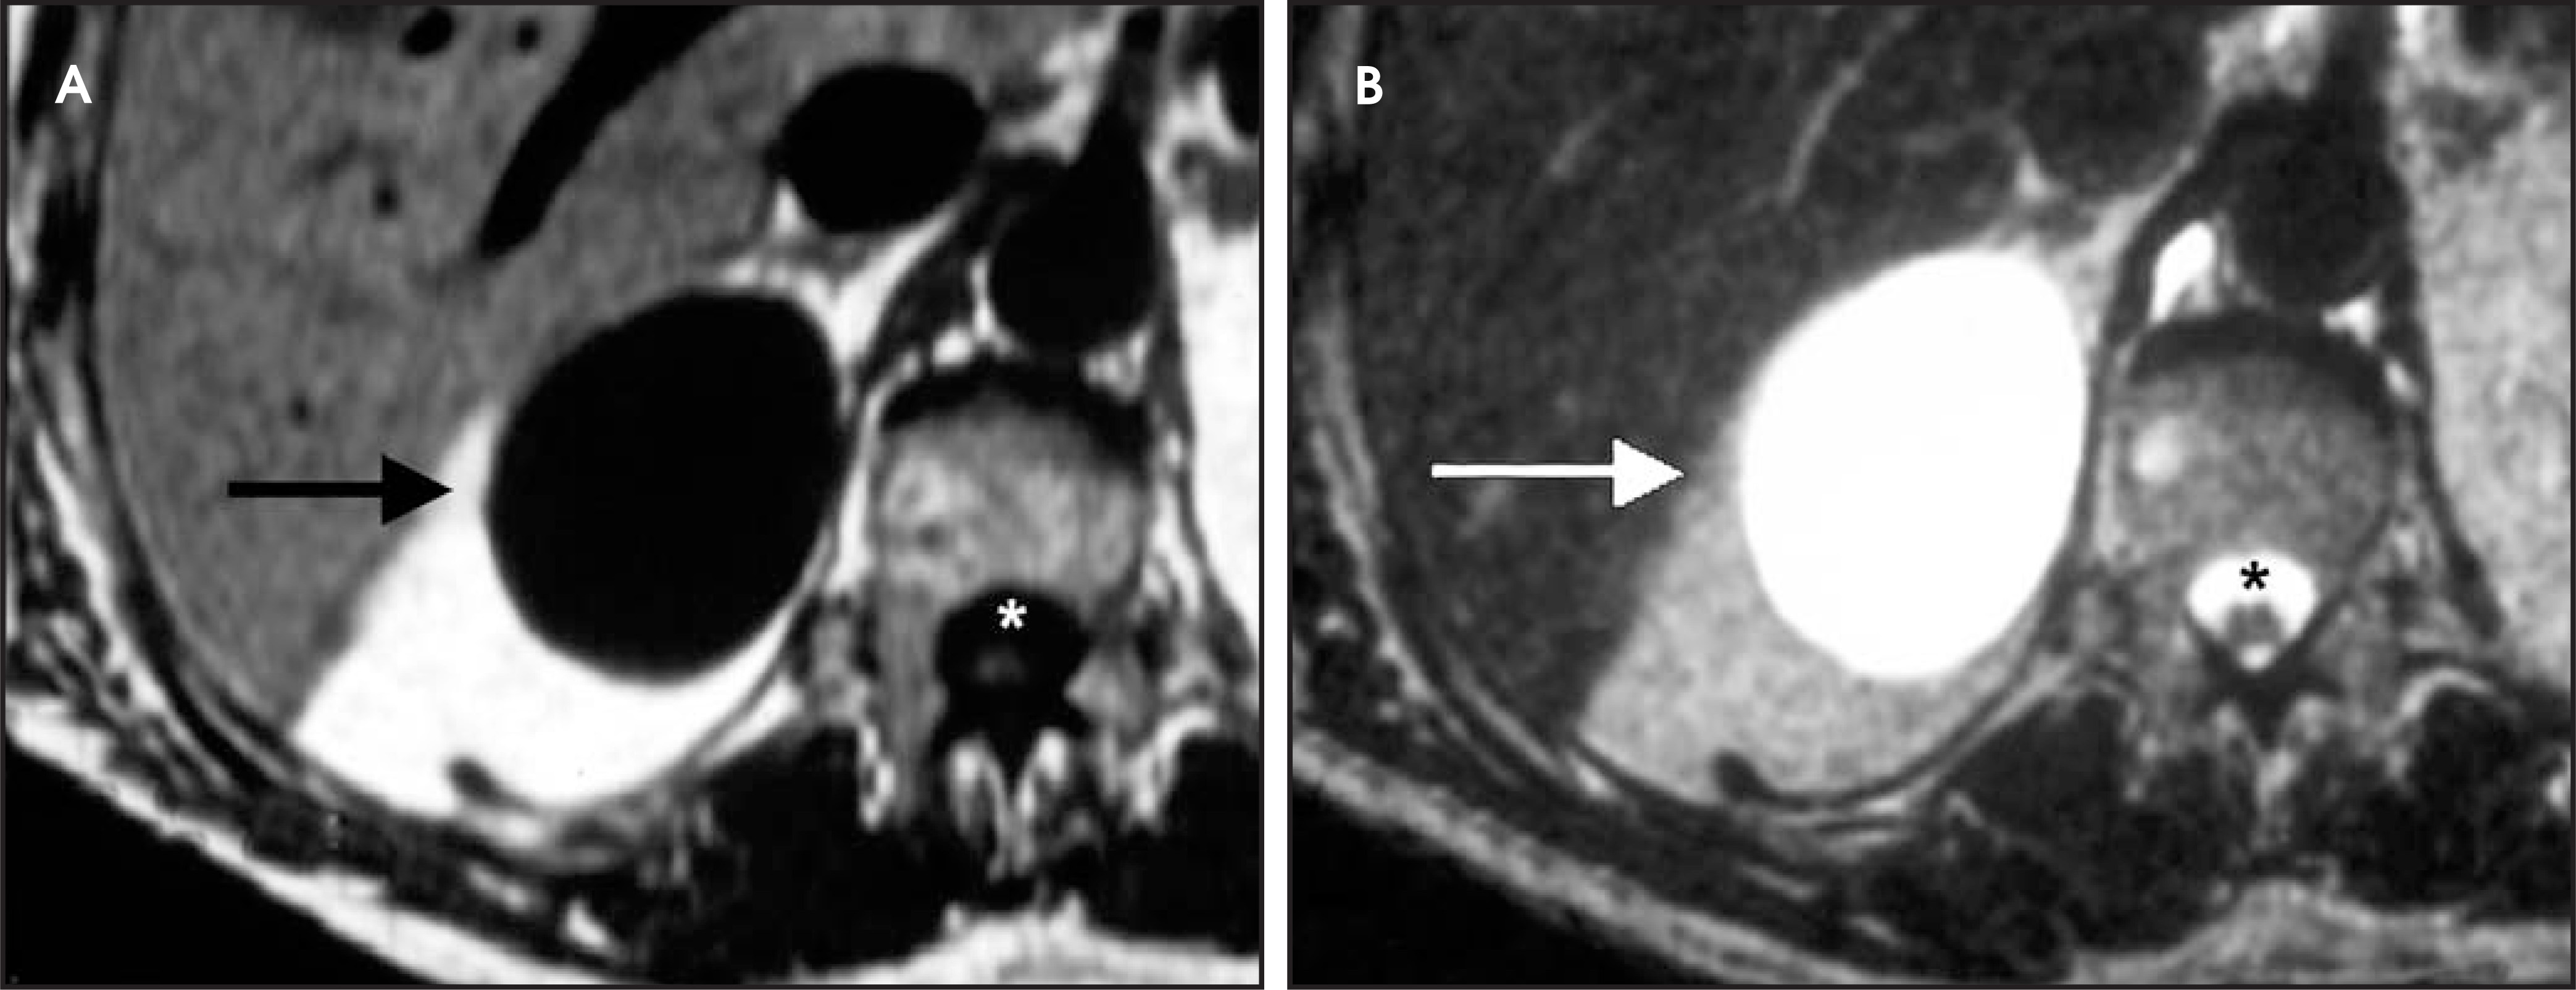
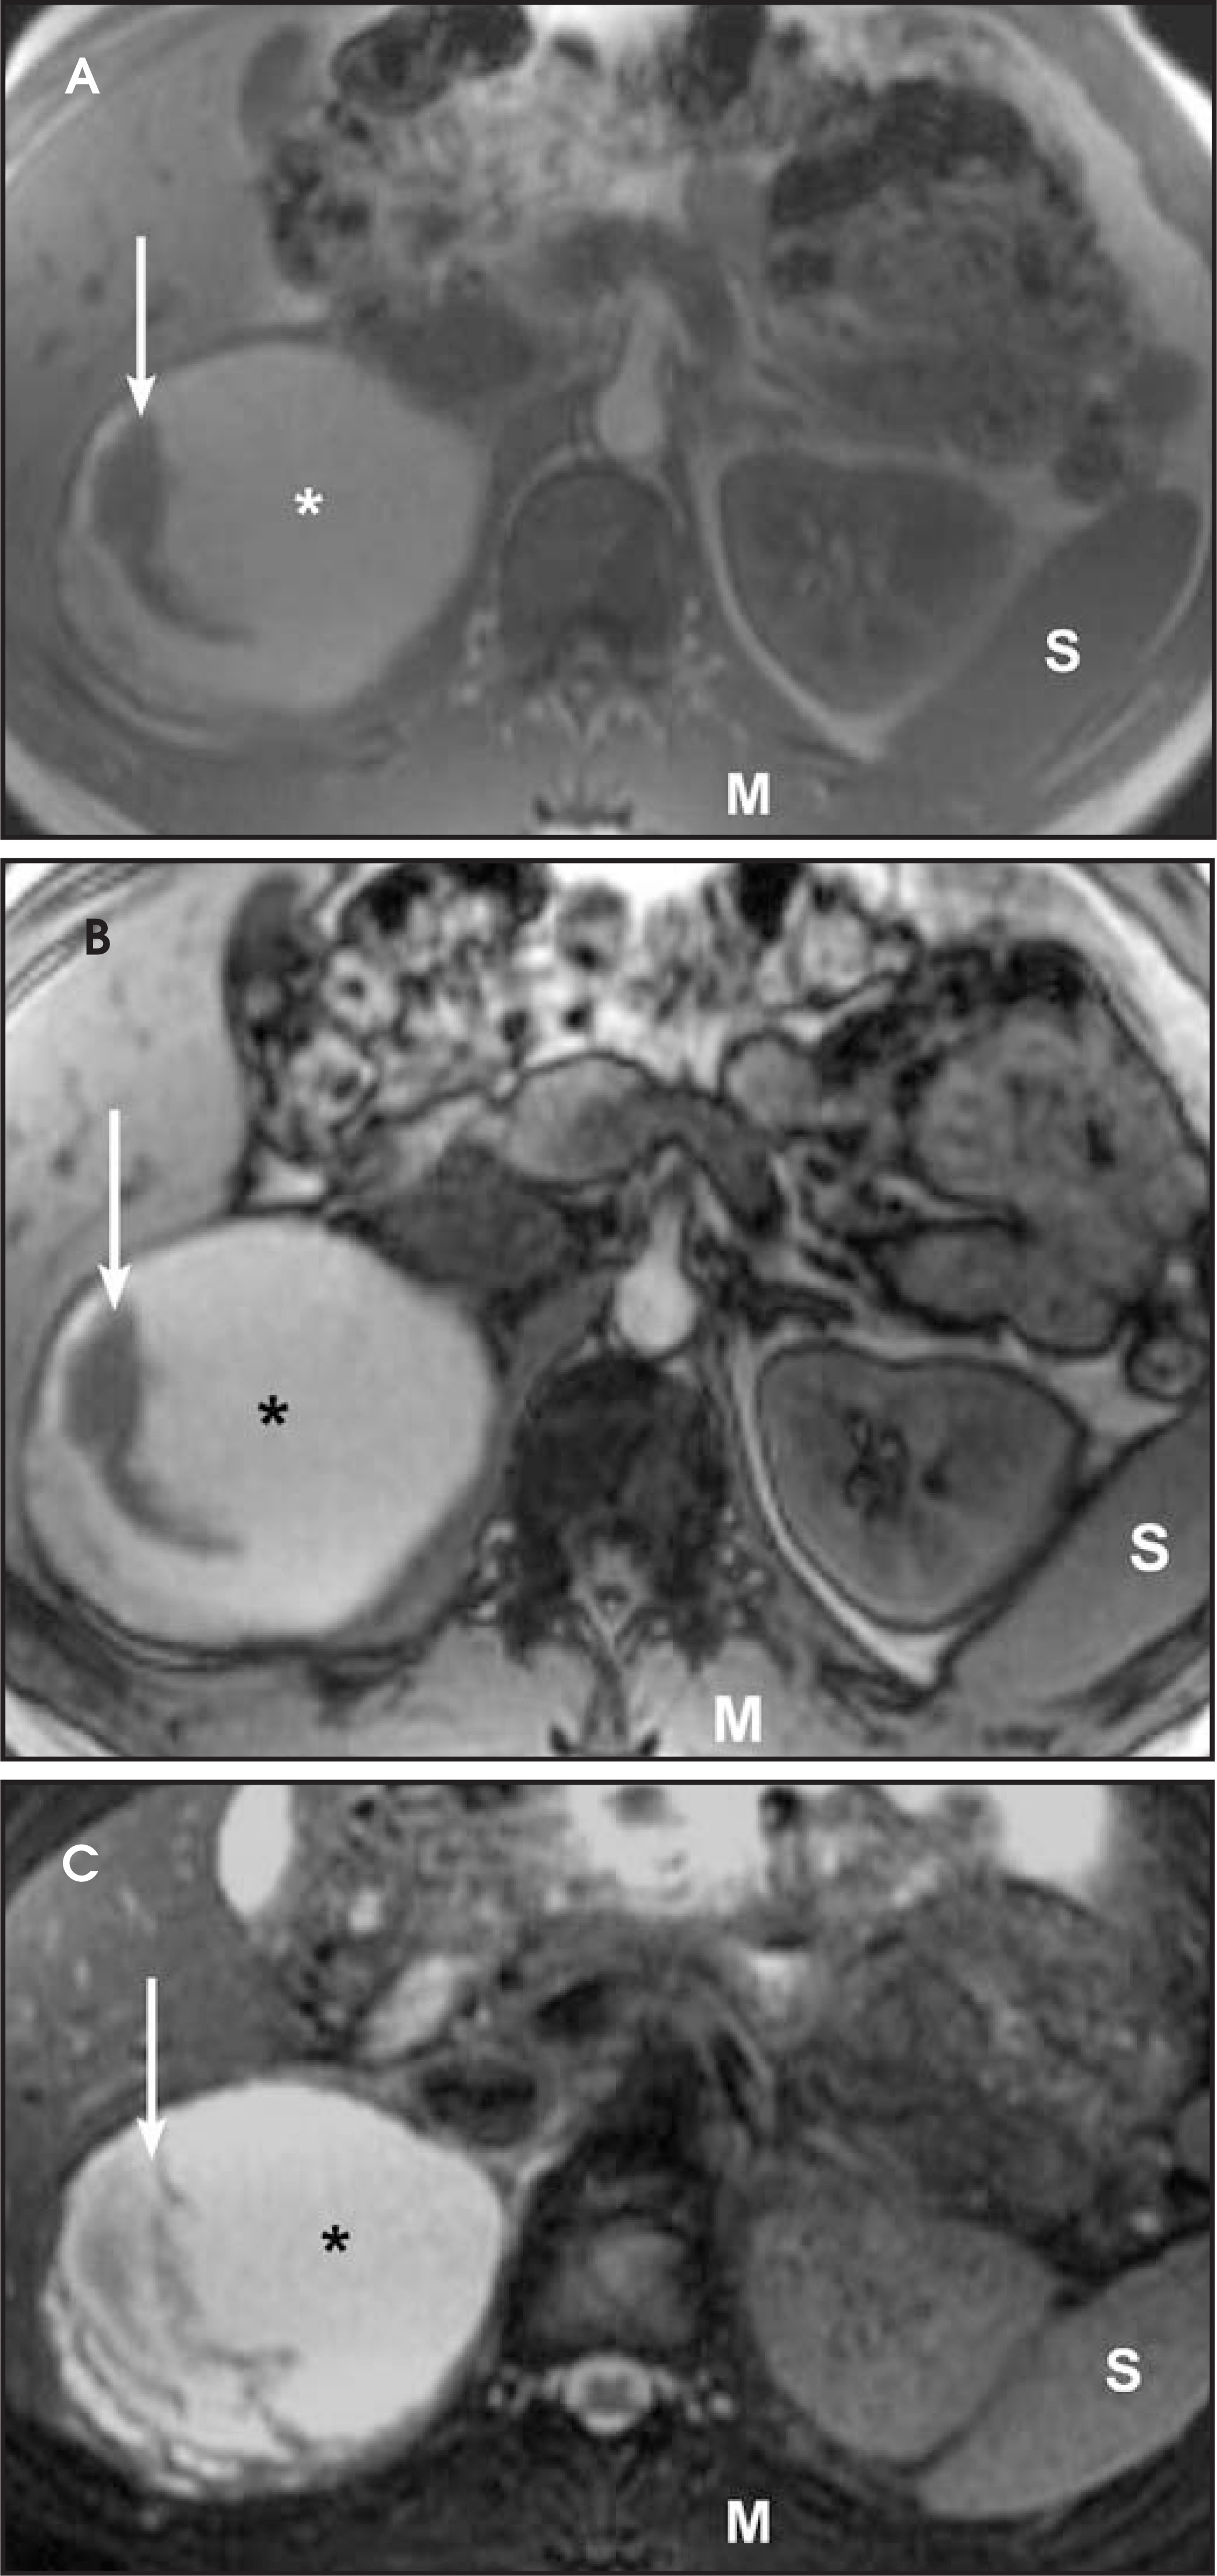
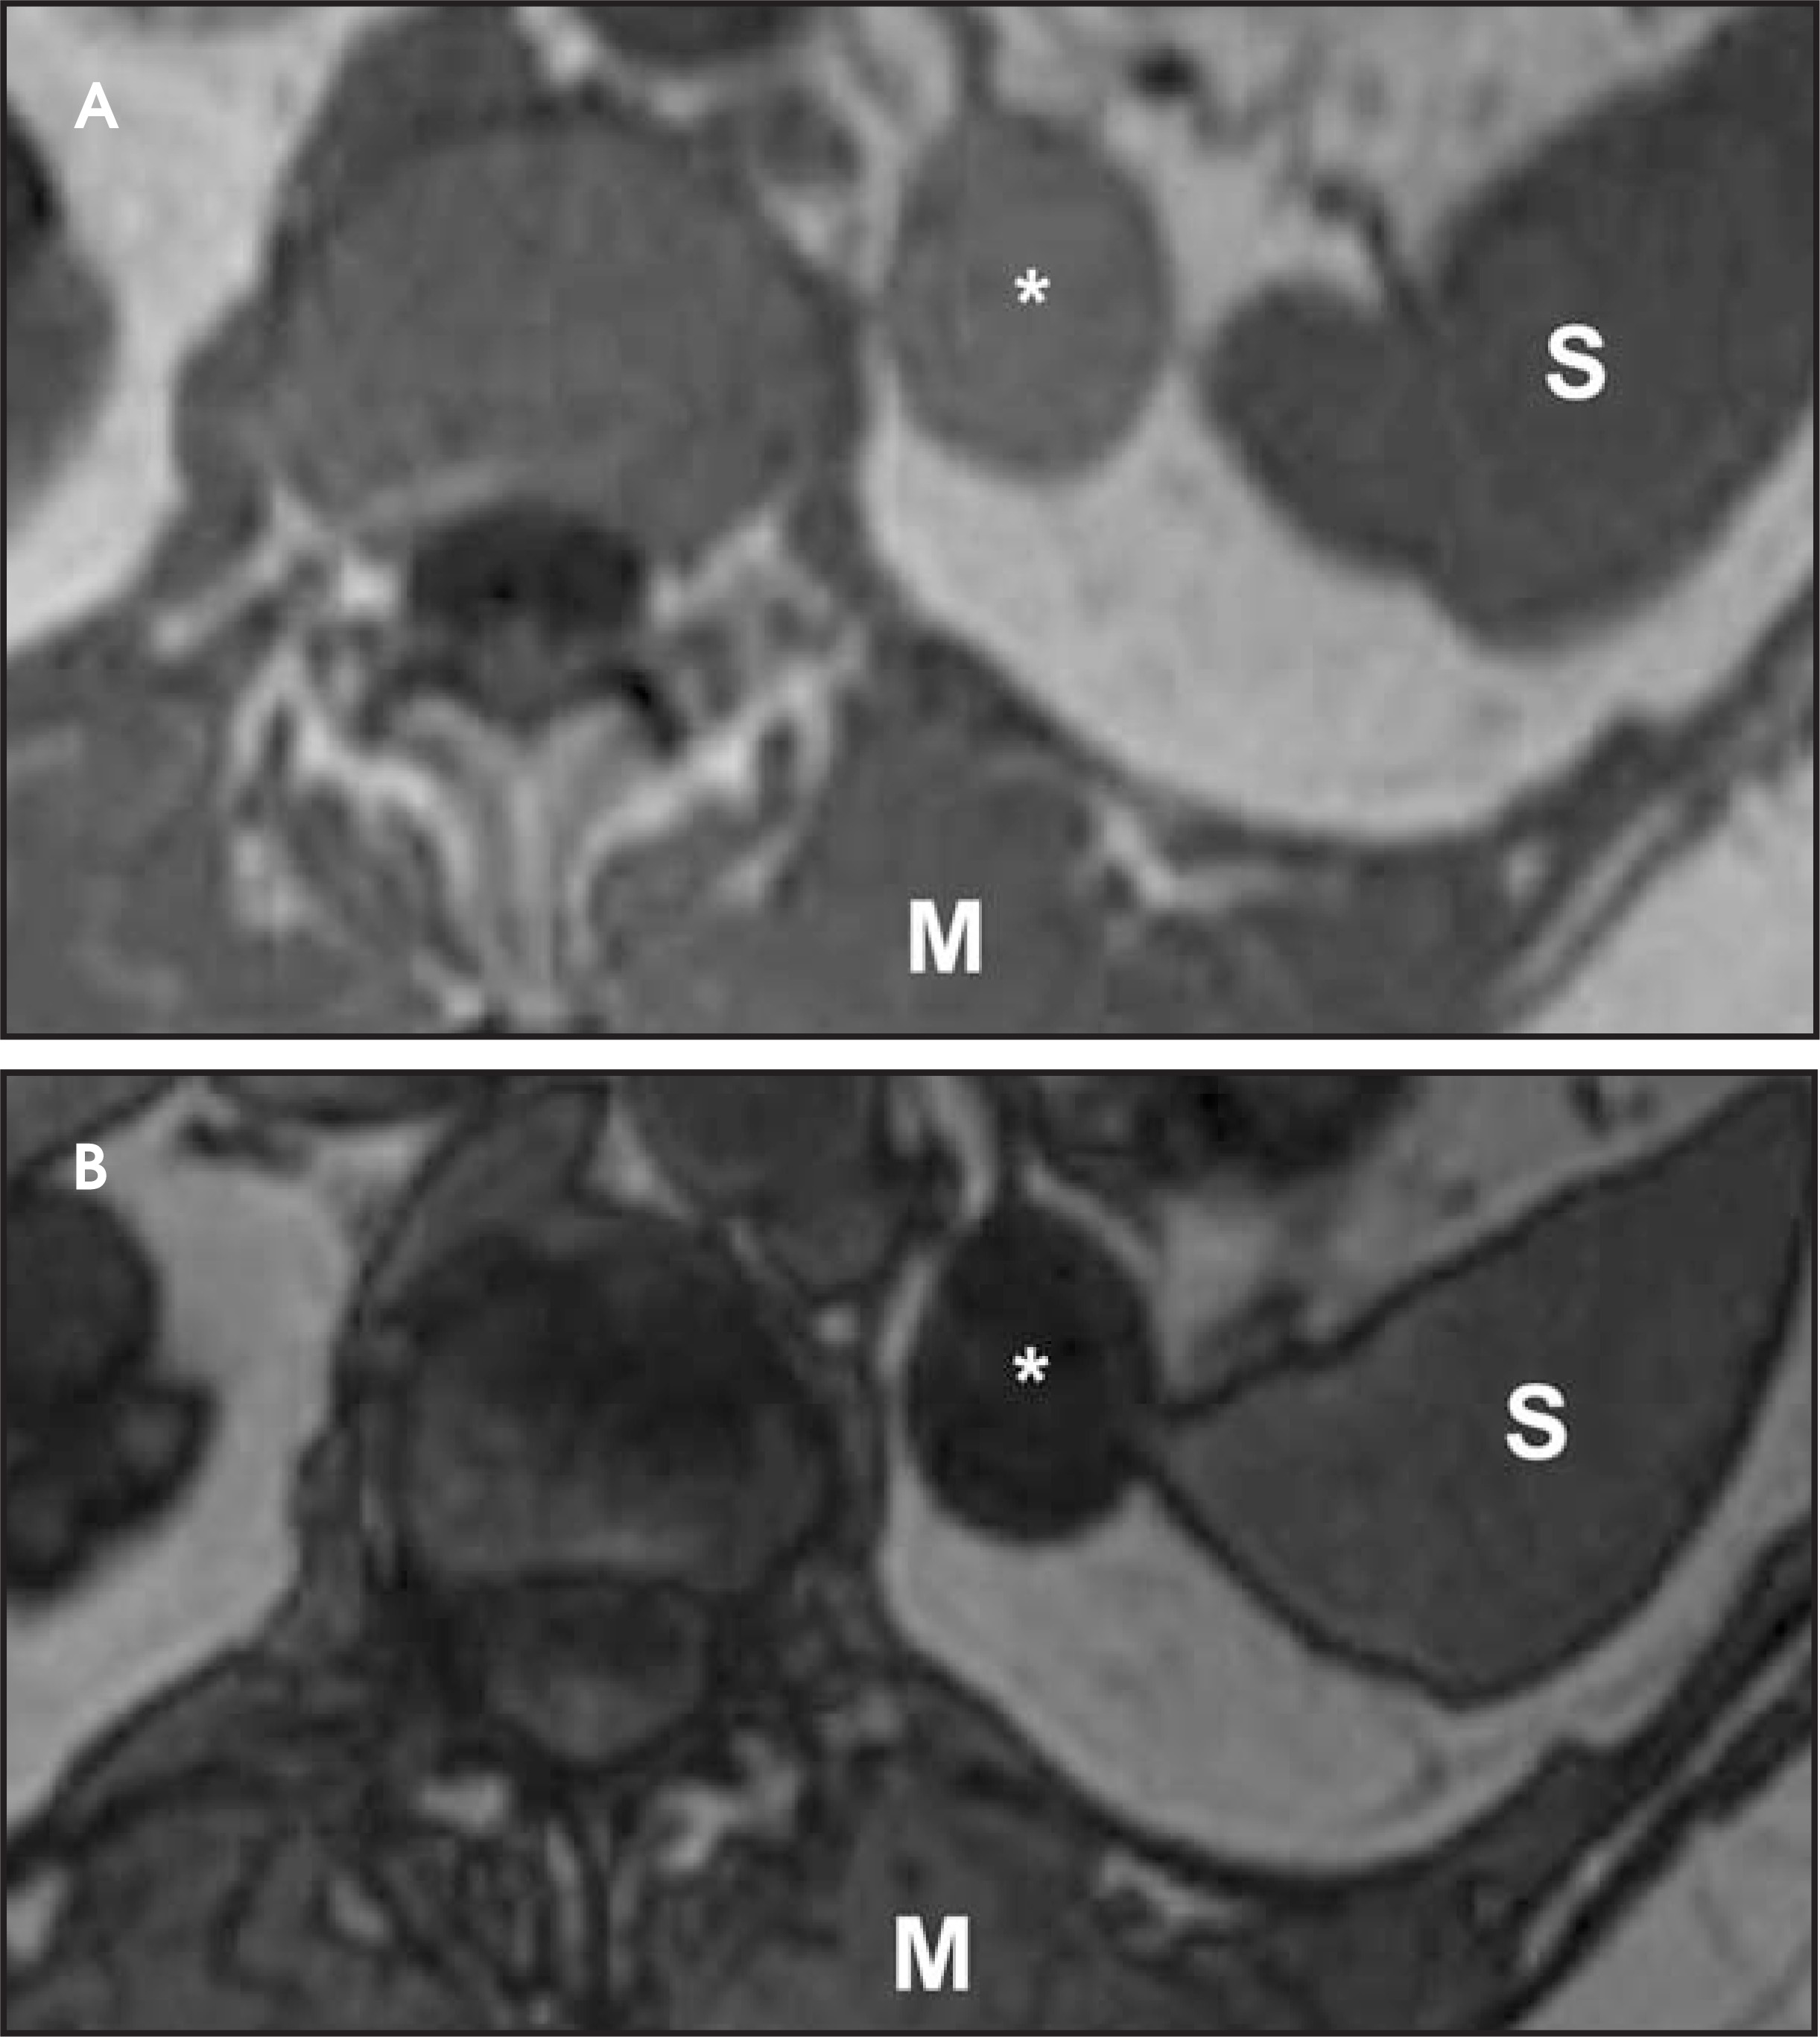
Adrenal cysts are rare, with an incidence of 0.06% to 0.18% in autopsy studies.5 Approximately 40% to 45% are true endothelial-lined cysts, while 39% are pseudocysts, usually evolving from prior hemorrhage.5 Both types are likely to be asymptomatic, incidentally detected lesions. Symptoms may develop if the lesion is very large or in the event of hemorrhage, infection, or rupture. Simple endothelial-lined cysts are more often well-defined cysts with thin or imperceptible walls that show fluid density on CT (Figure 3) and are homogeneously hypointense on T1weighted images and hyperintense on T2-weighted images (Figure 4). No enhancement occurs after the administration of intravenous (IV) contrast.5-7 Pseudocysts may have a more heterogeneous appearance because of the presence of blood products, septations, and calcifications. On MRI, blood products present variable T1- and T2-weighted signal intensities, depending on the stage of degeneration (Figure 5). Calcifications are better appreciated on CT images (Figure 3).7,8
Myelolipomas
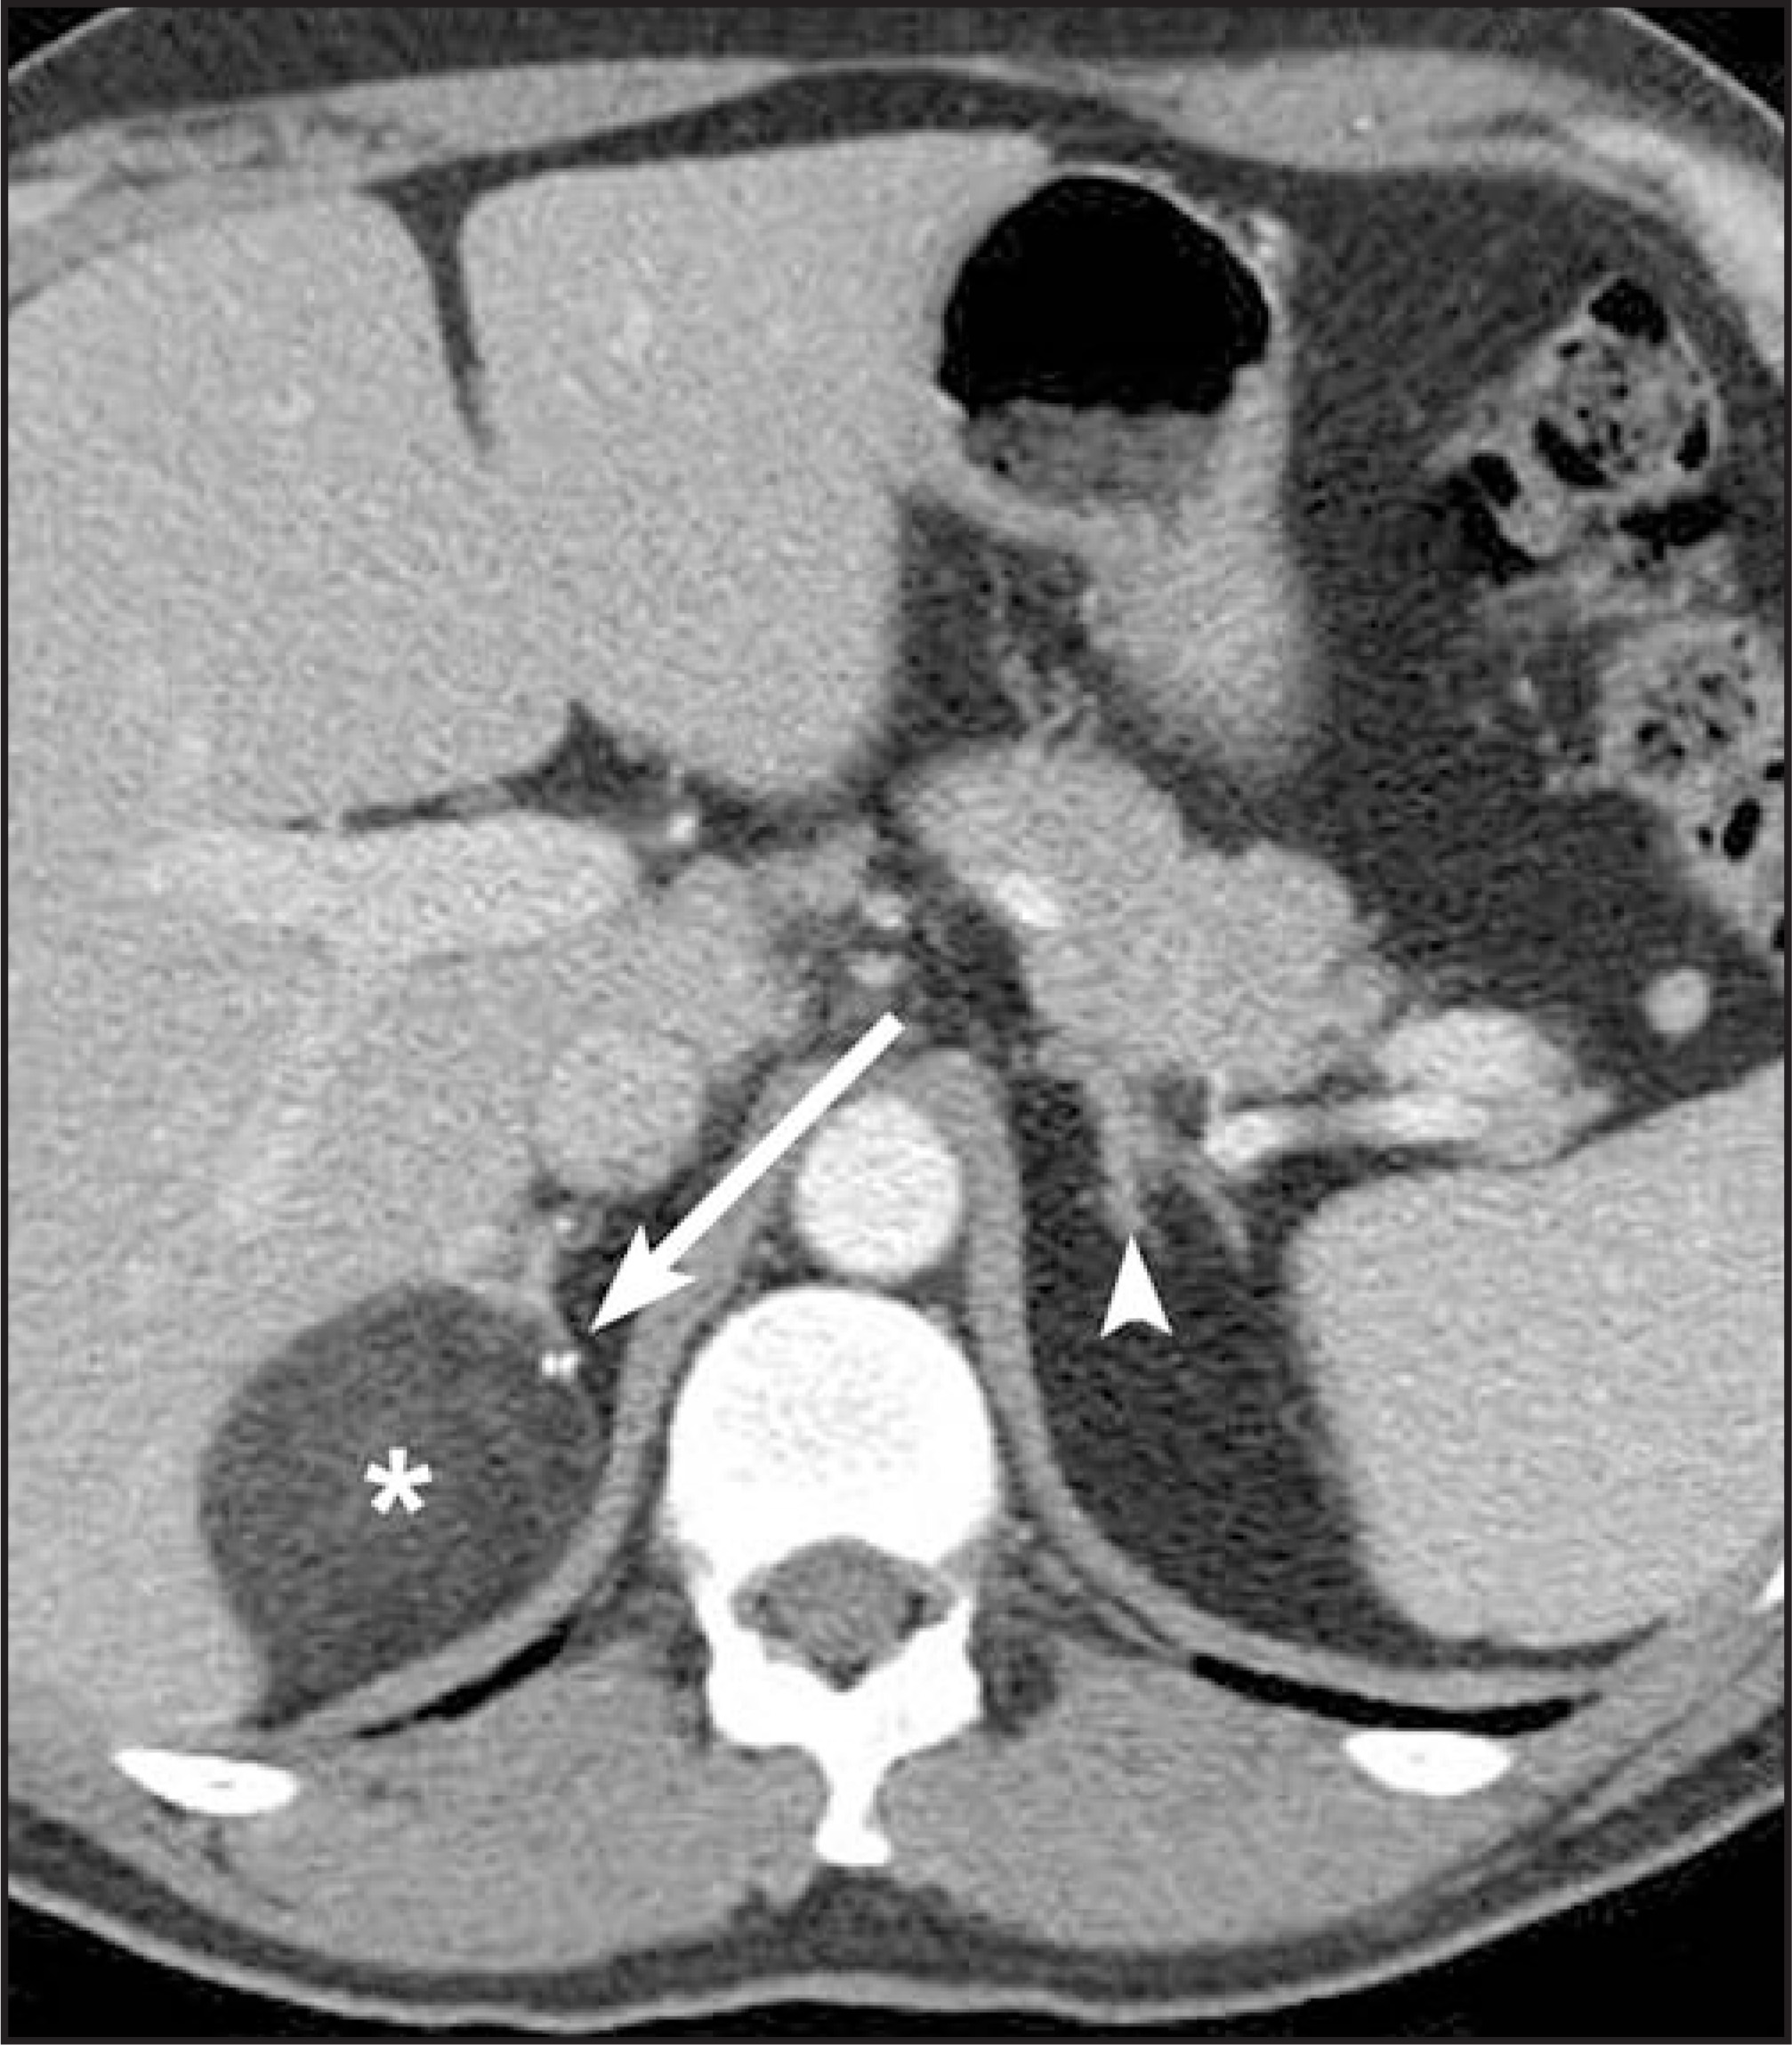
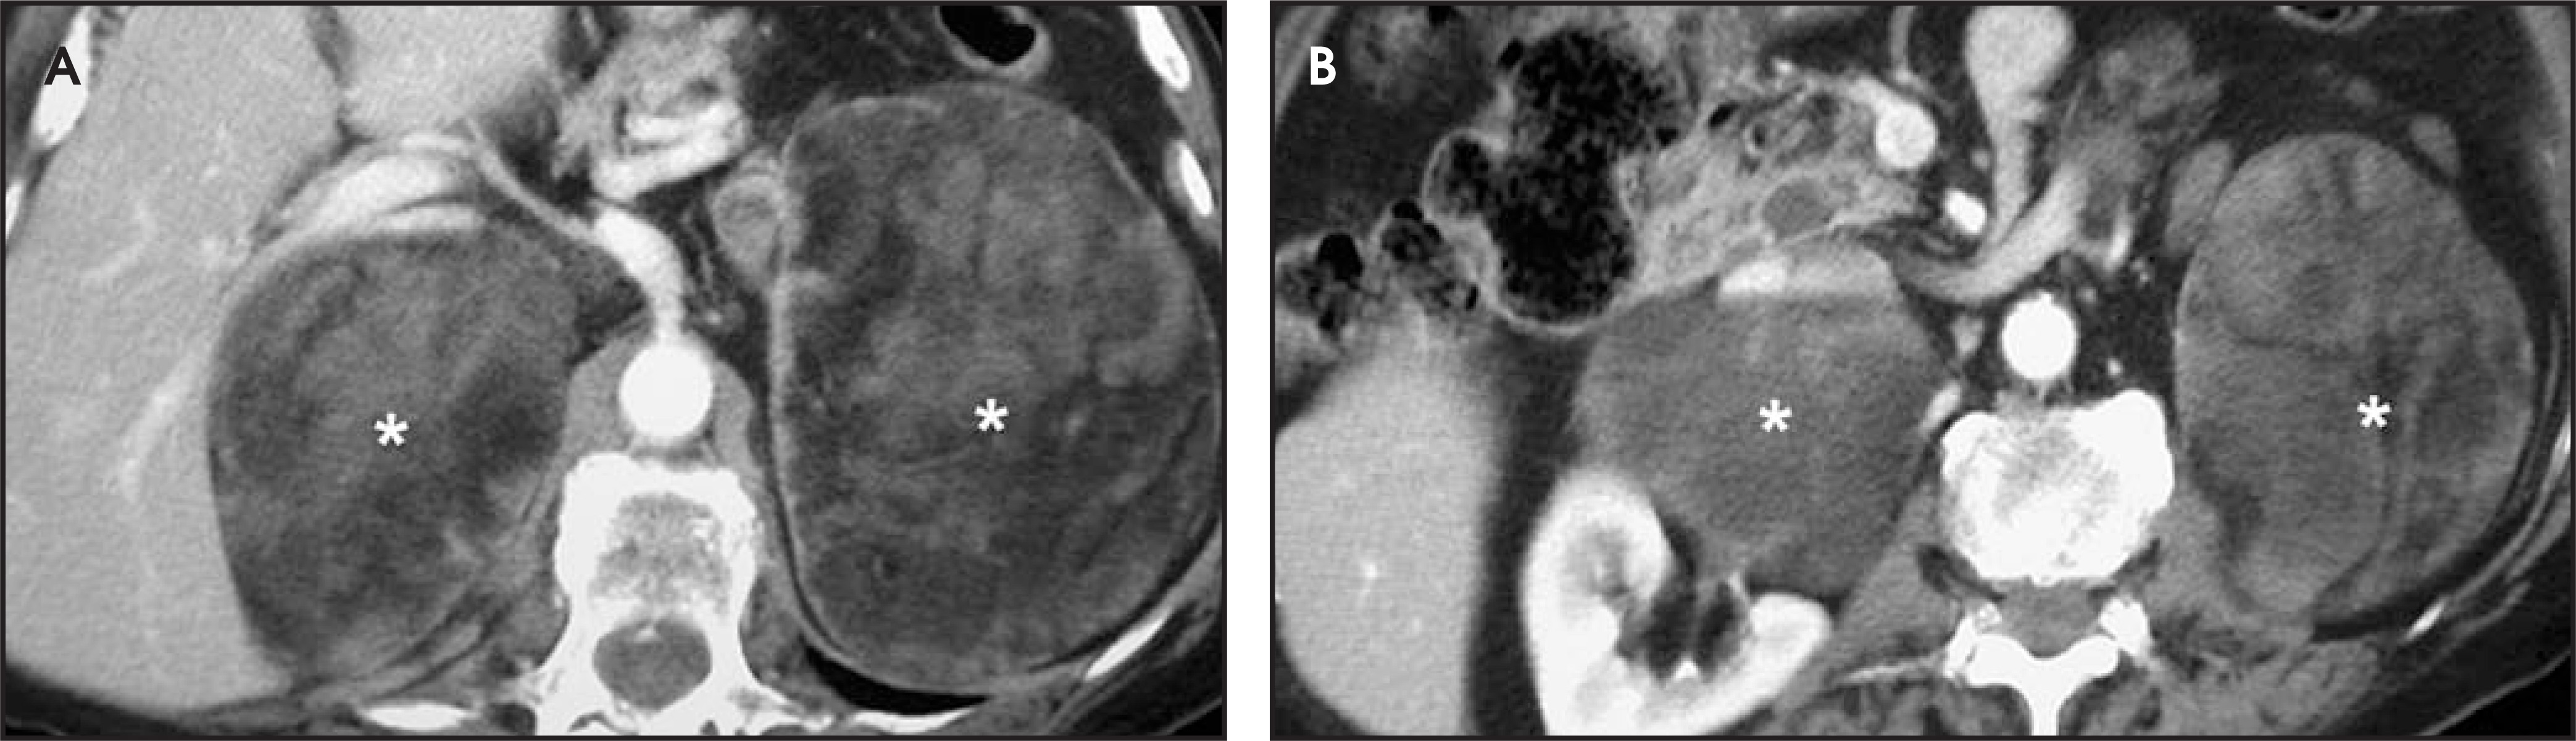
Myelolipomas are rare, benign adrenal tumors, accounting for 3% of all primary adrenal tumors, with a prevalence of 0.06% to 0.2% in autopsy studies.9,10 They are composed of adipose and hematopoietic tissue in varying proportions. Myelolipomas are commonly small unilateral asymptomatic lesions that are found incidentally (Figure 6). The symptoms may arise secondary to hemorrhage or when lesions are large. Giant myelolipomas have been described in the literature (Figure 7).10,11 The diagnosis of myelolipoma is based on the identification of macroscopic fat within the tumor. On MRI, the presence of macroscopic fat can be confirmed when hyperintense foci on T1-weighted images lose signal intensity on fat-suppressed sequences (Figure 8). On CT, fat will show negative Hounsfield values, but visual comparison to visceral or subcutaneous fat is sufficient in most cases.6,7,9,11
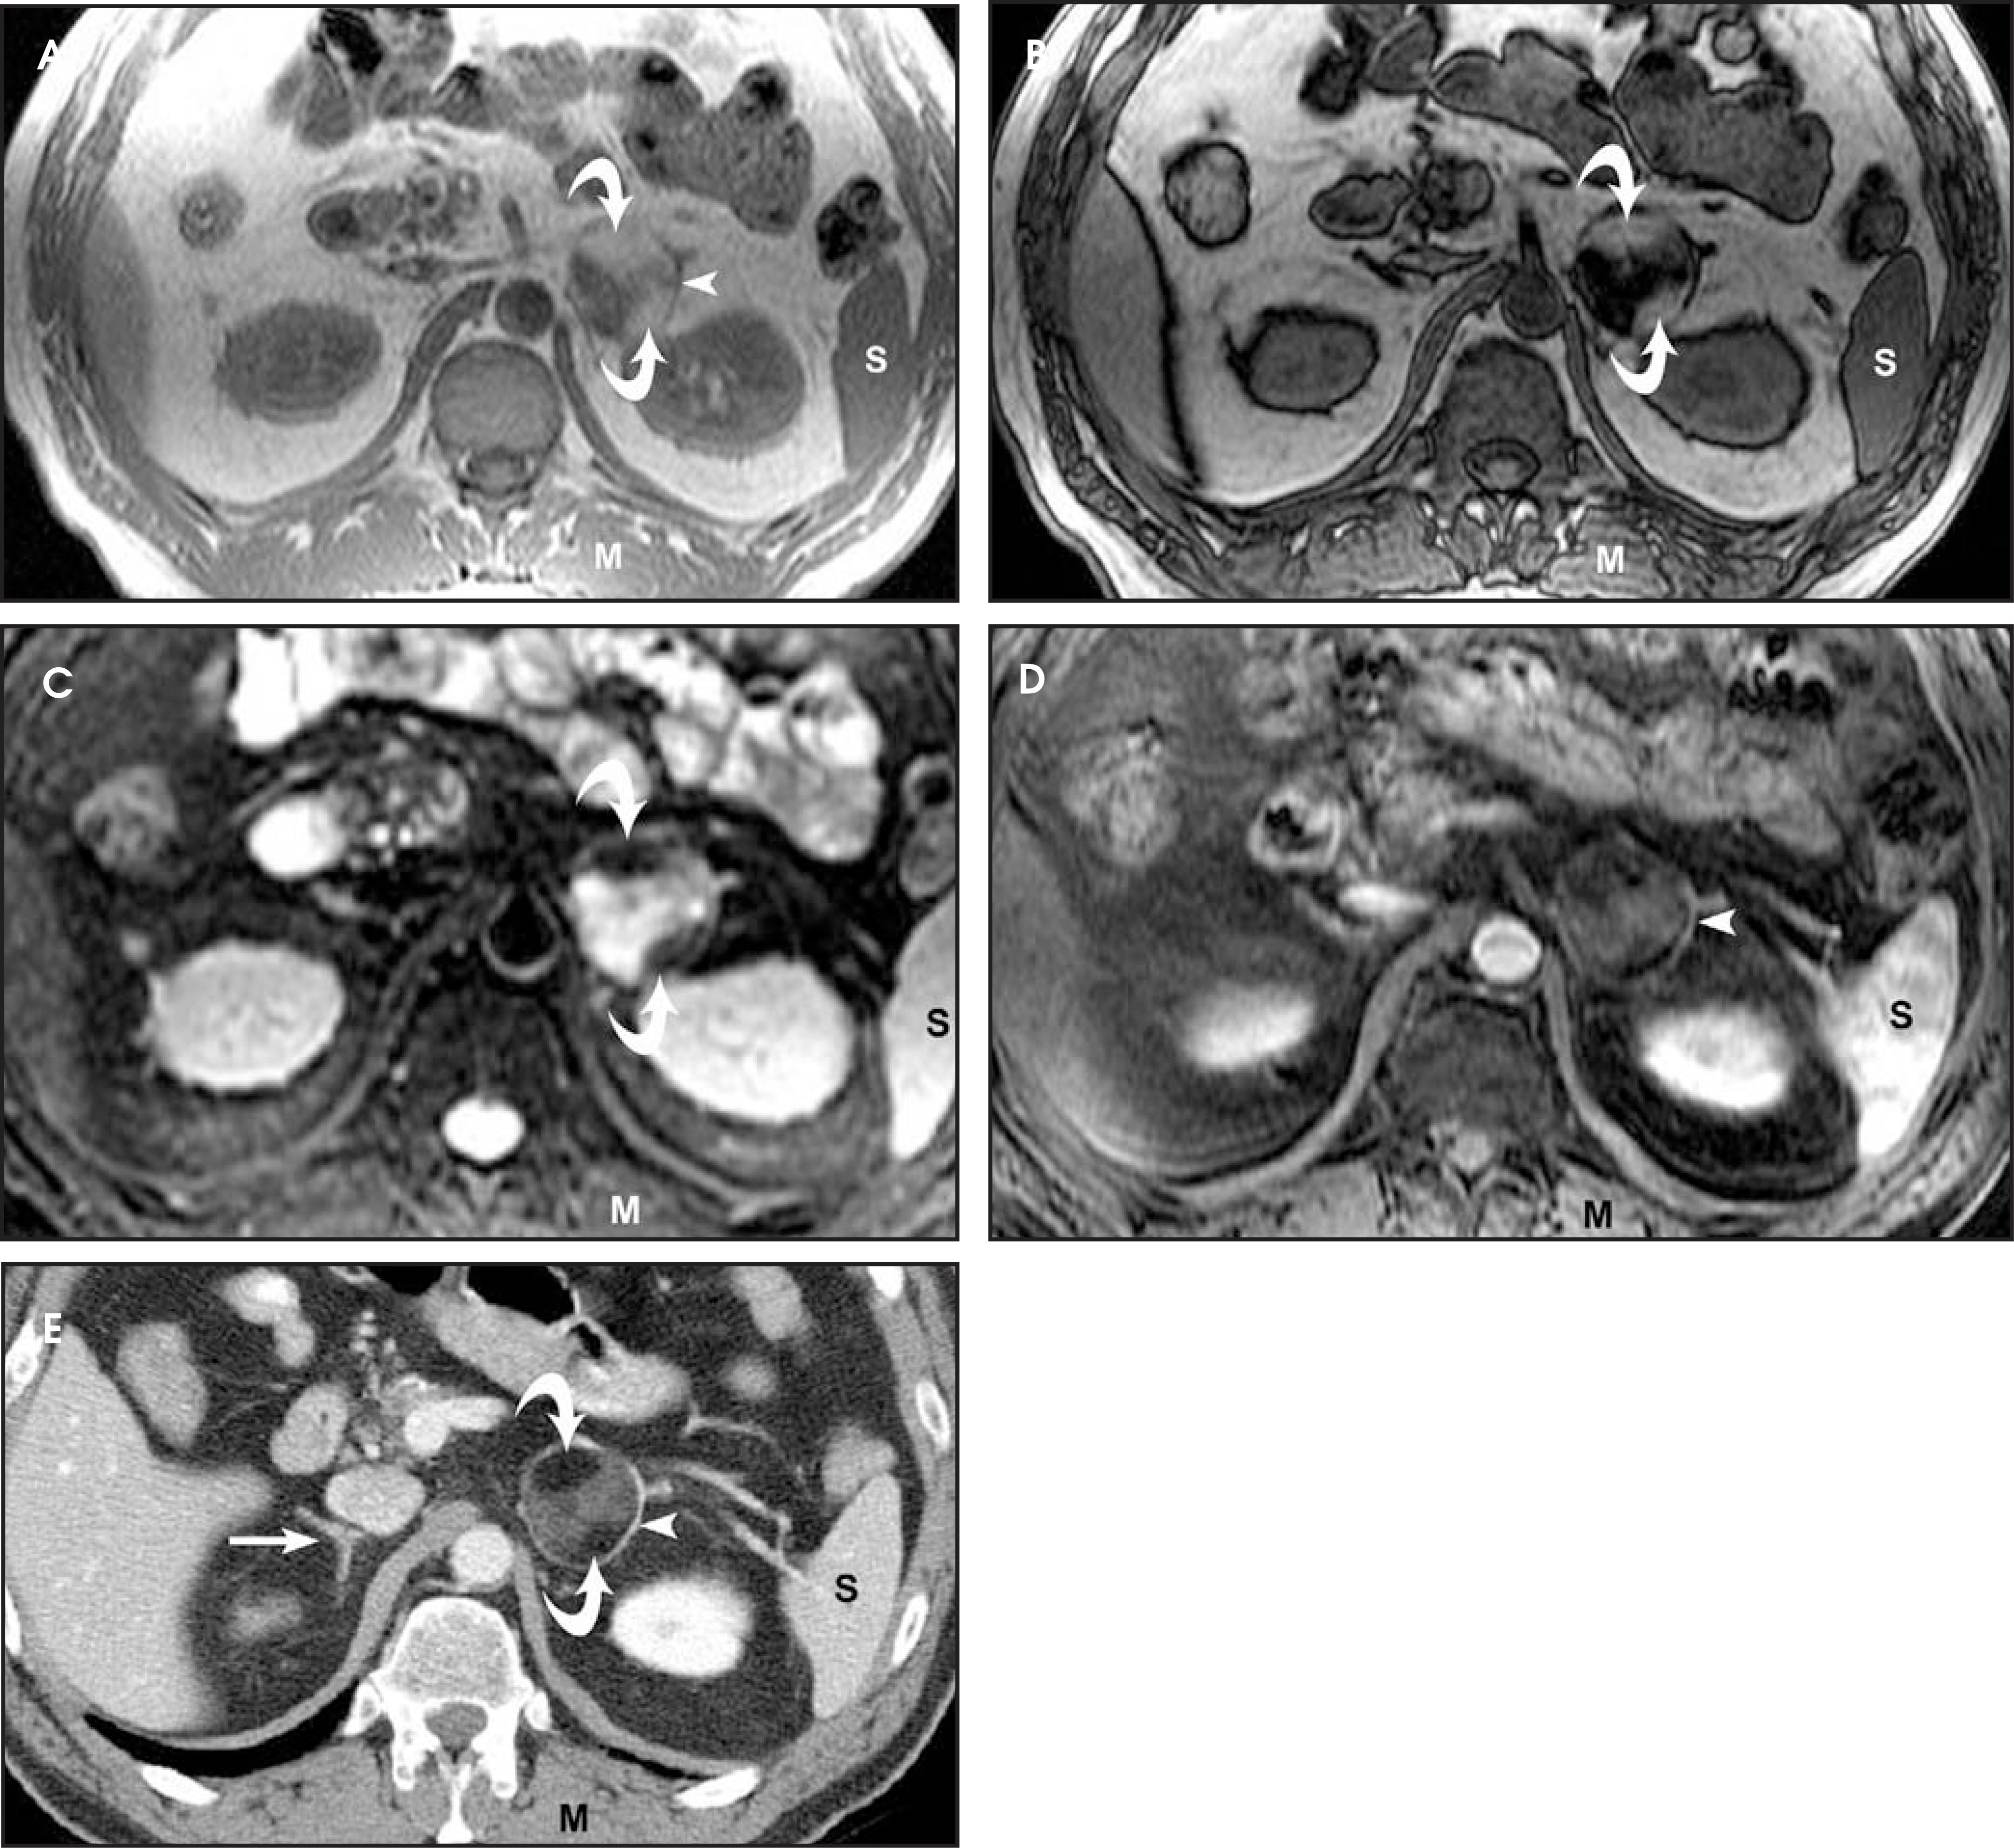
The hematopoietic component of myelolipomas will exhibit enhancement after the administration of intravenous contrast.6,9 Calcifications may be seen in some cases.10
Calcifications
Adrenal calcifications may be the result of hemorrhage (secondary to trauma, venous thrombosis, stress, or bleeding diatheses) or infections (usually granulomatous diseases) or may be associated with different tumors, as discussed in other sections of this article (Figures 3 and 6). Bilateral calcified adrenal glands may be seen in adrenal insufficiency or secondary Addison’s disease. Calcifications may be detected on MRI because of their susceptibility artifact but are much better appreciated on CT images.6-8
Adenomas
A key question for the radiologist when an adrenal mass is detected incidentally in a patient with a known primary malignancy is whether this mass represents a benign lesion or a metastasis. In some cases, the differentiation will be straightforward—for example, when the lesion is a cyst (showing fluid density and no enhancement) or a myelolipoma (containing macroscopic fat). But problems can arise when it is necessary to make the distinction between an adenoma and a metastasis.
Adenomas are the most common adrenal lesion and are found in approximately 2% to 9% of autopsies.1,12 They are usually <5 cm, nonhyperfunctioning, and well-circumscribed with a smooth contour.1,12,13 Differentiation between nonhyperfunctioning and hyperfunctioning adrenal tumors cannot be made on the basis of CT or MRI and is usually a clinical diagnosis.7
CT criteria for adenoma––Several radiologic criteria can be used to diagnose an adenoma. The most well-known technique is to measure the mean attenuation value of the lesion. The rationale for this technique is based on a histologic feature of adenomas—that of abundant intracytoplasmatic lipid in the cortex. In contrast, malignant tumors of the adrenal gland have relatively little intracytoplasmic lipid, which can be detected by CT and MRI. A high correlation between lipid content and density measurements on CT has been shown, and when attenuation levels are between 10 HU and 15 HU or less on thin-section non-enhanced CT images, the diagnostic specificity approaches 100% (Figure 9). Although nonenhanced CT has a very high specificity, sensitivity is low, and higher attenuation values do not exclude the diagnosis of adenoma13-15
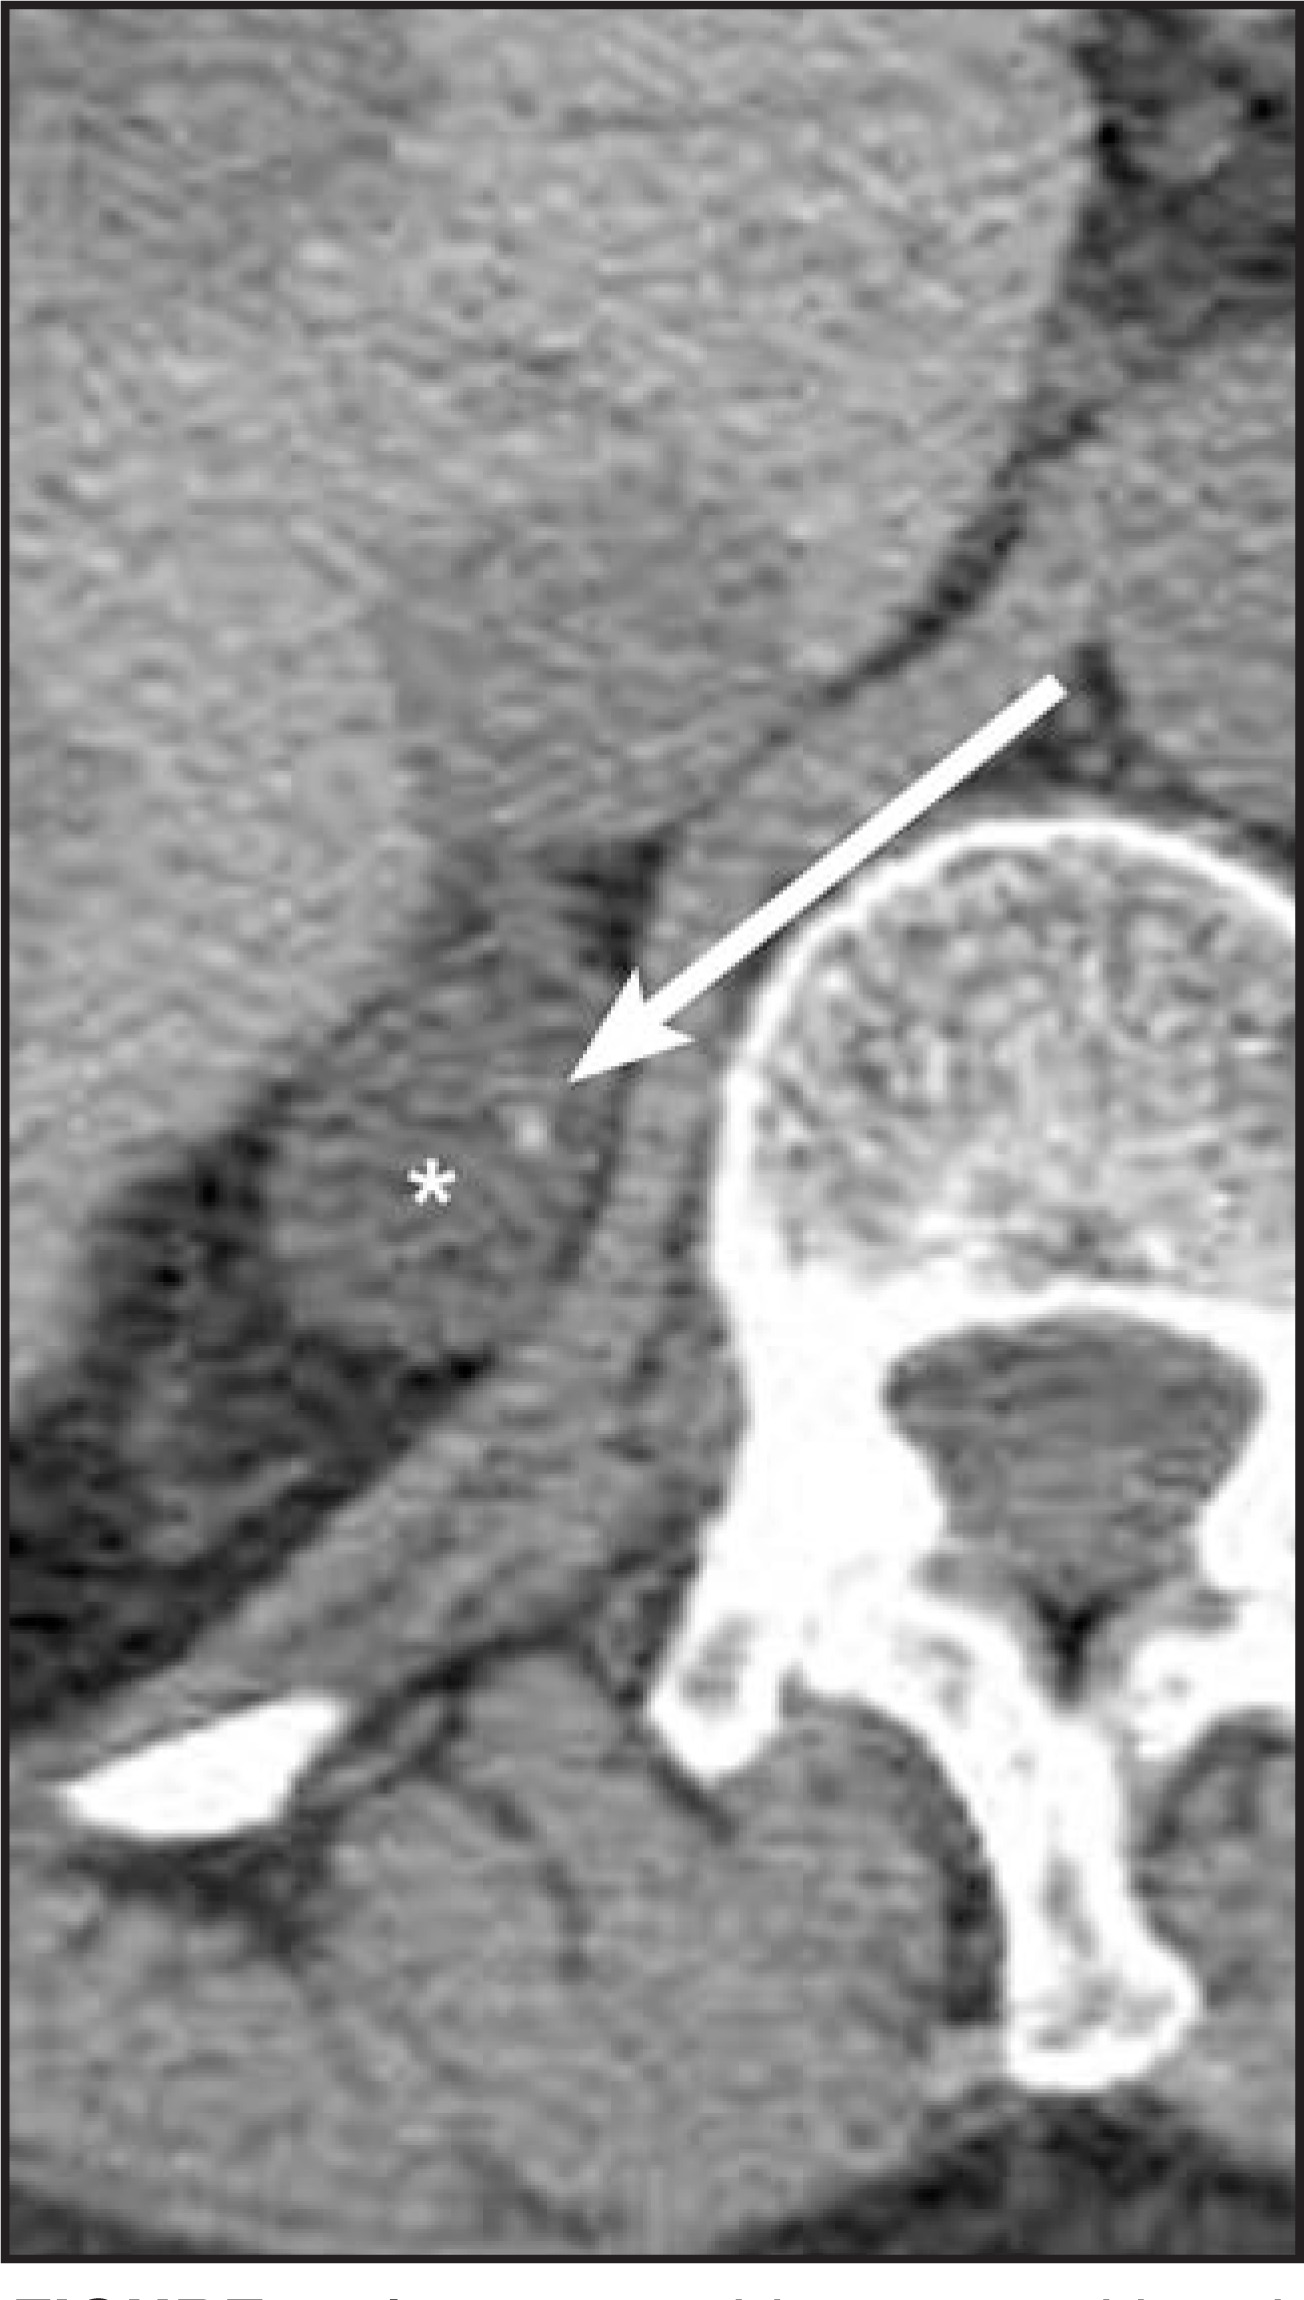
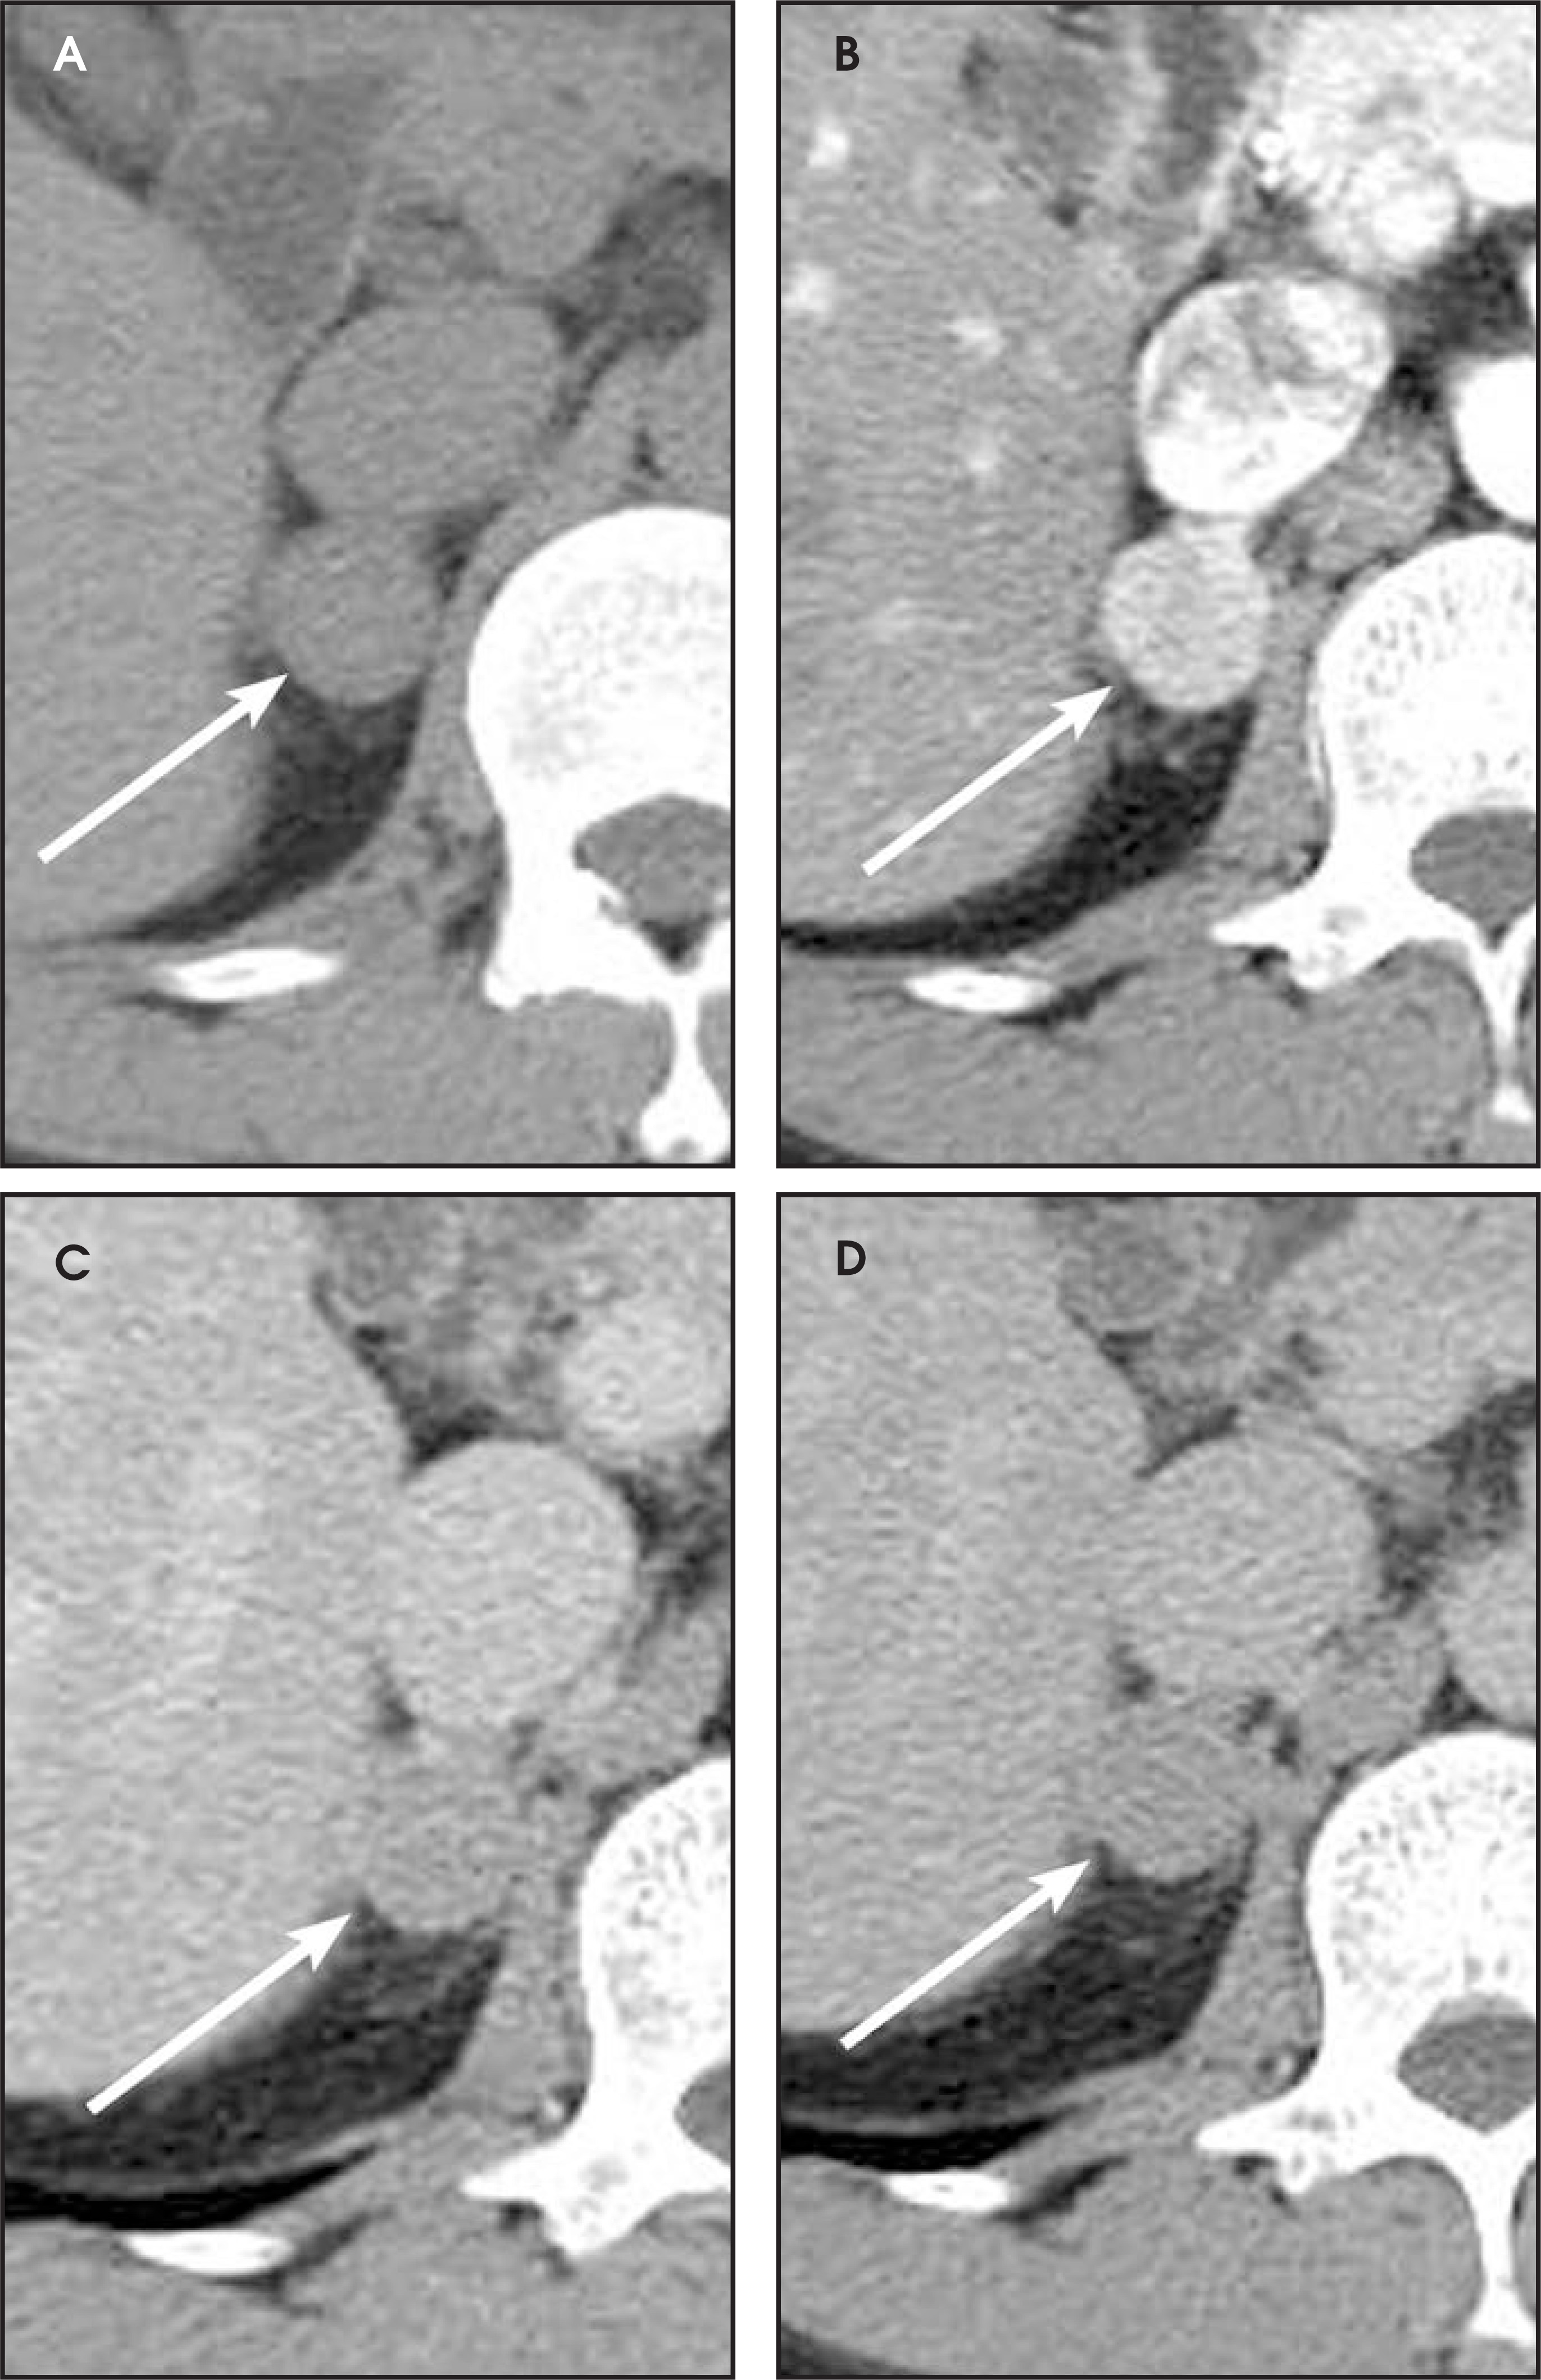
Unfortunately, most CT examinations of the abdomen are performed after IV contrast, particularly if the indication is to look for metastatic disease, and mean attenuation measurements of adrenal adenomas may often be greater than 10 to 15 HU on postcontrast images. In this instance, looking at the contrast washout pattern of the adrenal lesion may help to diagnose an adenoma.
Studies have shown that adenomas show rapid washout of contrast when compared with nonadenomas and that this characteristic can be detected on delayed images acquired 10 to 15 minutes after the administration of IV contrast (Figure 10). If a relative washout of 40% to 50% is demonstrated, the test has a sensitivity of 83% to 93% and specificity of 93% to 98% for the diagnosis of an adenoma.16,17 An absolute washout of 60% is also highly specific and sensitive to make this differentiation.16,17 These parameters can be used to differentiate lesions that are nonspecific on nonenhanced CT (lipid-poor adenomas), as well as to characterize lesions identified only after the administration of IV contrast, when the use of a threshold of 10 HU or 15 HU is less likely to be useful for the diagnosis of adenoma.15-18
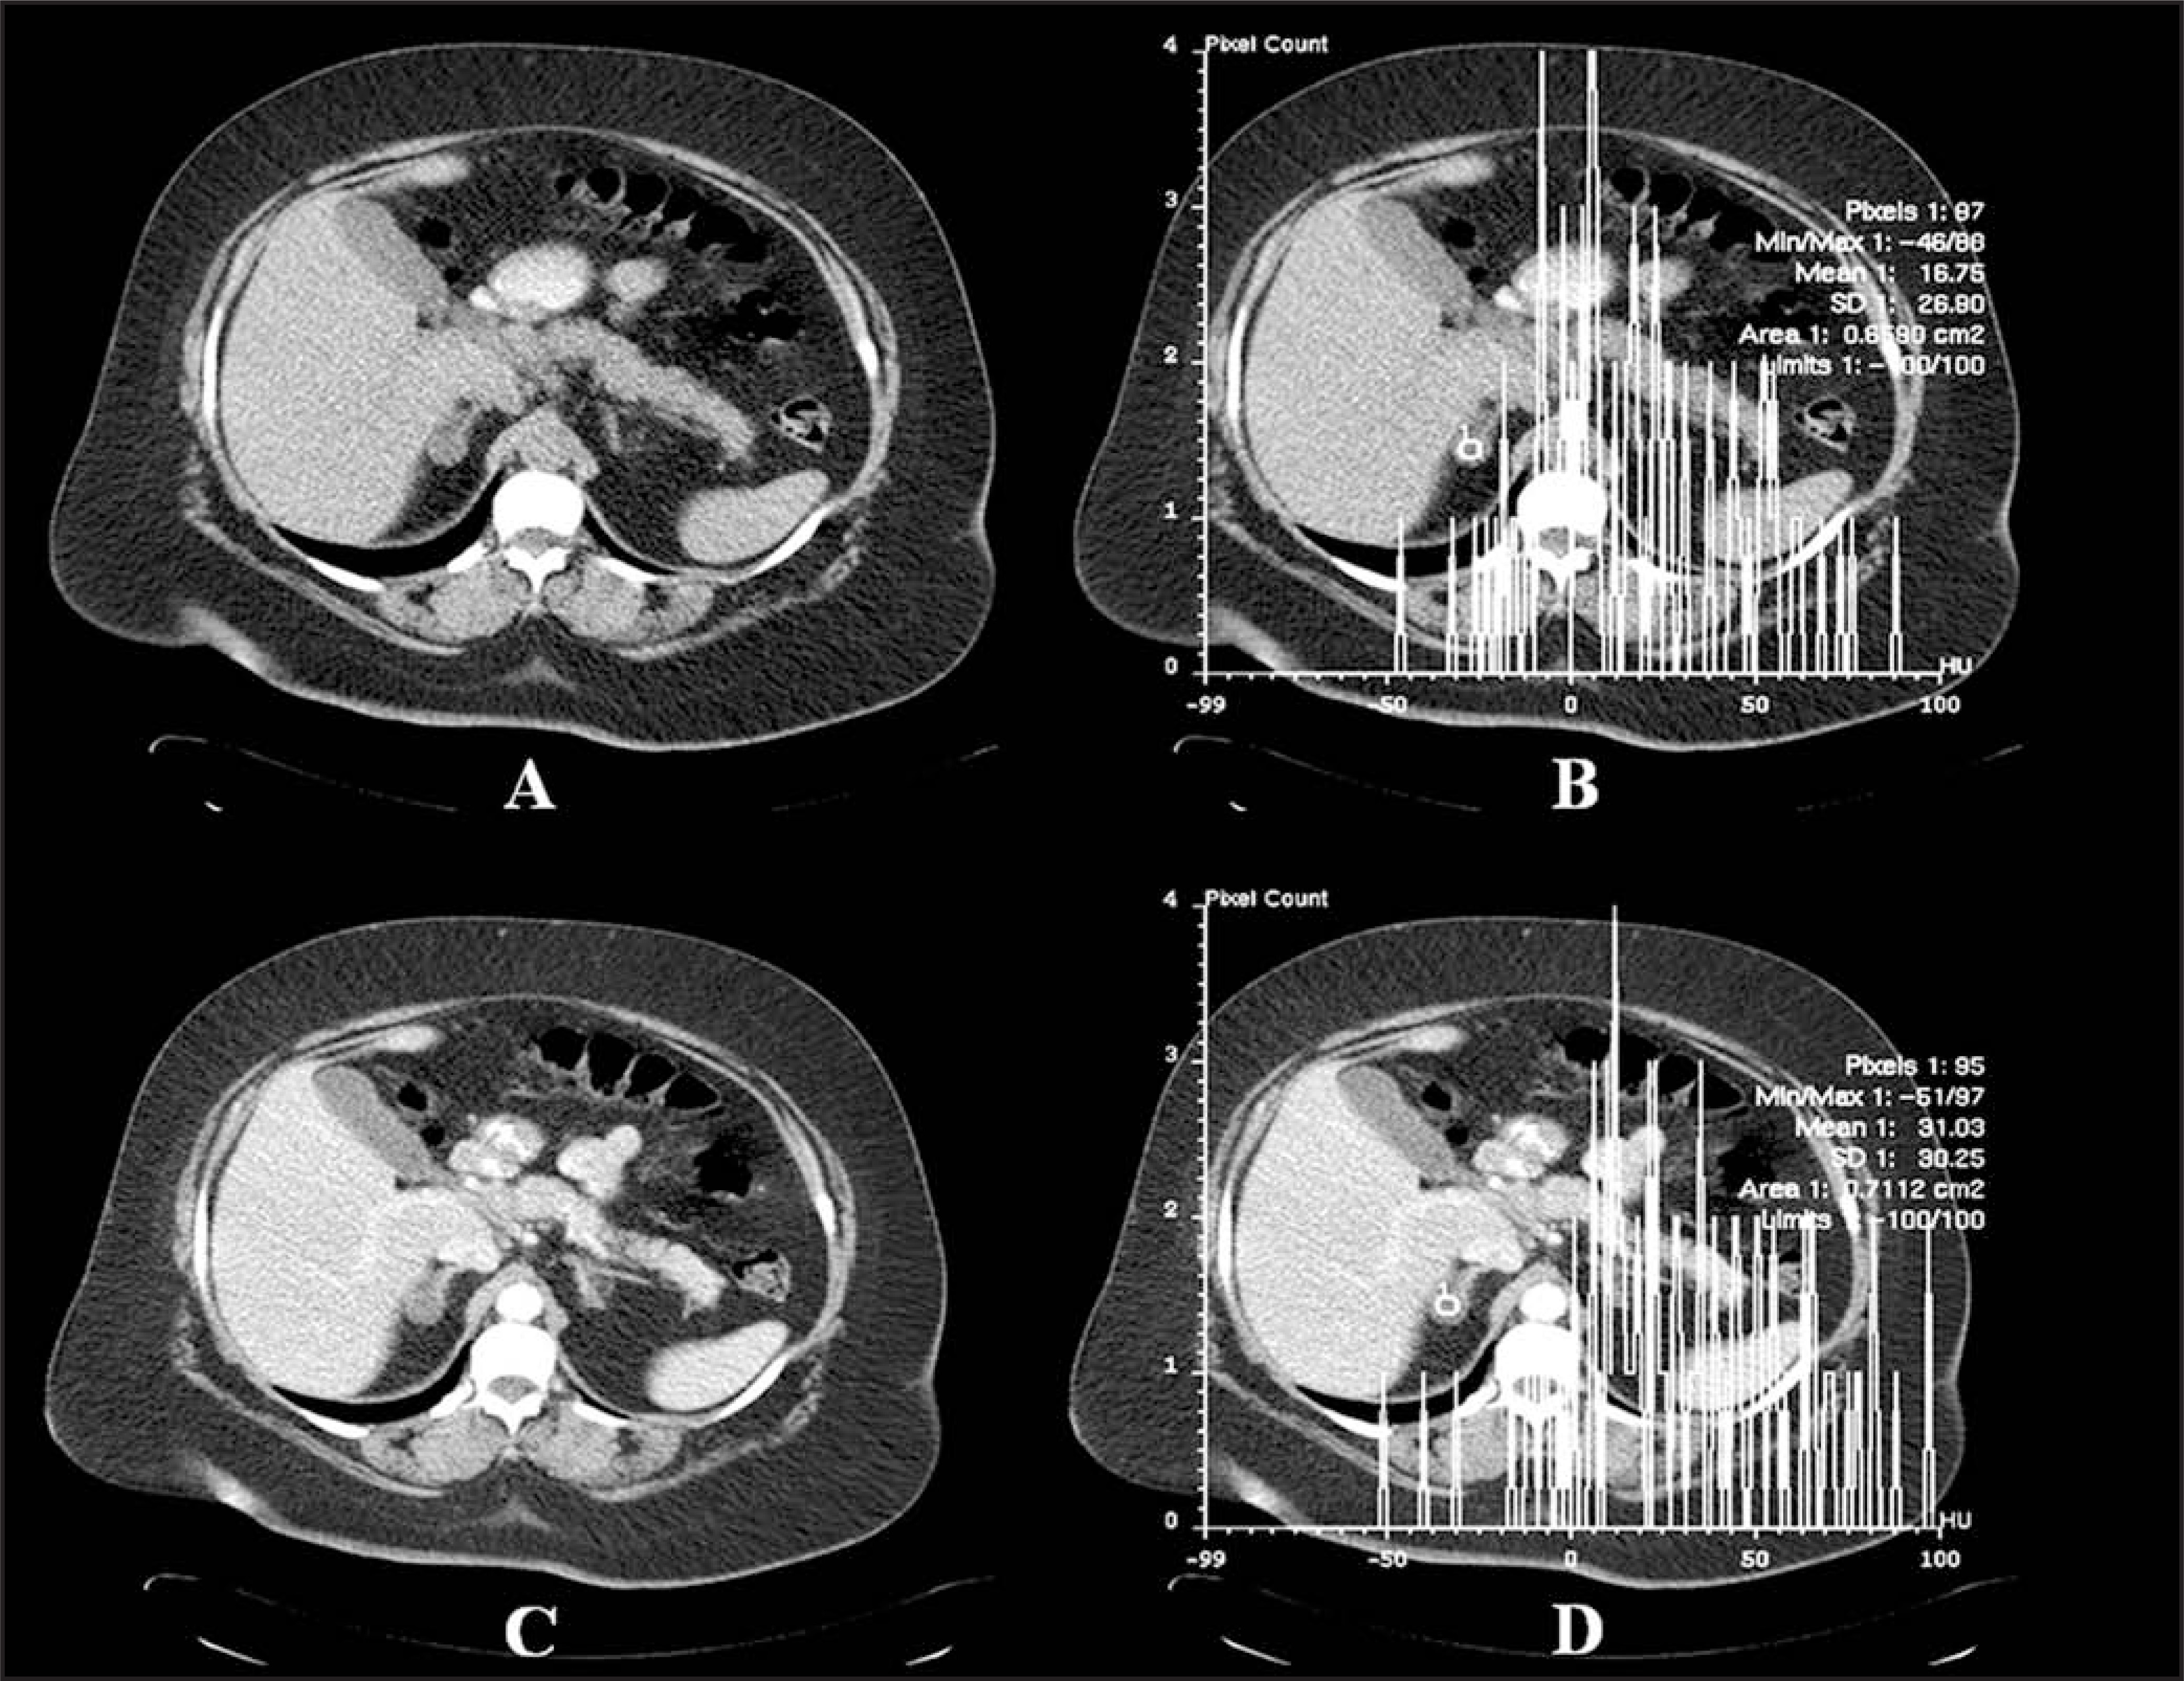
Recently, a new method to detect the presence of fat within adrenal lesions was described by Bae et al.19 This study found that an accurate diagnosis of adenoma could be made using a histogram analysis method consisting of selecting a region of interest (ROI) within the adrenal mass and looking at the histogram distribution of pixel attenuation values. In this study, the presence of at least 10% negative pixels (ie, 10% lipid pixels) provided a specificity of virtually 100% for diagnosing adenoma. The technique is illustrated in Figure 11.19 Although the sensitivity of this method was not high (reported to be 28%), the technique was found to have potential application in cases in which IV contrast was administered but delayed images were not available.
MRI criteria for adenoma––On MRI, the presence of intracellular lipid in adenomas is reliably identified with the use of chemical shift imaging with an accuracy >90%.20 The signal loss on opposed-phase images related to intracellular lipid is based on phase cancellation of fat and water protons within the same voxel. The concept of chemical shift imaging is further described in the Appendix of this article. Signal loss ≥20% in an adrenal lesion on opposed-phase images relative to in-phase images is characteristic of an adenoma. This signal loss is usually apparent by visual inspection using the spleen or skeletal muscle as a reference standard (Figures 12 and 13). The liver is not a reliable reference standard because fatty infiltration of the liver is quite common and will cause the liver to lose signal intensity on out-of-phase images.7,14,20-23
Malignant and potentially malignant masses
Metastases
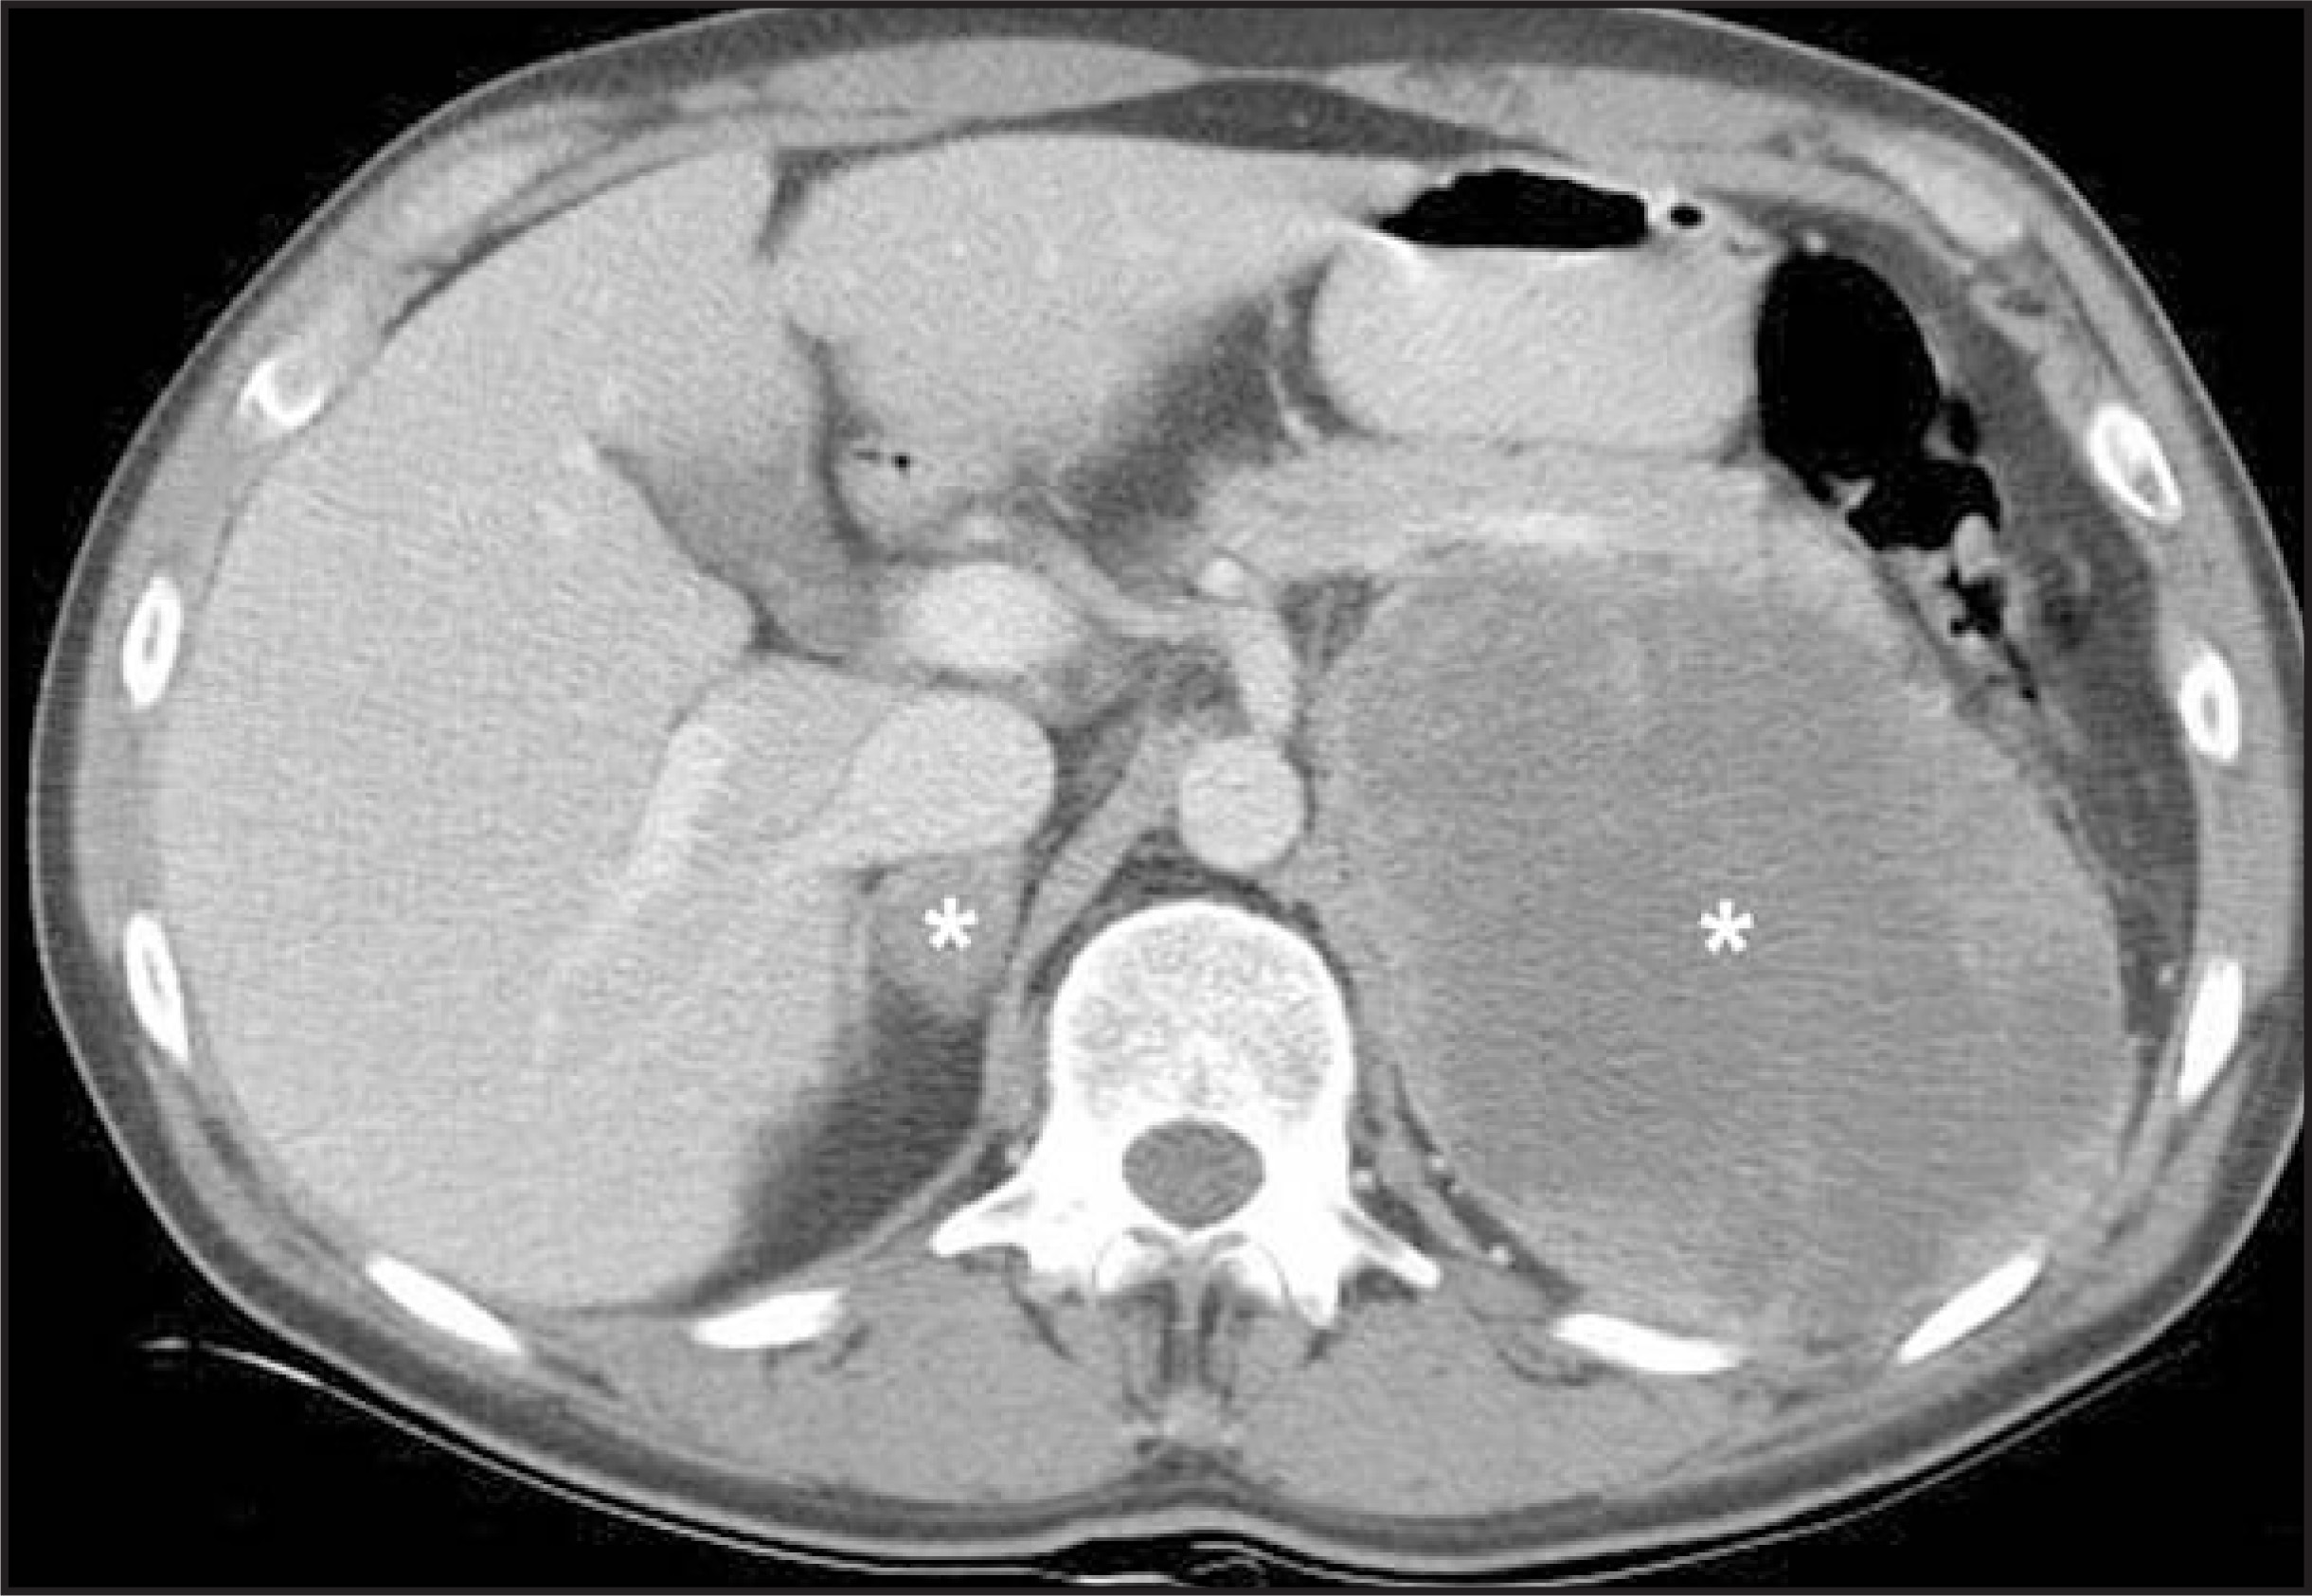
Metastases are the most frequent malignant lesions of the adrenal glands. Commonly seen primary tumors (in order of decreasing frequency) arise from the breast, lung, kidney, pancreas, and bowel. In an autopsy series of patients with primary carcinomas, the adrenal glands were involved in 27% of cases overall, usually bilaterally (Figure 14).24
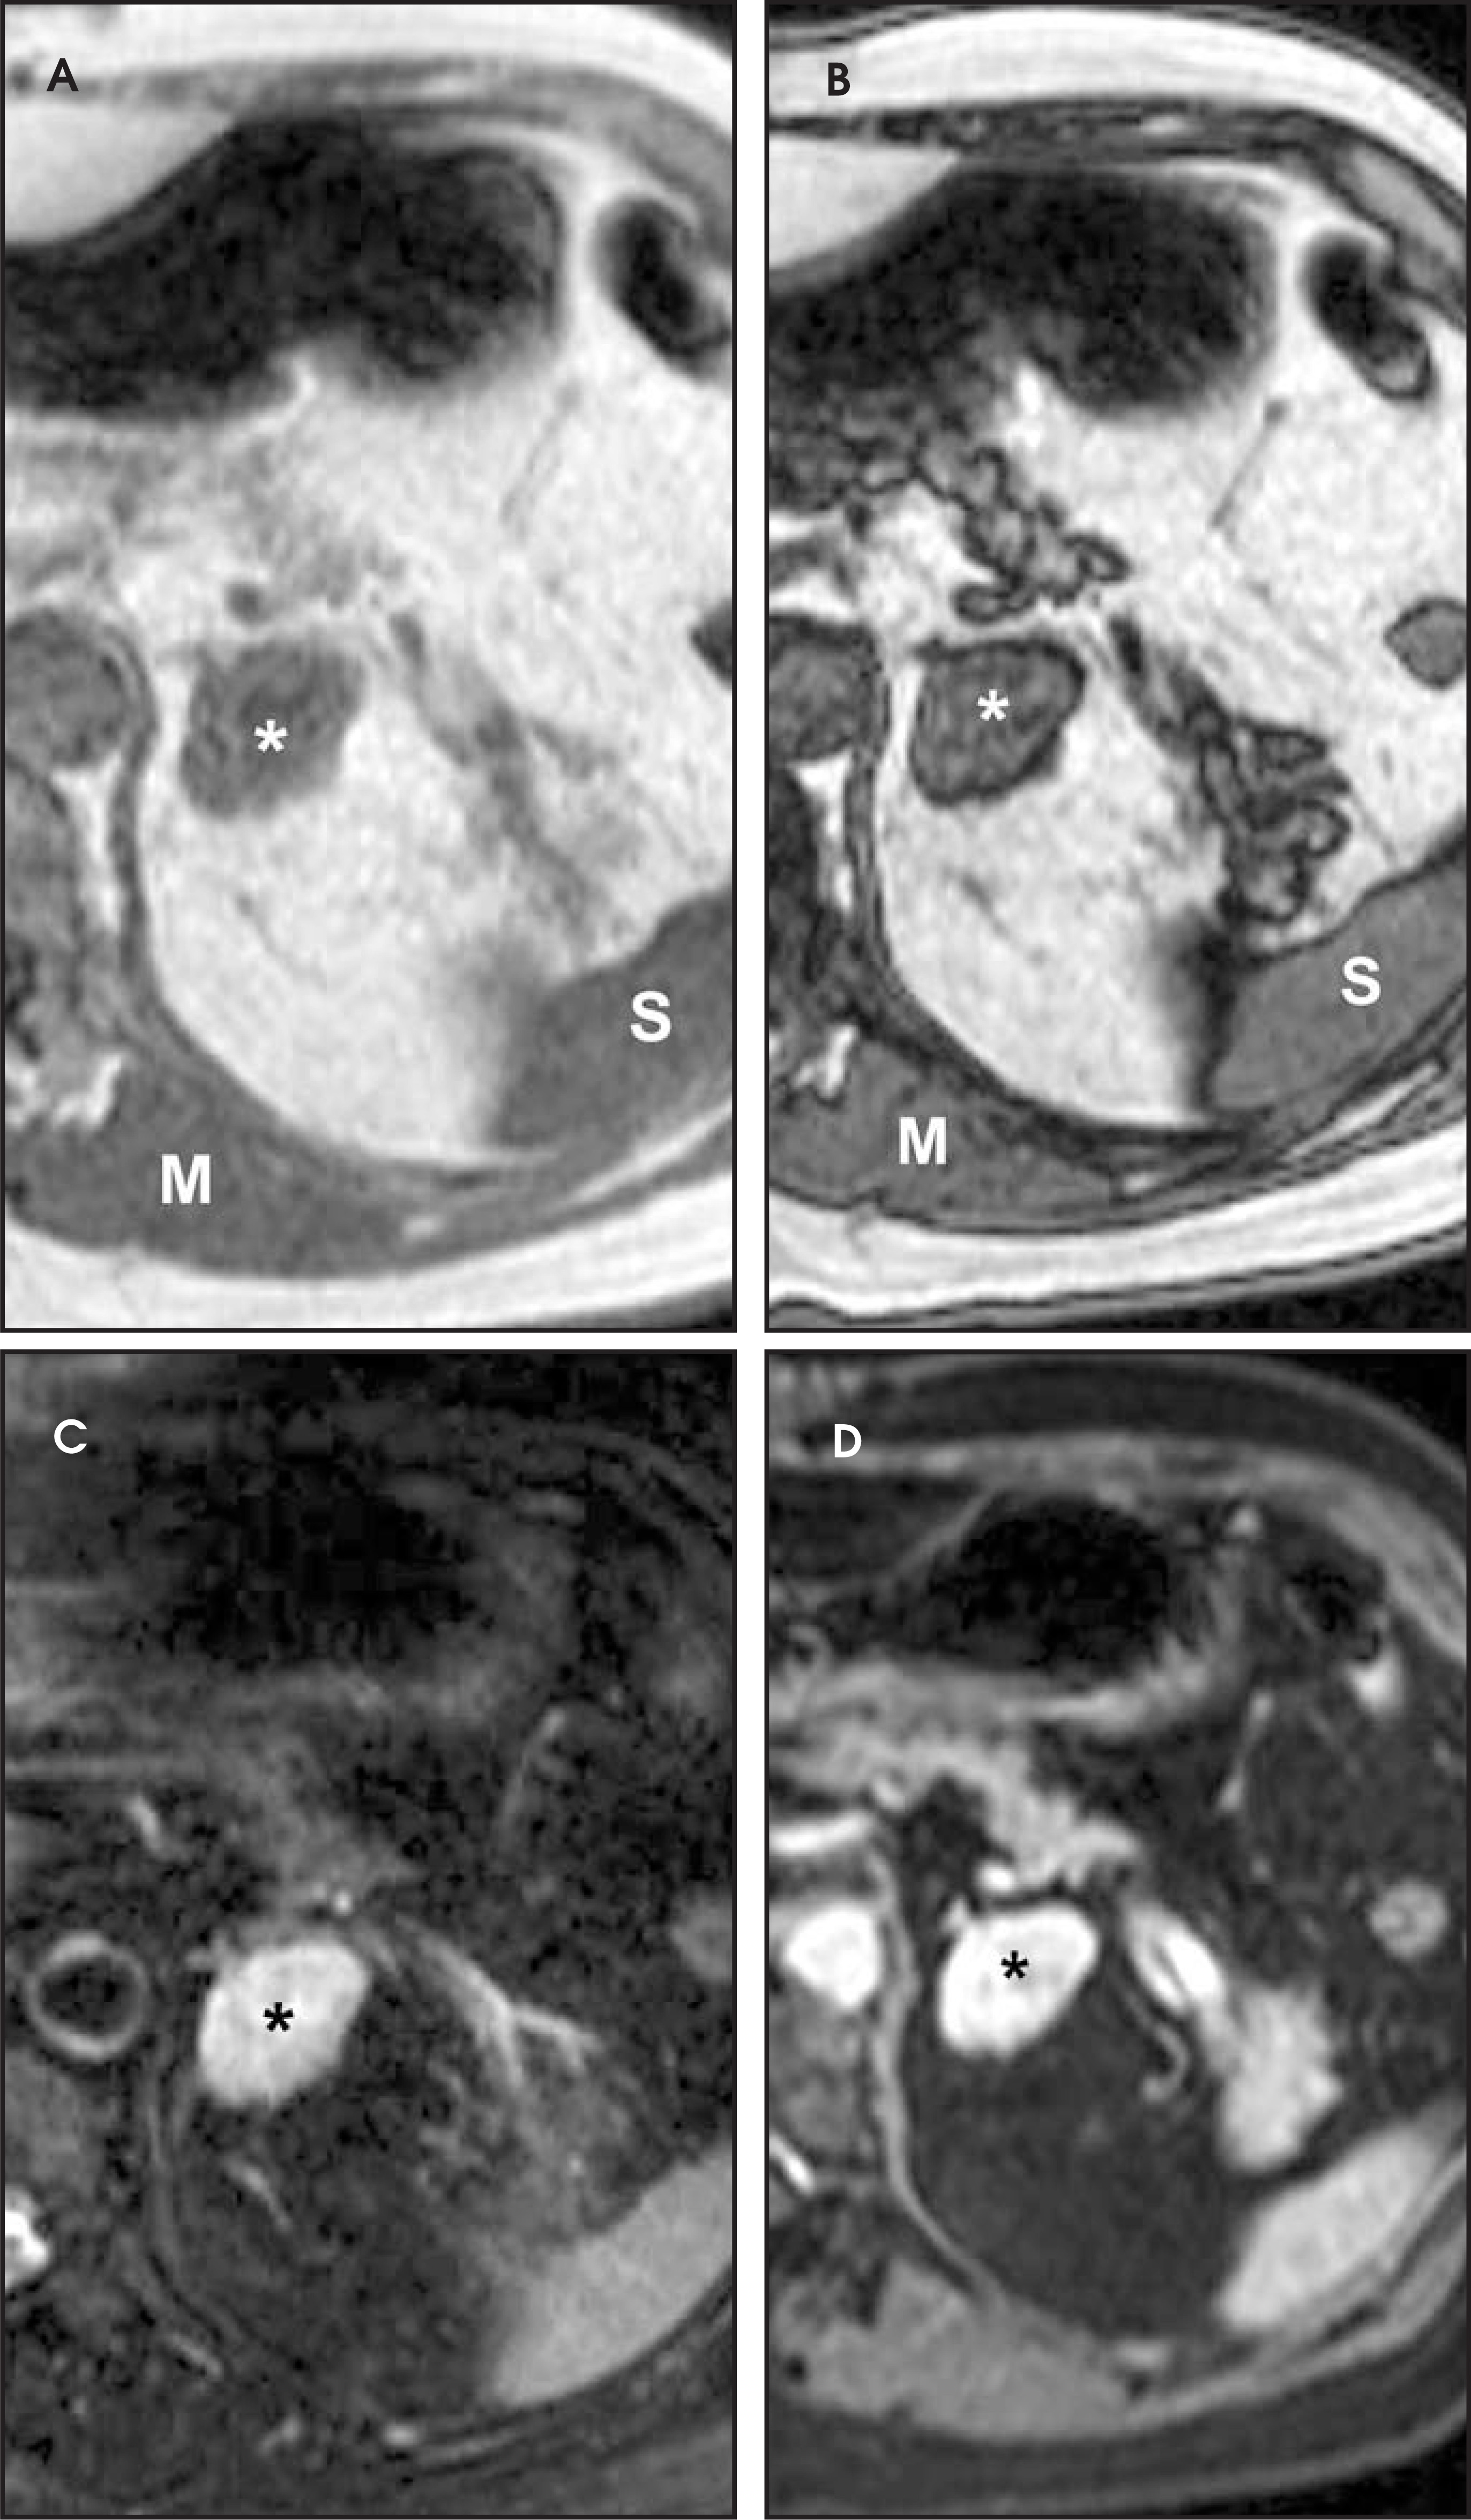
As previously mentioned, the differentiation between adenomas and metastases can reliably be made if intracellular fat is identified. Metastases exhibit higher mean attenuation levels on CT and will not show signal loss on opposed-phase MR images (Figure 15). Another useful tool is evaluation of the pattern of enhancement of these lesions. Unlike adenomas, metastases more often present with heterogeneous progressive enhancement. Multiple studies have shown that CT and MRI are highly sensitive and specific for distinguishing benign from malignant adrenal lesions but are not as accurate when trying to establish if a lesion is malignant when it is not clearly benign. In these cases, a biopsy or close interval follow-up is still needed.7,13-16,18,21-23
Collision tumors
In approximately 2% of patients staged for a primary known cancer, metastases simultaneously involve an adrenal gland that harbors a benign lesion, such as an adenoma or a myelolipoma. Extra caution should be taken not to miss the presence of malignancy on the basis of detection of microscopic or macroscopic fat only. If a lesion has grown, has changed in appearance, or is unusually large or heterogeneous, one should consider the possibility of collision tumor and should recommend histopathological analysis.25
Adrenocortical carcinoma
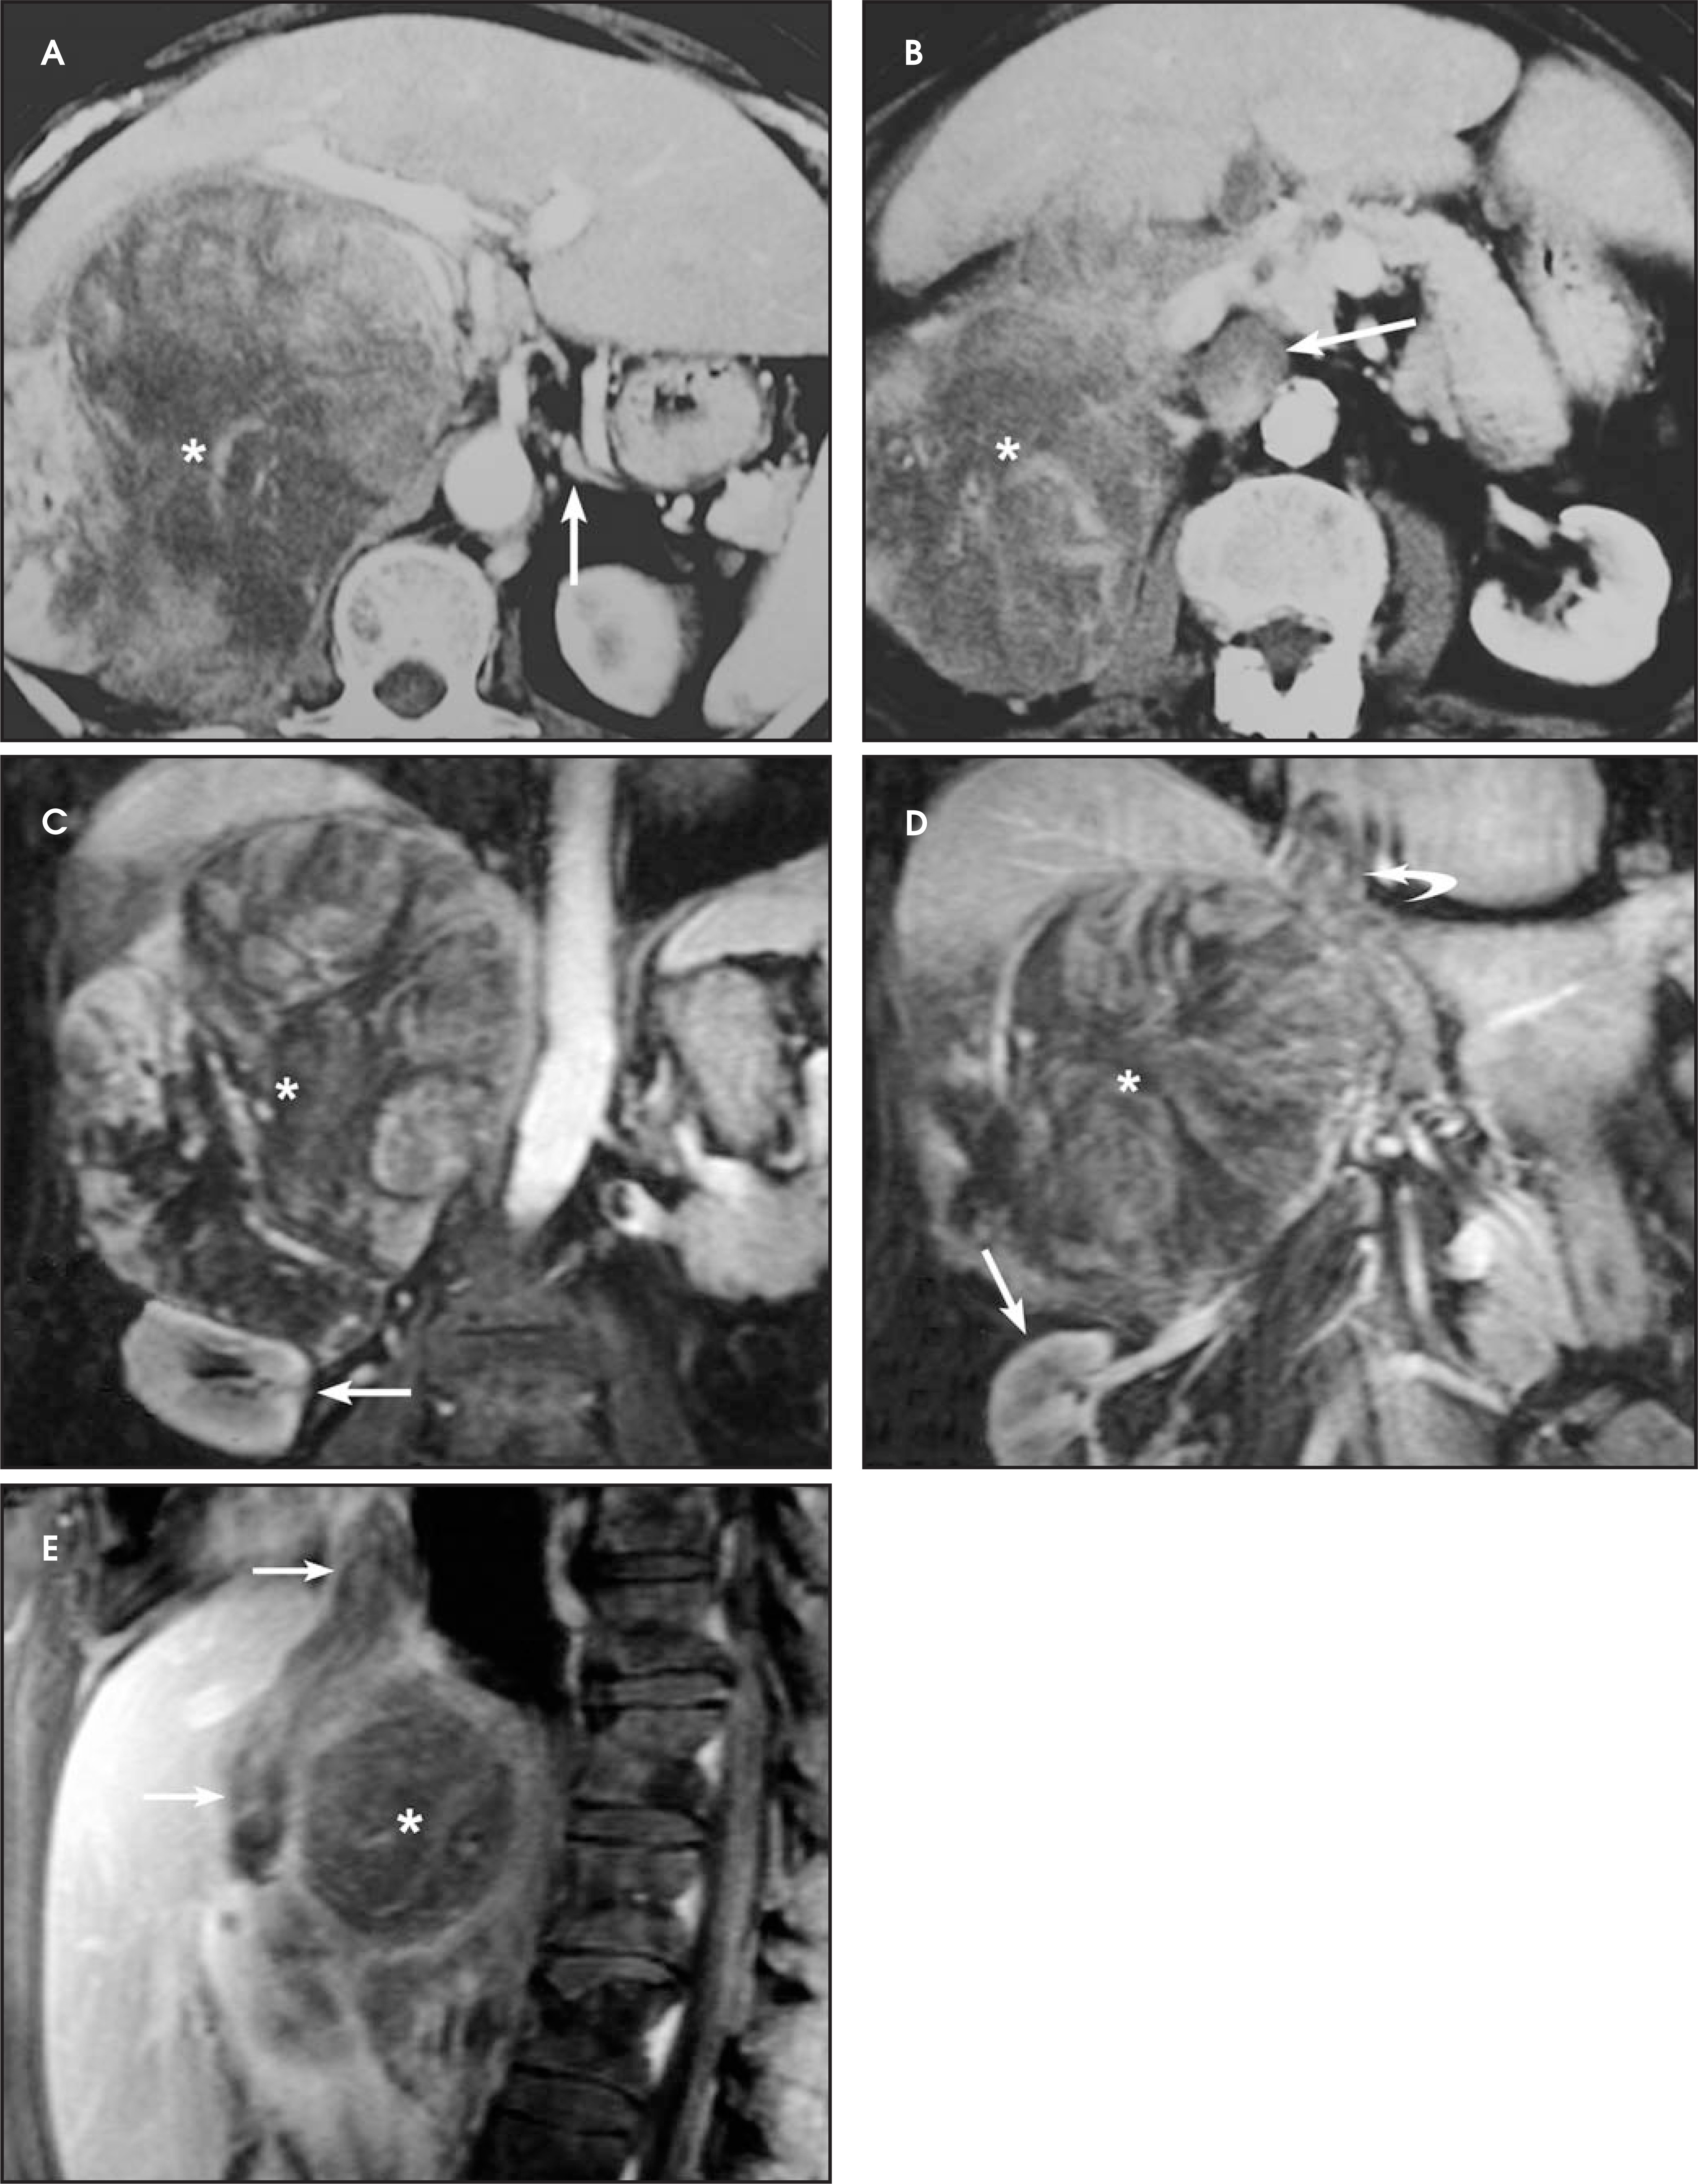
Adrenocortical carcinomas are rare aggressive tumors with a prevalence of 0.5 to 2 per million.26 They are large heterogeneous tumors, measuring >7 cm in diameter at the time of diagnosis in 92% of the cases.13,27 Heterogeneity is a result of central necrosis and hemorrhage. In some cases, foci of intracytoplasmatic fat can be identified, but these should not be confused with an adenoma based on heterogeneity and size of this tumor.6 These tumors tend to involve the inferior vena cava, which should always be assessed (Figure 16). Adrenocortical carcinomas can be hyperfunctioning tumors in up to 60% of cases and can manifest earlier, usually with features of Cushing’s syndrome. In 4% of cases, the tumor is found incidentally.1,6,13,26
Pheochromocytoma
Pheochromocytomas are rare, catecholamine-producing tumors that arise from the sympathetic nervous system with a prevalence of 1 to 2 cases in 100,000 per year. They are identified with equal frequency in males and females, at any age, but with a peak incidence between the third and fifth decades.28 Pheochromocytomas are well known for the “rule of 10,” meaning that approximately 10% of cases will be extra-adrenal, malignant, bilateral, and familial and will not be associated with hypertension; however, in a large series review, this description was found to be valid for only 40% of cases.29
In 95% of patients, pheochromocytomas will be intra-abdominal, and in 85% of cases the tumor will arise from the adrenal medulla. They usually measure >3 cm when detected. Hyperfunctioning lesions cause hypertension, palpitations, sweating, and headache and may frequently be perceived as a paroxysmal crisis. The diagnosis can be confirmed by detection of elevated catecholamines in the serum or urine.4,13
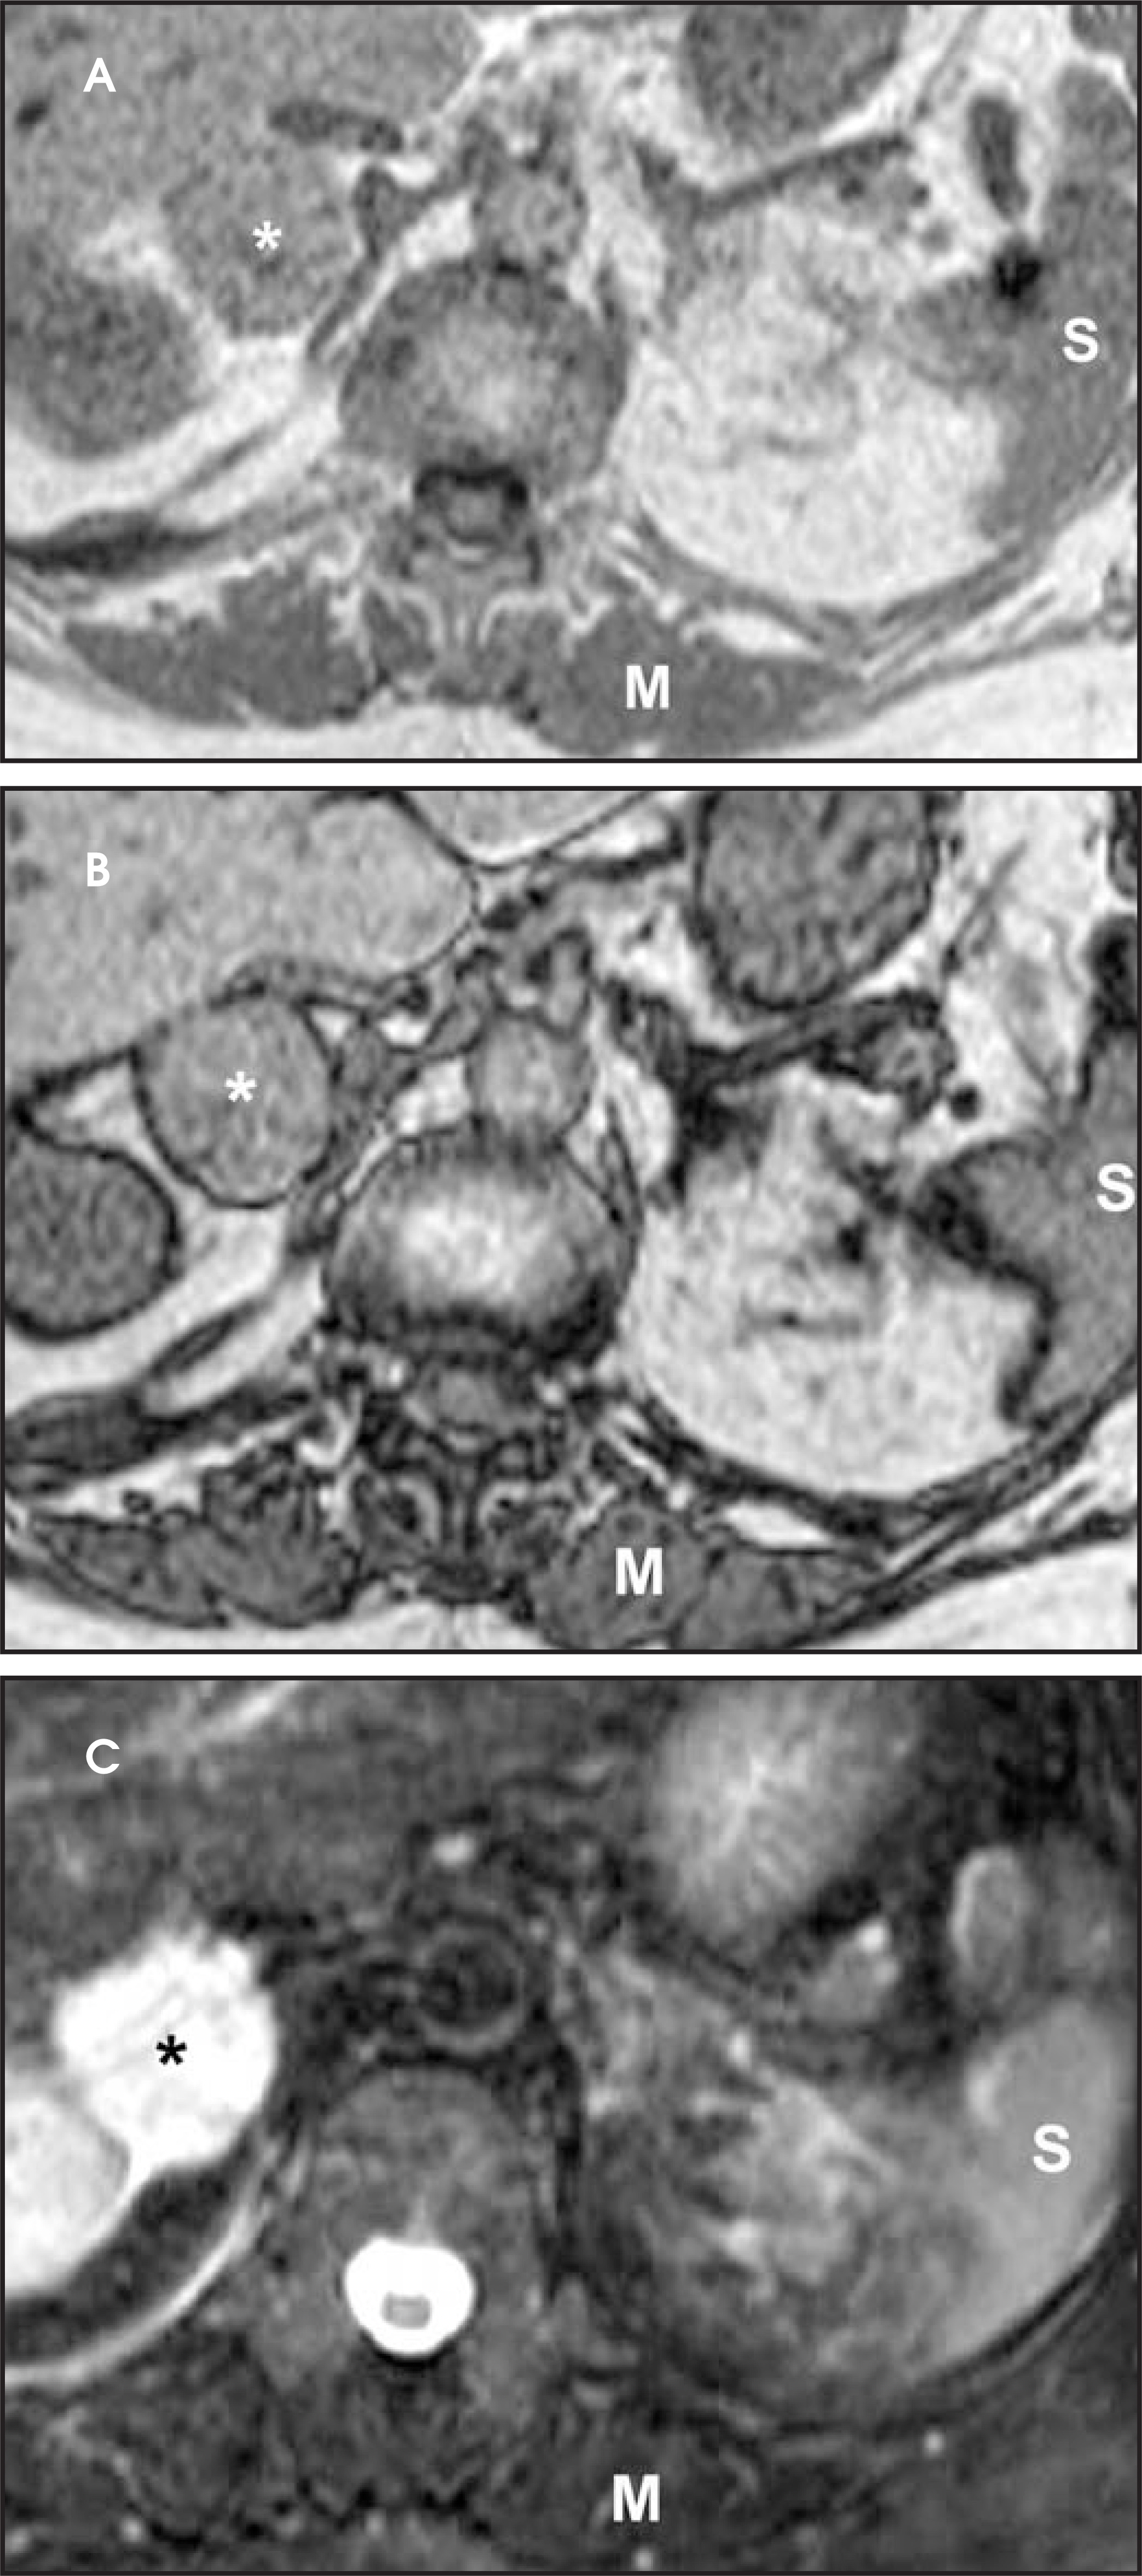
On MRI, these tumors may show very high T2-weighted signal intensity, the so-called “light-bulb” sign, which makes them easy to detect on T2-weighted sequences. The lack of high T2-weighted signal intensity does not exclude the diagnosis, however. T1-weighted signal intensity varies, and pheochromocytomas usually do not lose signal on out-of-phase images (Figure 17).6,13
An adrenal mass in a patient who is suspected of having a pheochromocytoma can be easily detected by CT, but the imaging features are nonspecific. Calcifications can occur and are readily identified on CT. The use of iodinated contrast for the detection of a suspected pheochromocytoma is controversial, as it may trigger a hypertensive crisis.30-32
If a mass is assumed to be a pheochromocytoma, the patient should be alpha-receptor–blocked prior to contrast administration. Nonionic contrast should be used, as it is less likely to cause complications than ionic contrast.33 As a general rule, biopsy of an adrenal mass should be performed only after exclusion of a pheochromocytoma,34 to avoid an unexpected hypertensive crisis on the biopsy table.35
Uncommon adrenal masses
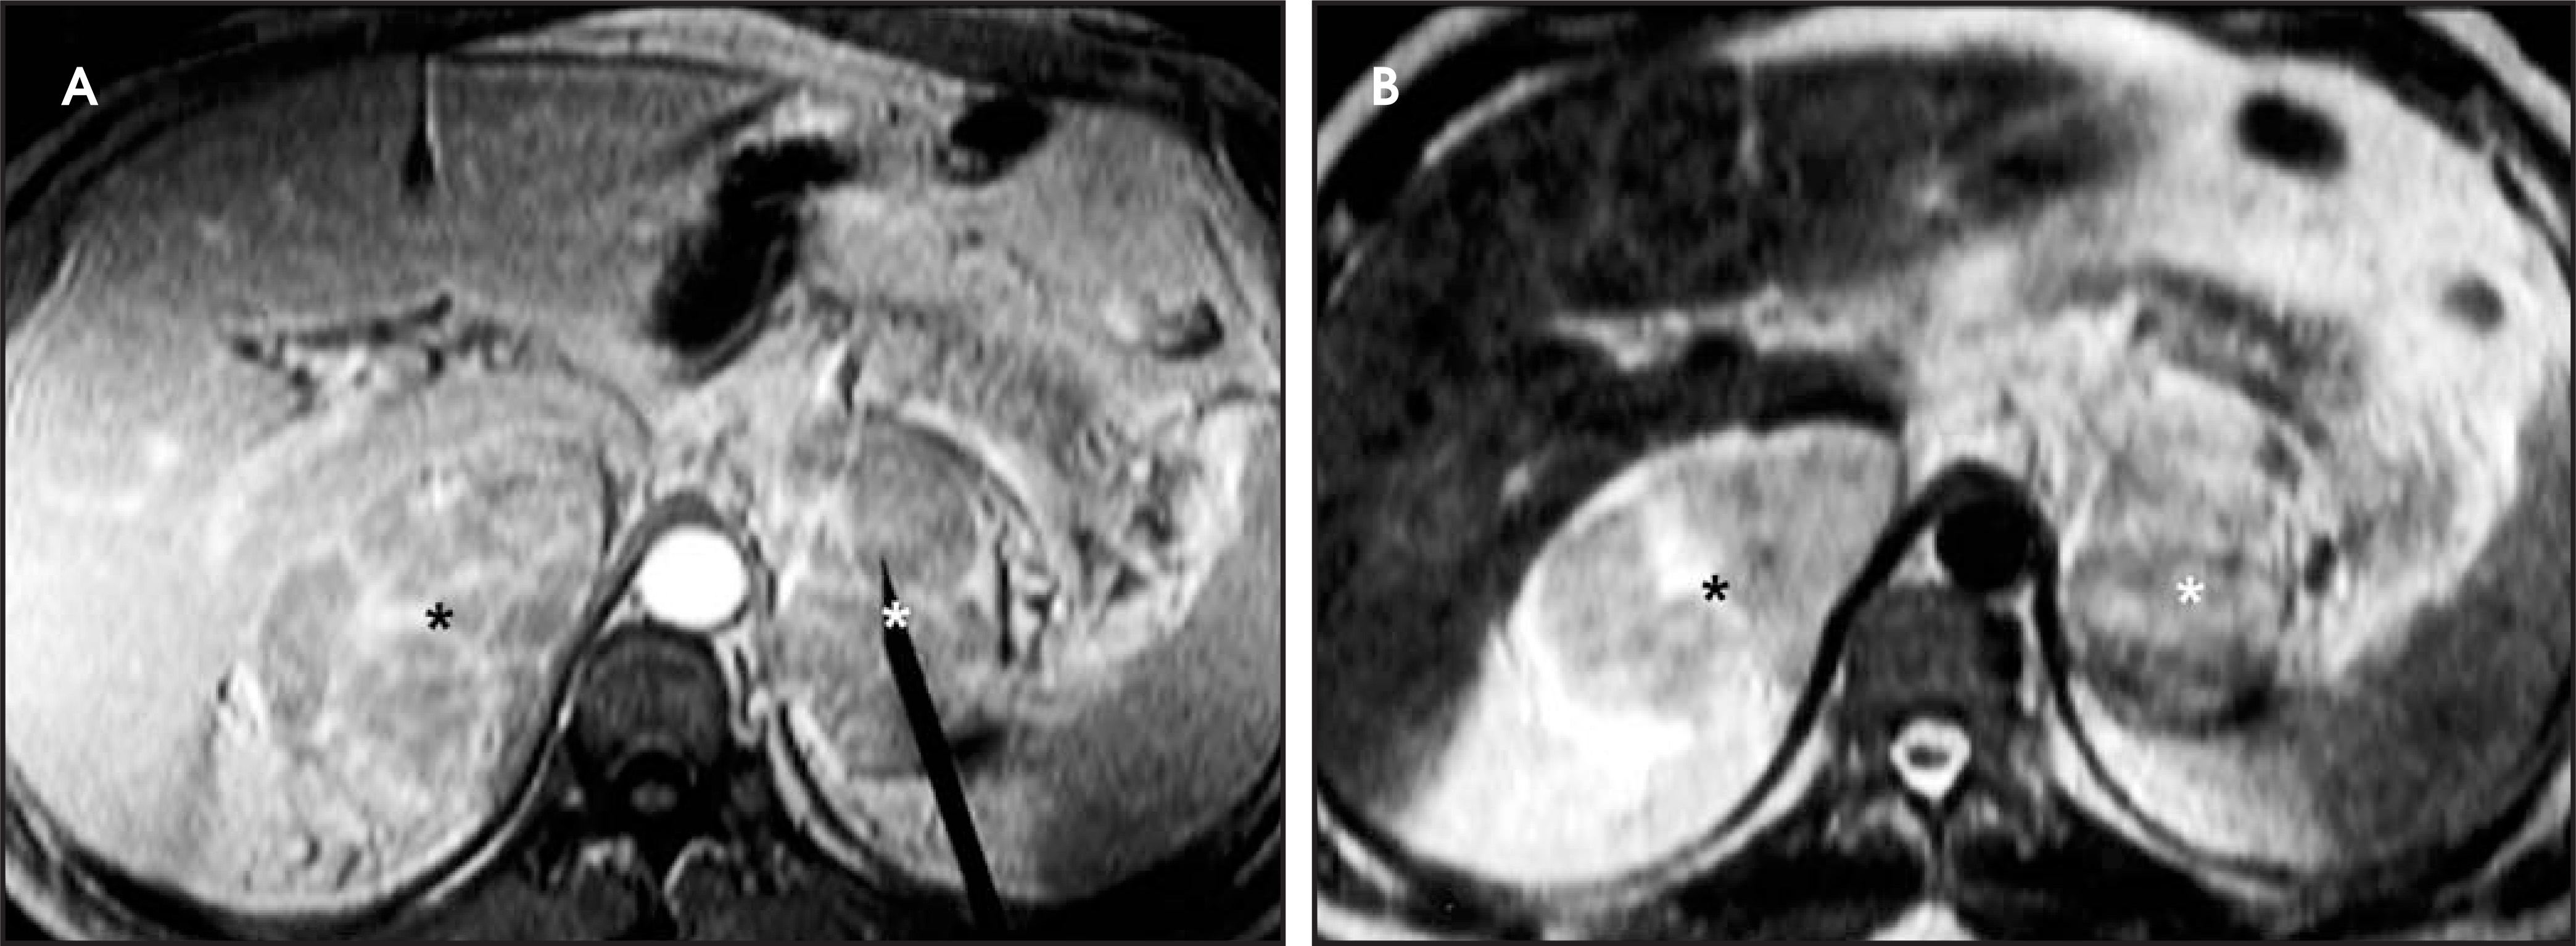
Adrenal involvement by lymphoma is rarely an isolated finding and is more frequently seen in patients with non-Hodgkin’s lymphoma (1% to 4% of the cases), usually bilaterally.36,37 The appearance is nonspecific, and lymphoma may present as a mass or as diffuse enlargement of the gland (Figures 18 and 19).36-38
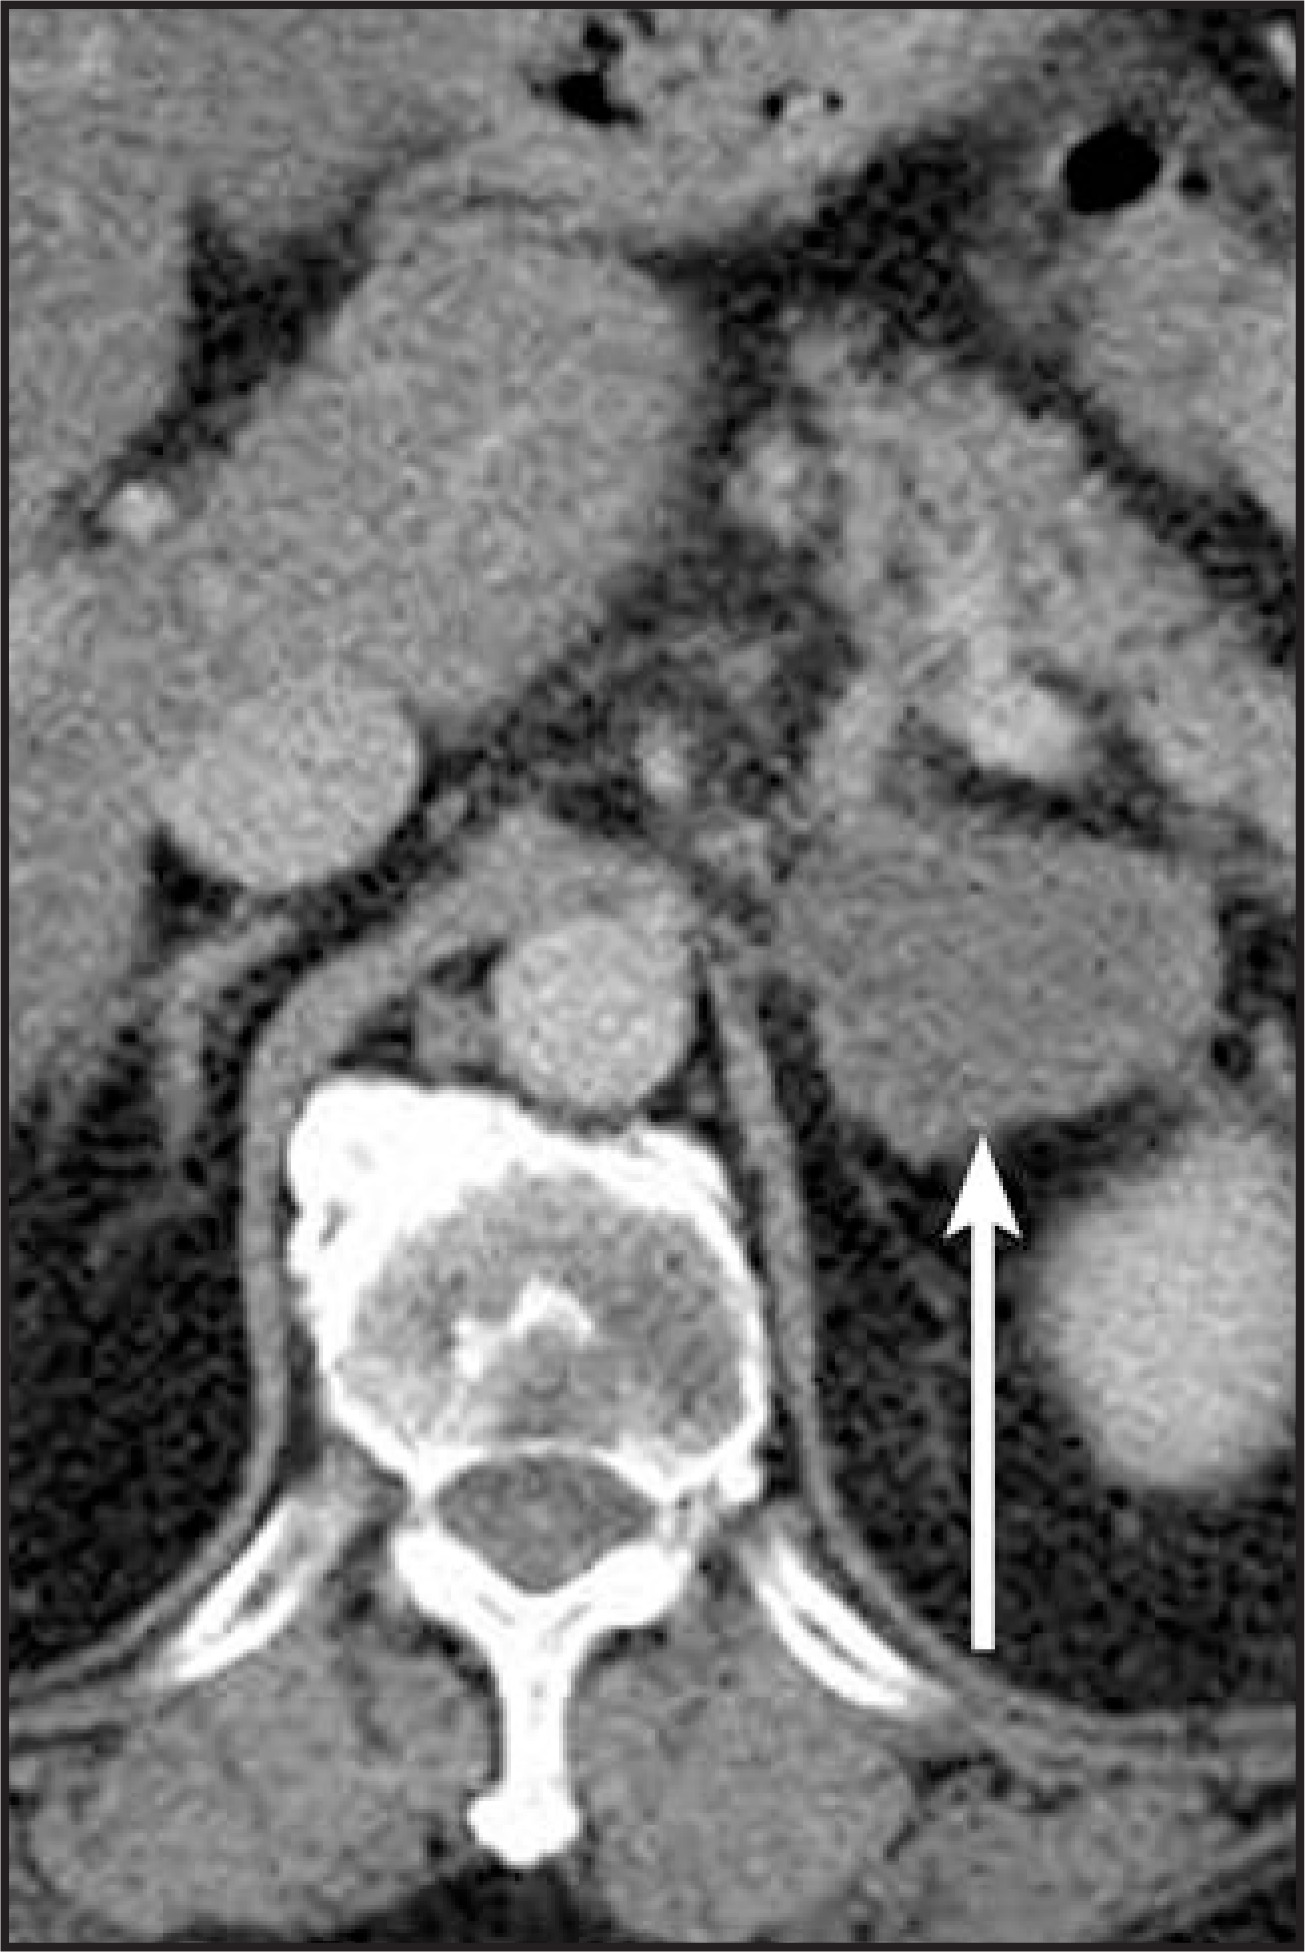
Solitary fibrous tumor is a rare neoplasm. Cases have been reported in nearly every organ, but these tumors are more frequently seen in the pleura. The common characteristic to all is a positive CD 34. It usually has a benign clinical behavior, but aggressive cases have been reported. Imaging findings are nonspecific, and histopathologic evaluation is needed for diagnosis. Central hemorrhage, necrosis, or degeneration may occur, but calcifications are rare39,40 (Figure 20).
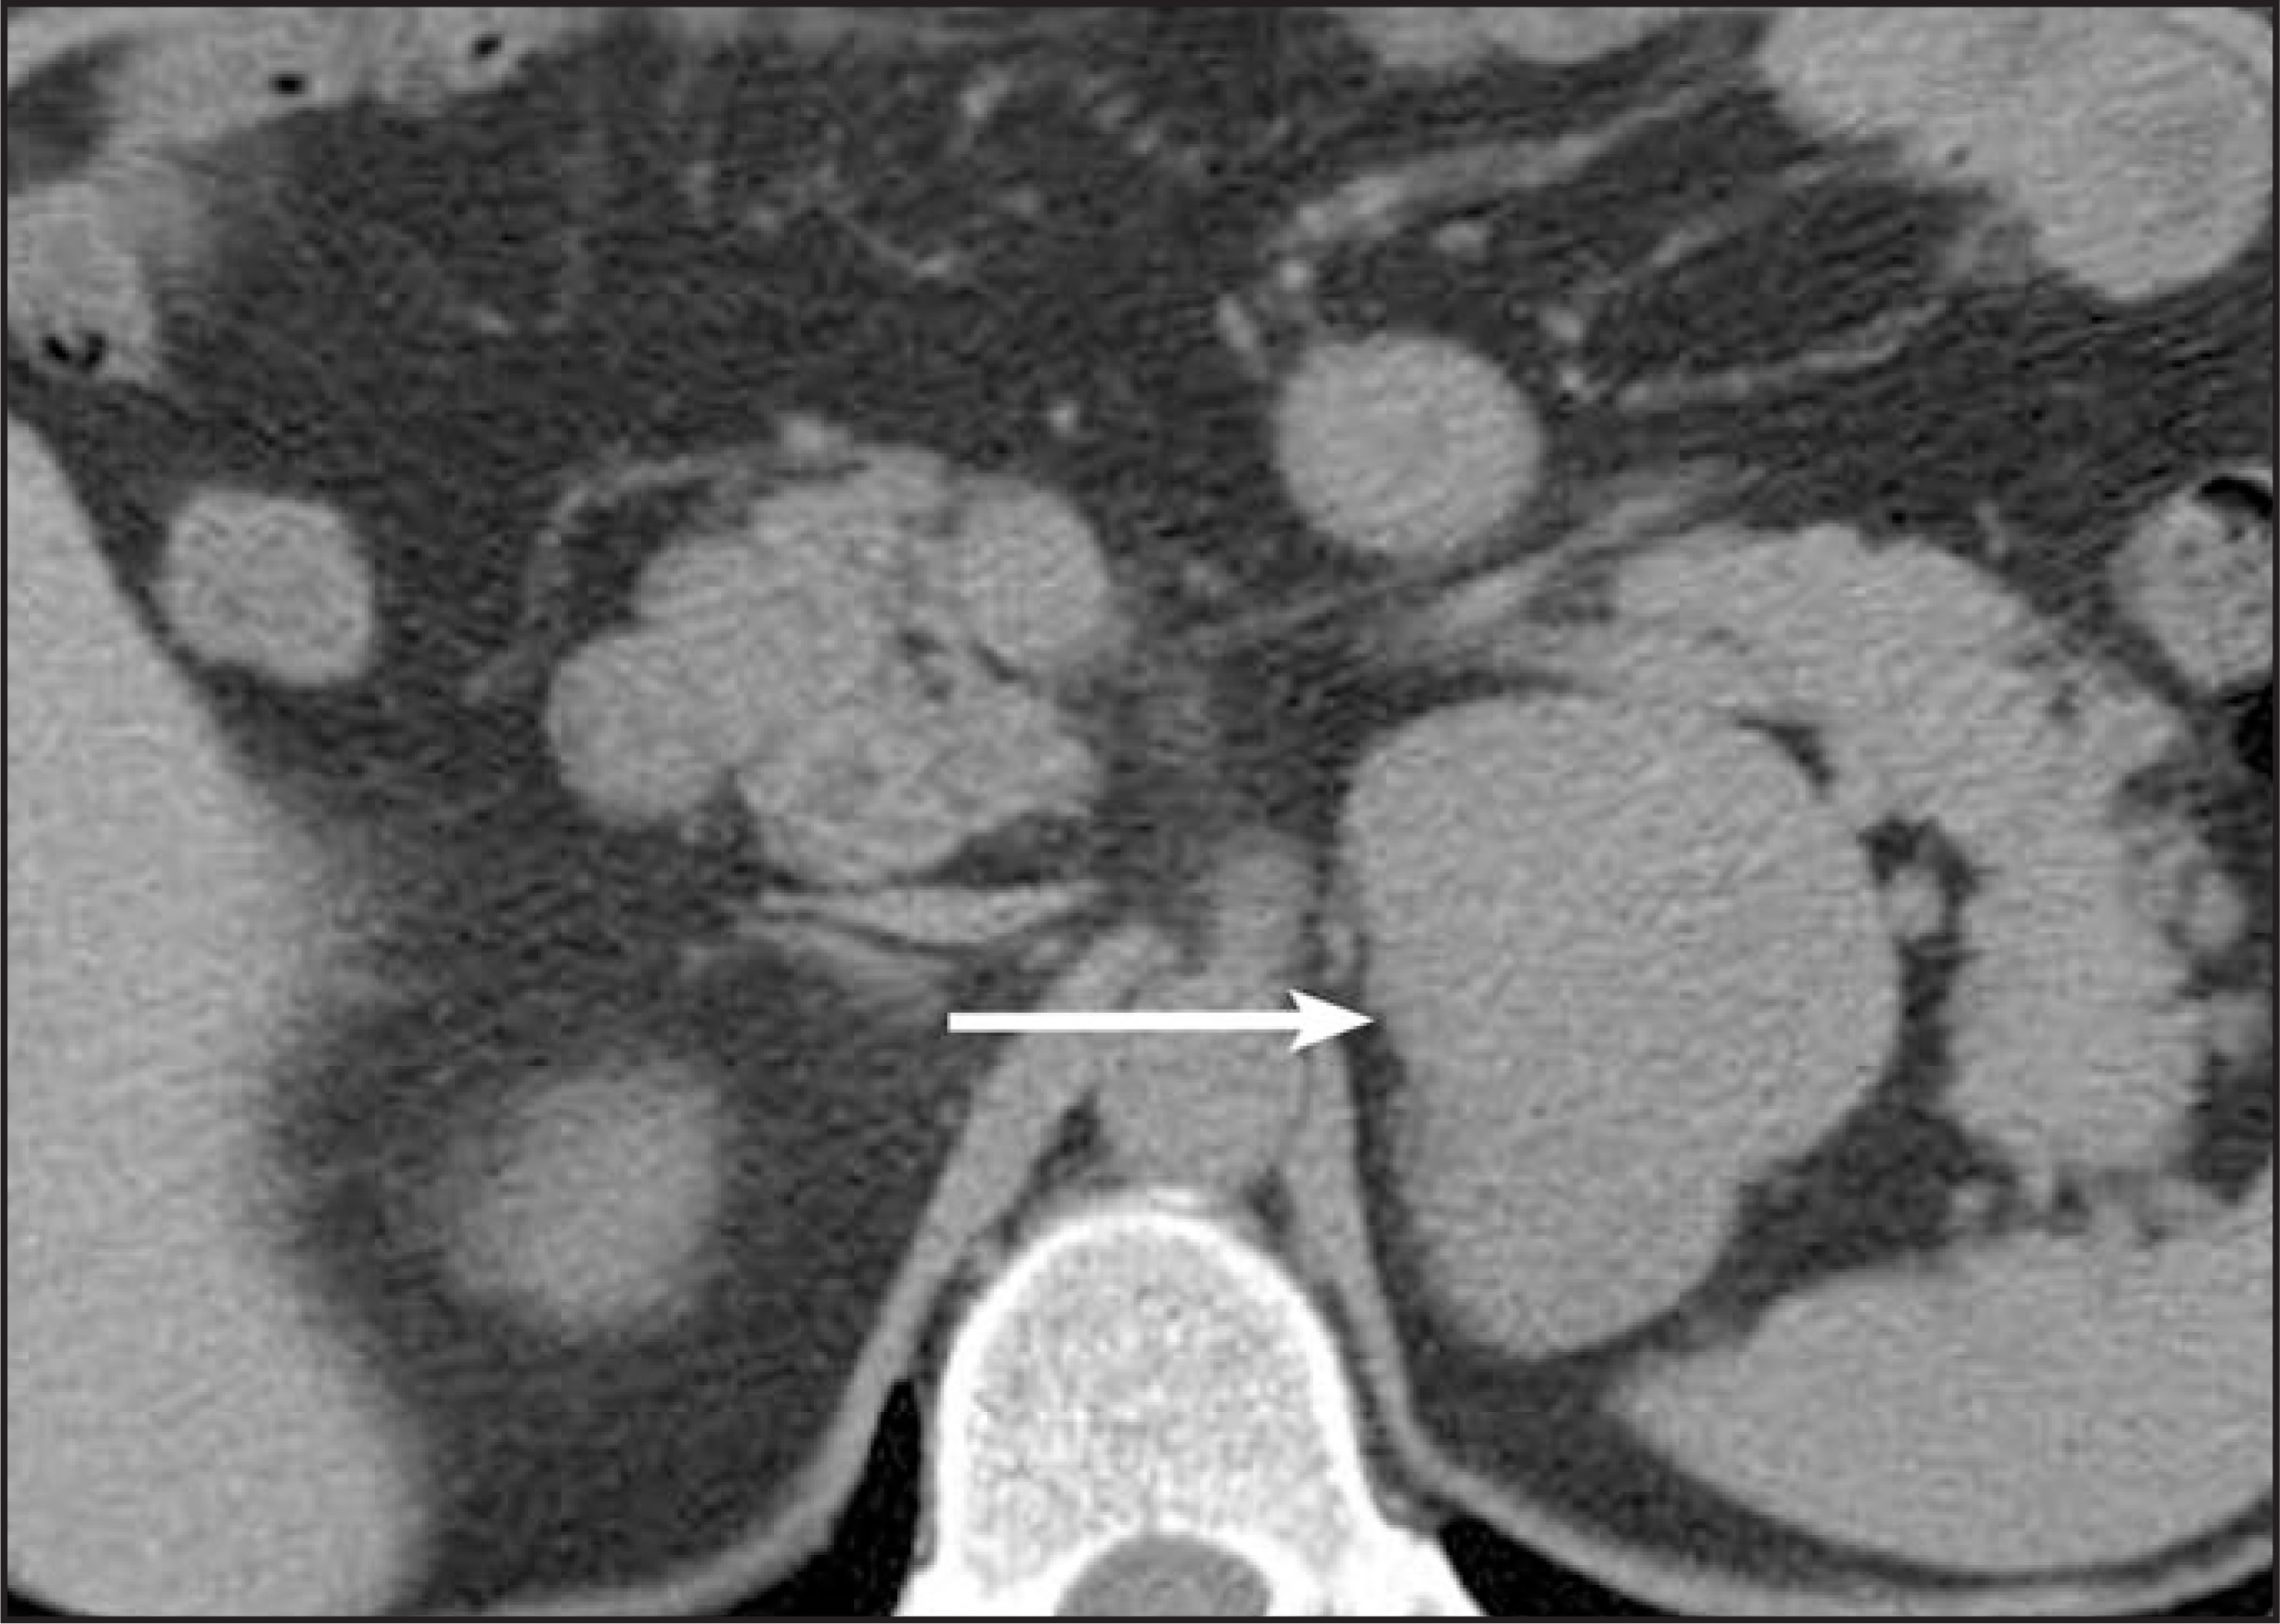
Hemangiomas are benign lesions that are asymptomatic until they grow large. They are predominantly solid tumors with cystic central areas and calcifications. Peripheral enhancement is noted after contrast administration.41
Hemangiosarcomas of the adrenal glands are exceedingly rare nonfunctional tumors that present with nonspecific clinical symptoms. Both CT and MRI show a heterogeneous mass with central necrosis or liquefaction and peripheral enhancement.42
Conclusion
CT and MRI are excellent imaging tools for the detection and characterization of adrenal masses. Adrenal cysts and myelolipomas have characteristic imaging findings that allow a specific diagnosis. Often, the specific diagnosis of adrenal adenoma can also be made based on CT attenuation measurements, CT washout criteria, or signal loss on opposed-phase MR imaging. When in doubt regarding whether an adrenal lesion may represent a metastasis, biopsy or follow-up imaging may be used to aid in the diagnosis.
Recommendations for resection of nonfunctioning, nonspecific adrenal lesions are controversial but largely based on lesion size. Tumors >6 cm are usually treated surgically, while those <4 cm are followed-up. The decision regarding treatment of lesions that measure between 4 and 6 cm should be based on additional criteria, such as surgical risks or the presence of nonhormonal symptoms.34 Tumors that remain stable in size for at least 6 months and that show no evidence of hormonal activity in 4 years do not need to be monitored any longer.34 Table 3 summarizes the CT and MRI features that should be sought in order to determine if an adrenal mass is benign.
Appendix
Chemical shift imaging43
The precession frequency of protons is determined by the external magnetic field to which they are exposed and by the presence of local inhomogeneities, in part related to the existence of chemical shift (CS). These 2 factors determine an effective local magnetic field strength. Chemical shift refers to signal changes that are secondary to inherent differences in resonant frequencies of hydrogen protons within lipid and water molecules. Because of a 3.5-parts-per-million CS seen between water and lipid (W&L), under a 1.5T magnet water will resonate at a frequency that is approximately 224 Hz faster than fat–a difference large enough to be detected (Figure 21). The precession frequency can be calculated with Larmor’s equation (Figure 22).
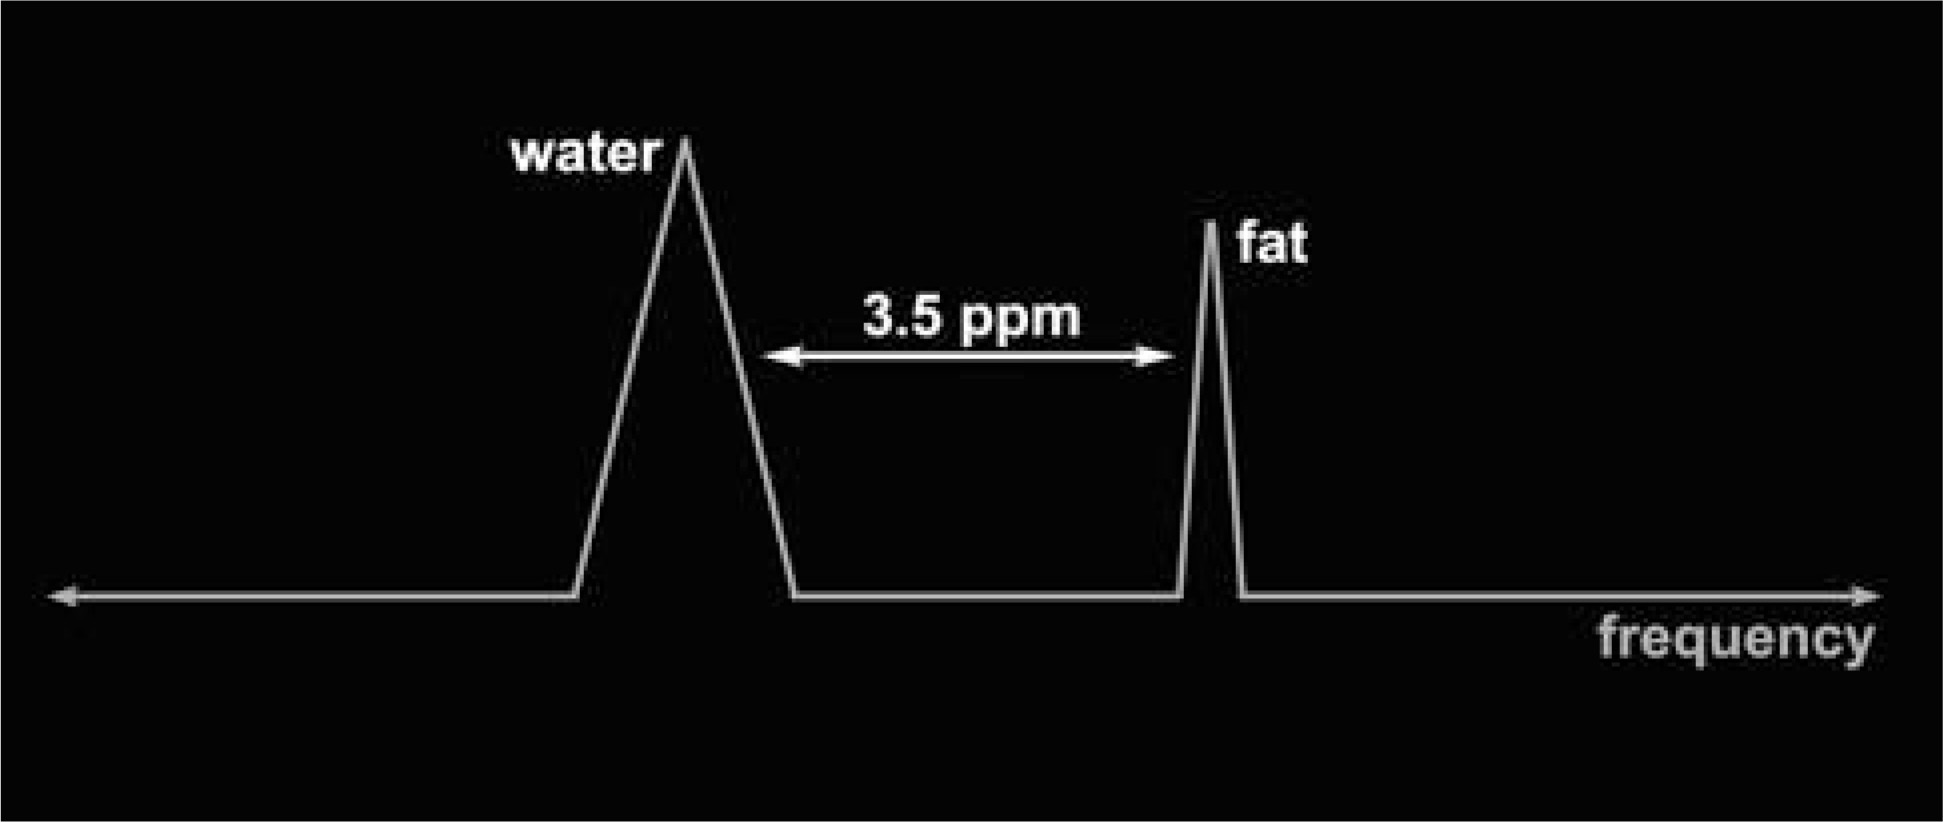
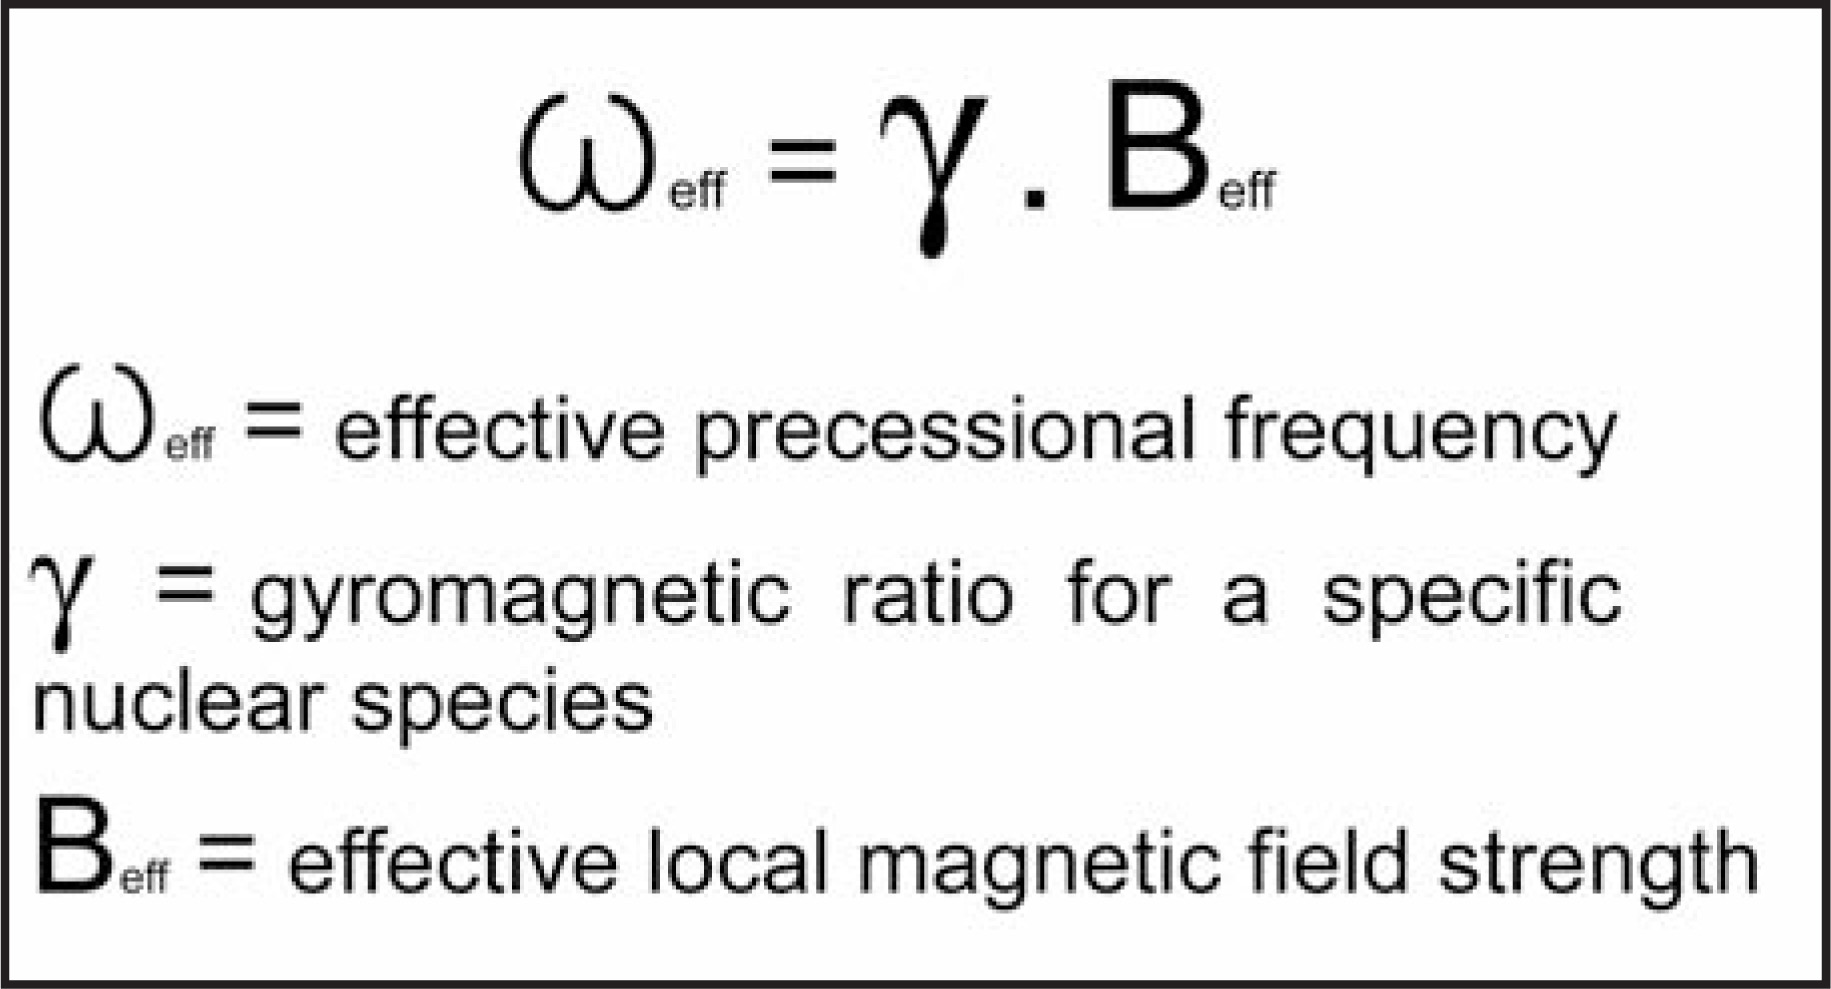
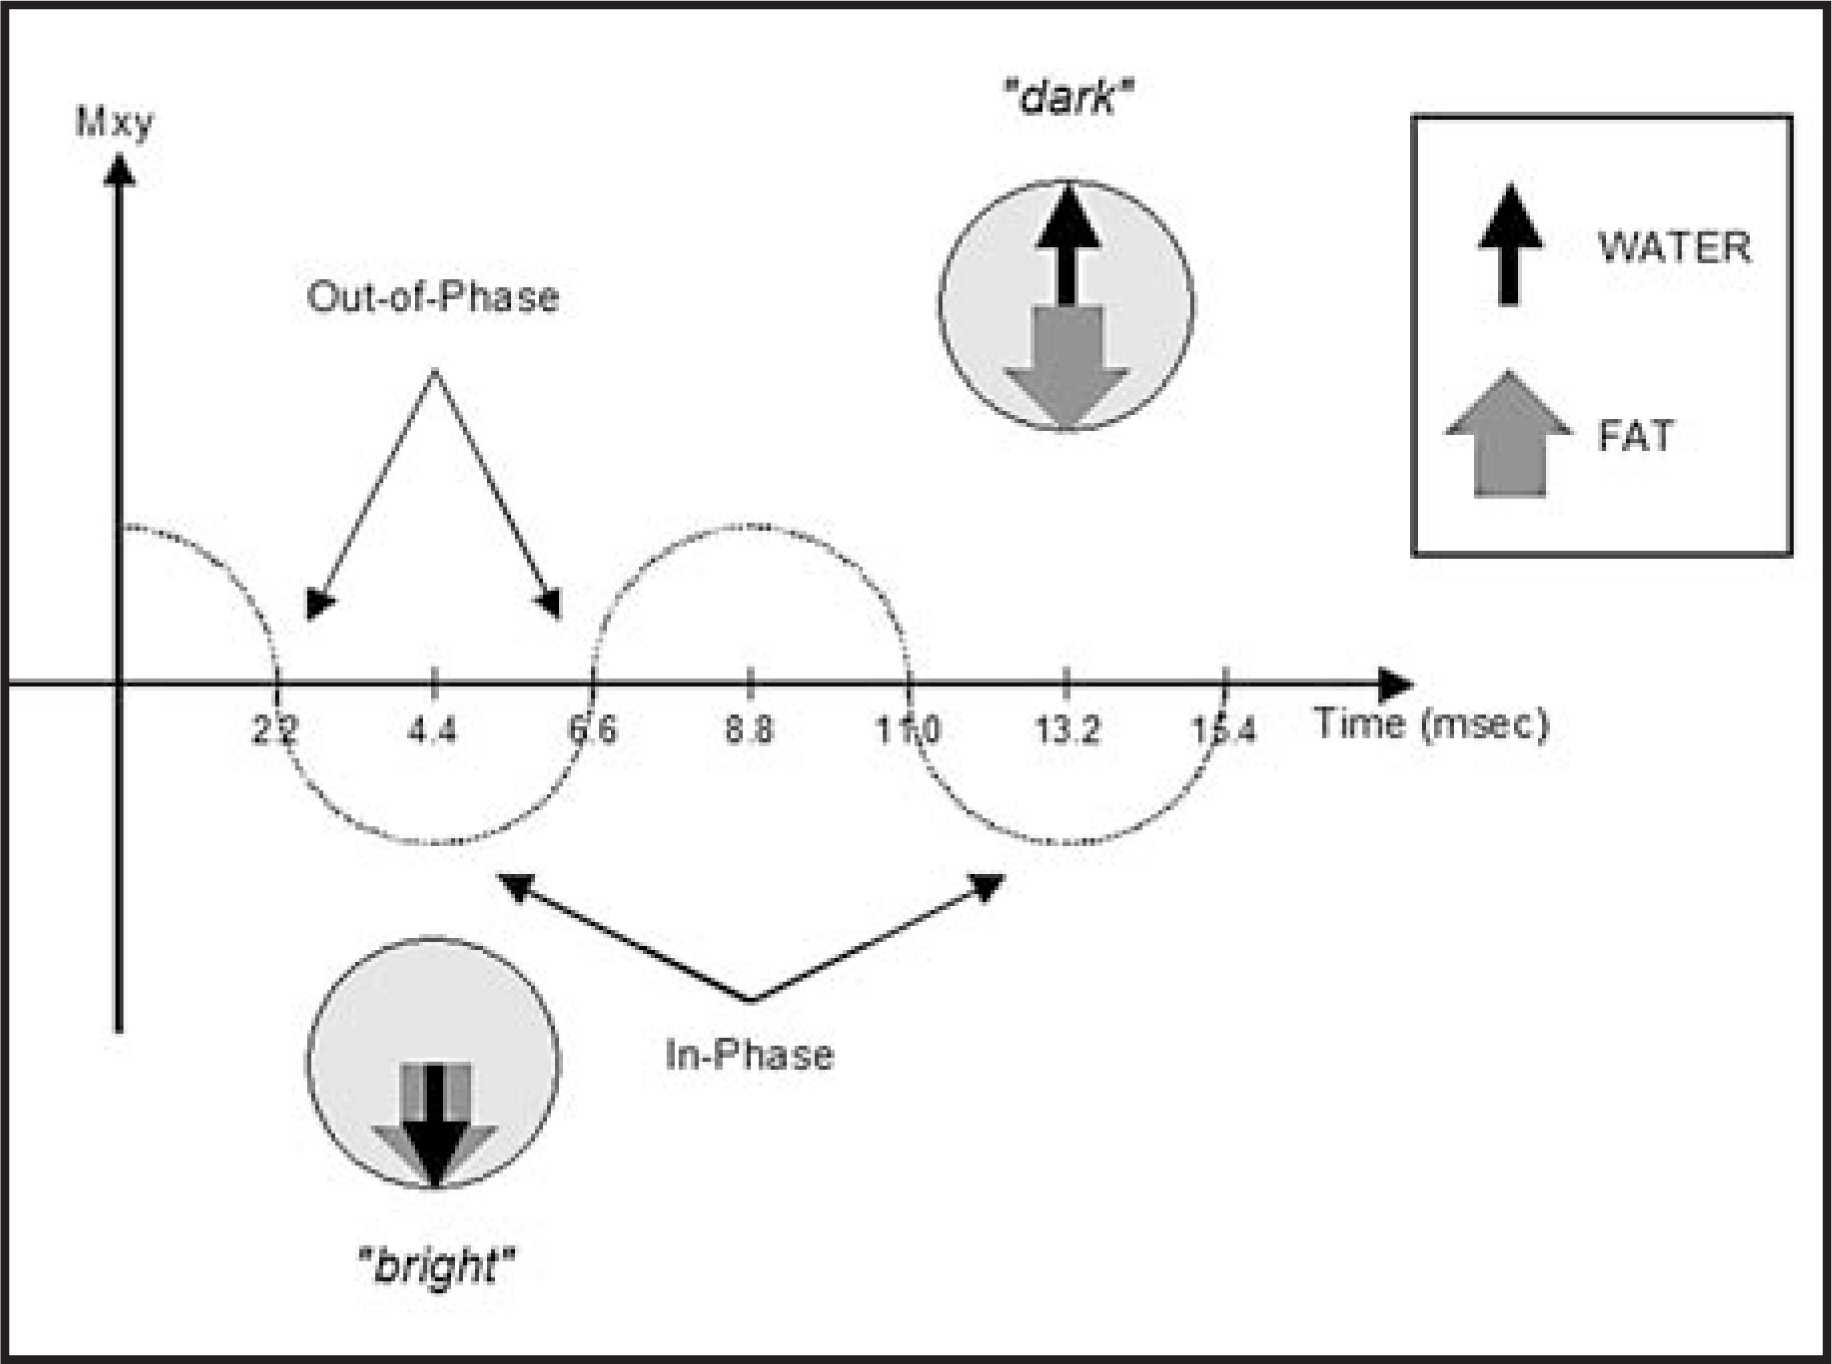
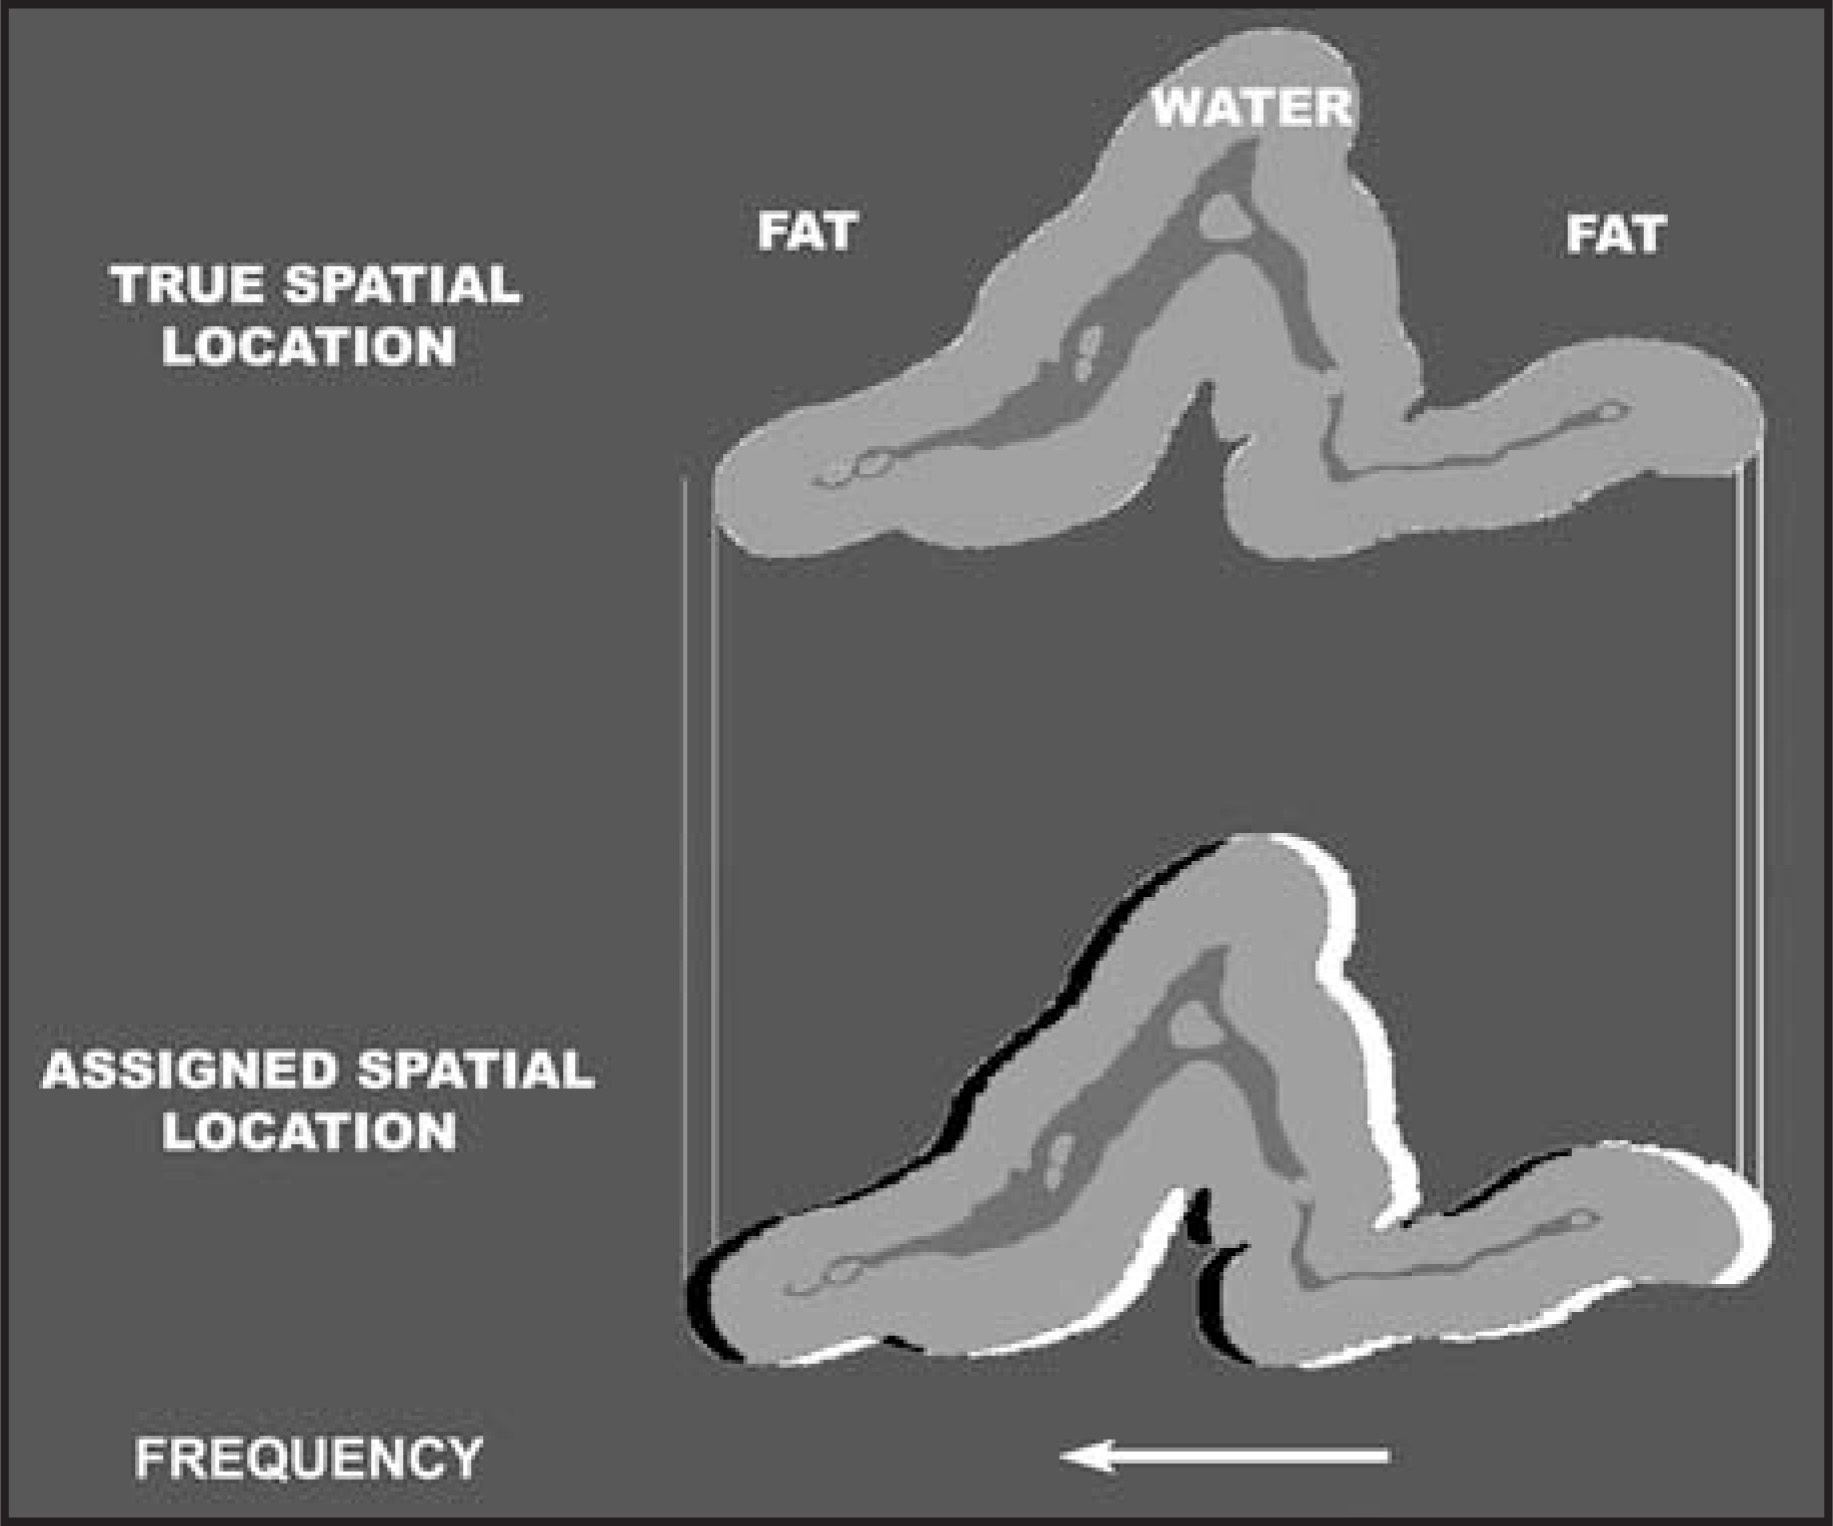
Gradient-refocused echo (GRE) pulse sequences are used to register this phenomena. In these sequences, W&L protons will repeatedly precess in- and out-of-phase every 2.2 msec in a 1.5T magnet. Therefore, if echo time (TE) is set at 4.4 msec and 2.2 msec, images will be acquired while W&L protons are both contributing to the detected signal or canceling each other (in- and out-of-phase, respectively) (Figure 23). Finally, spatial misregistration is the imaging artifact caused by the CS phenomenon and is the result of the inability of the scanner (typically centered on water frequency) to differentiate frequency differences related to chemical shift from frequency differences related to spatial frequency encoding. Also known as an “india ink” artifact, misregistration is present throughout the acquired image but is much more visible at interfaces between W&L as a dark or bright band. The dark band reflects an area of signal void due to shifting of lipid signal to a lower frequency, while the bright band is the result of W&L signal overlapping (Figure 24).
References
- Barzon L, Sonino N, Fallo F. Prevalence and natural history of adrenal incidentalomas. Eur J Endocrinol. 2003;149:273-285.
- Dyson M, Bannister L, Collins P, Dyson M, Dussek J, Fergunson M. Gray’s Anatomy:The Anatomical Basis of Medicine and Surgery. 1995:1888-1891.
- Aron D, Findling J, Tyrrell J, Greenspan F, Gardner D. Basic and Clinical Endocrinology. 2001:360-371.
- Goldfien A, Greenspan F, Gardner D. Basic and Clinical Endocrinology. 2001:411-420.
- Rozenblit A, Morehouse H, Amis E. Cystic adrenal lesions: CT features. Radiology. 1996;201:541-548.
- Elsayes K, Mukundan G, Narra V. Adrenal masses: MR imaging features with pathologic correlation. RadioGraphics. 2004;24(suppl 1):S73-S86.
- Korobkin M, Francis I, Kloos R, Dunnick N. The incidental adrenal mass. Radiol Clin North Am. 1996;34:1037-1054.
- Kenney P, Stanley R. Calcified adrenal masses. Urol Radiol. 1987;9:9-15.
- Dieckmann K, Hamm B, Pickartz H. Adrenal myelolipoma: Clinical, radiologic, and histologic features. Urology. 1987;29:1-8.
- Lam K, Lo C. Adrenal lipomatous tumours: A 30 year clinicopathological experience at a single institution. J Clin Pathol. 2001;54:707-12.
- Hoeffel C, Kowalski S. Giant myelolipoma of the adrenal gland: Natural history. Clin Radiol. 2000;55:402-404.
- Glazer H, Weyman P, Sagel S. Nonfunctioning adrenal masses: Incidental discovery on computed tomography. AJR Am J Roentgenol. 1982;139:81-85.
- Dunnick N, Korobkin M, Francis I. Adrenal radiology: Distinguishing benign from malignant adrenal masses. AJR Am J Roentgenol. 1996;167:861-867.
- Outwater E, Siegelman E, Huang A, Birnbaum B. Adrenal masses: Correlation between CT attenuation value and chemical shift ratio at MR imaging with in-phase and opposed-phase sequences. Radiology Radiology.
- Boland G, Lee M, Gazelle G. Characterization of adrenal masses using unenhanced CT: An analysis of the CT literature. AJR Am J Roentgenol. 1998;171:201-204.
- Caoili E, Korobkin M, Francis I. Delayed enhanced CT of lipid-poor adrenal adenomas. AJR Am J Roentgenol. 2000;175:1411-1415.
- Caoili E, Korobkin M, Francis I. Adrenal masses: Characterization with combined unenhanced and delayed enhanced CT. Radiology. 2002;222:629-633.
- Korobkin M, Brodeur F, Francis I. CT time-attenuation washout curves of adrenal adenomas and nonadenomas. AJR Am J Roentgenol. 1998;170:747-752.
- Bae K, Fuangtharnthip P, Prasad S. Adrenal masses: CT characterization with histogram analysis method. Radiology. 2003;228:735-742.
- Honigschnabl S, Gallo S, Niederle B. How accurate is MR imaging in characterisation of adrenal masses: Update of a long-term study. Eur J Radiol. 2002;41:113-122.
- Mayo-Smith W, Lee M, McNicholas M. Characterization of adrenal masses (<5 cm) by use of chemical shift MR imaging: Observer performance versus quantitative measures. AJR Am J Roentgenol. 1995;165:91-95.
- Mitchell D, Crovello M, Matteucci T. Benign adrenocortical masses: Diagnosis with chemical shift MR imaging. Radiology. 1992;185:345-351.
- Fujiyoshi F, Nakajo M, Fukukura Y, Tsuchimochi S. Characterization of adrenal tumors by chemical shift fast low-angle shot MR imaging: Comparison of four methods of quantitative evaluation. AJR Am J Roentgenol. 2003;180:1649-1657.
- Abrams H, Spiro R, Goldstein N. Metastases in carcinoma; Analysis of 1000 autopsied cases. Cancer. 1950;3:74-85.
- Schwartz L, Macari M, Huvos A, Panicek D. Collision tumors of the adrenal gland: Demonstration and characterization at MR imaging. Radiology. 1996;201:757-760.
- Sidhu S, Sywak M, Robinson B. Adrenocortical cancer: Recent clinical and molecular advances. Curr Opin Oncol. 2004;16:13-18.
- Evans H, Evans H, Vassilopoulou-Sellin R. Adrenal cortical neoplasms. A study of 56 cases. Am J Clin Pathol. 1996;105:76-86.
- Bravo E, Tagle R. Pheochromocytoma: State-of-the-art and future prospects. Endocr Rev. 2003;24:539-553.
- Proye C, Vix M, Jansson S. “The” pheochromocytoma: A benign, intra-adrenal, hypertensive, sporadic unilateral tumor. Does it exist?. World J Surg. 1994;18:467-472.
- Gold R, Wisinger B, Geraci A, Heinz L. Hypertensive crisis as a result of adrenal venography in a patient with pheochromocytoma. Radiology. 1972;102:579-580.
- Christenson R, Smith C, Burko H. Arteriographic manifestations of pheochromocytoma. AJR Am J Roentgenol. 1976;126:567-575.
- Raisanen J, Shapiro B, Glazer G. Plasma catecholamines in pheochromocytoma: Effect of urographic contrast media. AJR Am J Roentgenol. 1984;143:43-46.
- Mukherjee J, Peppercorn P, Reznek R. Pheochromocytoma: Effect of nonionic contrast medium in CT on circulating catecholamine levels. Radiology. 1997;202:227-231.
- Grumbach M, Biller B, Braunstein G. Management of the clinically inapparent adrenal mass (“incidentaloma”). Ann Intern Med. 2003;138:424-429.
- Casola G, Nicolet V, van Sonnenberg E. Unsuspected pheochromocytoma: Risk of blood-pressure alterations during percutaneous adrenal biopsy. Radiology. 1986;159:733-735.
- Glazer H, Lee J, Balfe D. Non-Hodgkin lymphoma: Computed tomographic demonstration of unusual extranodal involvement. Radiology. 1983;149:211-217.
- Paling M, Williamson B. Adrenal involvement in non-Hodgkin lymphoma. AJR Am J Roentgenol. 1983;141:303-305.
- Lee F, Thornbury J, Grist T, Kelcz F. MR imaging of adrenal lymphoma. Abdom Imaging. 1993;18:95-96.
- Prevot S, Penna C, Imbert J. Solitary fibrous tumor of the adrenal gland. Mod Pathol. 1996;9:1170-1174.
- Gold J, Antonescu C, Hajdu C. Clinicopathologic correlates of solitary fibrous tumors. Cancer. 2002;94:1057-1068.
- Marotti M, Sucic Z, Krolo I. Adrenal cavernous hemangioma: MRI, CT, and US appearance. Eur Radiol. 1997;7:691-694.
- Ferrozzi F, Tognini G, Bova D. Hemangiosarcoma of the adrenal glands: CT findings in two cases. Abdom Imaging. 2001;26:336-339.
- Hood M, Ho V, Smirniotopoulos J. Chemical shift: The artifact and clinical tool revisited. RadioGraphics. 1999;19:357-371.
Citation
. CT and MRI of adrenal masses. Applied Radiology. 2006;35(8):10-26. doi:10.37549/AR1444.