Detecting cardiac abnormalities on routine chest CT
Applied Radiology — Vol. 38 , Issue 6 , pp. 28 -37
DOI: 10.37549/AR1700
Published: June 1, 2009
Categories
The use of computed tomography (CT) has increased significantly since its advent about 40 years ago with an estimated 62 million scansperformed in the United States every year.1 It is likely that a large portion of this increase is due to the ability of CT angiography to detect pulmonary embolism and aortic dissection. Standard chest CT has also revolutionized imaging of the lungs with its ability to differentiate between many pulmonary disorders.
All too often, however, radiologists forget to analyze the heart while interpreting these studies. With improved multislice scanners and shortened imaging times, many cardiac abnormalities can be detected even on an ungated study.2–4 In many institutions CT for aortic disease is gated and, if slice reconstruction is thin enough, important findings may become obvious.2
CT findings in the heart may contribute additional information to findings in the lungs, or may point to an entirely separate disease process. In either case, they are likely to aid the referring physician in appropriately treating the patient. It therefore behooves the conscientious radiologist to evaluate the heart and be able to recognize the more common abnormalities encountered on a routine chest CT.
Cardiac calcification
Coronary artery calcium
CT is extremely sensitive for detection of coronary artery calcium. As atherosclerosis is the sole cause of calcium in the coronary arteries, coronary calcium is specific for the presence of atherosclerosis2,5 (Figure 1).
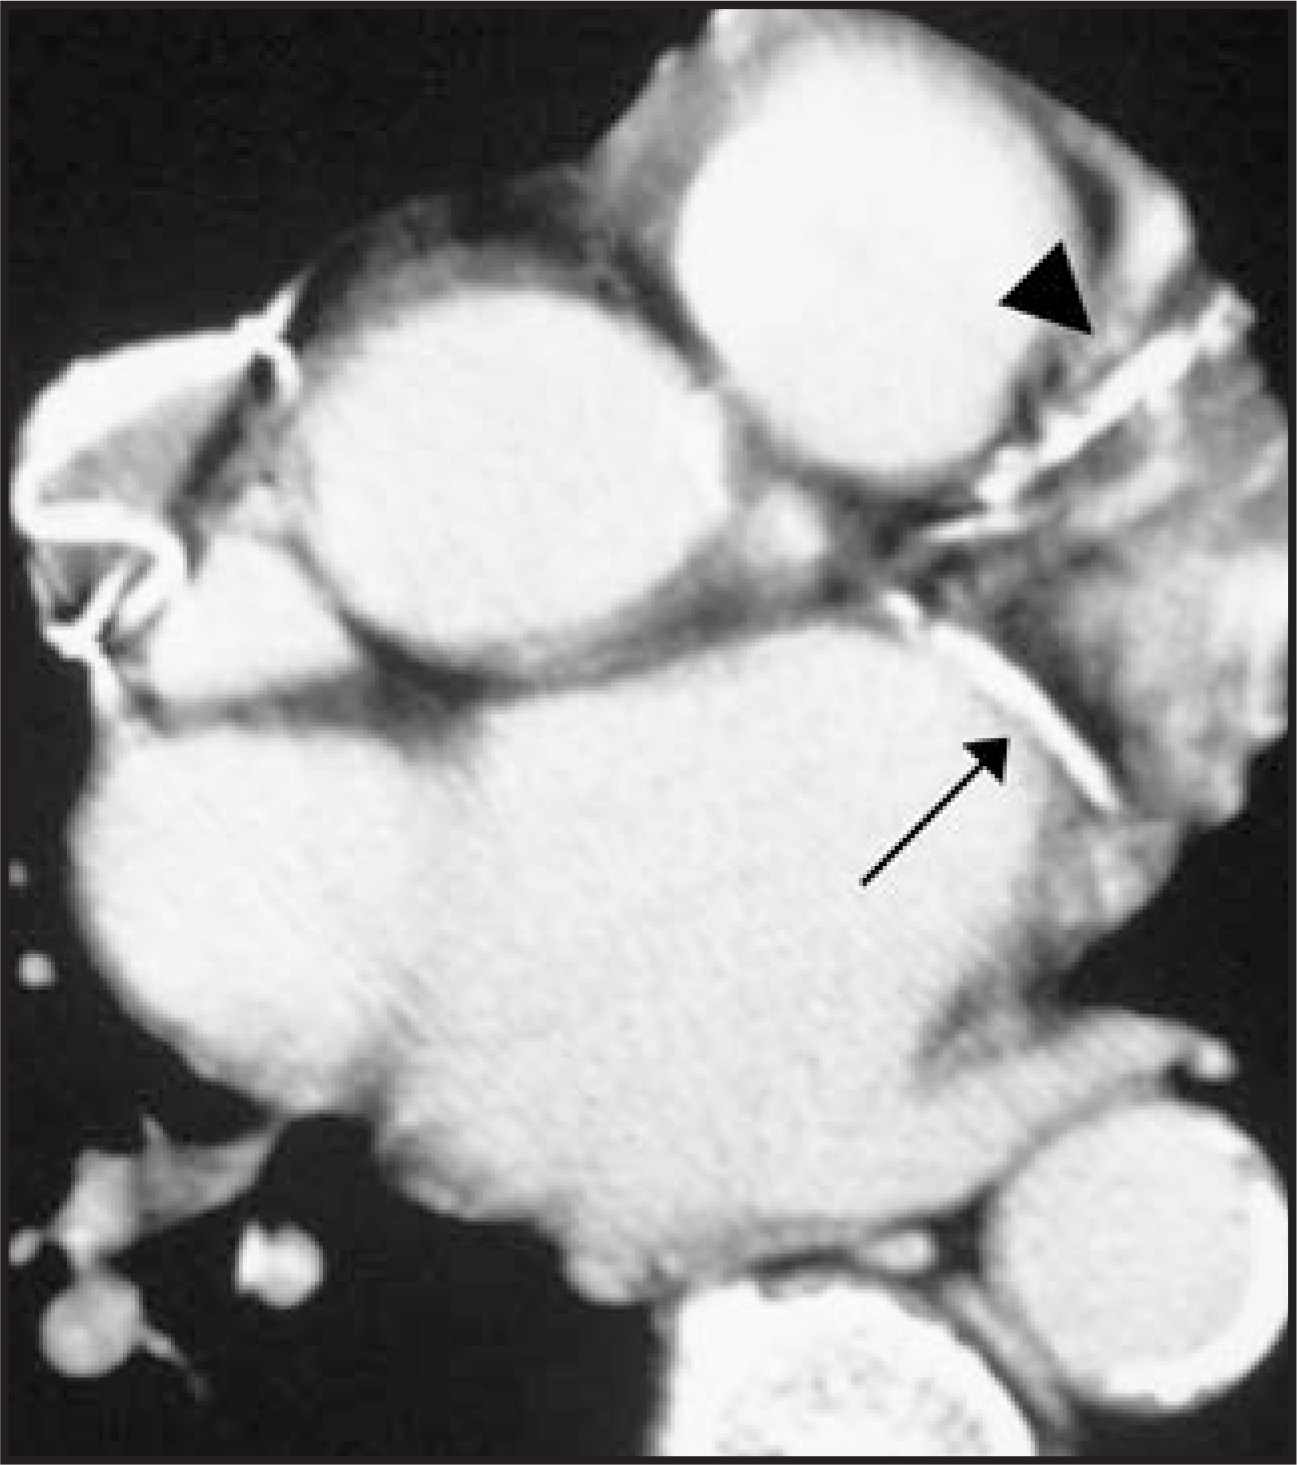
Although one cannot infer the presence of significant obstruction from the presence of calcium alone, it is still an important observation and may be the first evidence of coronary atherosclerosis. Soft plaque in the coronary arteries will almost never be discernible on ungated studies, but may be visible on gated aortic studies and it could provide an explanation for chest pain in a patient thought to have a dissection.5
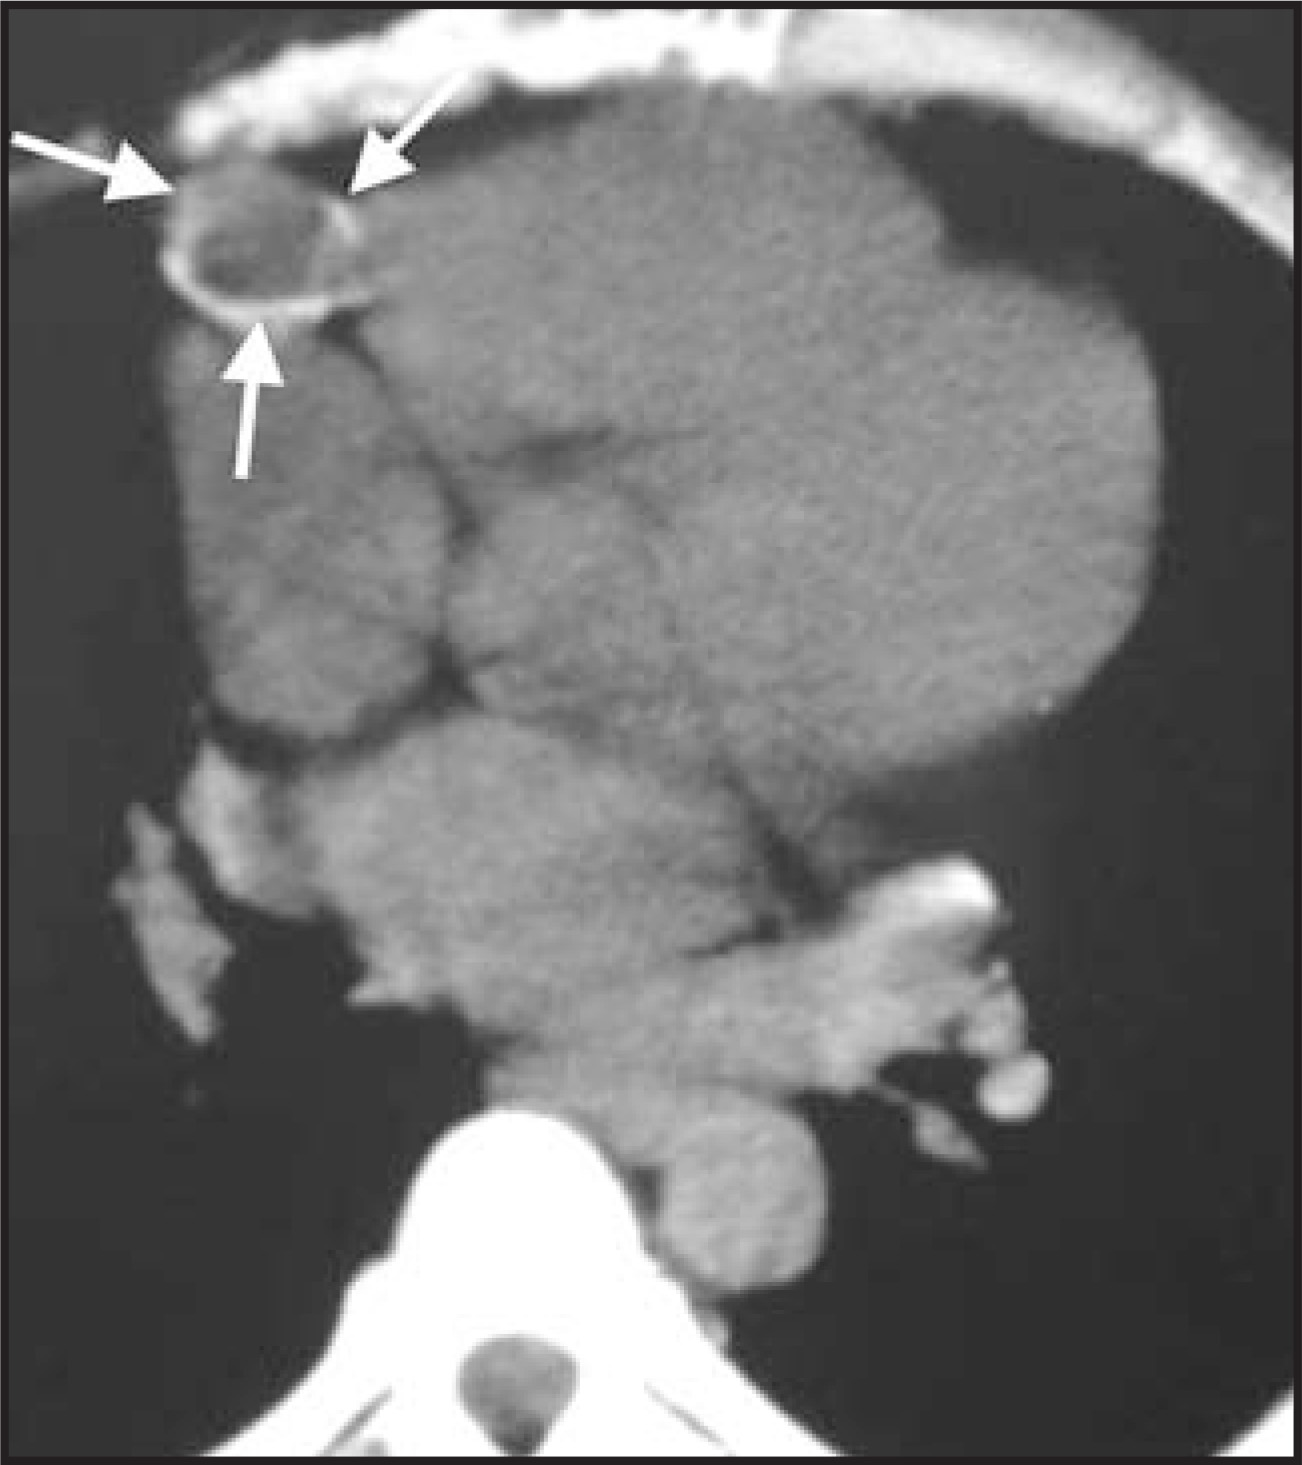
Coronary aneurysms can frequently be identified on gated and ungated studies, especially when calcified (Figure 2). They typically result from atherosclerosis and rarely from Kawasaki’s disease.6 Atherosclerotic aneurysms are a site for thrombosis or can be a source of emboli to distal vessels.6 In Kawasaki’s disease the aneurysms are typically proximal and can cause ischemia.
Valvular calcium
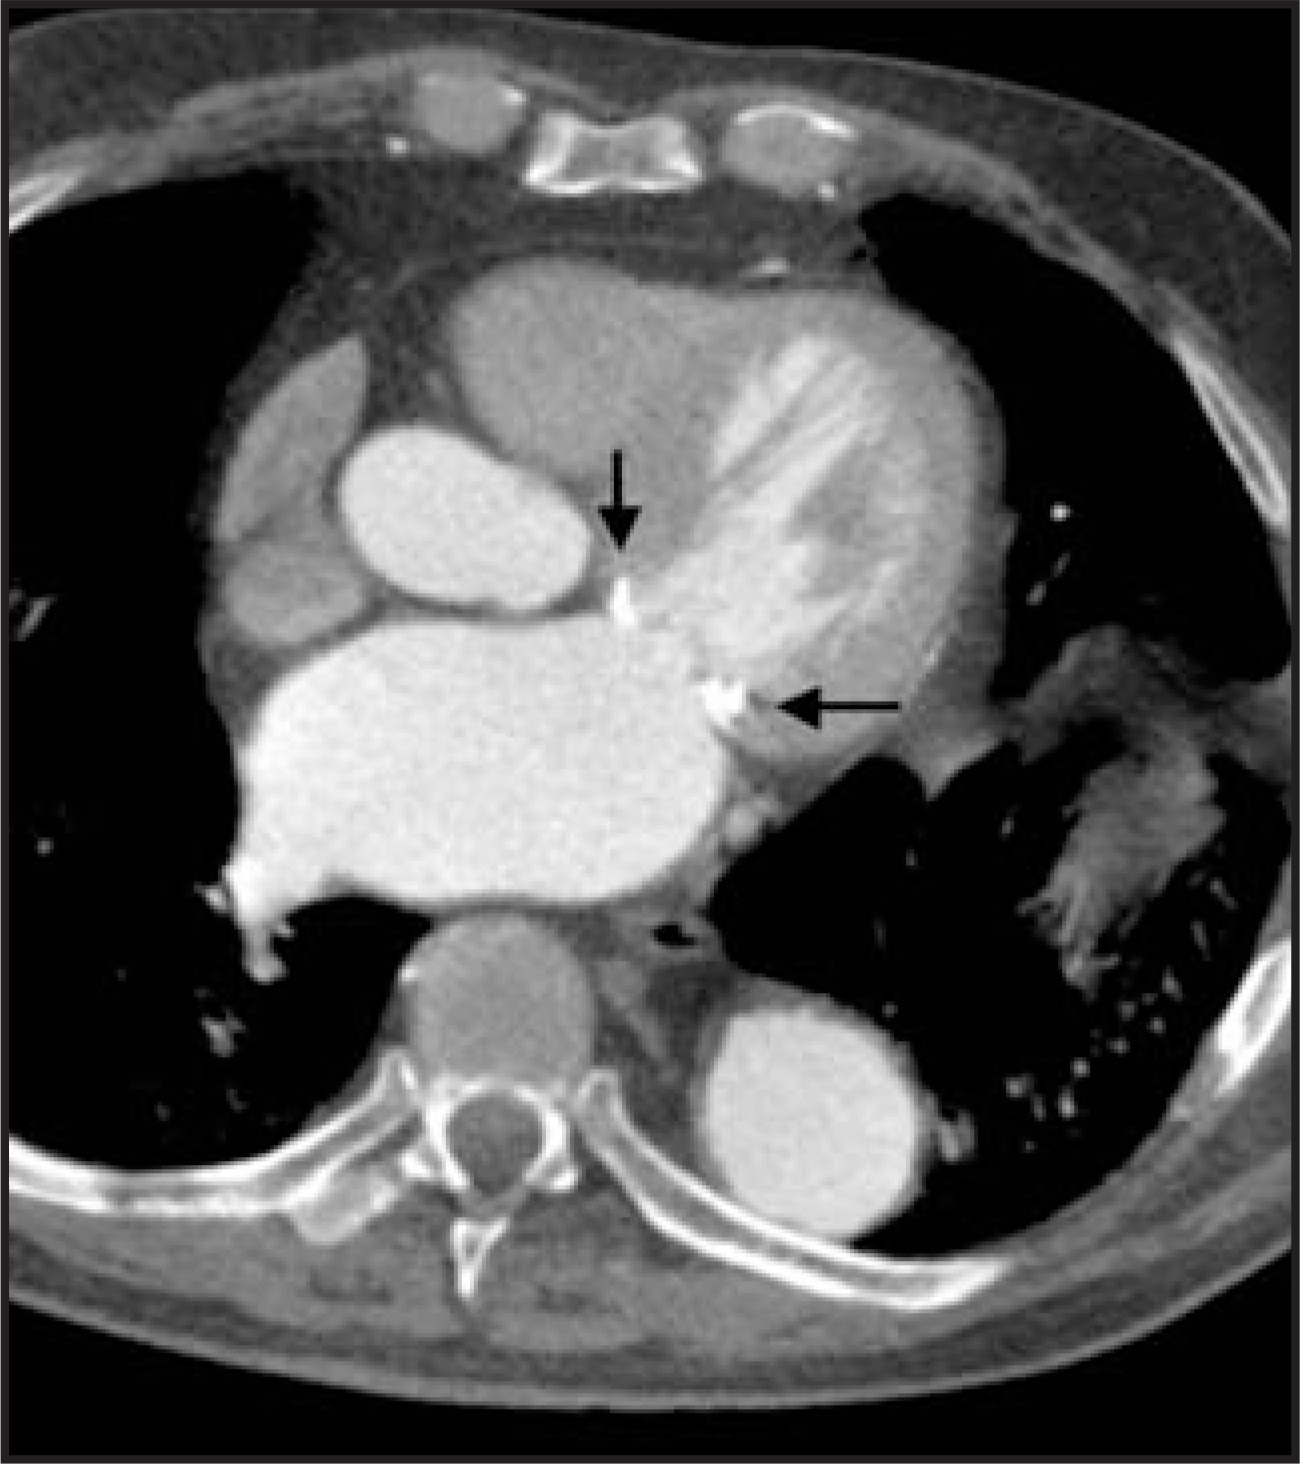
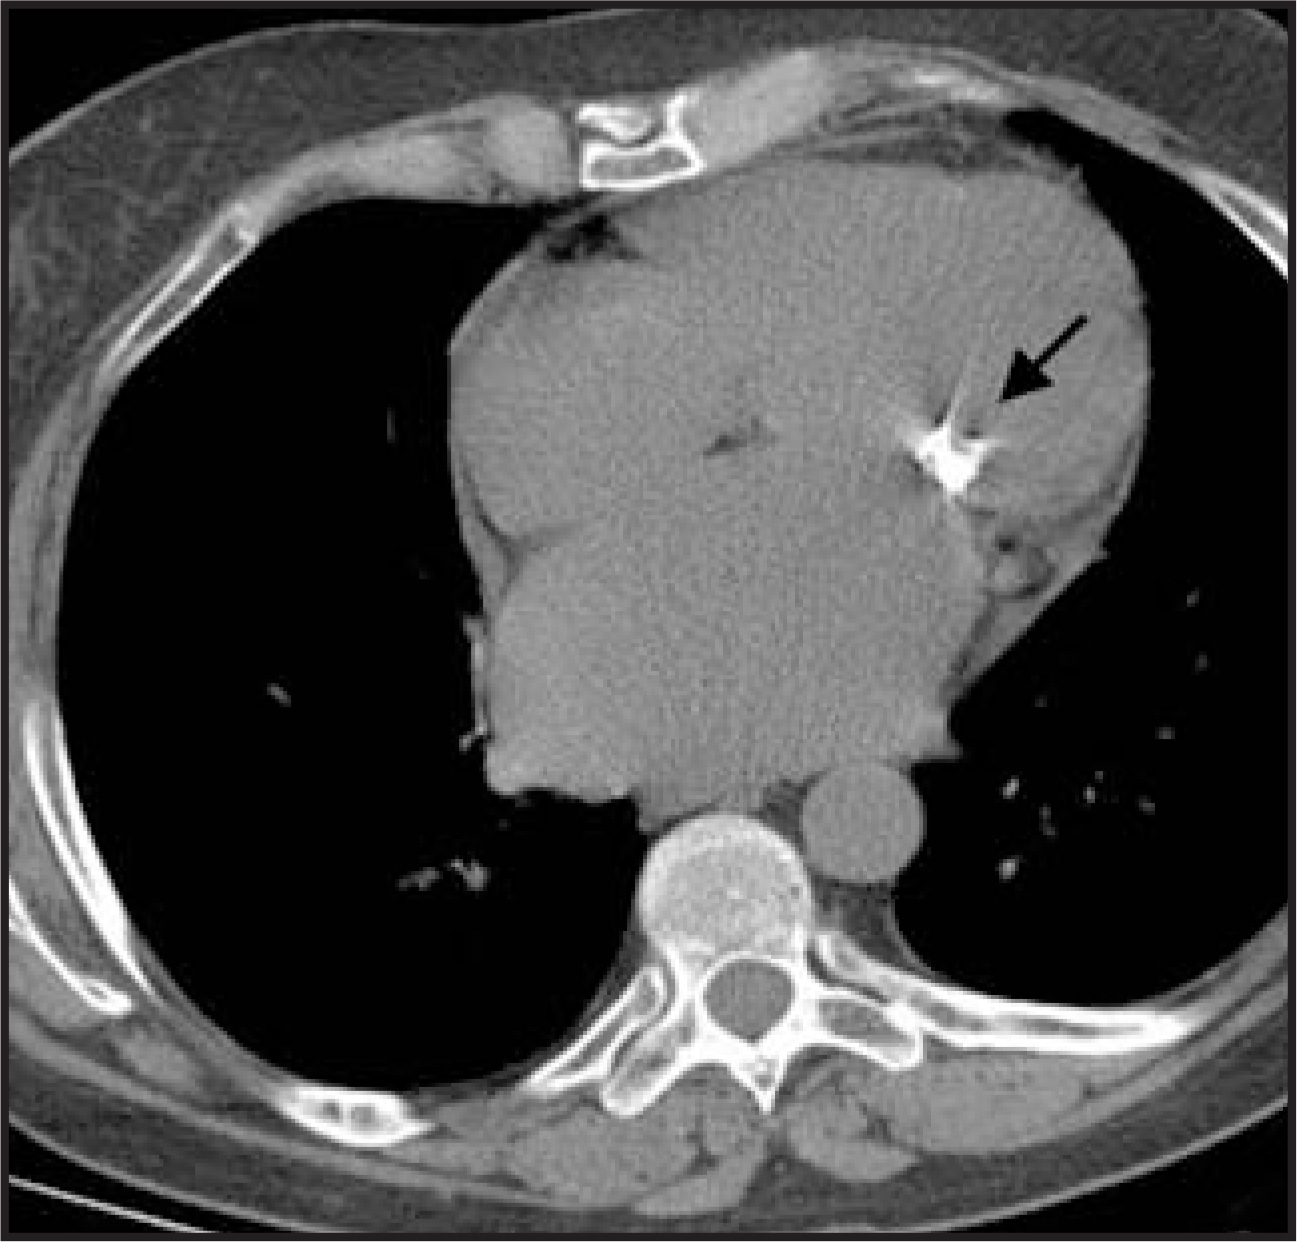
Calcium can also be seen in the regions of the mitral and aortic valves.2,3 Mitral annular calcium is common in elderly individuals, is a degenerative phenomenon and is an incidental finding as there are no symptoms or hemodynamic abnormalities usually associated with it7 (Figure 3). It is important not to confuse this with a calcified mitral valve, which occurs in mitral stenosis due to rheumatic heart disease (Figure 4) and which is quite rare in developed countries.7 Mitral annular and mitral valve calcium are readily distinguishable as the former occurs in the atrioventricular groove around the mitral valve and the latter in the valve at the midplane of the left ventricle. A rare cause of calcium in the region of the mitral valve is casseous necrosis of the mitral annulus (Figure 5).
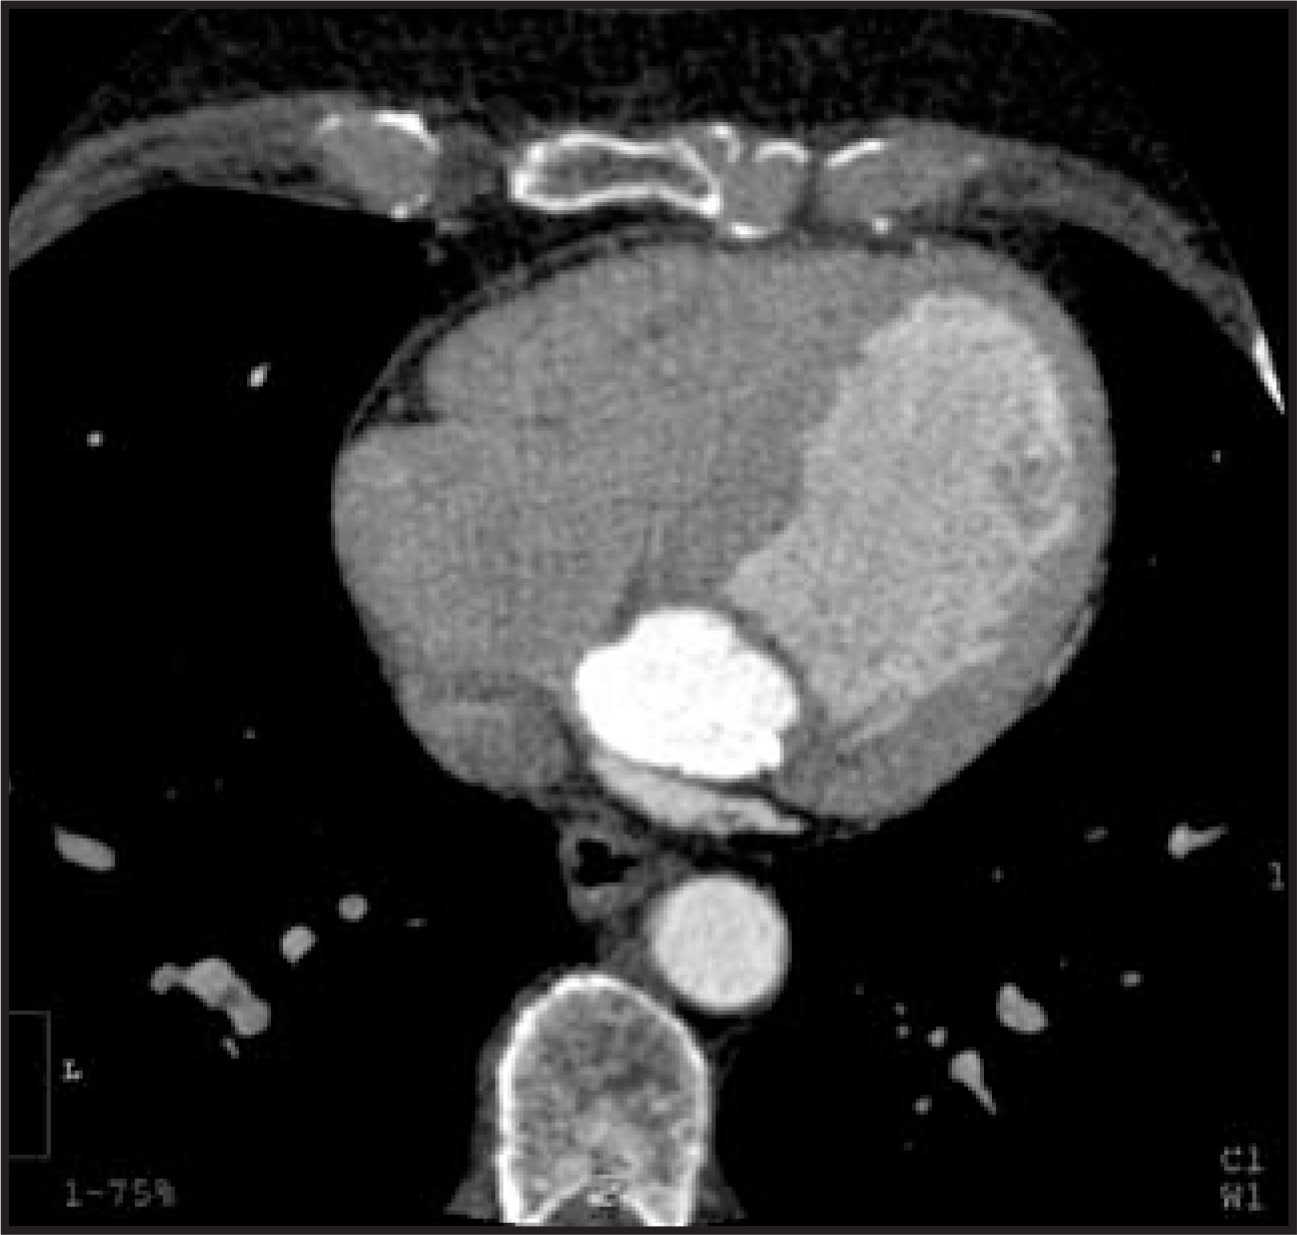
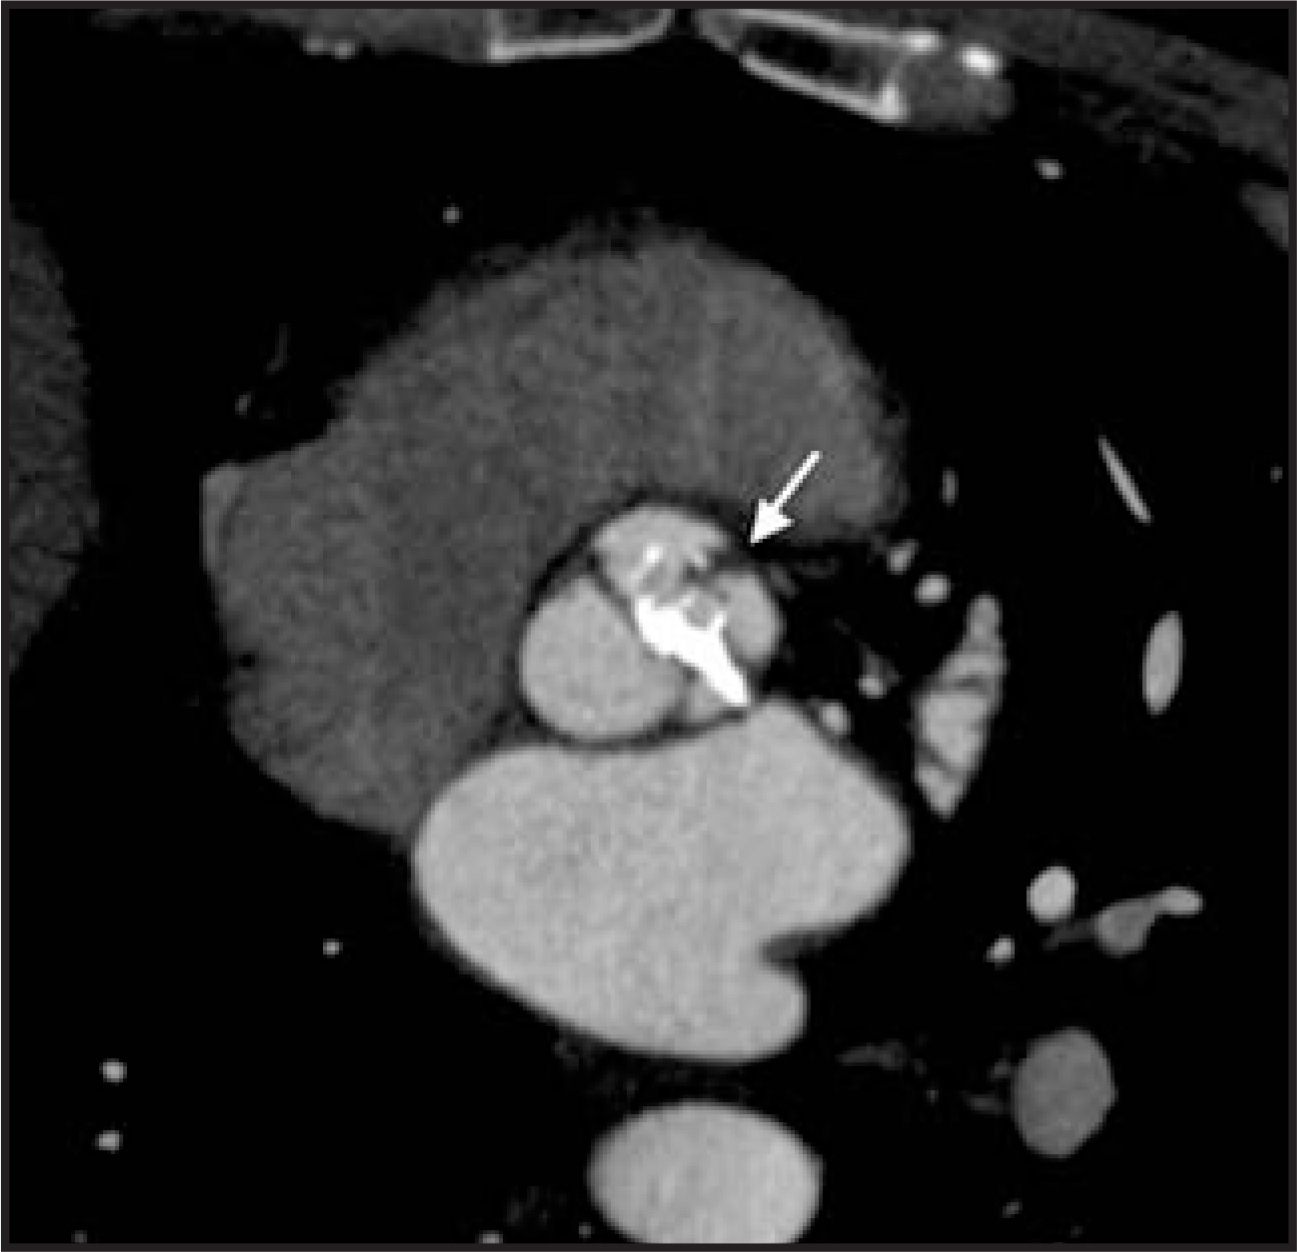
Calcium in the aortic valve suggests aortic stenosis (Figure 6) and the more heavily calcified the valve, the more likely a significant obstruction is present.8 Calcium occasionally occurs in the pulmonary valve after balloon valvuloplasty for pulmonary valve stenosis.2
Myocardial and pericardial calcium
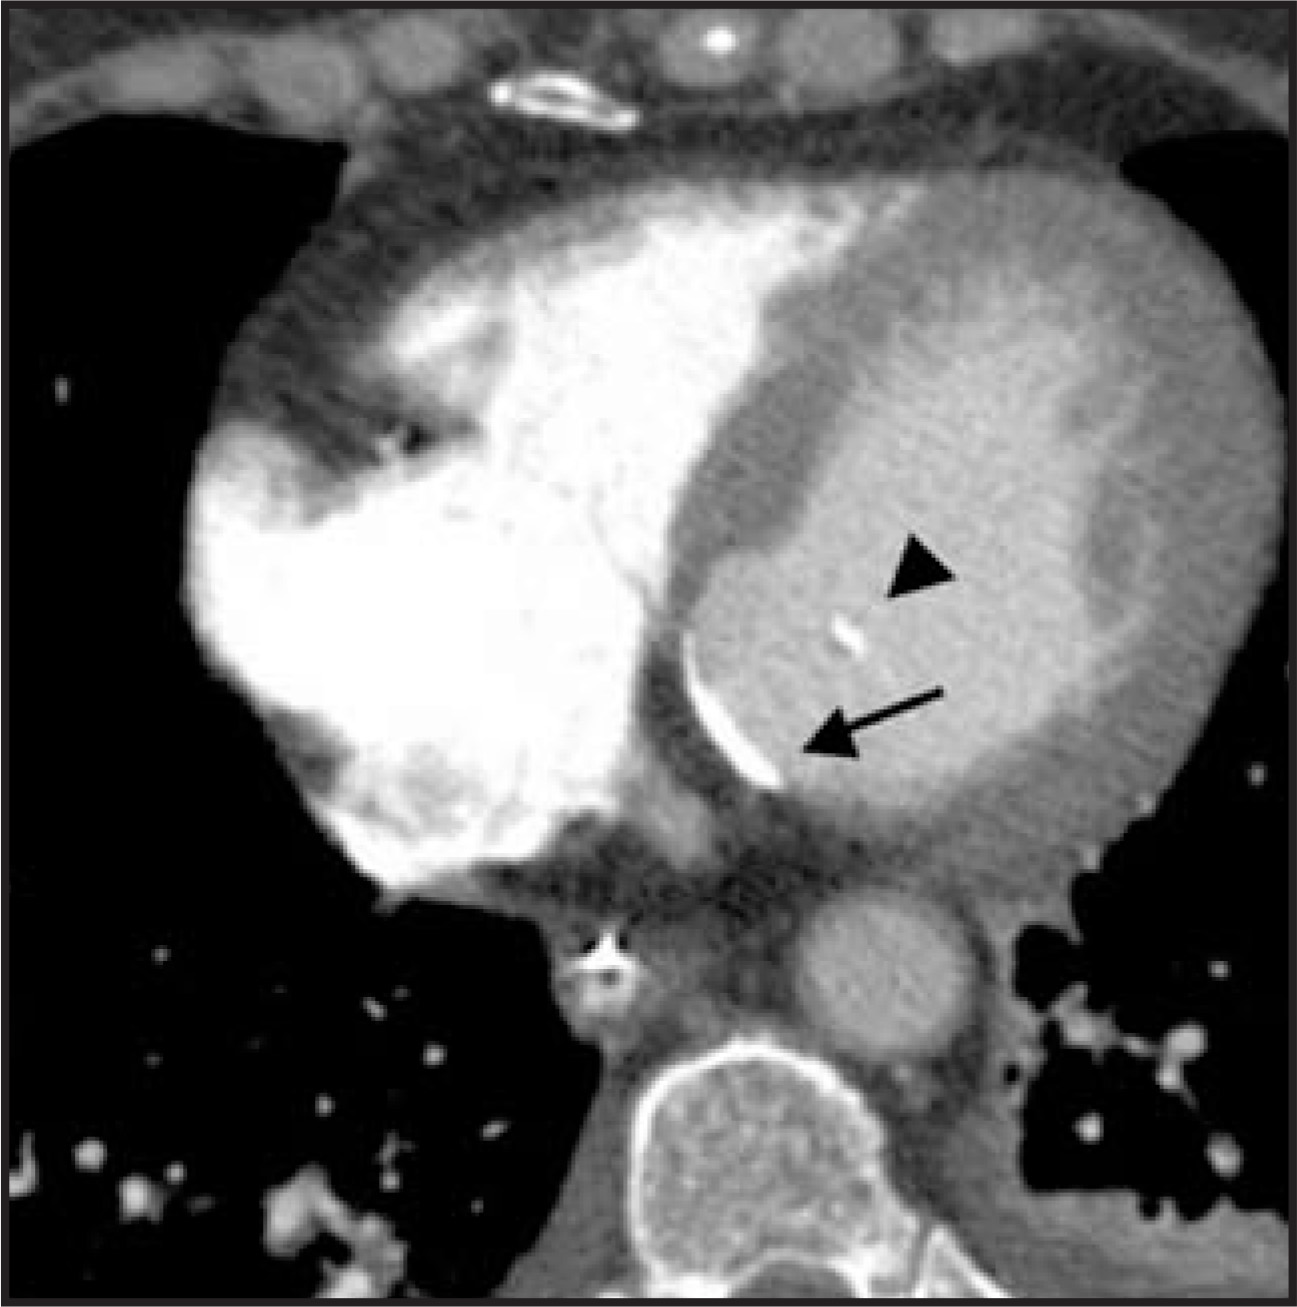
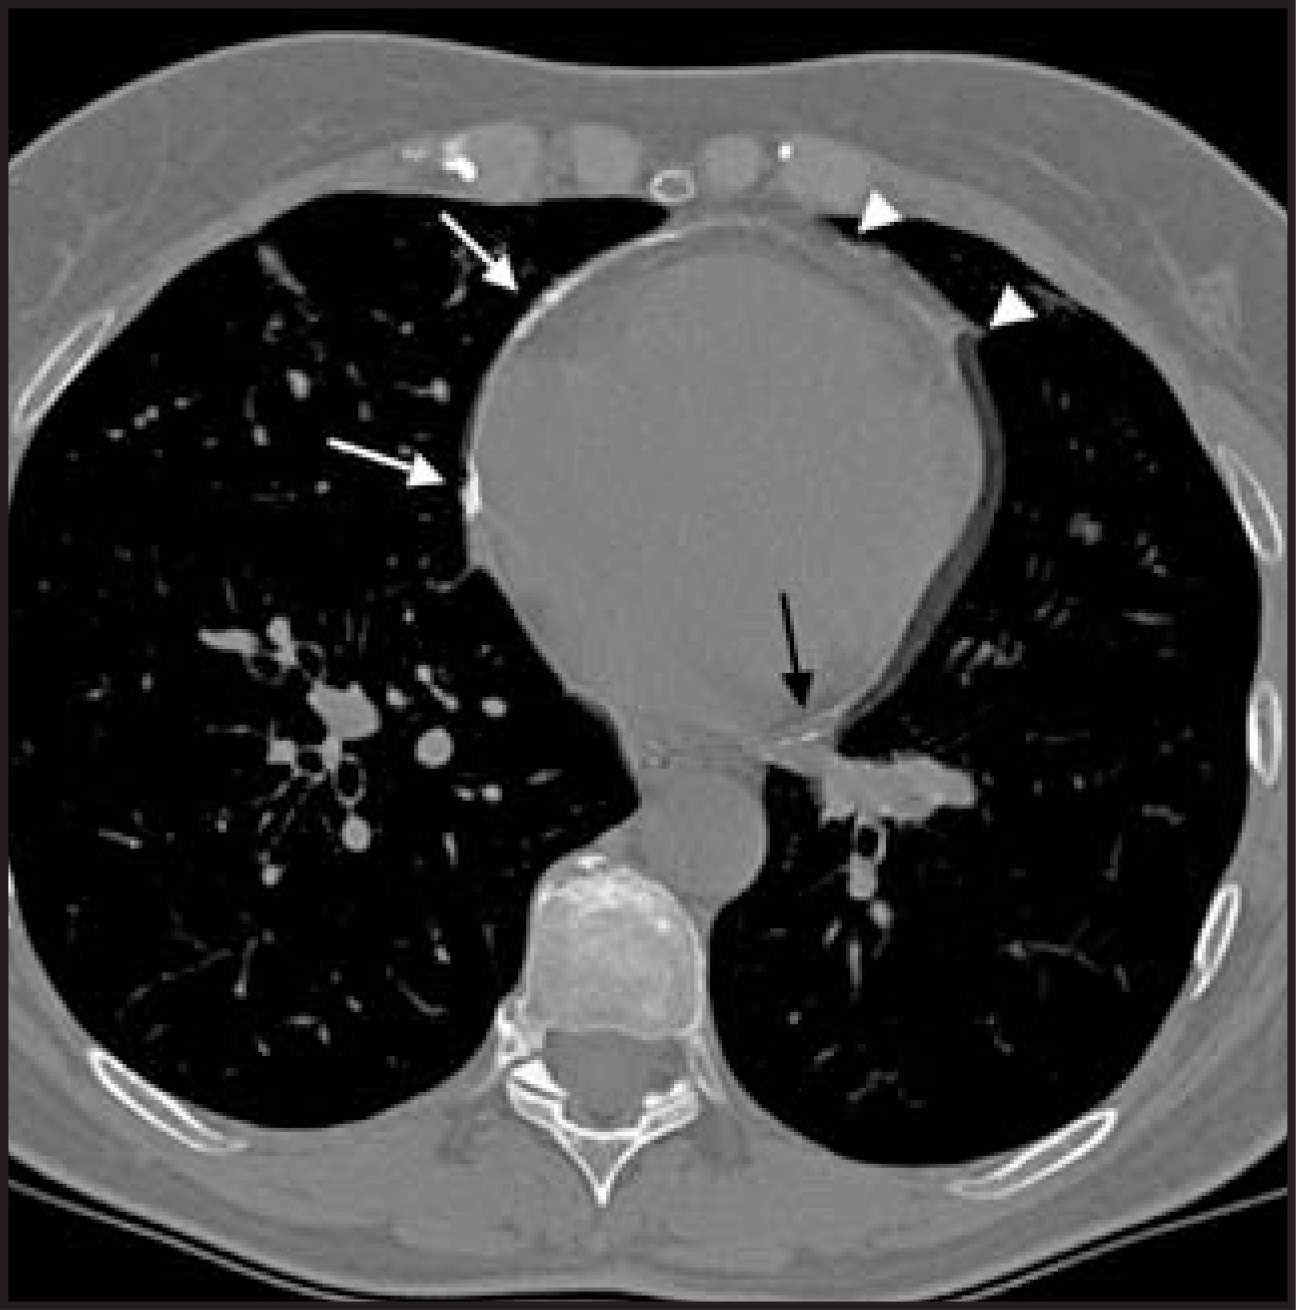
Calcium in the myocardium of the left ventricle or in a papillary muscle is indicative of a previous myocardial infarct (Figure 7), but does not necessarily indicate an aneurysm or clot.2 Calcium in the wall of the heart is usually curvilinear although it can occasionally have anamorphous appearance.
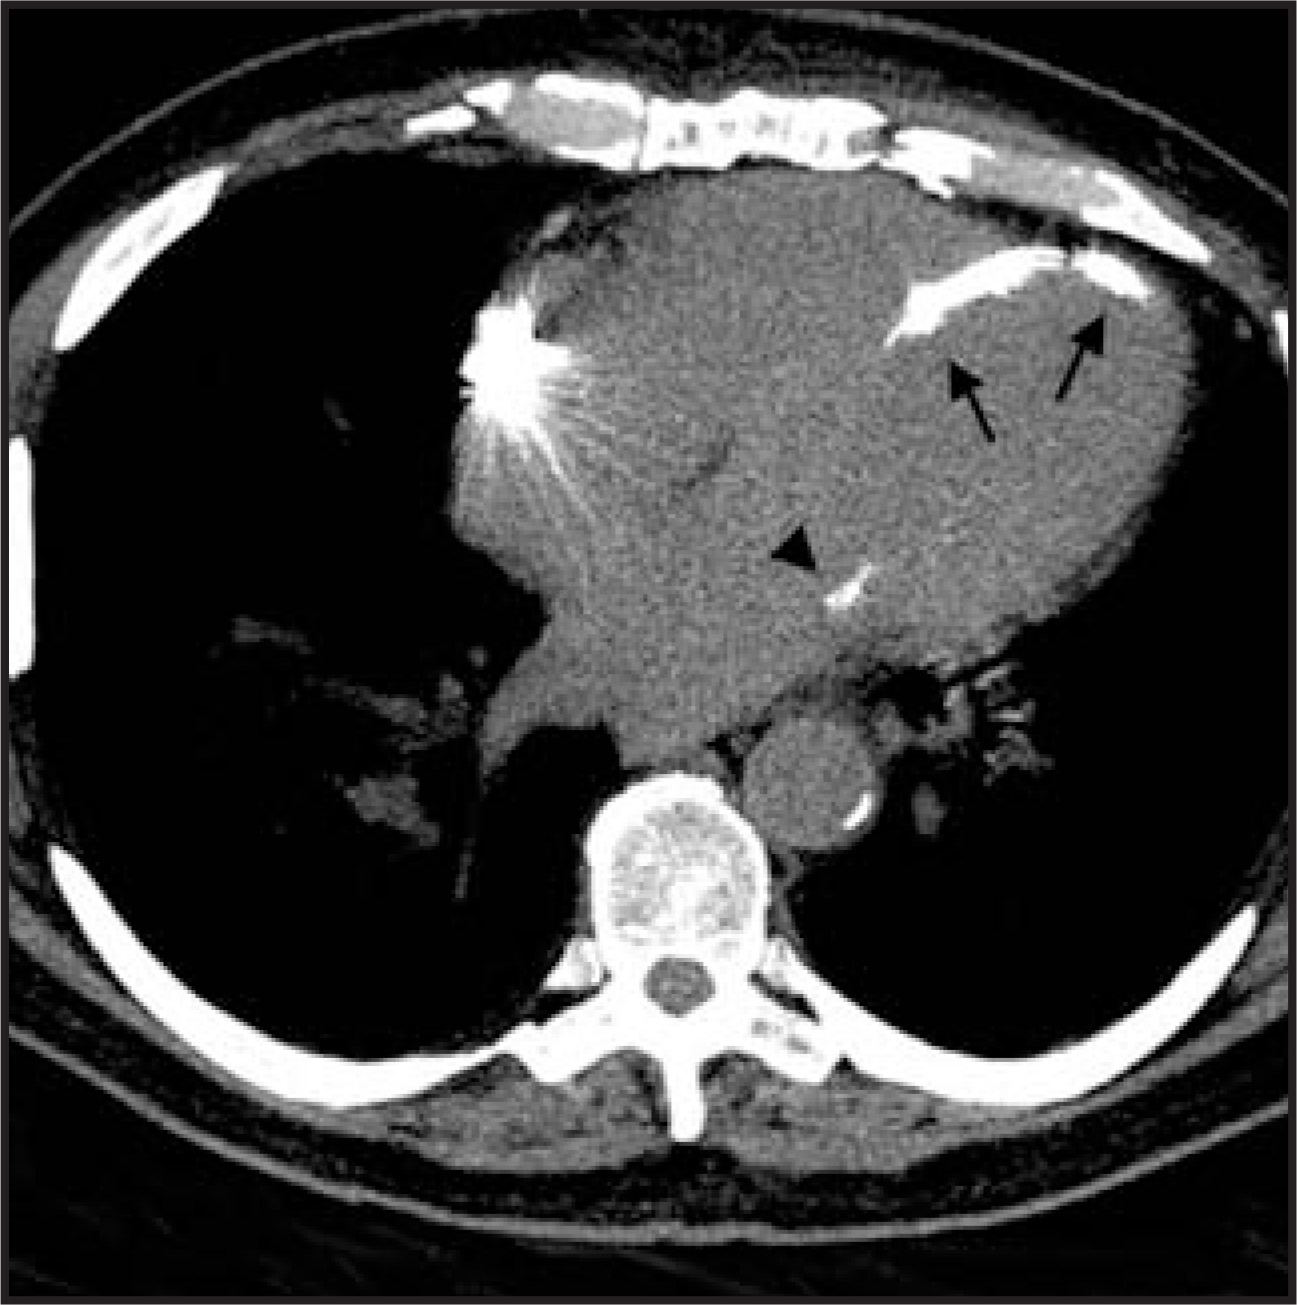
The location of the calcified myocardium can be used to localize the culprit lesion in a coronary artery.2 For example, posterior wall calcification is compatible with a right coronary artery territory infarct (Figure 8) whereas calcium at the apex or in the ventricular septum usually results from an anterior descending territory infarct (Figure 7). It is important to distinguish myocardial calcium from pericardial calcium as it is seen in patients with constrictive pericarditis.2,9 Calcium in the pericardium usually extends onto the right heart (Figure 9) whereas the right ventricular rarely, if ever, calcifies post infarction.9 Calcium in the atrioventricular groove is said to be nearly pathognomonic of pericardial constriction.
Chamber analysis
CT can be useful for analyzing cardiac chambers to determine their size, shape and thickness.2,3 If the CT is gated, scans will usually be obtained during diastole. With the proper views, one will be able to accurately measure end-diastolic chamber dimensions and wall thickness. On nongated studies the images may not reveal the true ventricular morphology because the phase of the cardiac cycle is unknown and the imaging plane will not likely be optimal.
Because the heart may be partially contracted, a cardiac chamber will be at least as large as it appears, but it could be larger. The ventricular wall, on the other hand, will be at least as thin as it appears, but it could be thinner. Because of this, it is possible to underestimate ventricular size and overestimate ventricular wall thickness.
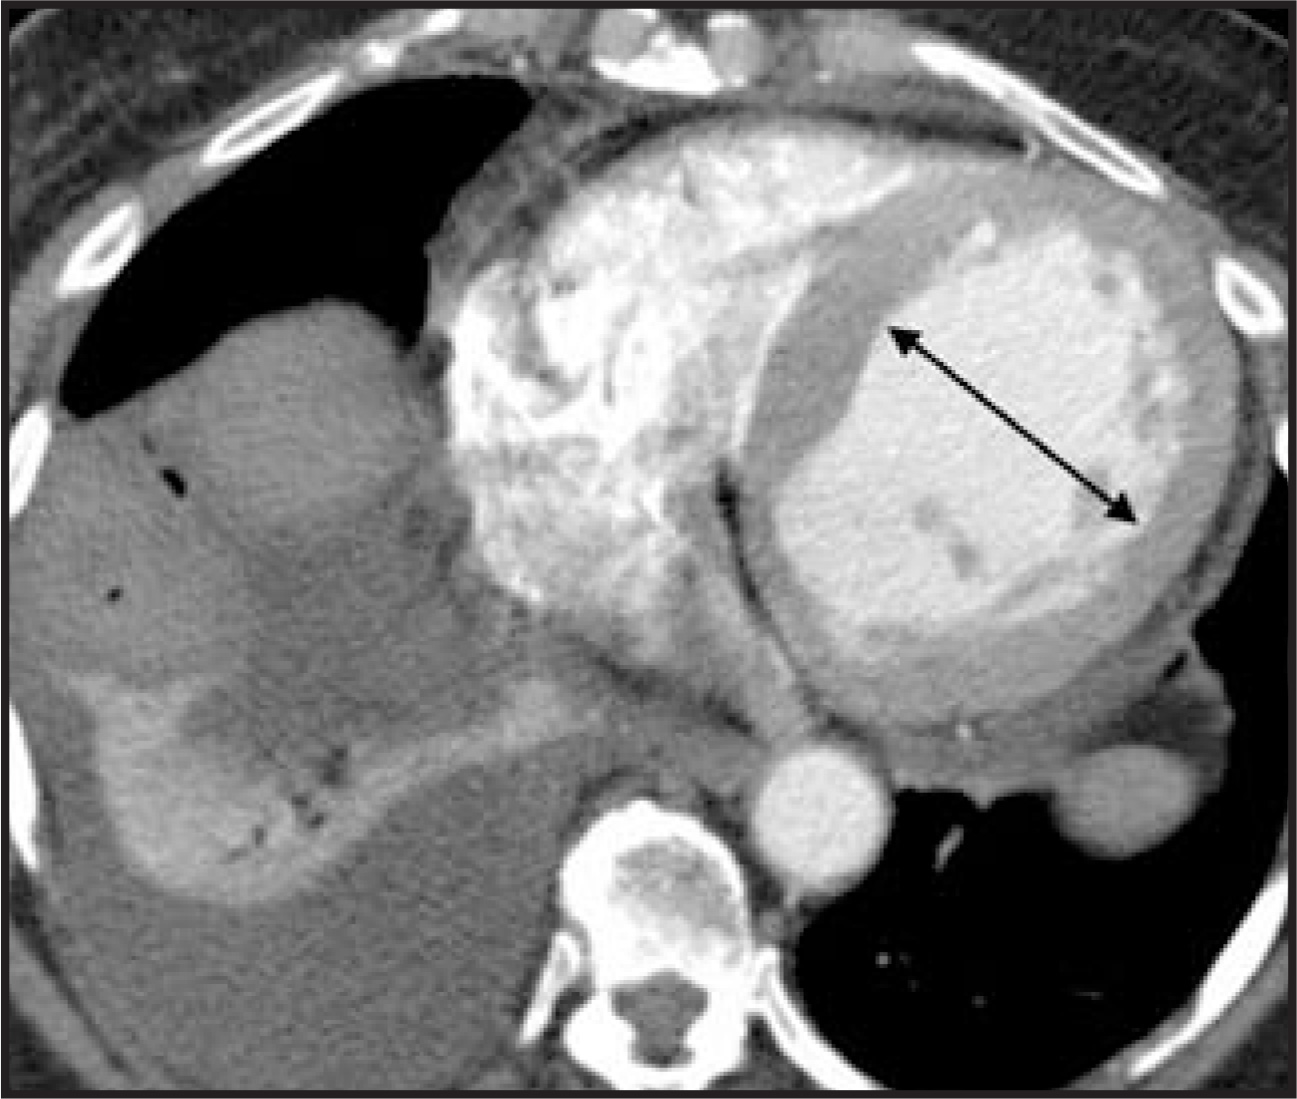
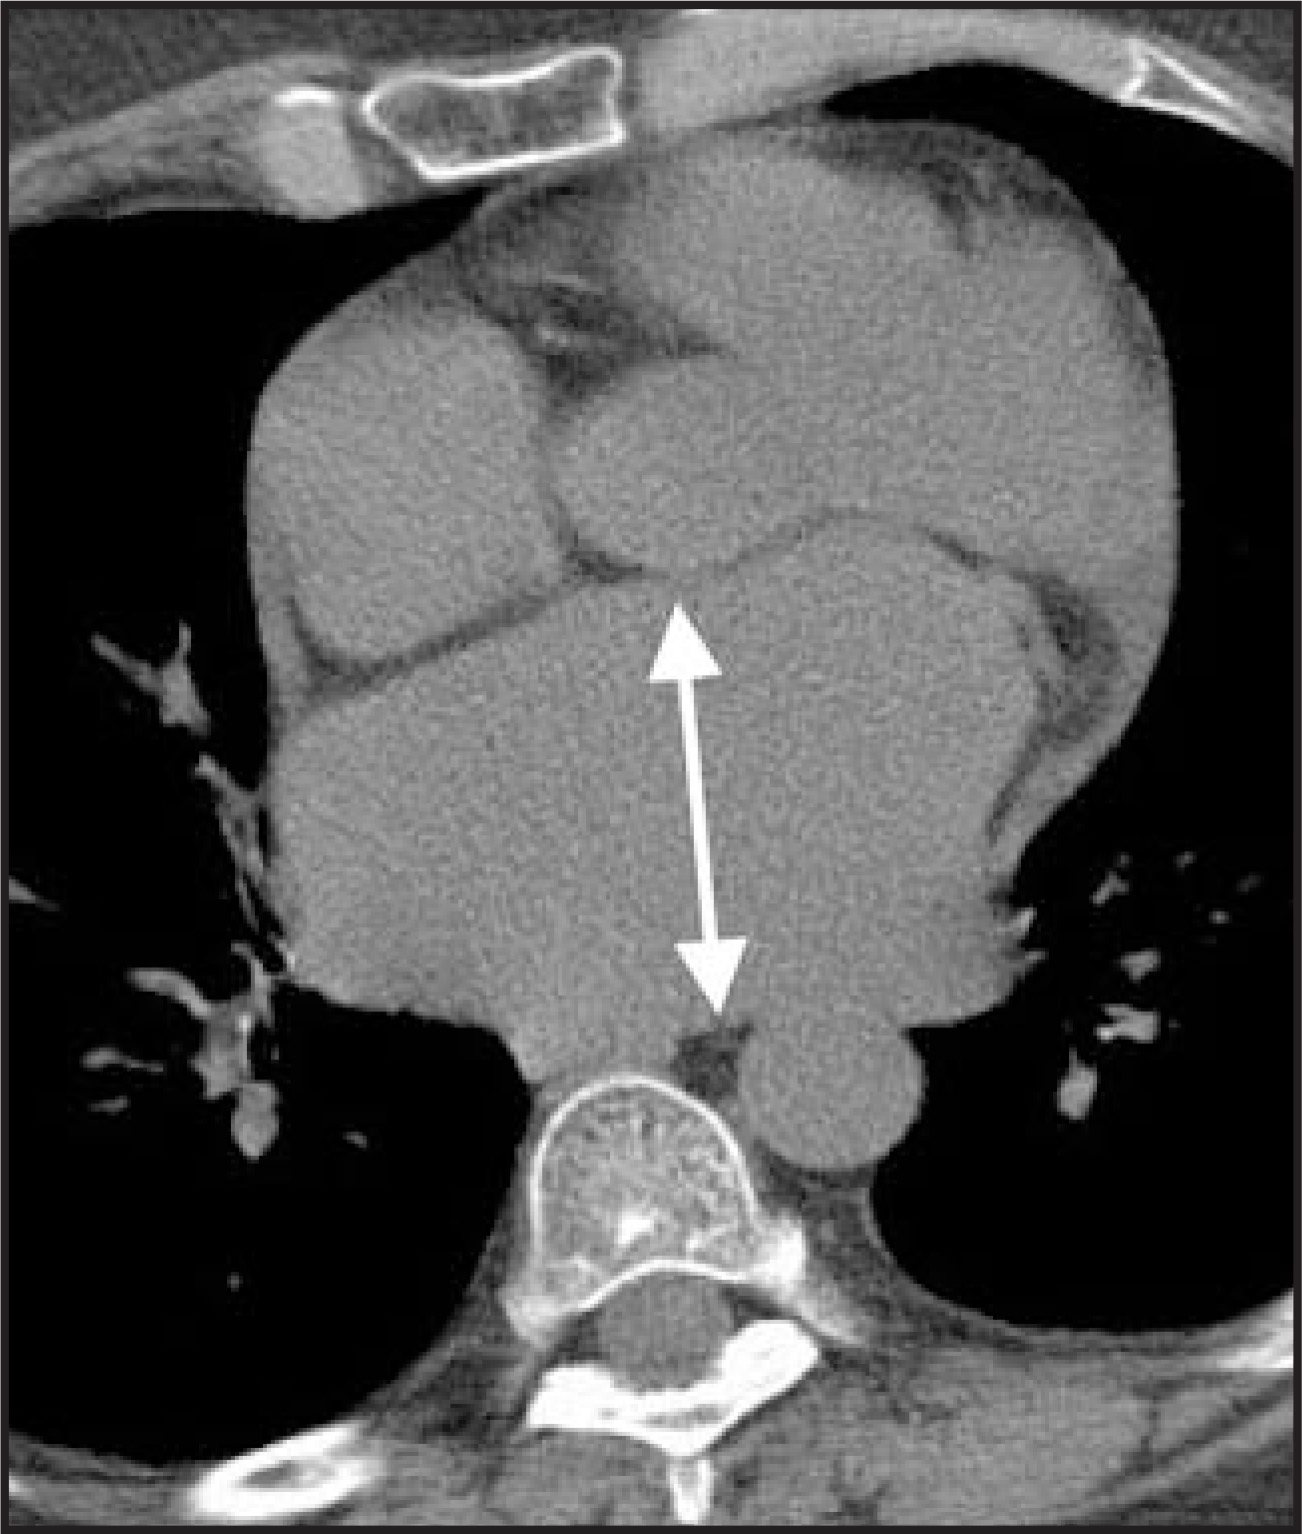
The normal left ventricle has a quasi-ellipsoidal shape. Using echocardiographic measurements as a standard, in adults its normal short axis dimension and wall thickness at end diastole should be approximately 5.6 cm and 11 mm respectively (Figure 10). By the same standards a normal left atrium should have an anteroposterior dimension of approximately 4.5 cm3 (Figure 11).
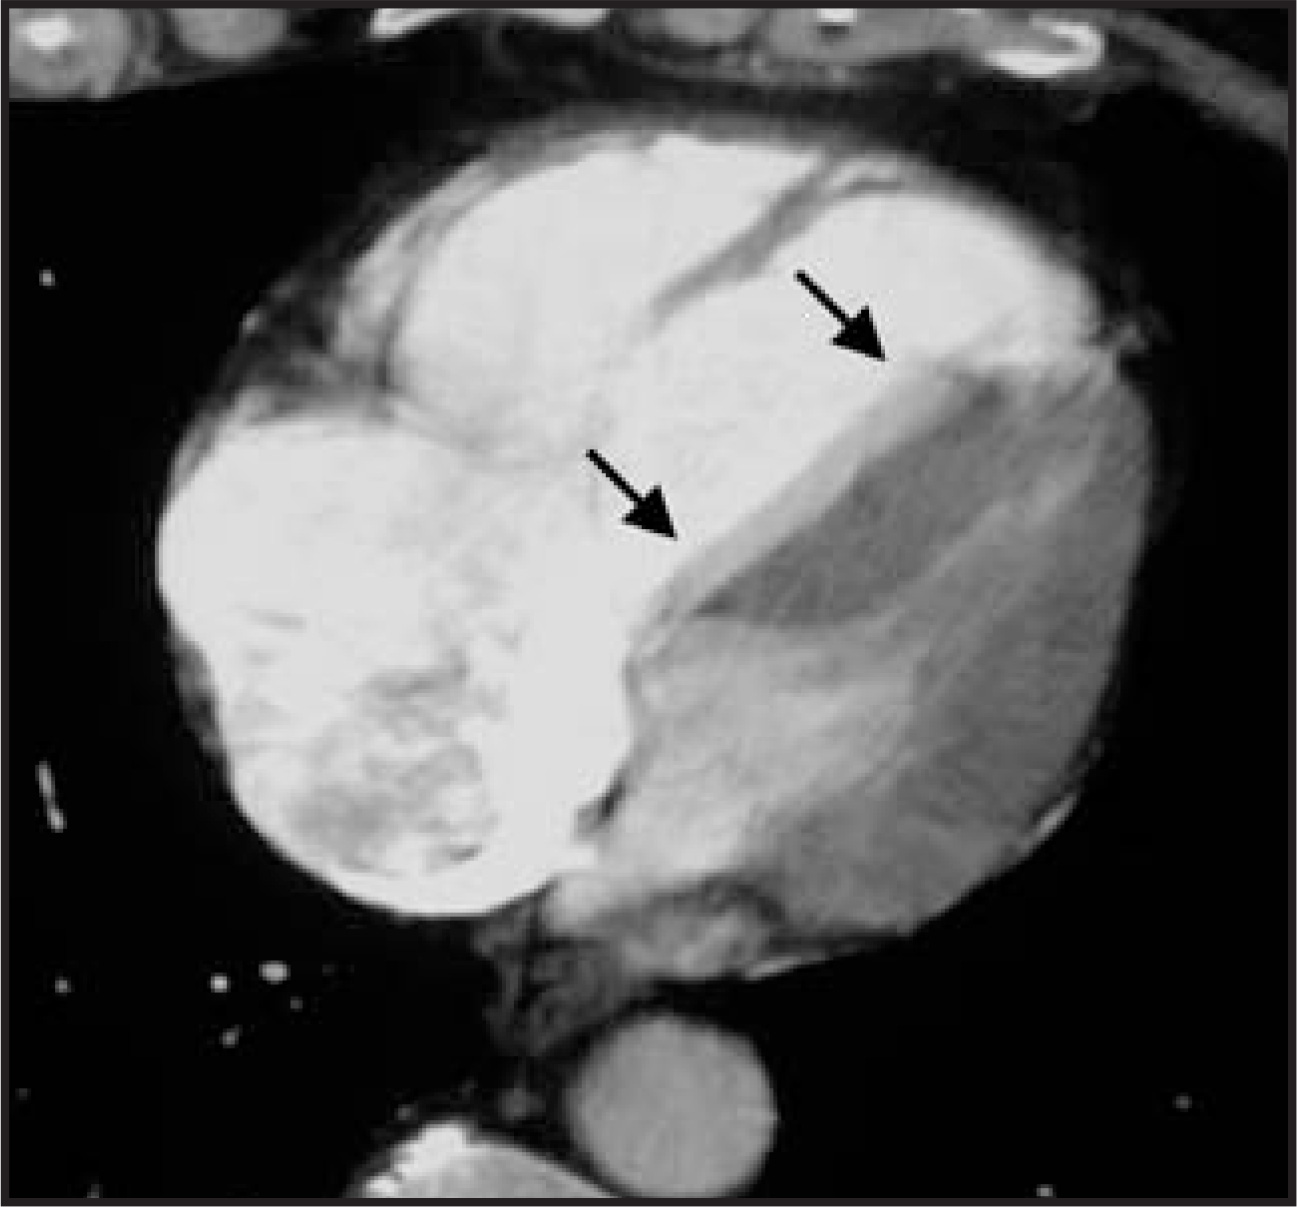
The right ventricle has a triangular shape with the ventricular septum bulging into it. It has a thin wall measuring less than 4 mm inthickness.2 Right heart enlargement can be qualitatively assessed by comparing its size to the corresponding left heart. At the midplane of the left ventricle, the internal diameter of the right ventricle is usually equal to or slightly less than that of the left ventricle 2(Figure 12).
Aneurysms vs. pseudoaneurysms
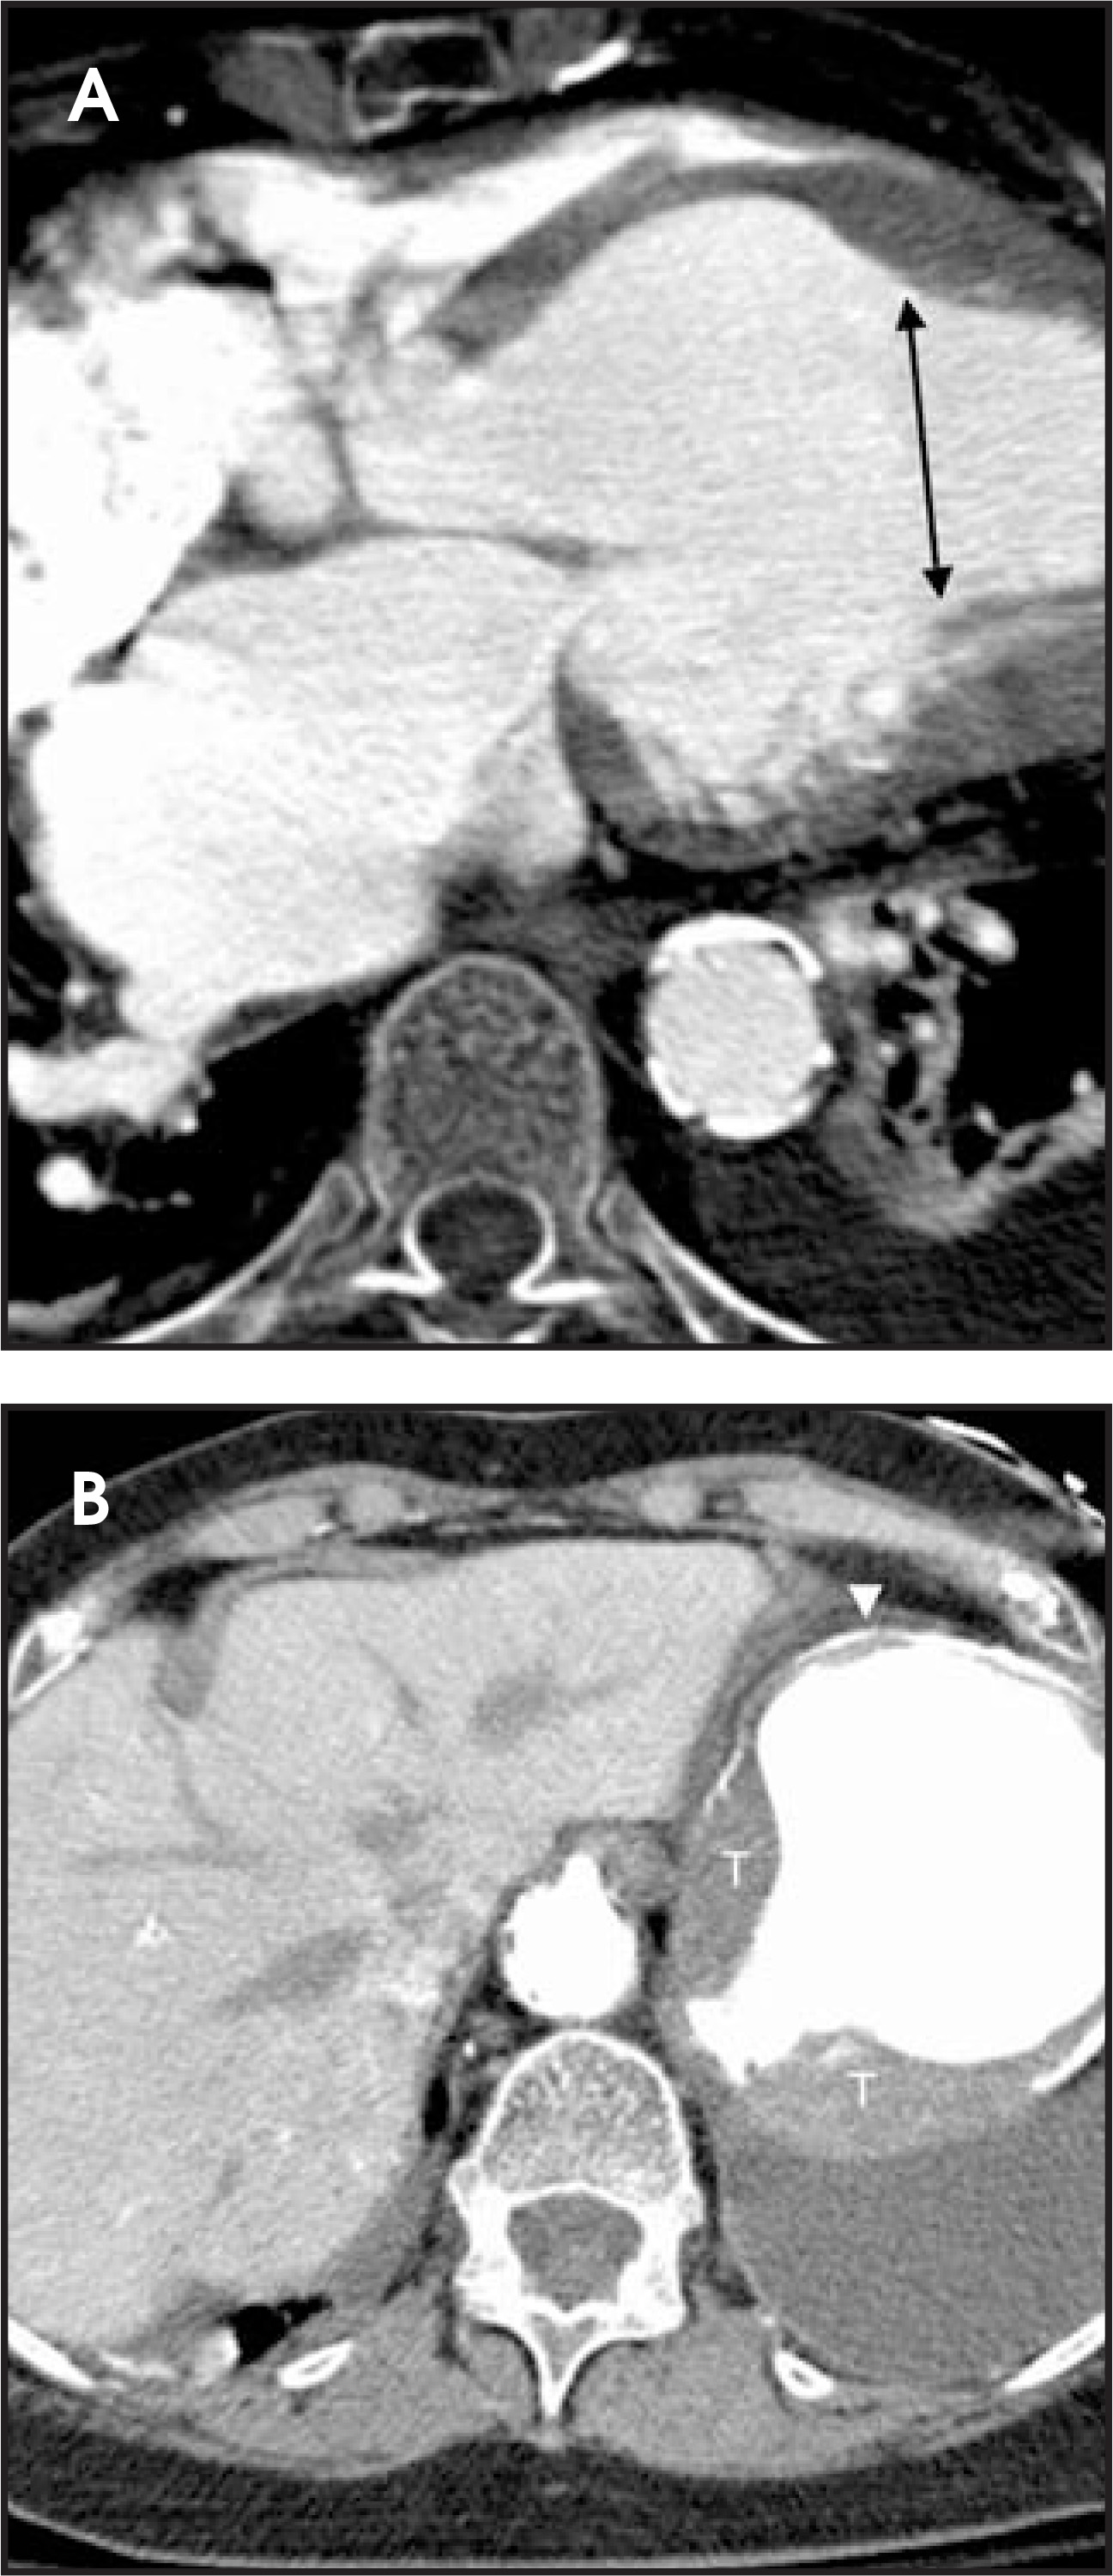
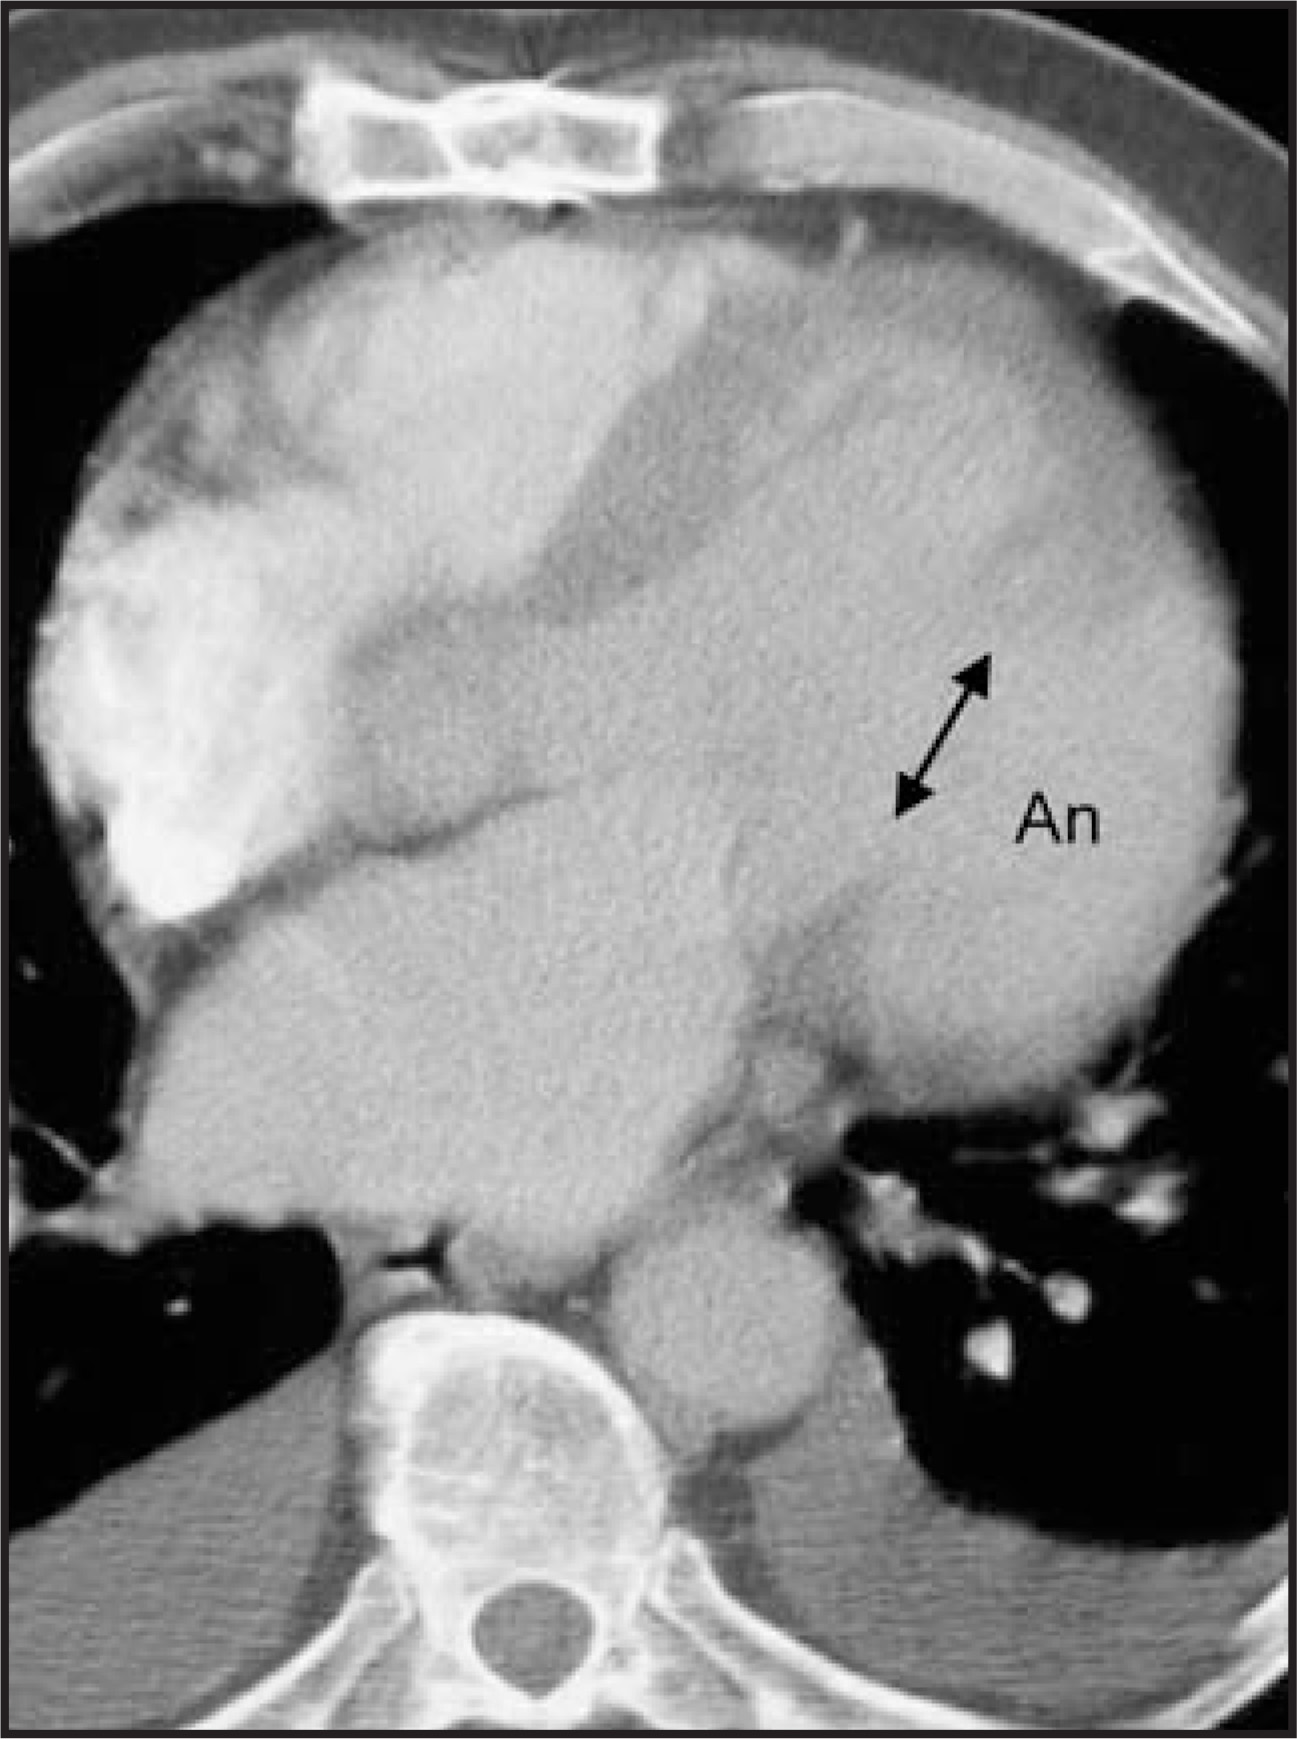
The walls of the heart are normally smooth in contour. A focal bulge in the ventricular wall frequently indicates an aneurysm.2 As with any imaging modality, on CT a true aneurysm should have a relatively wide mouth or neck (Figure 13). True left ventricular aneurysms can be located anywhere. In contrast, a left ventricular pseudoaneurysm is almost always located posteriorly or inferiorly.2 Because a pseudoaneurysm is the result of a contained myocardial rupture, it is characterized by a narrow mouth or neck2 (Figure 14).
Intracardiac thrombus
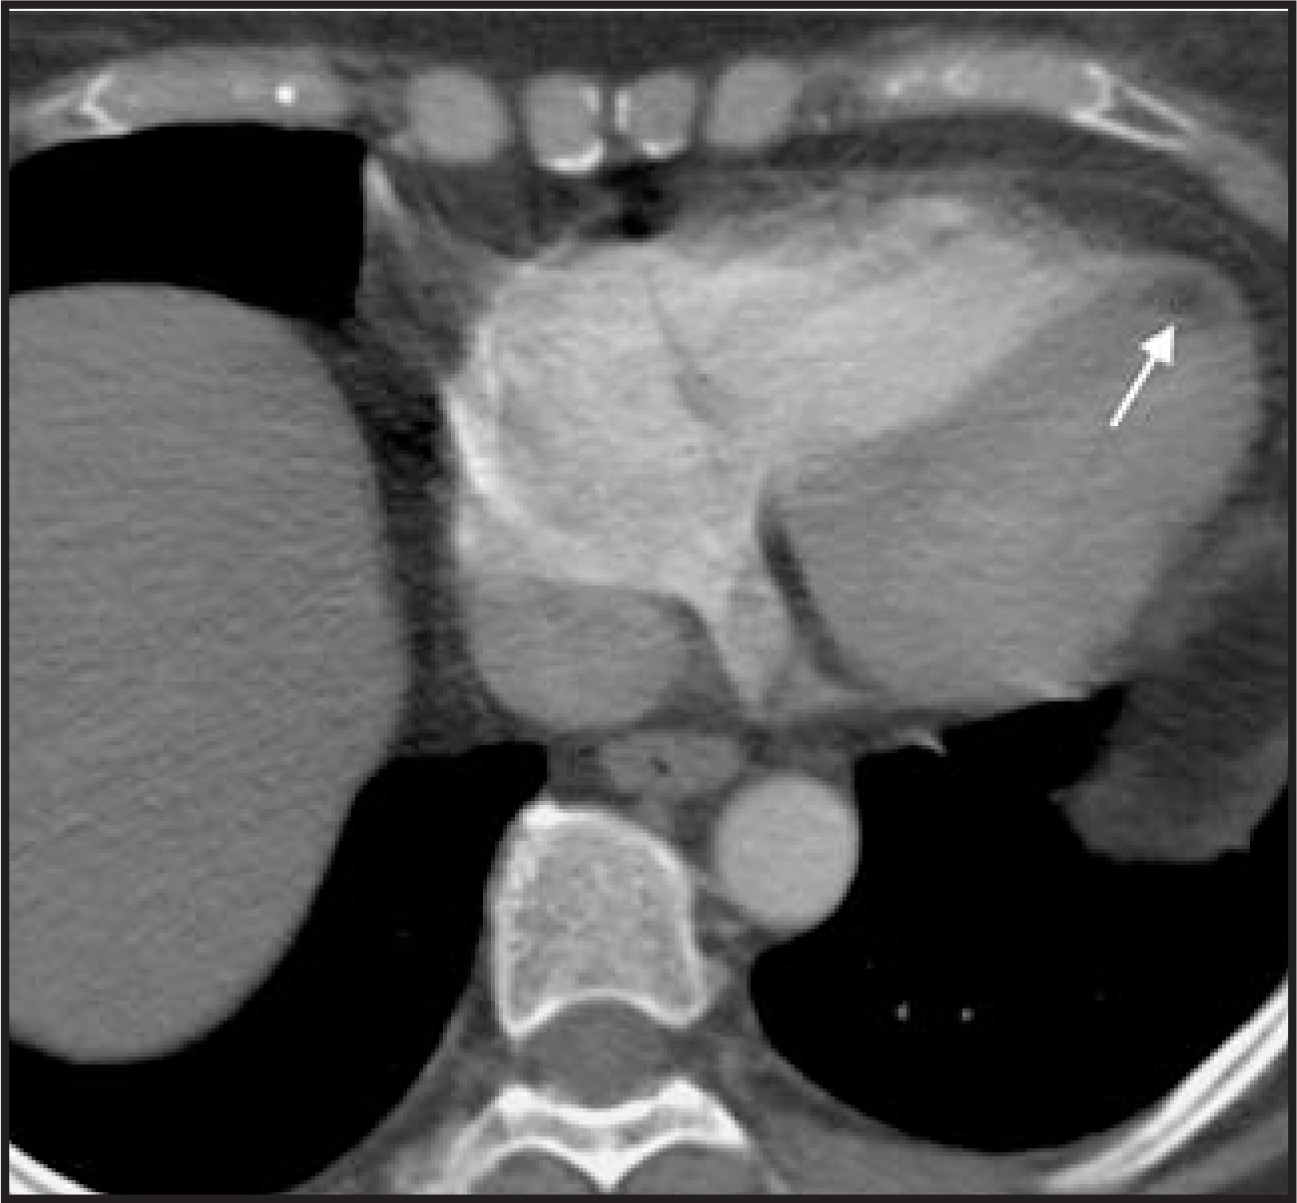
On contrast-enhanced studies, cardiac thrombus can usually be readily identified as a filling defect (Figure 13B) and is sometimes visible as an area of decreased attenuation on noncontrast studies.4 In patients with ischemic heart disease, it is more commonly located in the left ventricle than the right ventricle.4 Thrombus in the apex is sometimes mimicked by fat in the myocardium, another sign of infarction (Figure 15).
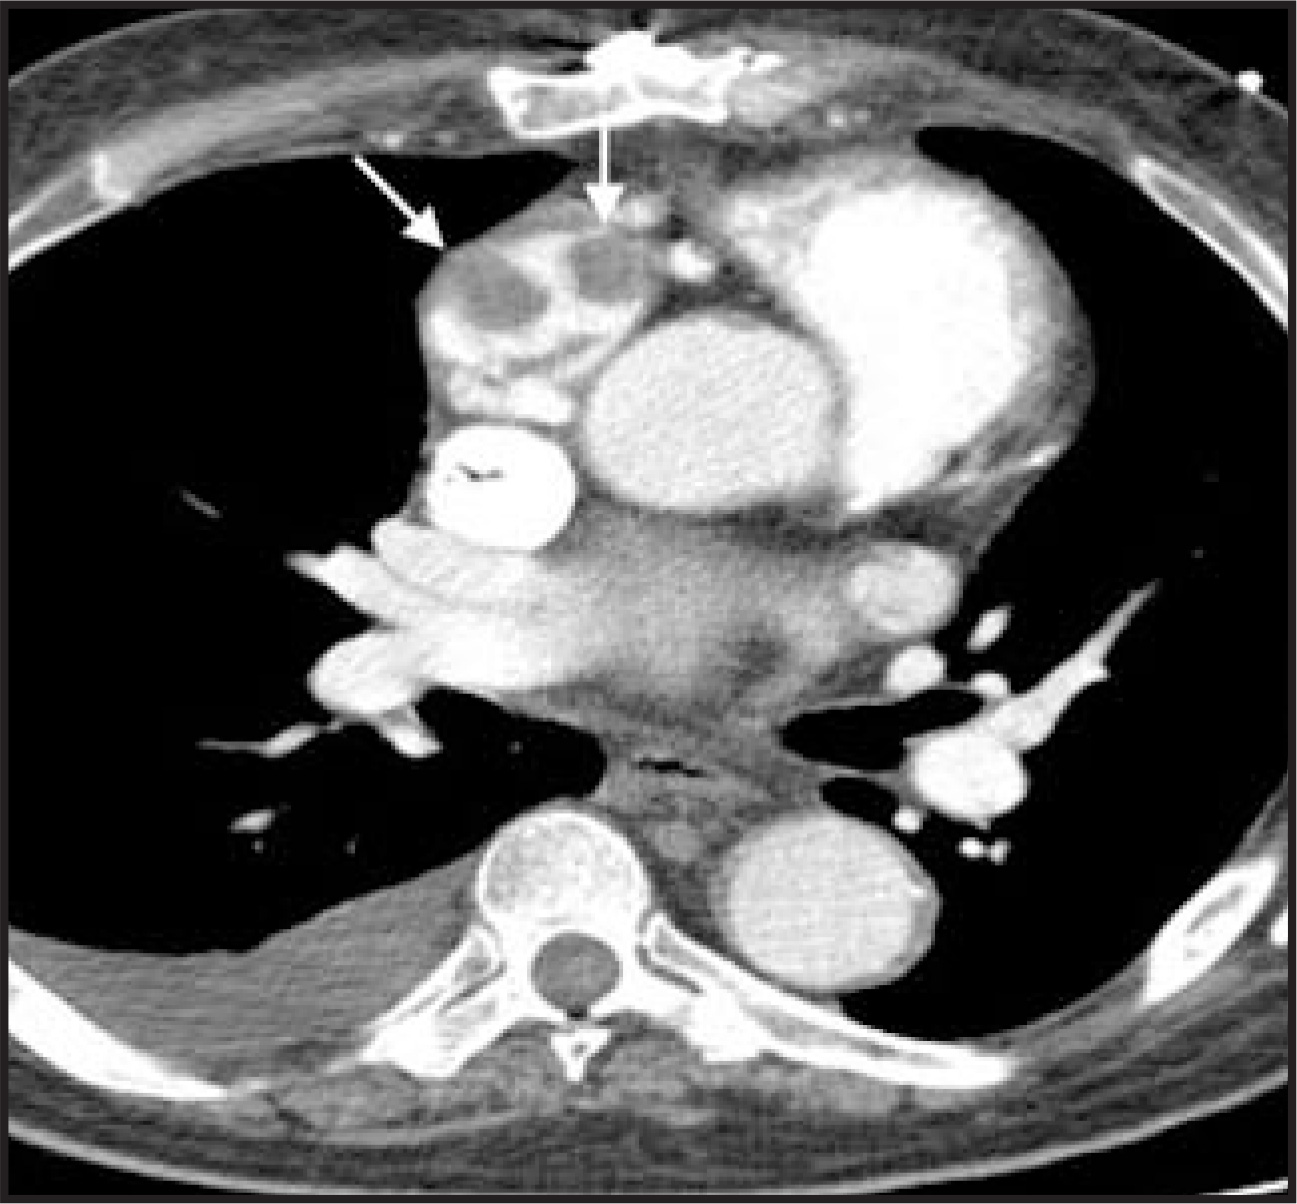
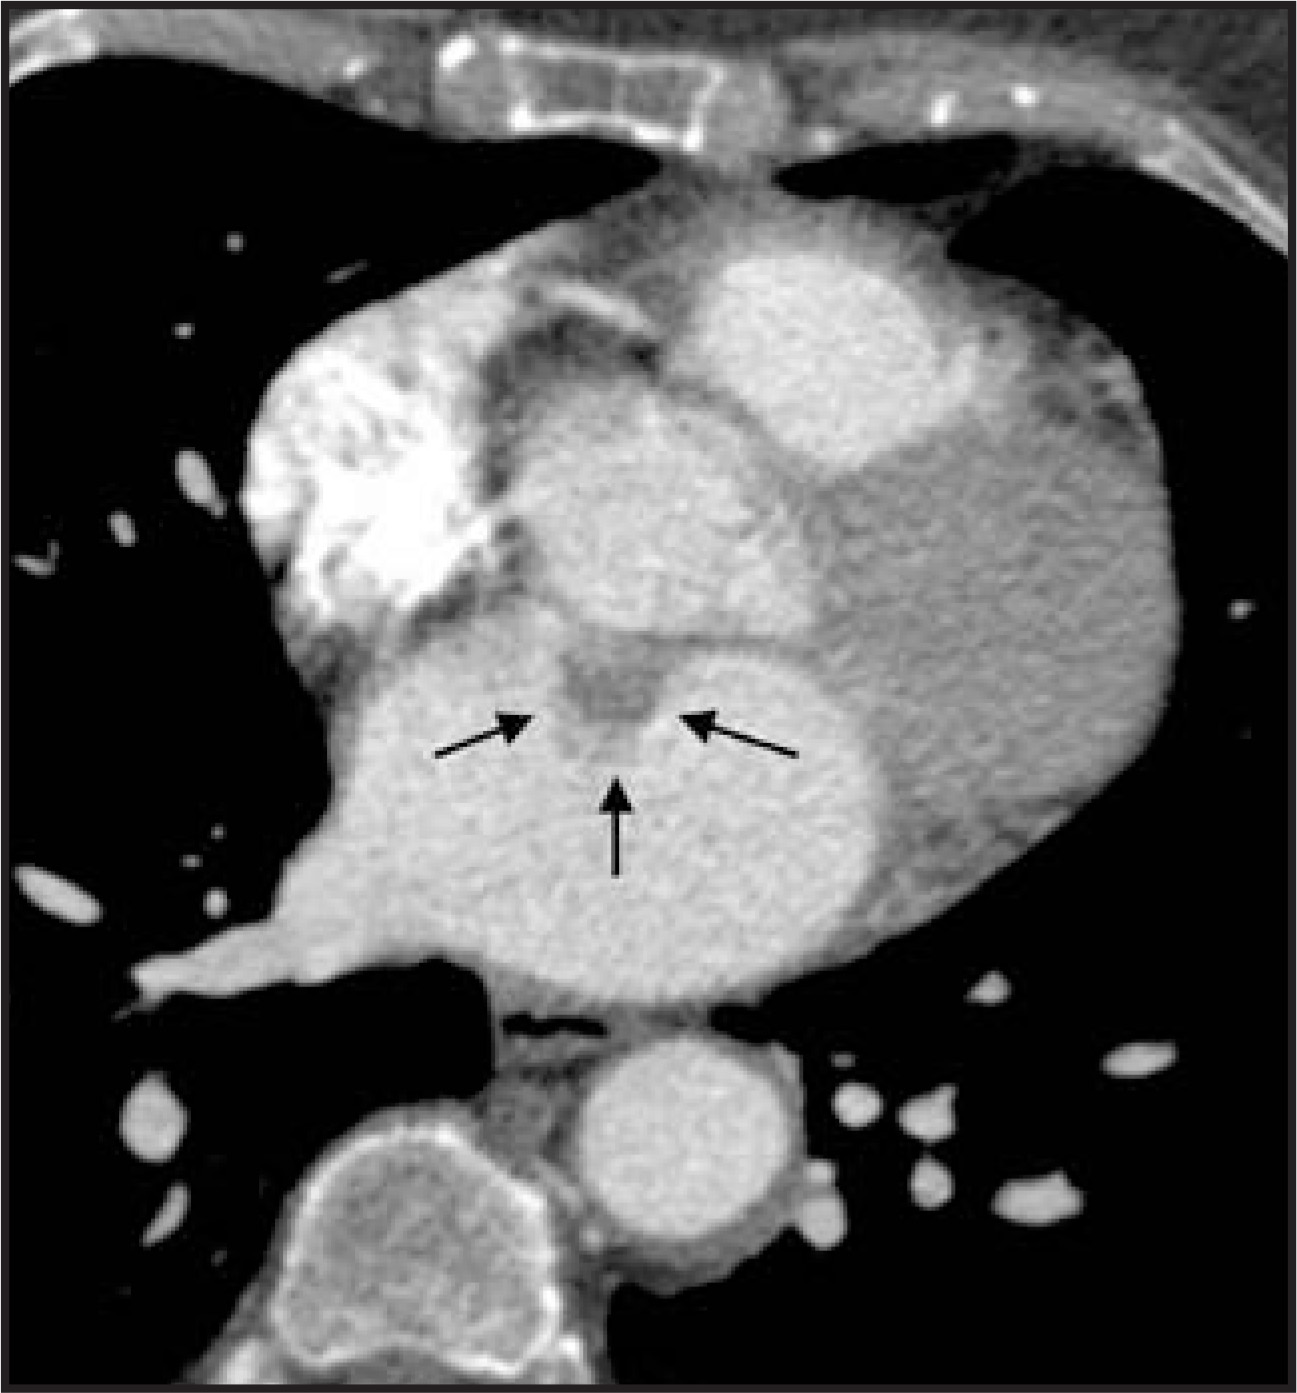
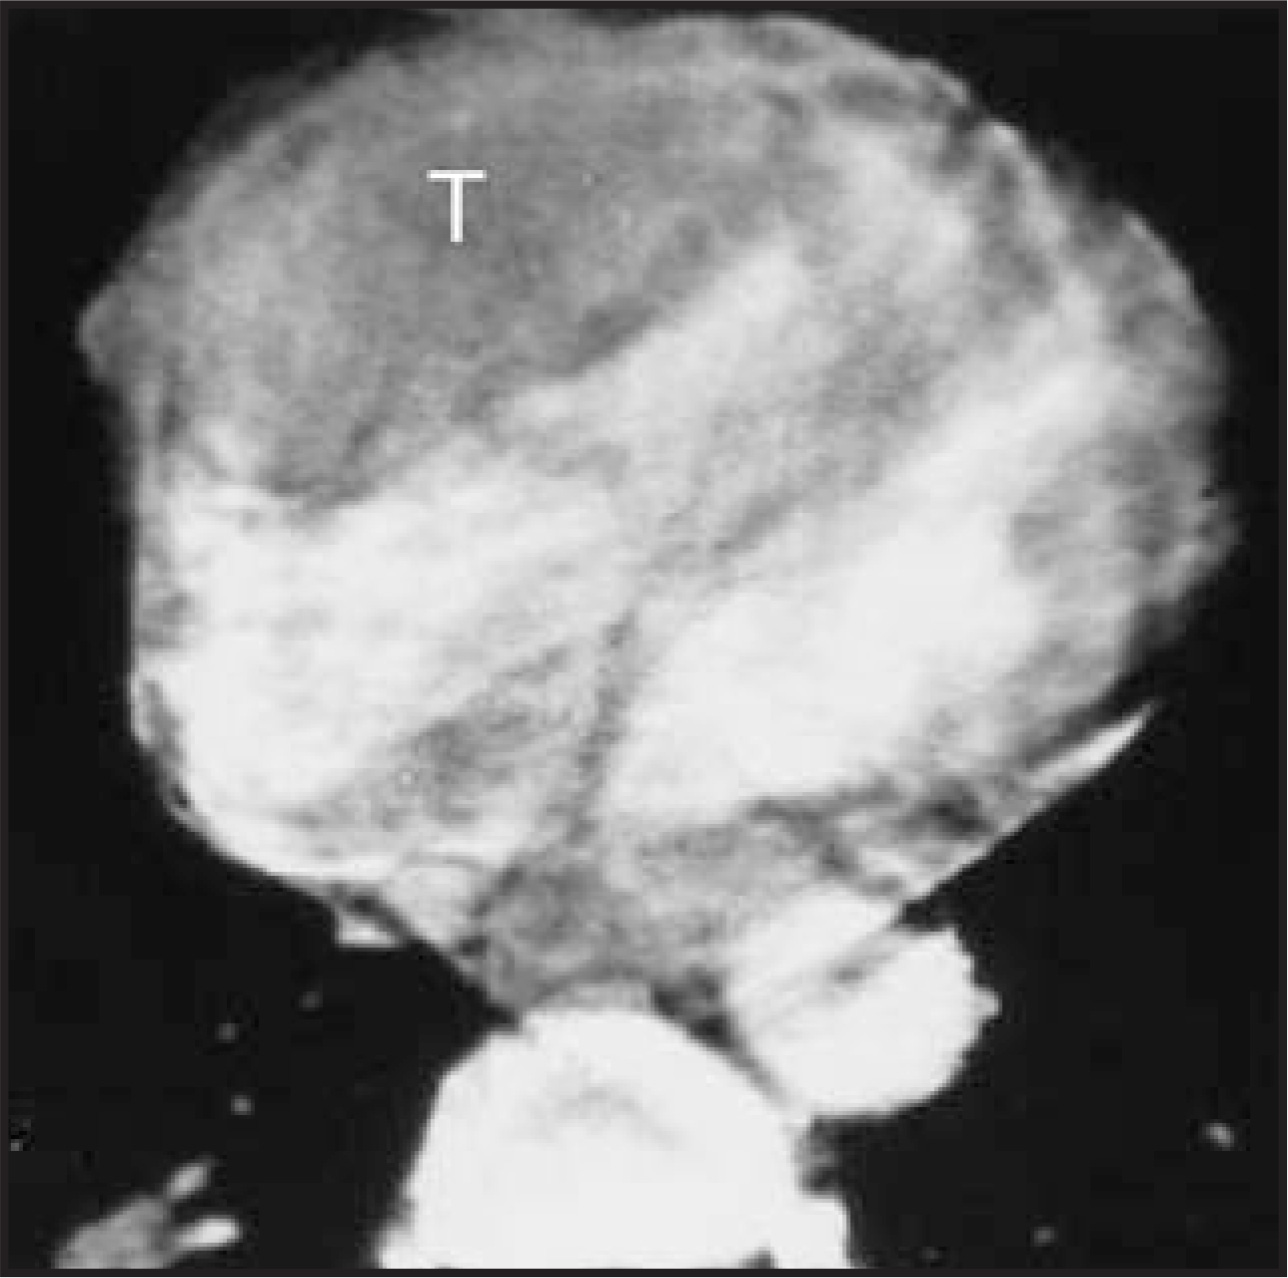
Right ventricular and right atrial clots are usually either a tumor thrombus or a migrated clot from the lower extremities (Figure 16). A left atrial clot may be difficult to distinguish from an atrial tumor. Most atrial clots are plastered against the atrial wall in an enlarged atrium or in the atrial appendage (Figure 17). A filling defect is less likely to be a clot and more likely to be tumor if the atrium is not enlarged (Figure 18).
Cardiac tumors
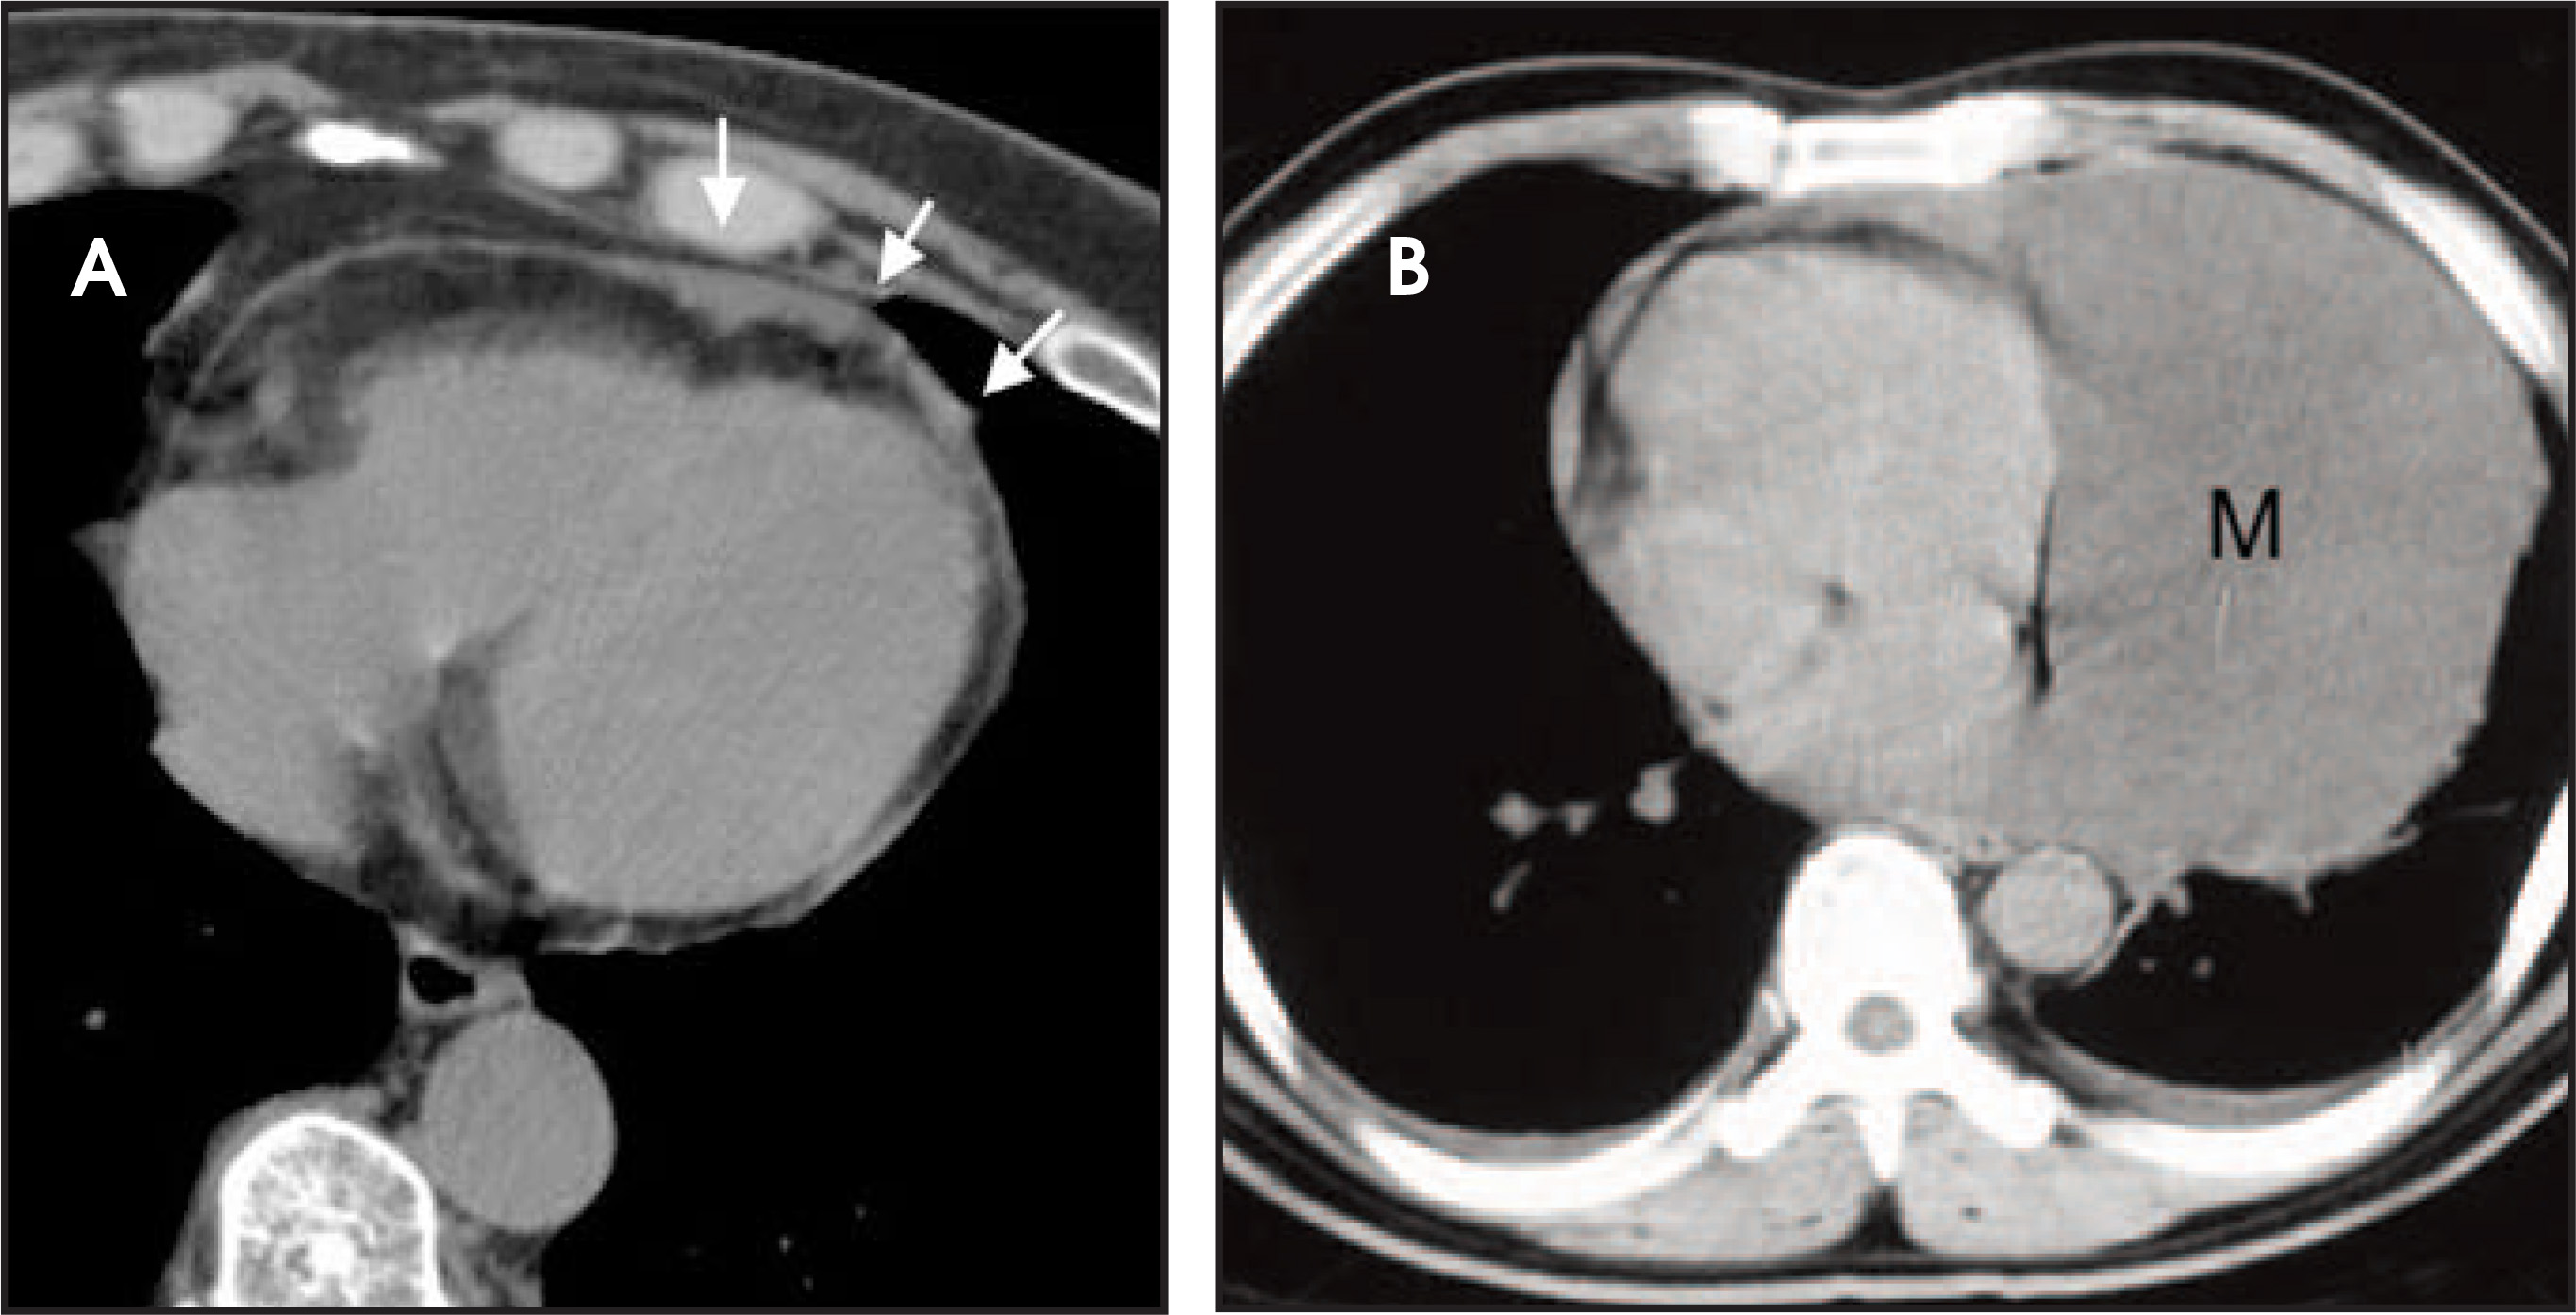
The majority of cardiac tumors are metastases, which are 20 to 40 times more common than primary cardiac tumors.4,10 The visceral pericardium is involved in about 90% of patients who have metastases to the heart (Figure 19). Lung, breast and lymphoma are the most commonly encountered metastases in the heart due to their high prevalence and in the case of lung cancer, its close proximity.8,11 Melanomaand lymphoma have the highest proclivity to metastasize to the heart.4,9,11
Of the primary benign cardiac tumors, myxoma is the most common.4,10 These are intracavitary, are usually located in the left atrium (Figure 18) and are attached to the atrial septum.4 They can occur in any chamber, however, and are sometimes multiple. Rhabdomyoma is a tumor of the myocardial wall (Figure 20) and is associated with tuberous sclerosis.4 Other benign primarycardiac tumors include lipomas, fibromas and elastofibromas.4
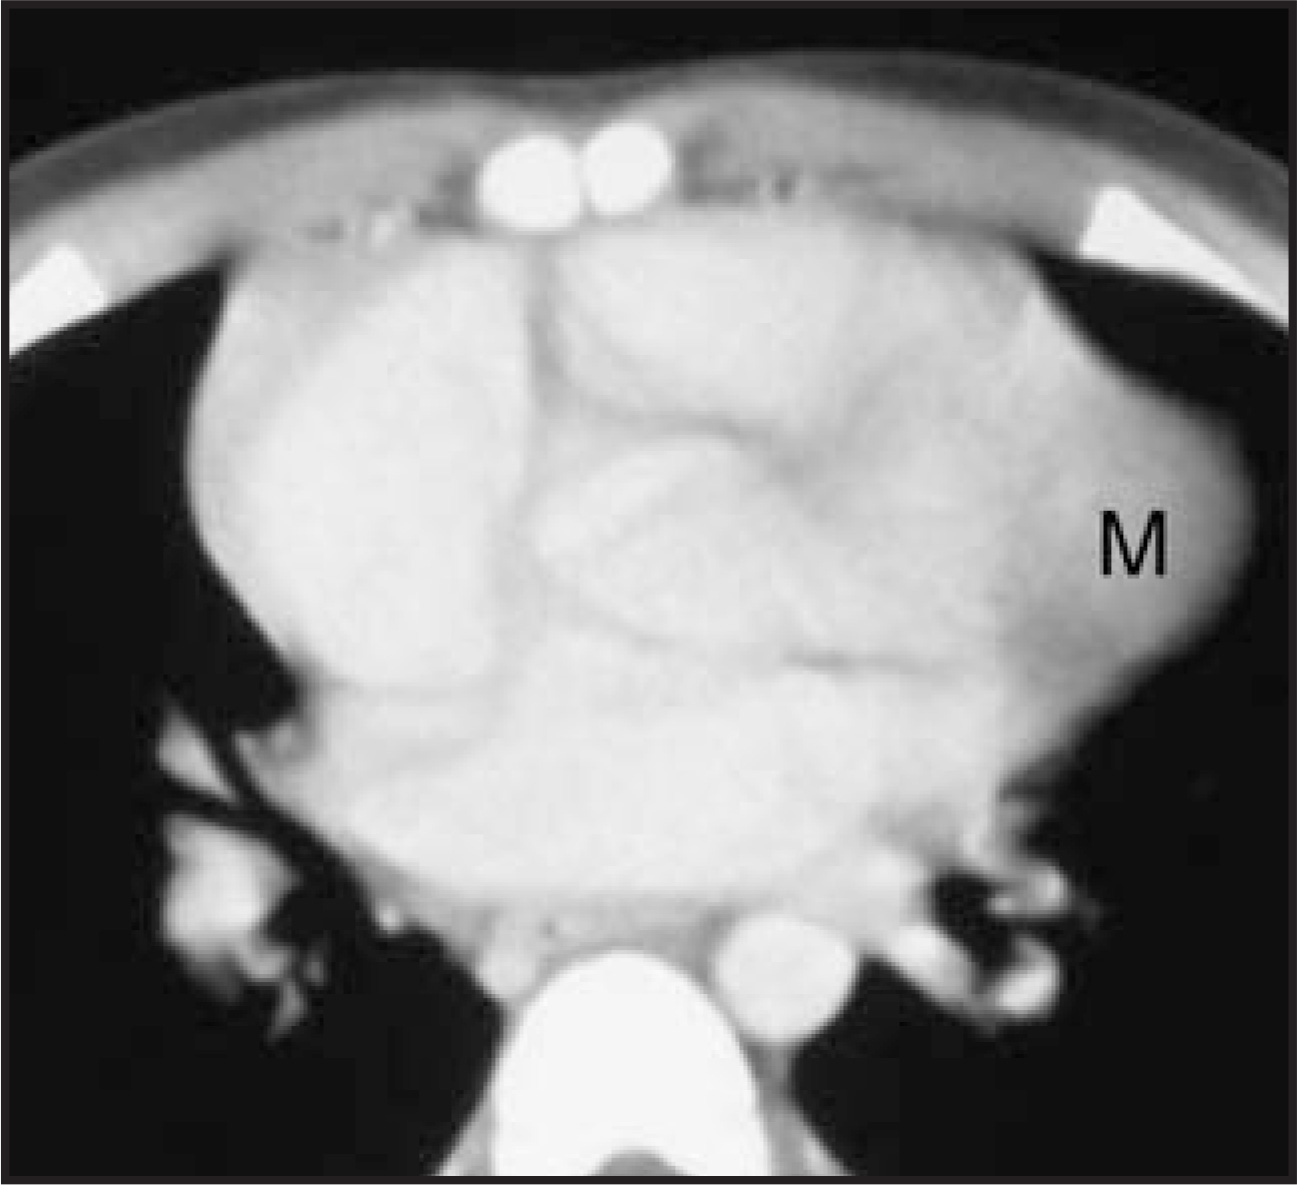
The most common primary malignant tumors are angiosarcoma in adults and rhabdomyosarcoma in children.4,10 These tumors are rare and usually cannot reliably be differentiated from metastases by CT or magnetic resonance imaging (Figure 21).
Pulmonary vascularity
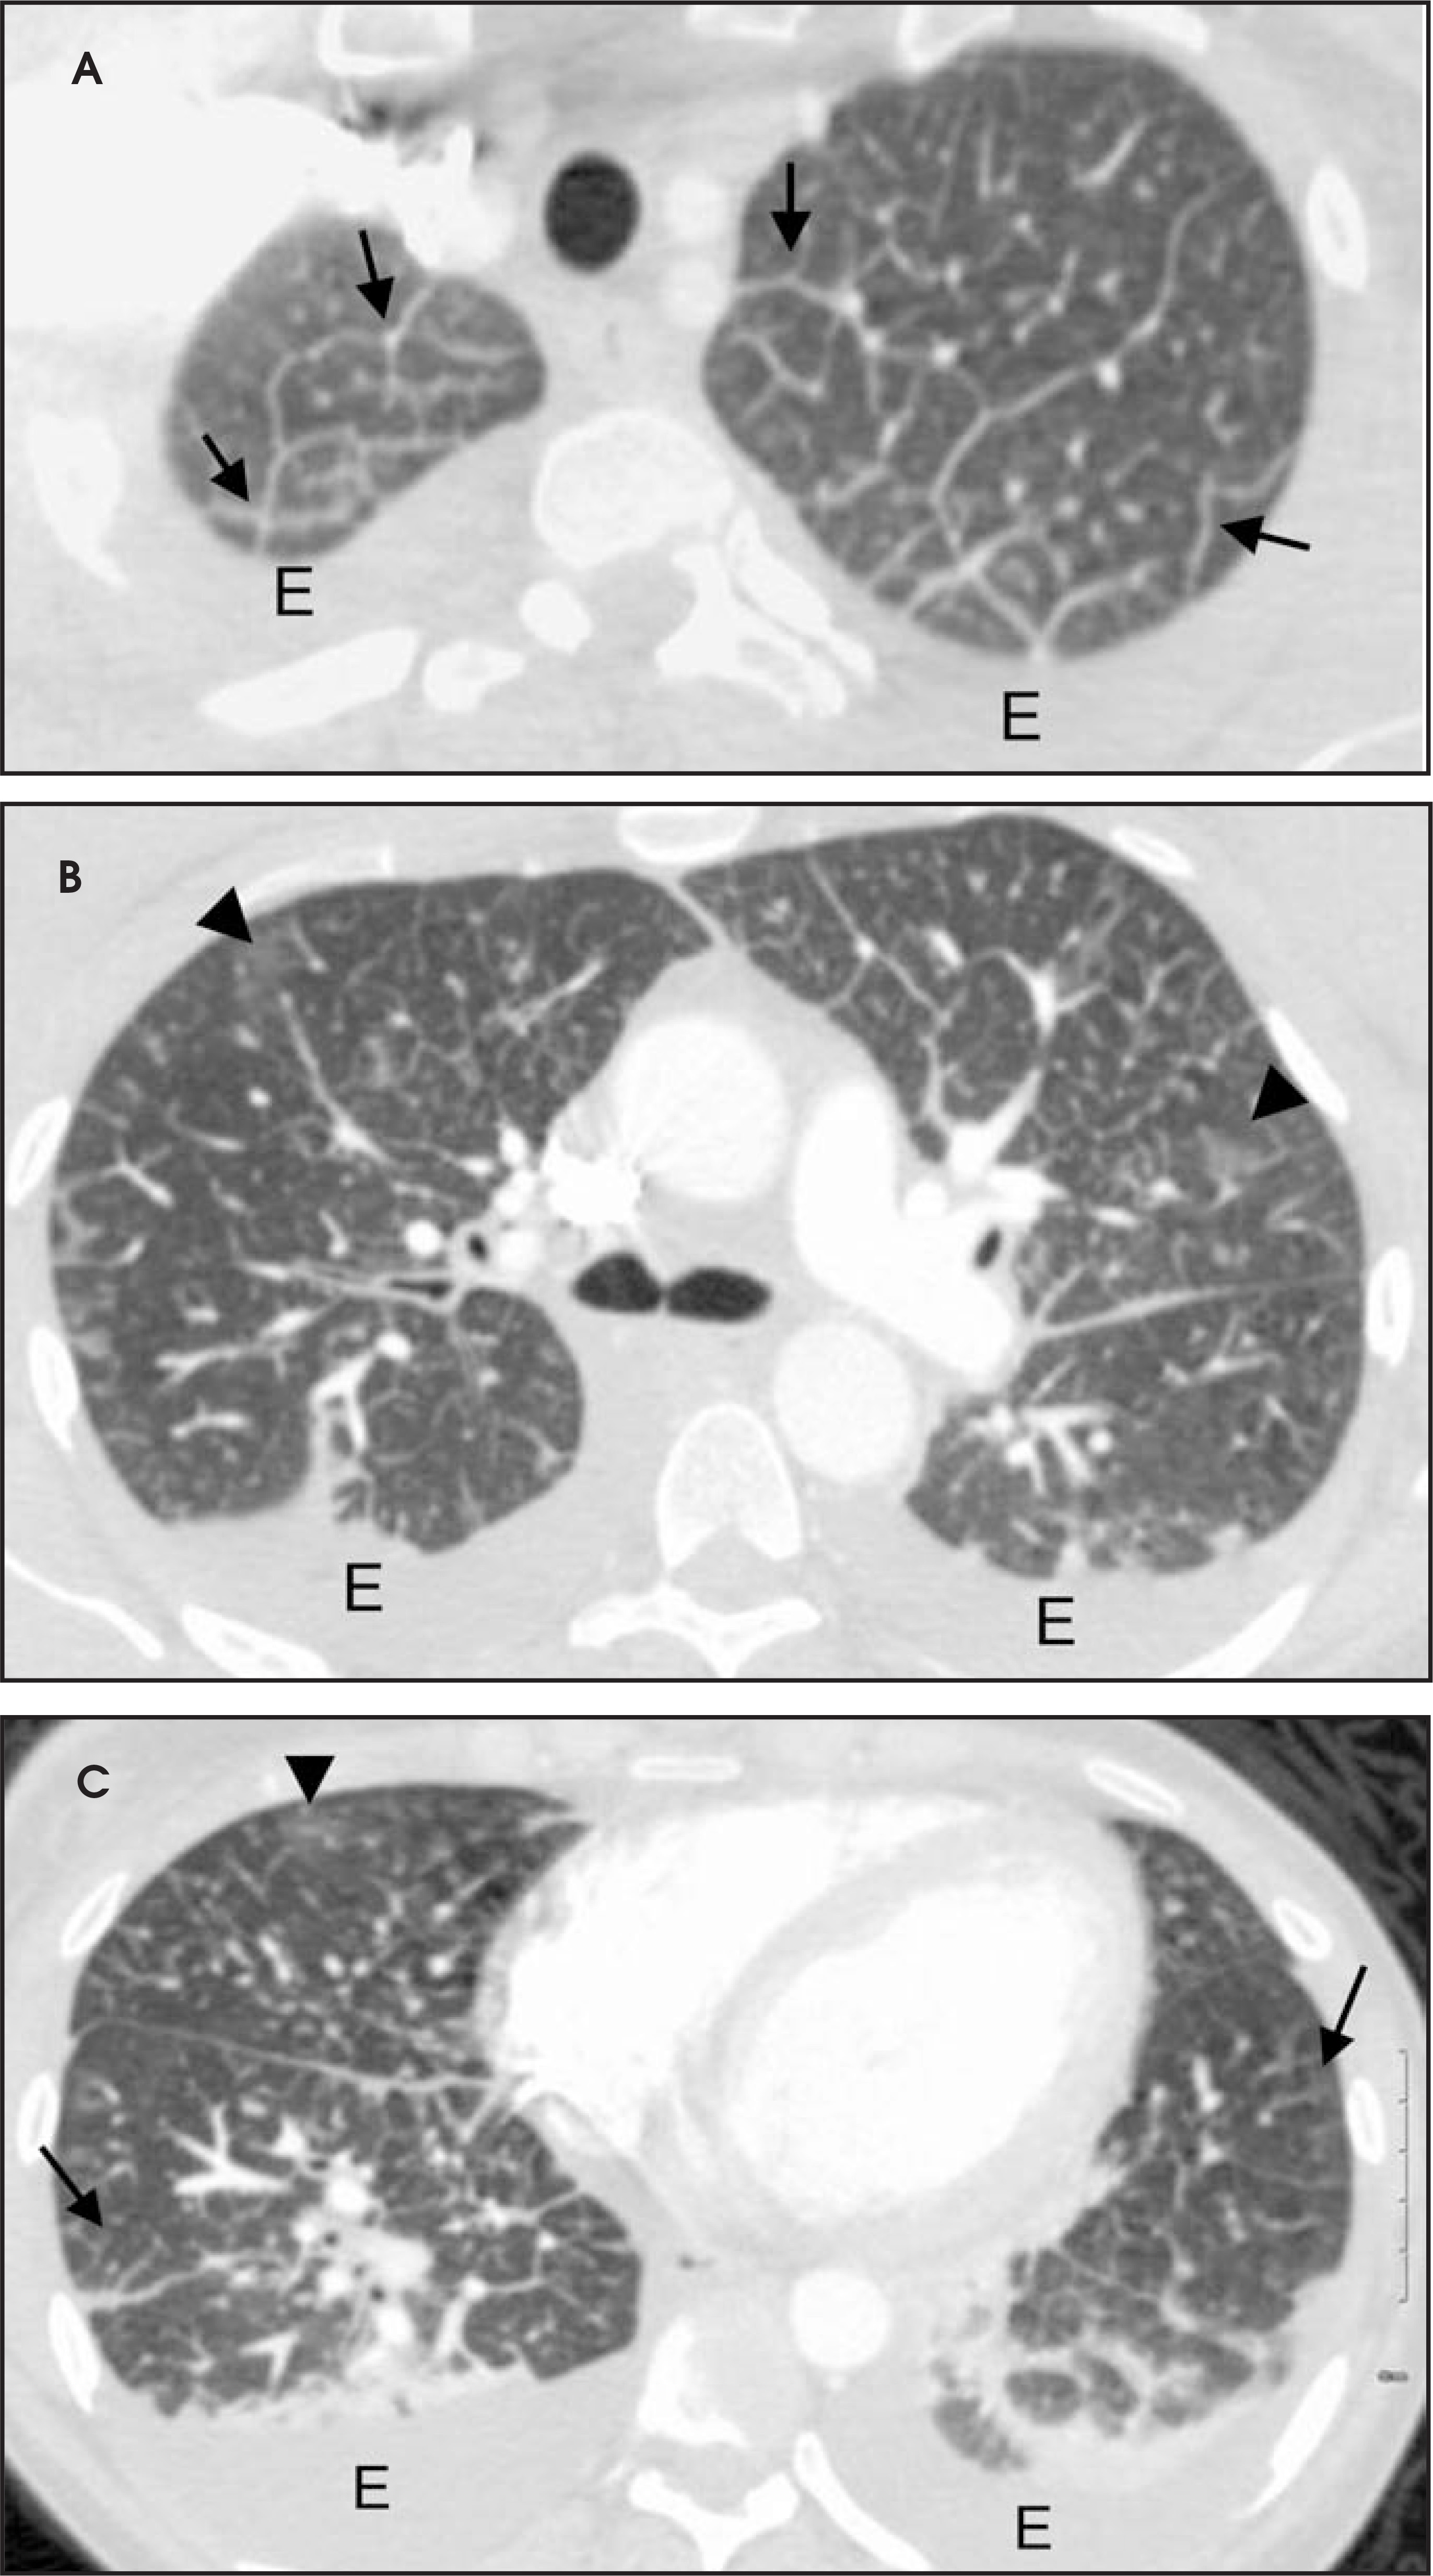
Chest CT can also assess abnormalities in pulmonary vascularity. Clinically pulmonary venous hypertension is diagnosed by an elevated pulmonary capillary wedge pressure greater than 14 mmHg. CT findings include redistribution of pulmonary blood flow to thenondependant lung zones, thickening of the fissures (subpleural edema), ground glass opacities, air space consolidations and pleuraleffusions2,12(Figure 22).
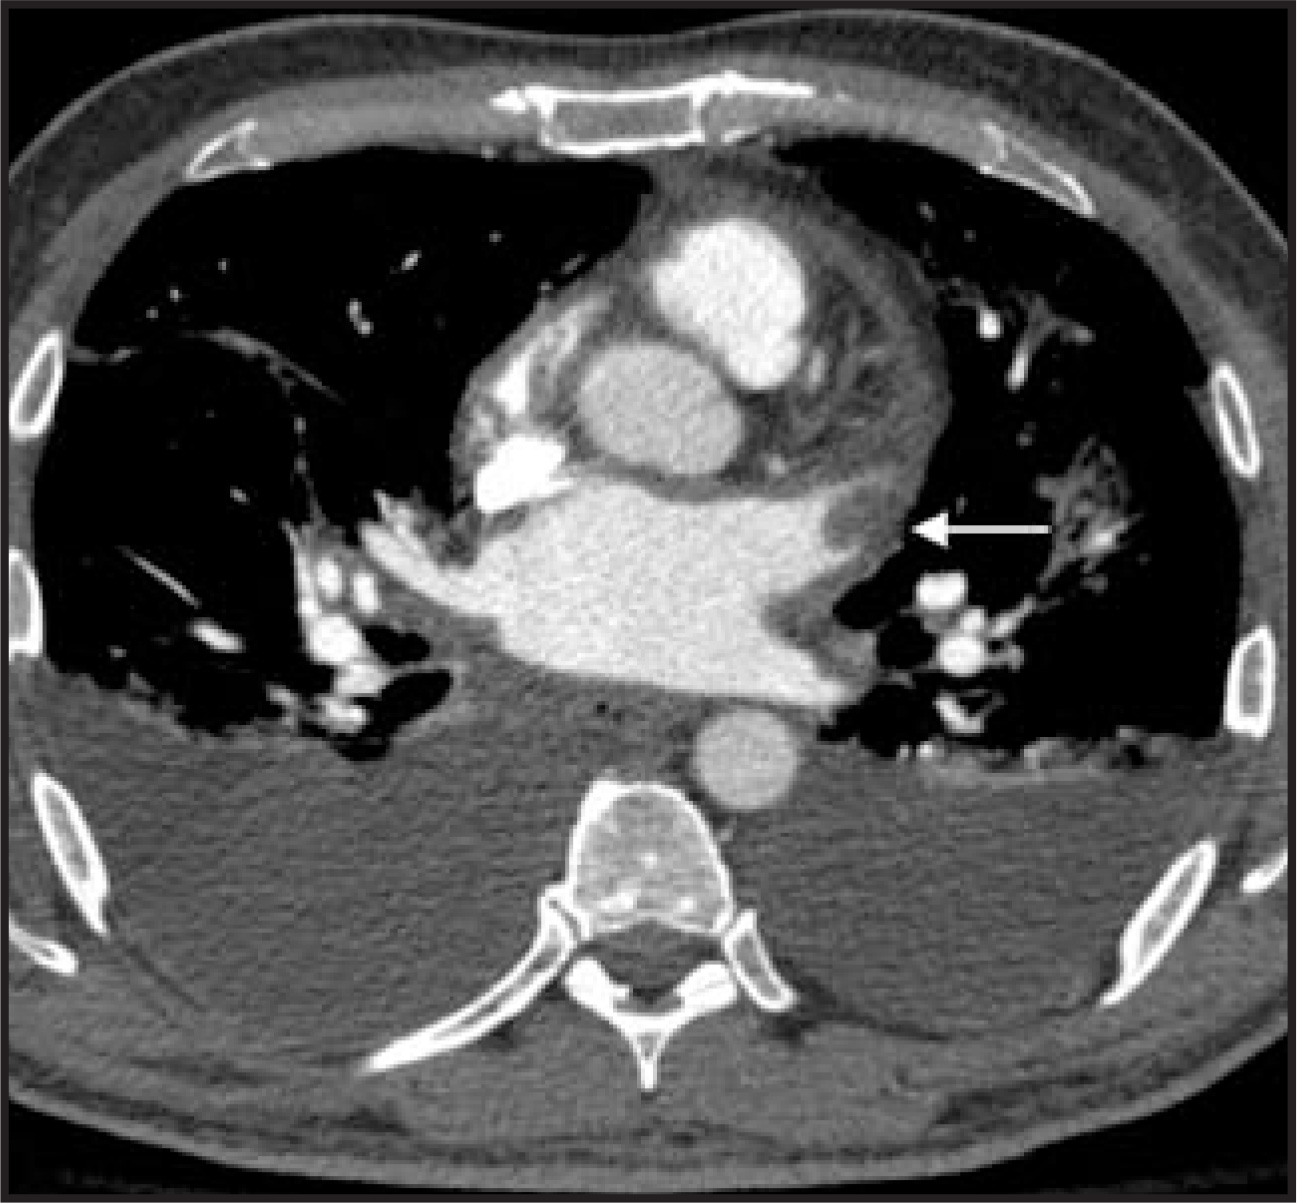
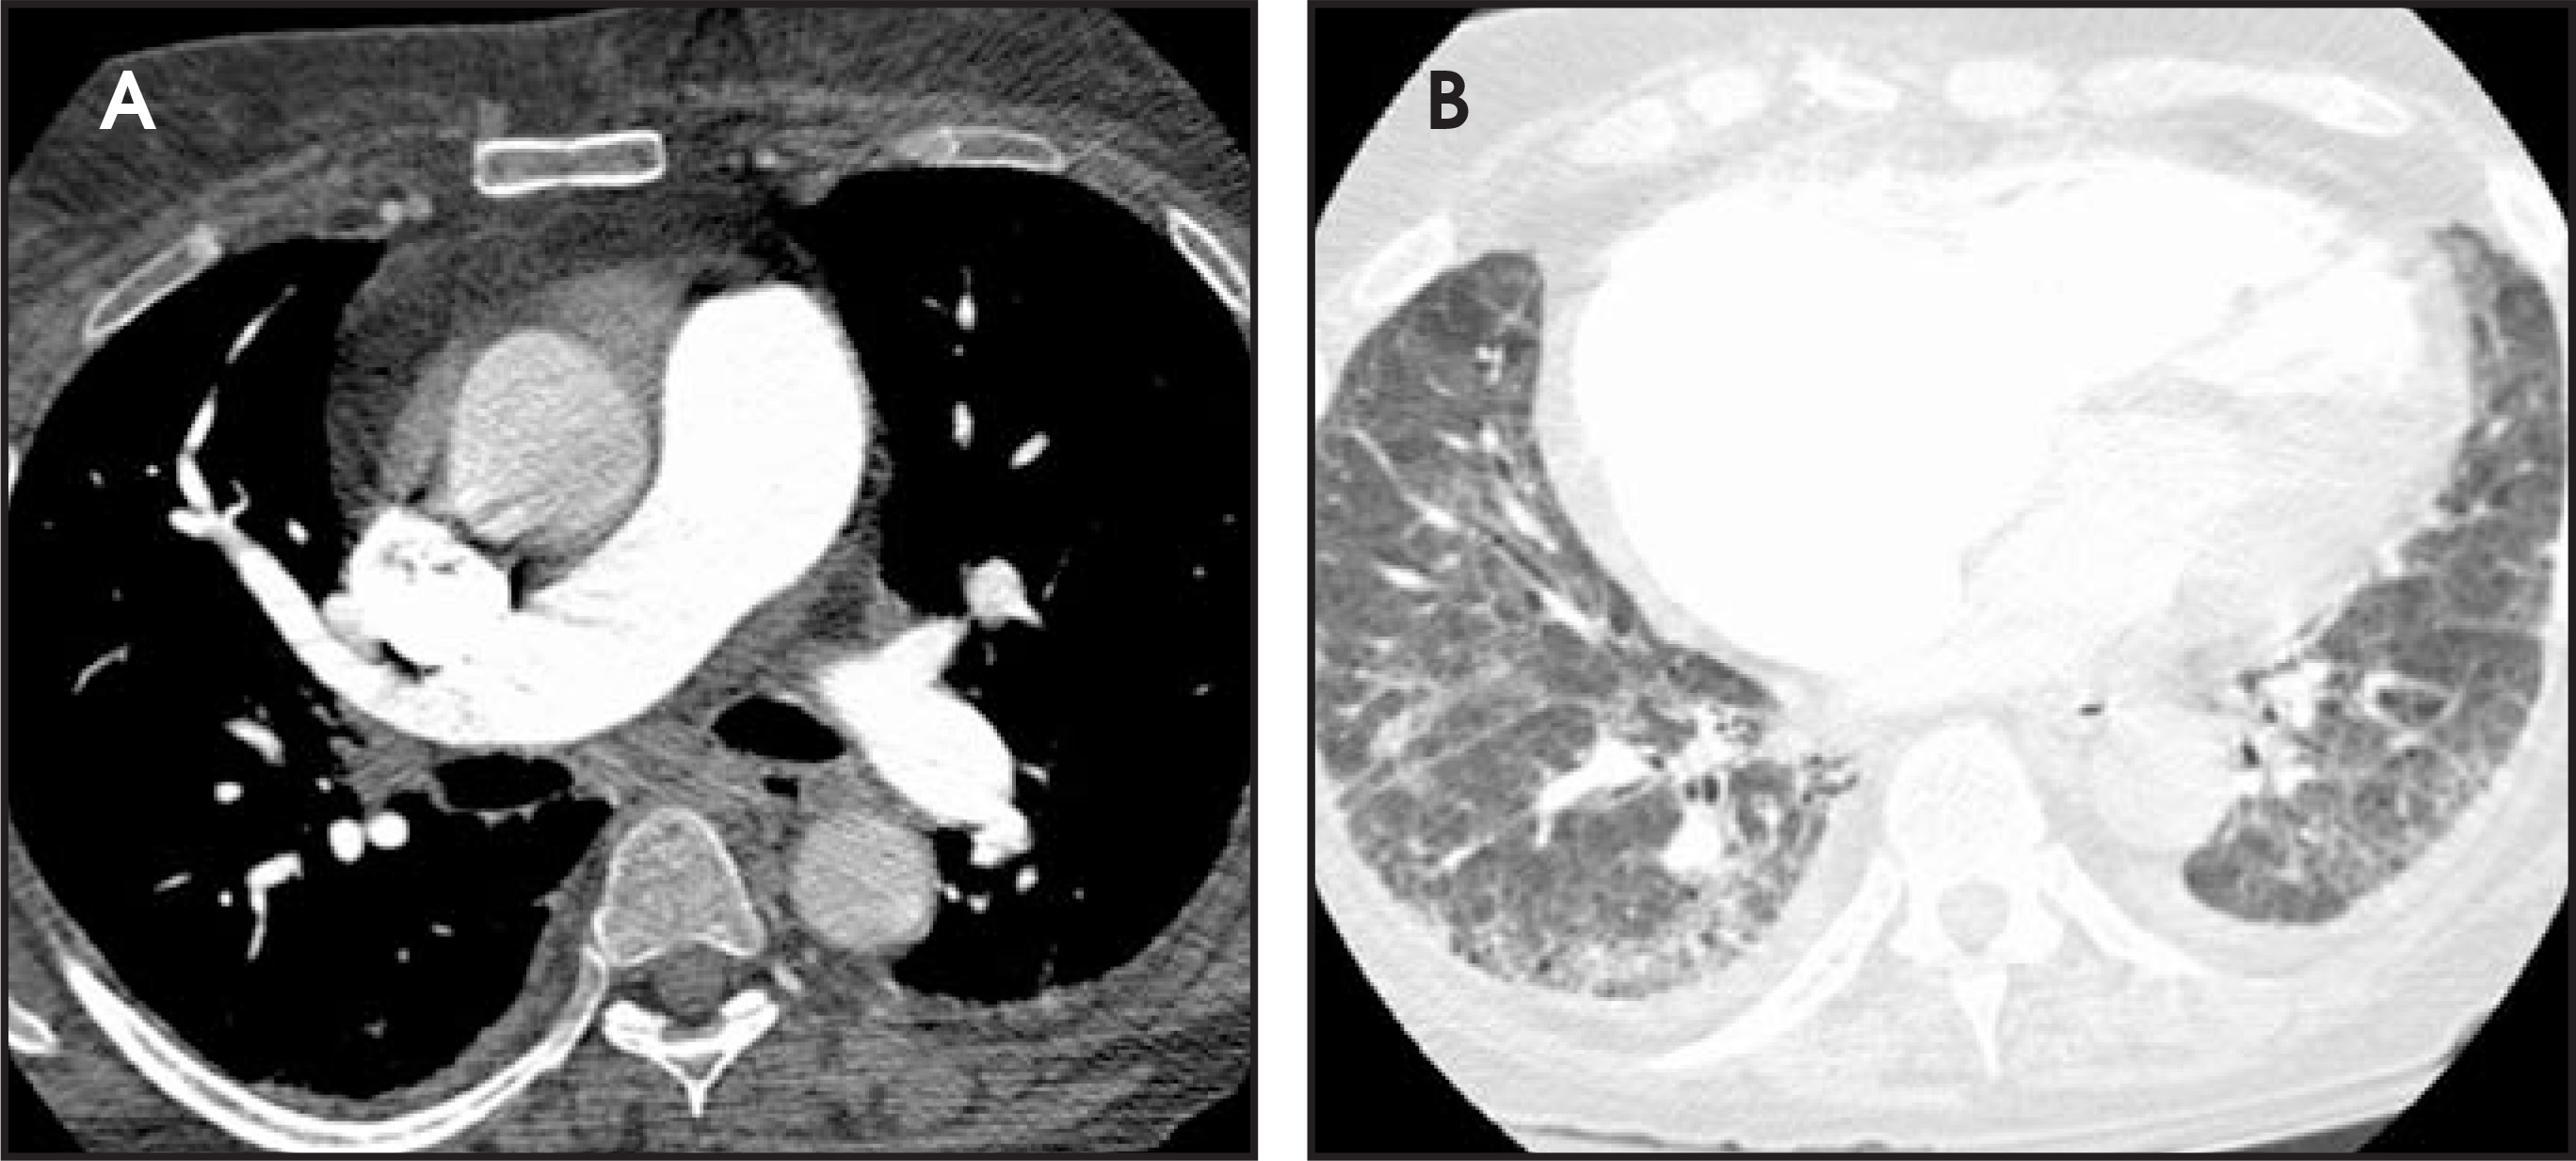
Pulmonary arterial or precapillary pulmonary hypertension is caused by increased pulmonary resistance. The key finding on CT is an enlarged pulmonary trunk with normal to diminished peripheral pulmonary arteries2,12 (Figure 23). For patients younger than 50, apulmonary trunk to aortic ratio >1 is a reliable indicator of precapillary hypertension in patients without overcirculation.13 For patients older than 50, because the aorta dilates, this is less reliable and using a measurement of the pulmonary artery short axis >3.5cm is a better indicator.13 These criteria are fairly specific but they have only moderate sensitivity.
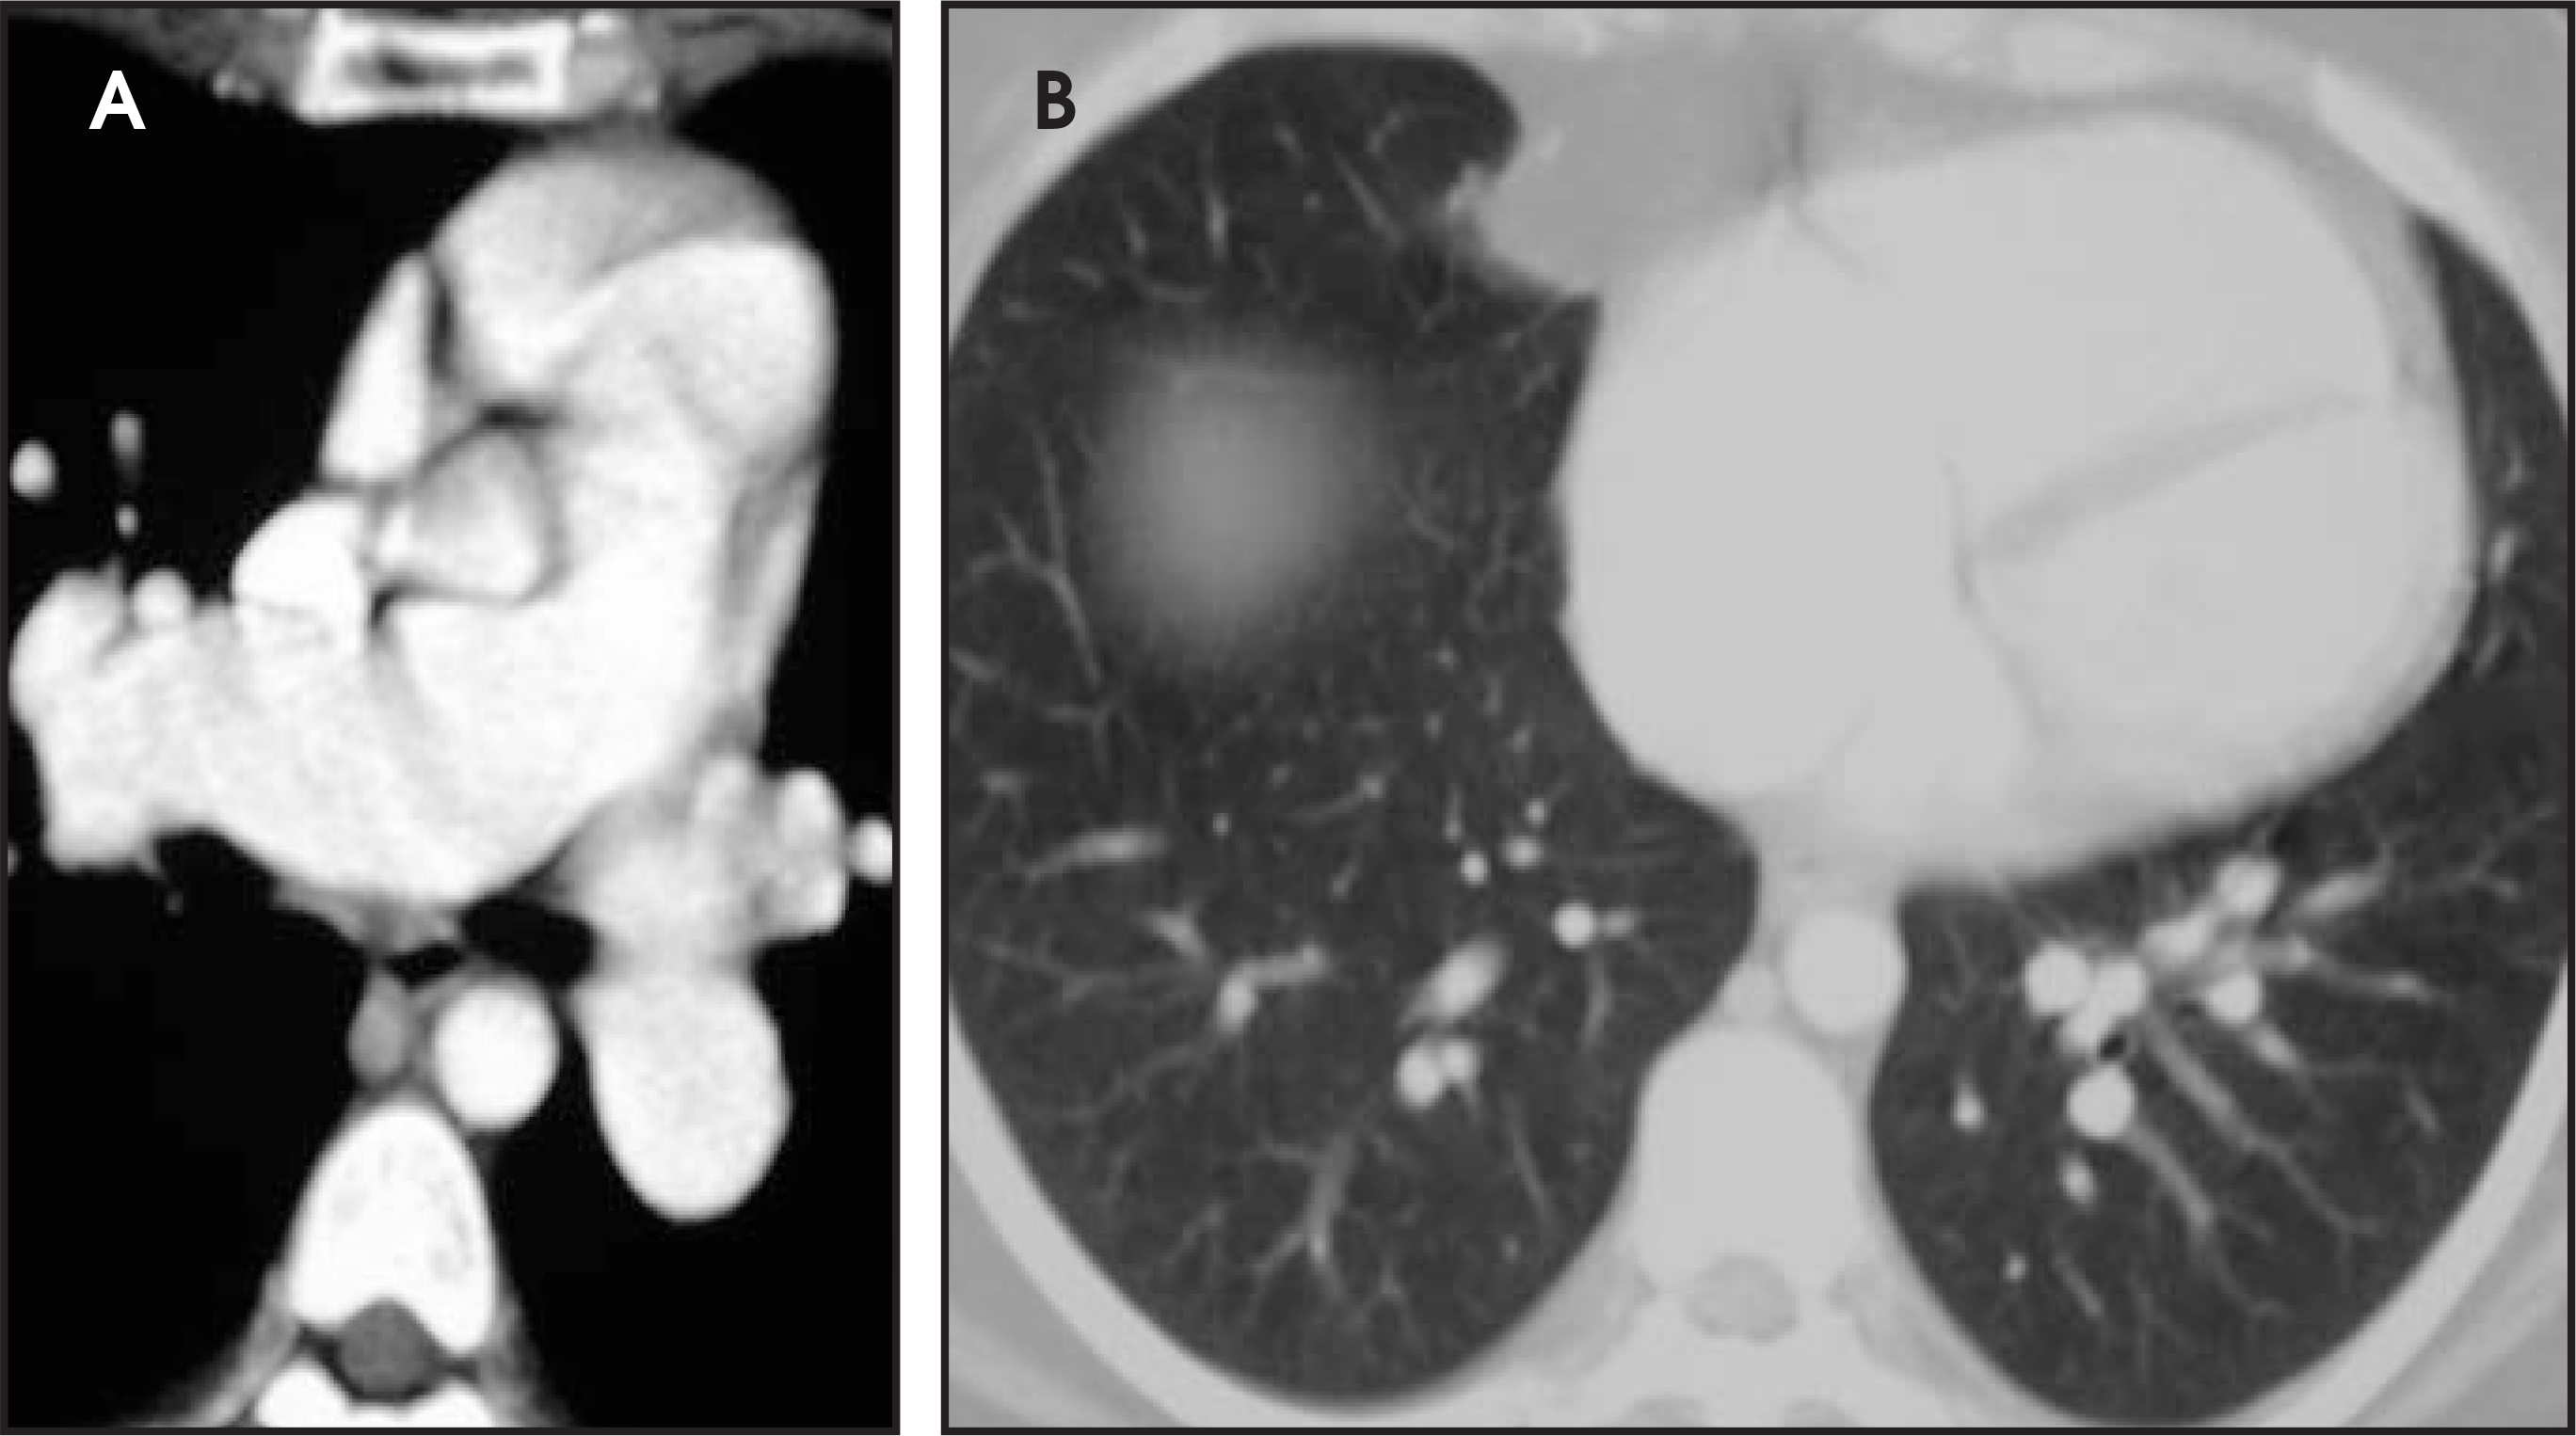
In contrast to pulmonary arterial hypertension, all of the pulmonary vessels are enlarged in pulmonary overcirculation.14 The two main diseases causing pulmonary overcirculation are left-to-right shunts and chronic systemic volume overload.14 In the former case, either anatrial septal defect (Figure 24) or partial anomalous pulmonary venous return is the most likely cause in an adult. Severe, chronic anemia and pregnancy can also give the appearance of pulmonary overcirculation.
The postoperative heart
Detecting signs of prior cardiac surgery on a chest CT is usually simple due to the presence of synthetic material and sternotomy wires.15 More detailed interpretation of postoperative findings can be challenging without prior knowledge and experience. Following a few basic principles, any radiologist will be able to analyze the common postoperative findings from prior coronary artery bypass grafts or valve repair.
Coronary artery bypass grafts
The origins of common coronary artery grafts can usually be readily identified. A vein graft to the left anterior descending (LAD) usually originates from the anterior aorta several centimeters above the aortic valve16,17 (Figure 25A). A graft to an obtuse marginal branch of the left circumflex usually arises from the anterior aorta slightly above the origin of the LAD graft (Figure 25B).
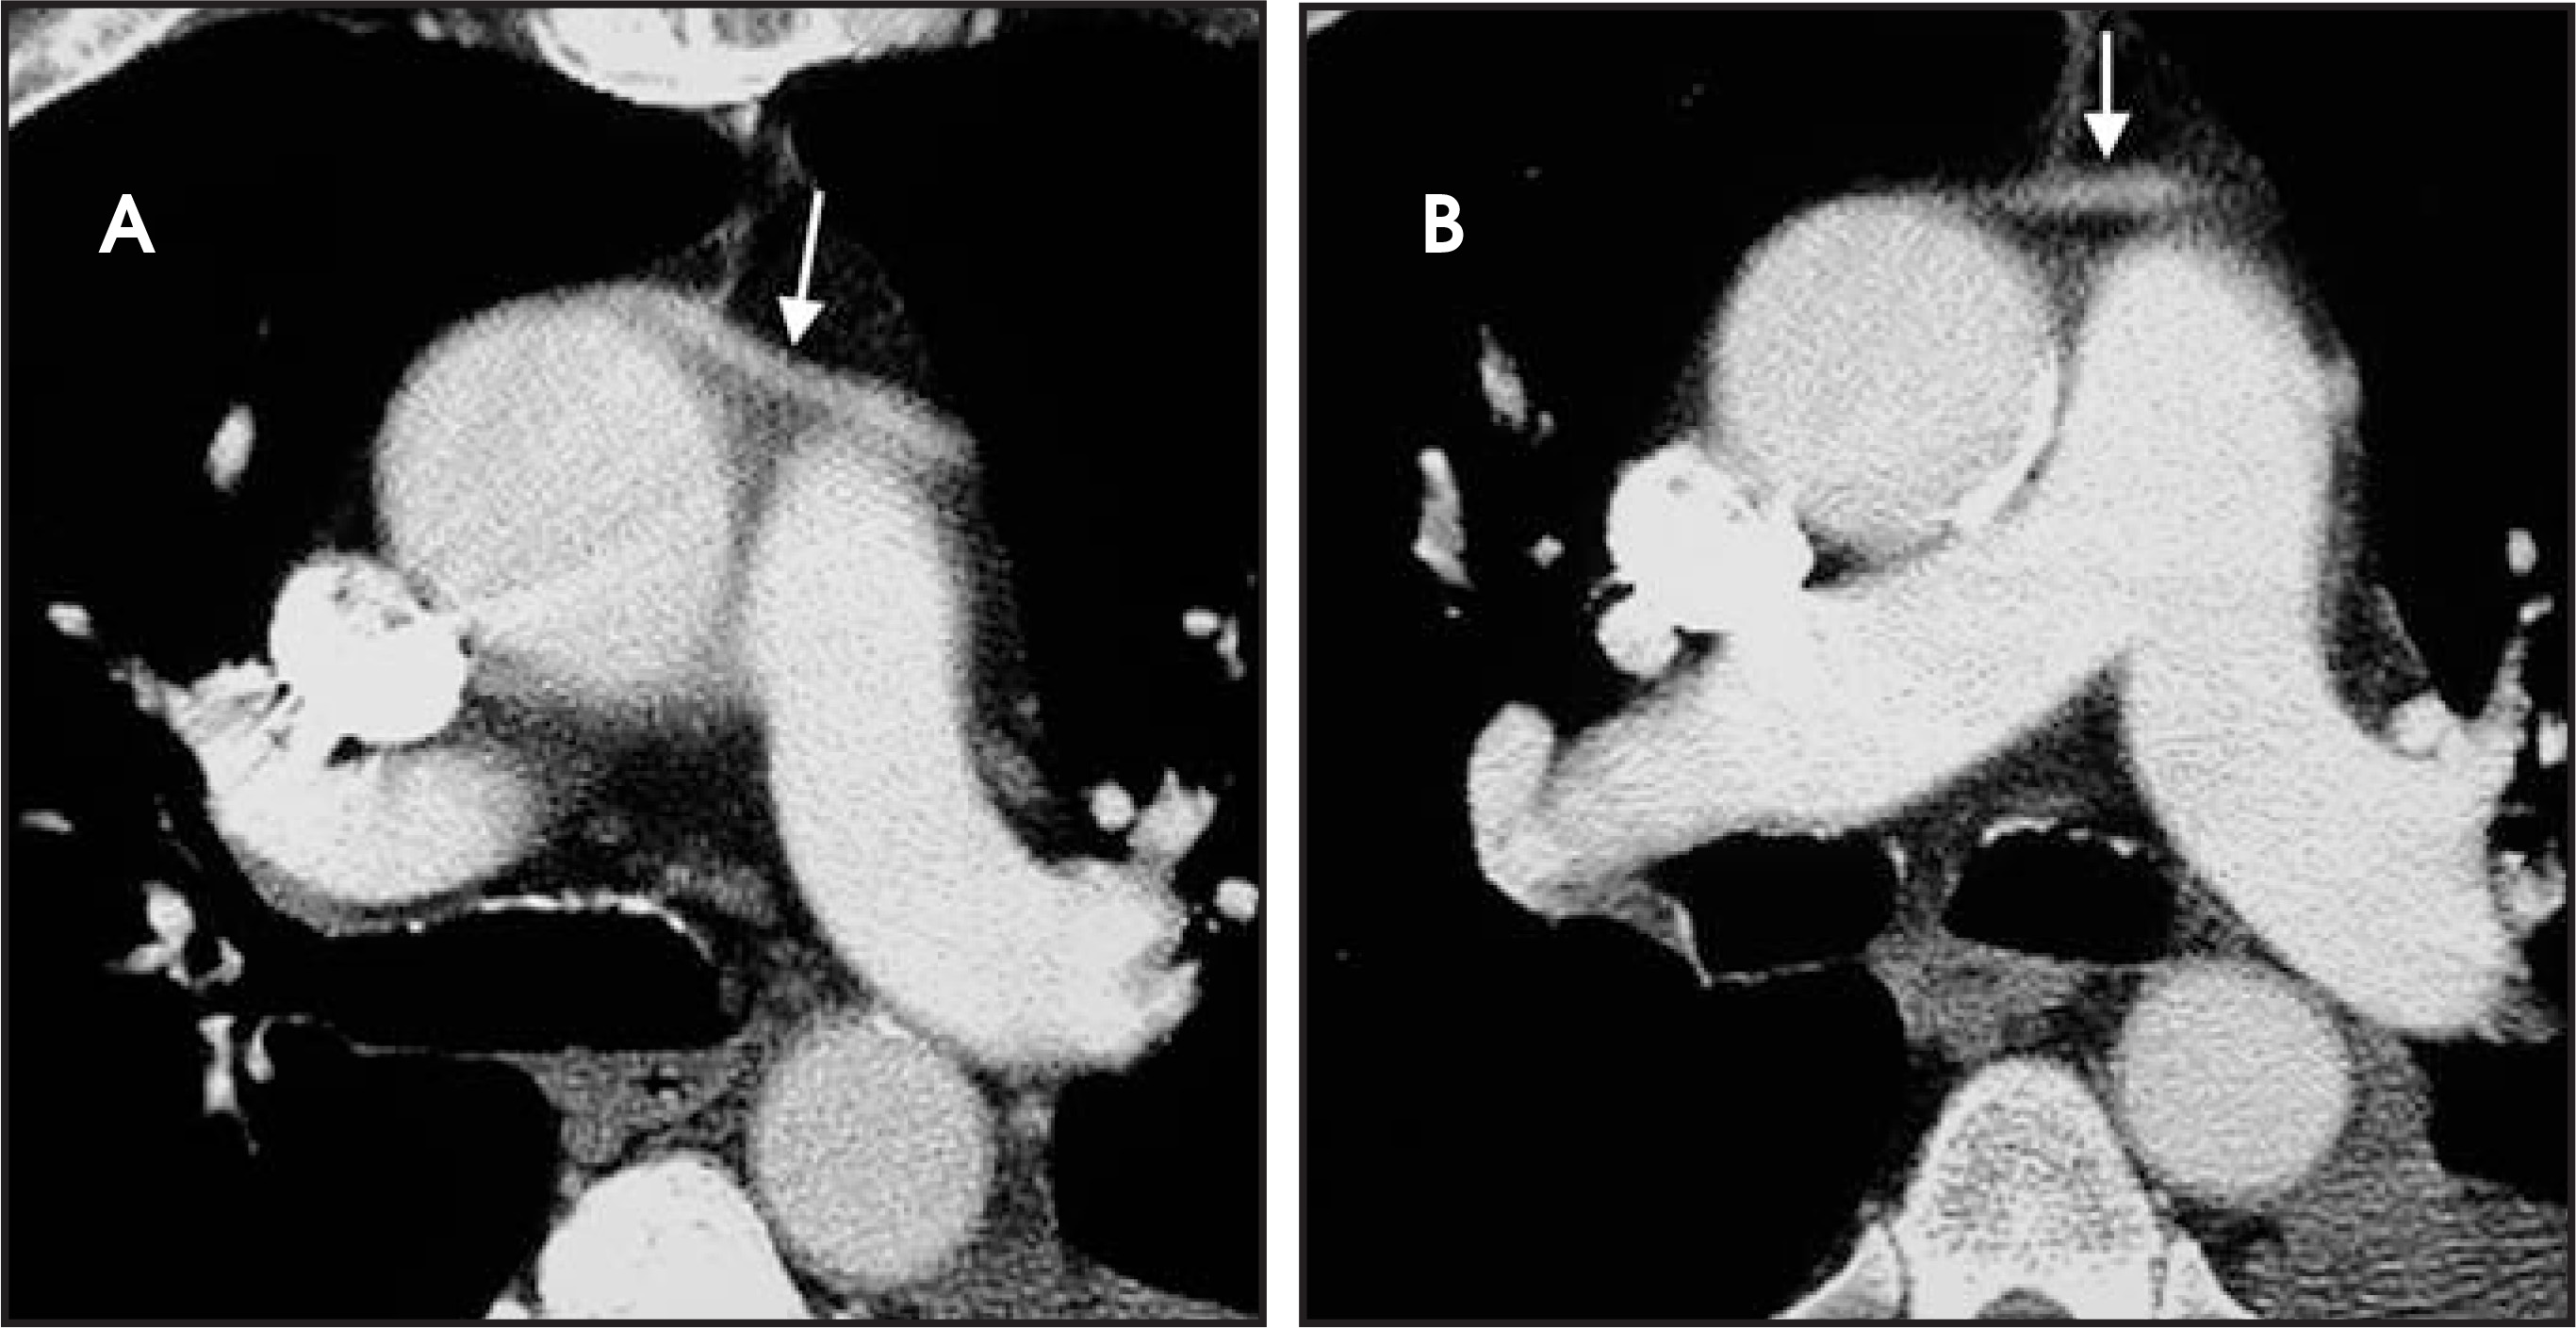
Right coronary artery grafts usually arise just above the sinus of the Valsalva and course to the right side of the heart. A left internal mammary graft to the left anterior descending is usually visible in the anterior mediastinal fat (Figure 26) and is frequently accompanied by multiple surgical clips.16,17 Visible contrast within a graft indicates patency, but does not guarantee a lack of stenosis.17
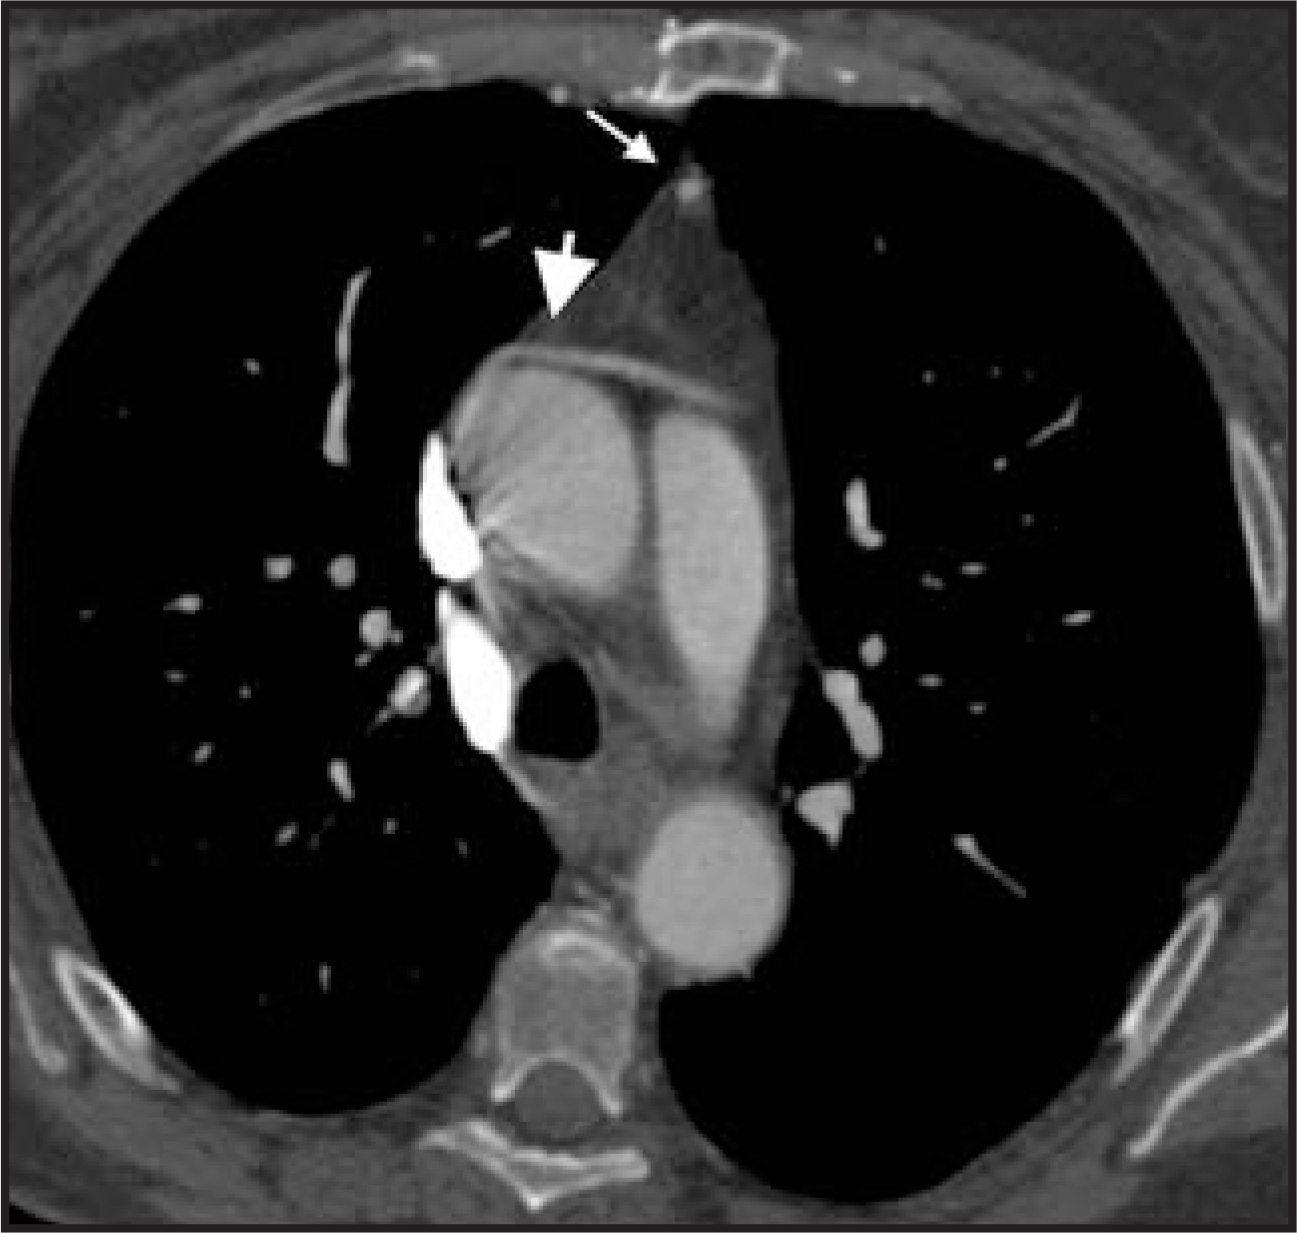
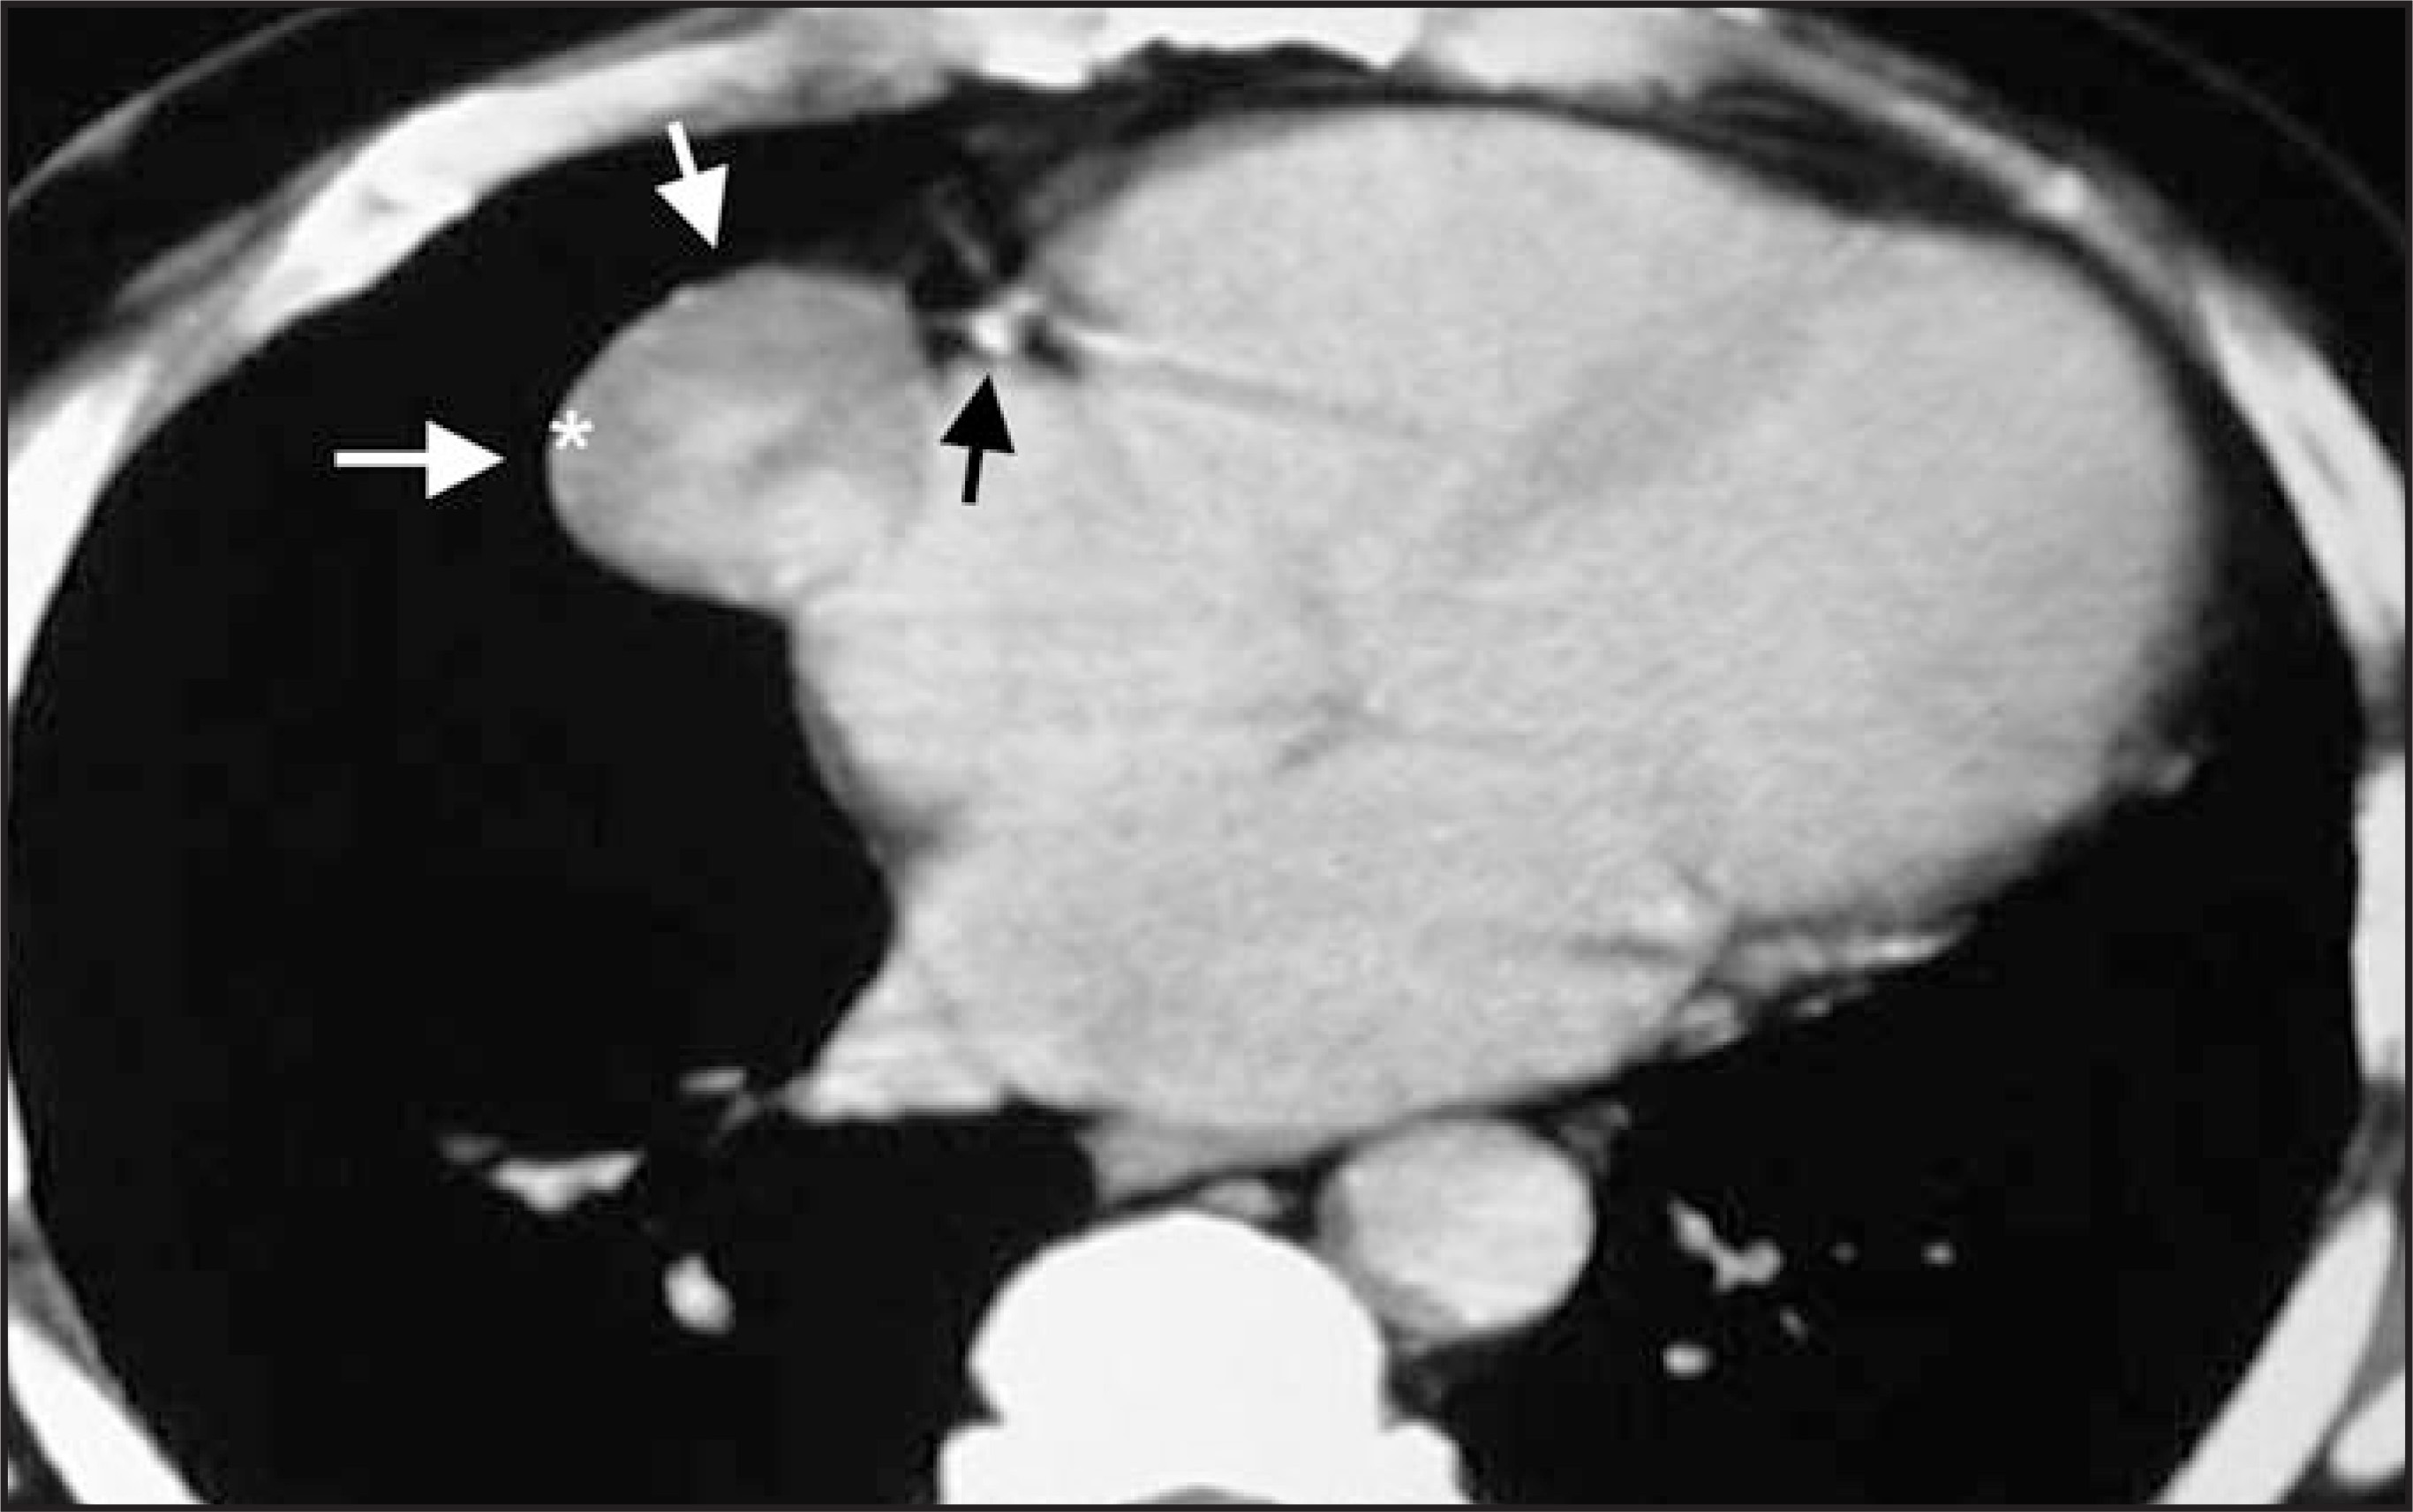
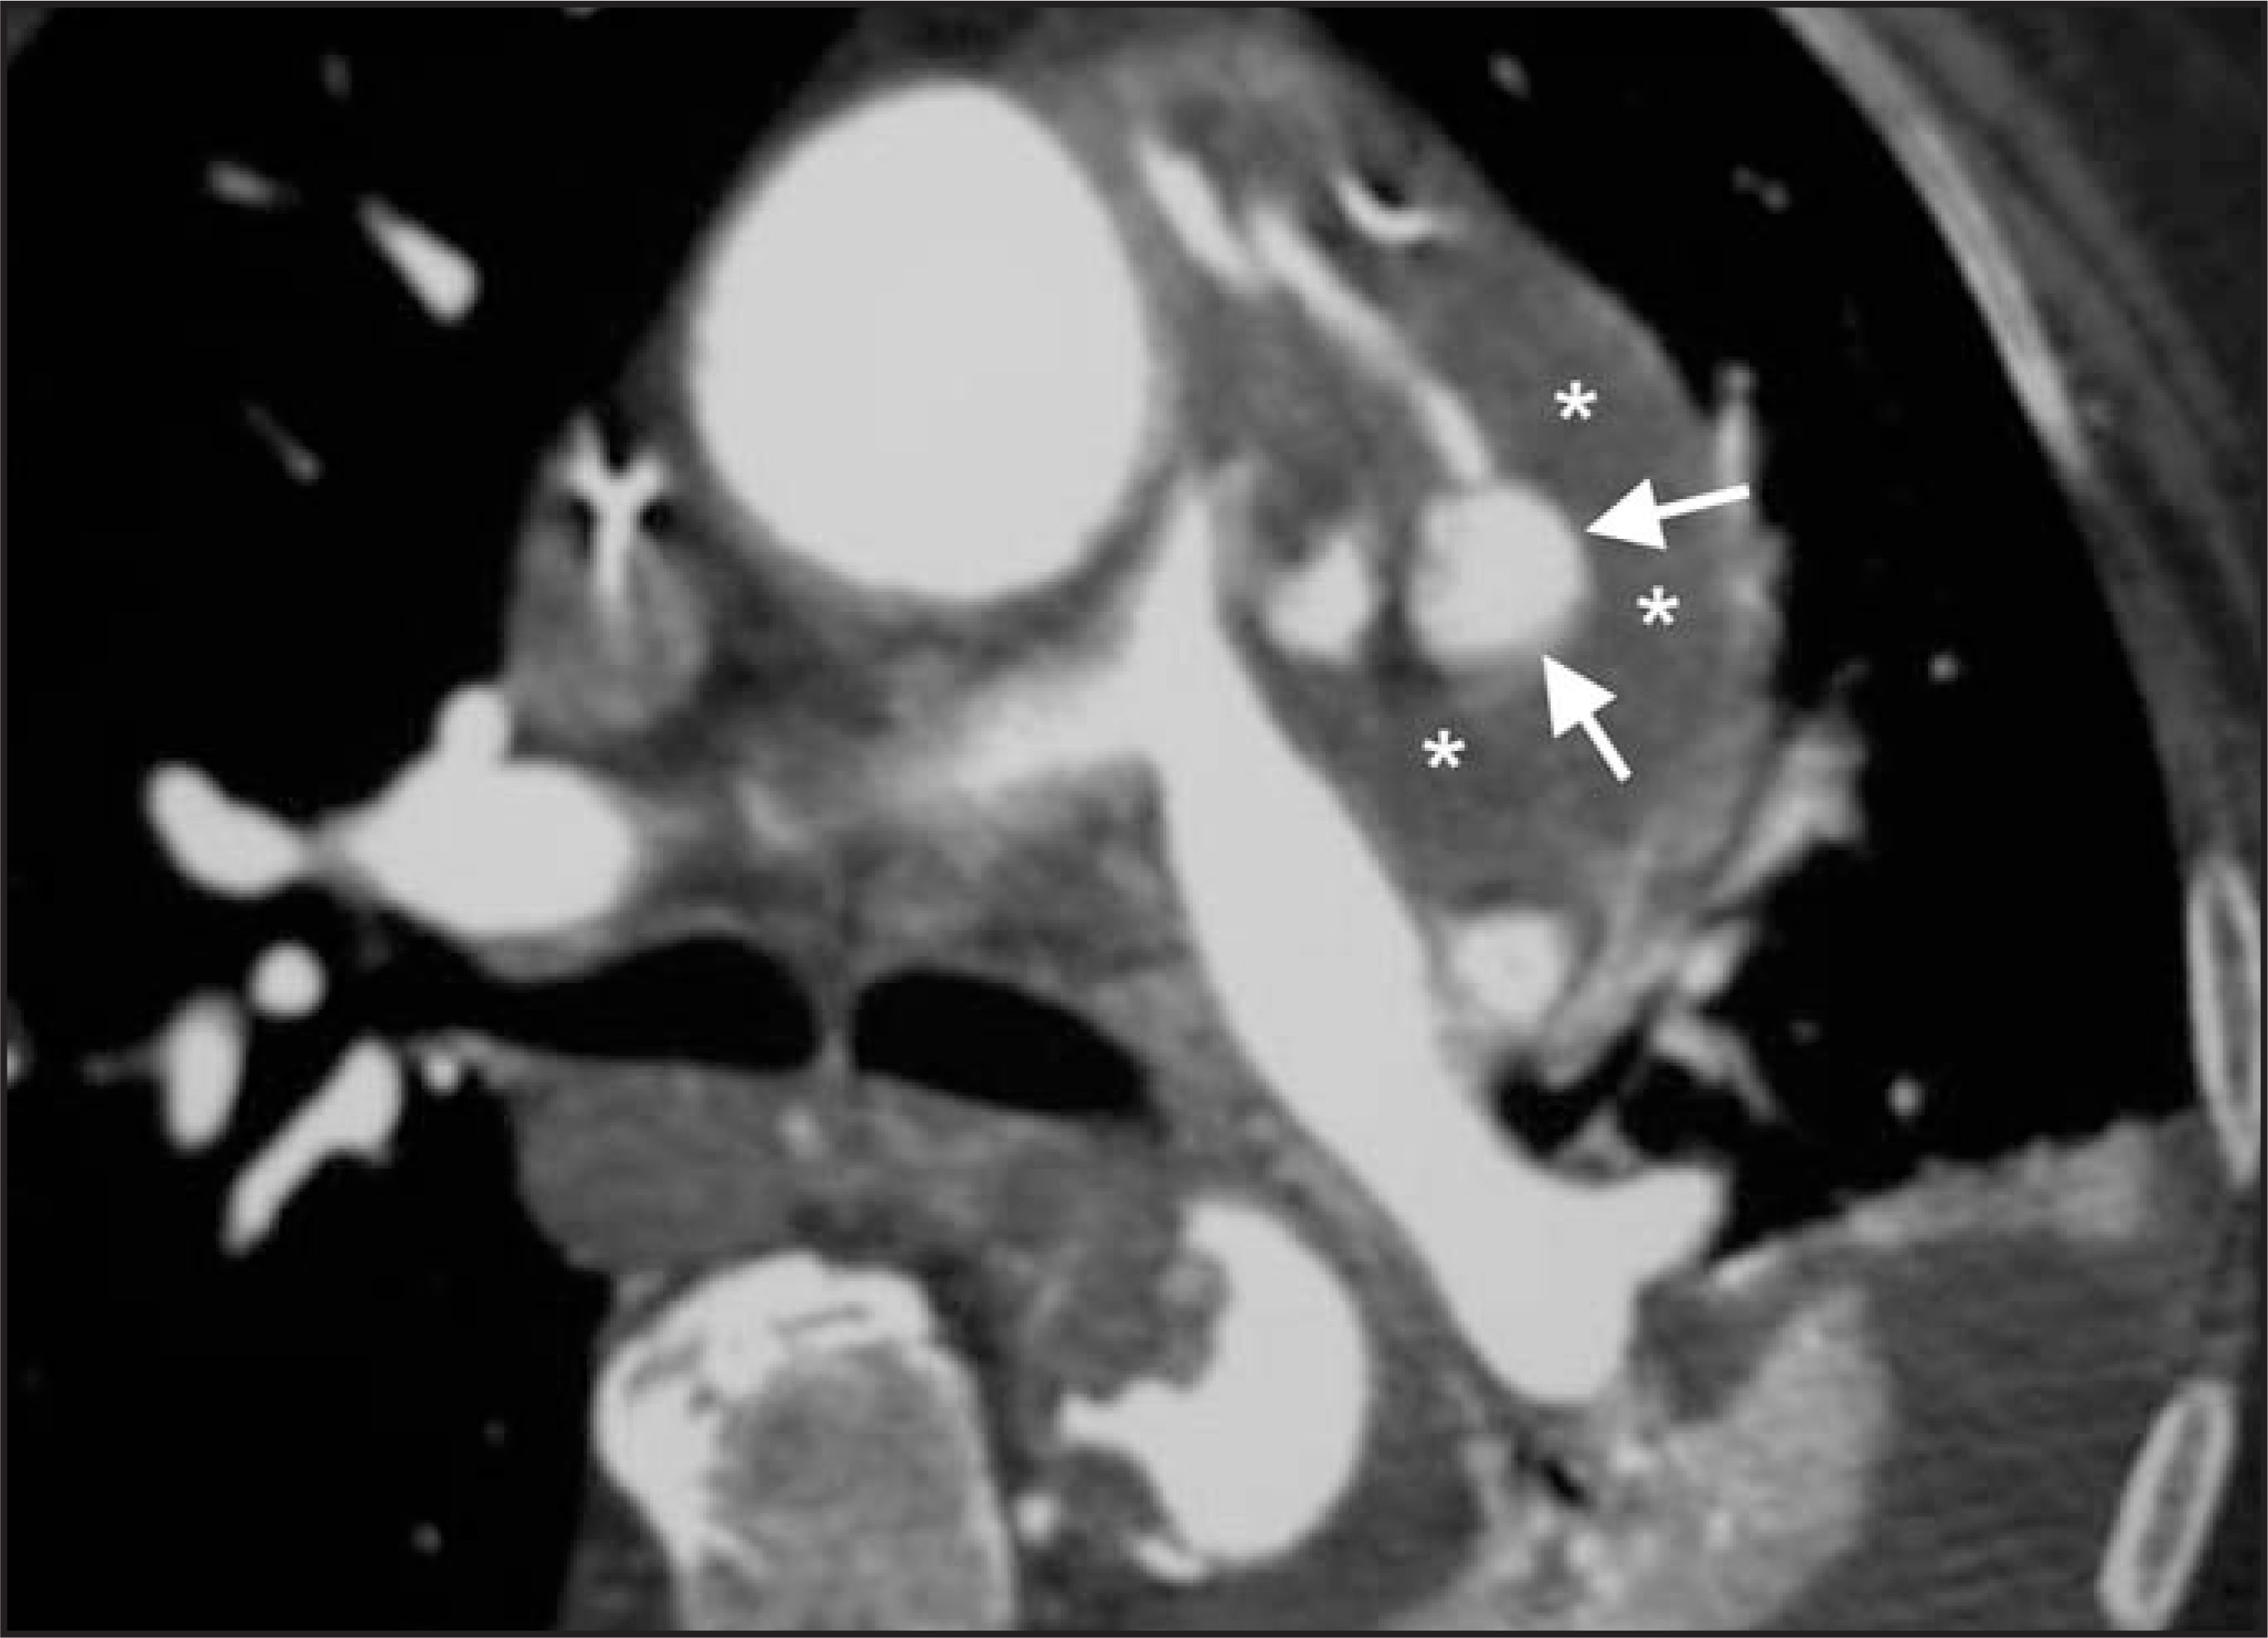
Occluded grafts may be visible when surrounded by mediastinal fat, but will have soft tissue attenuation. Saphenous vein grafts can develop atherosclerotic aneurysms in the same fashion as native vessels.17 They can be distinguished from native coronary aneurysms by location (Figure 27). Mycotic aneurysms can also form in coronary bypass grafts17 (Figure 28).
Valve replacement
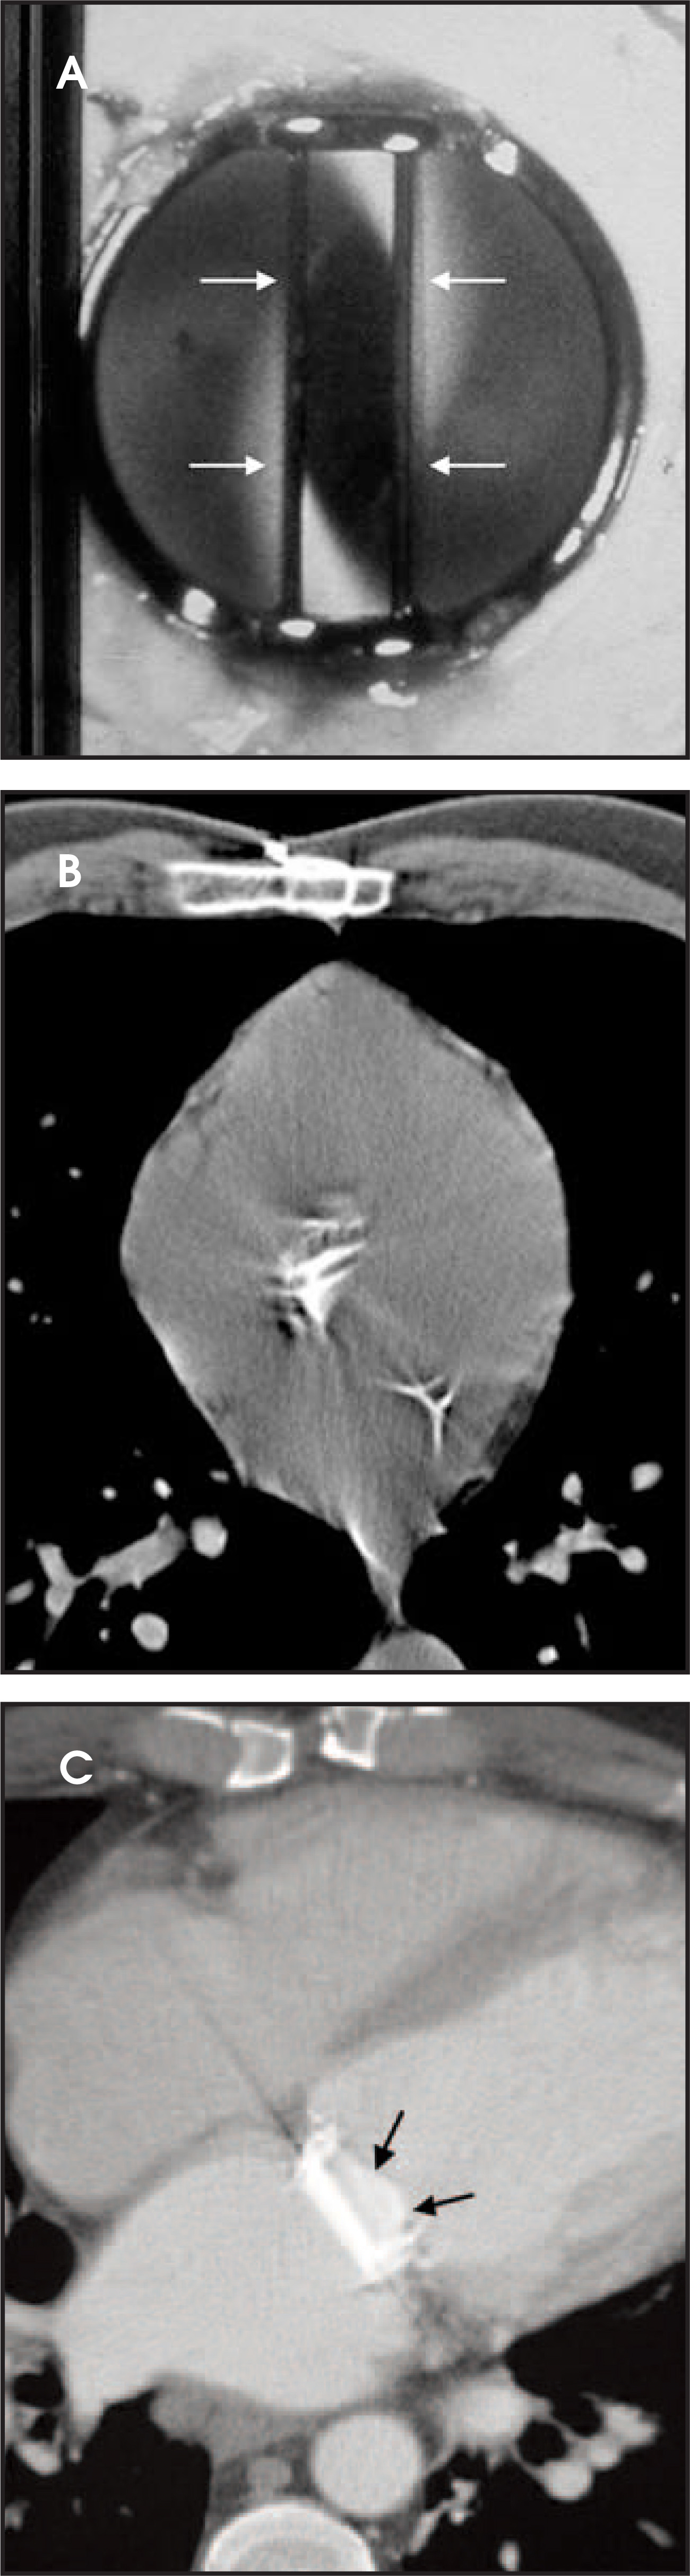
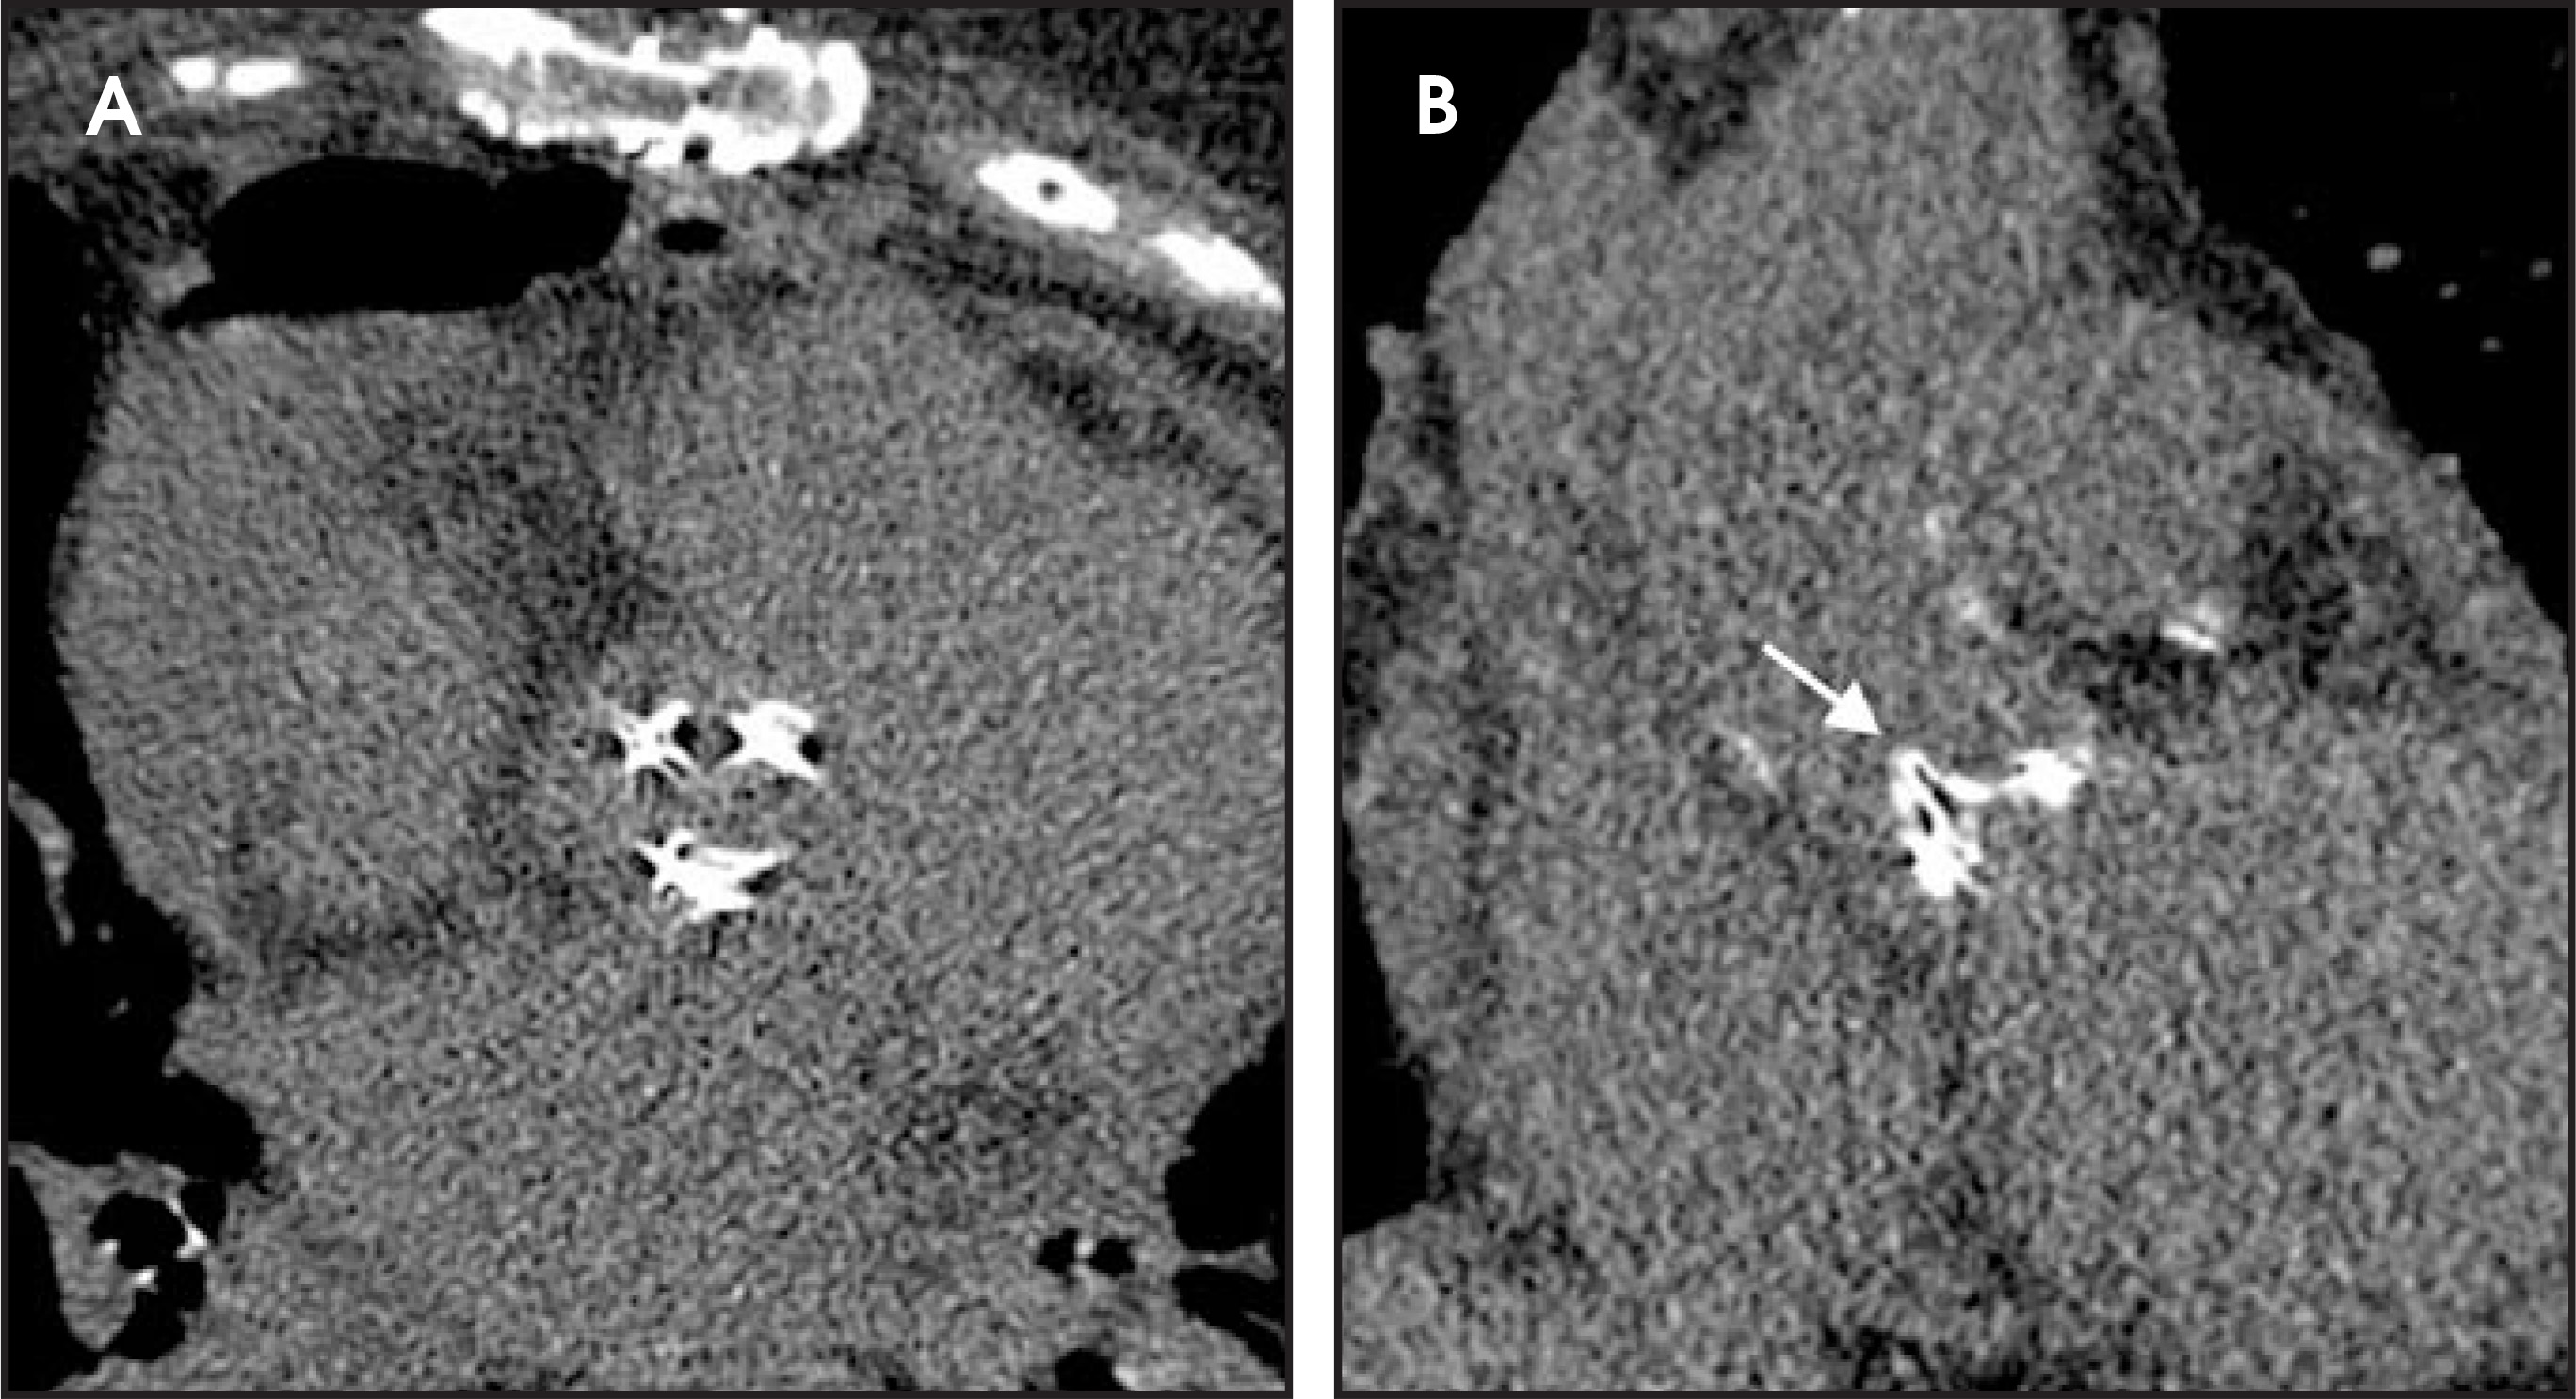
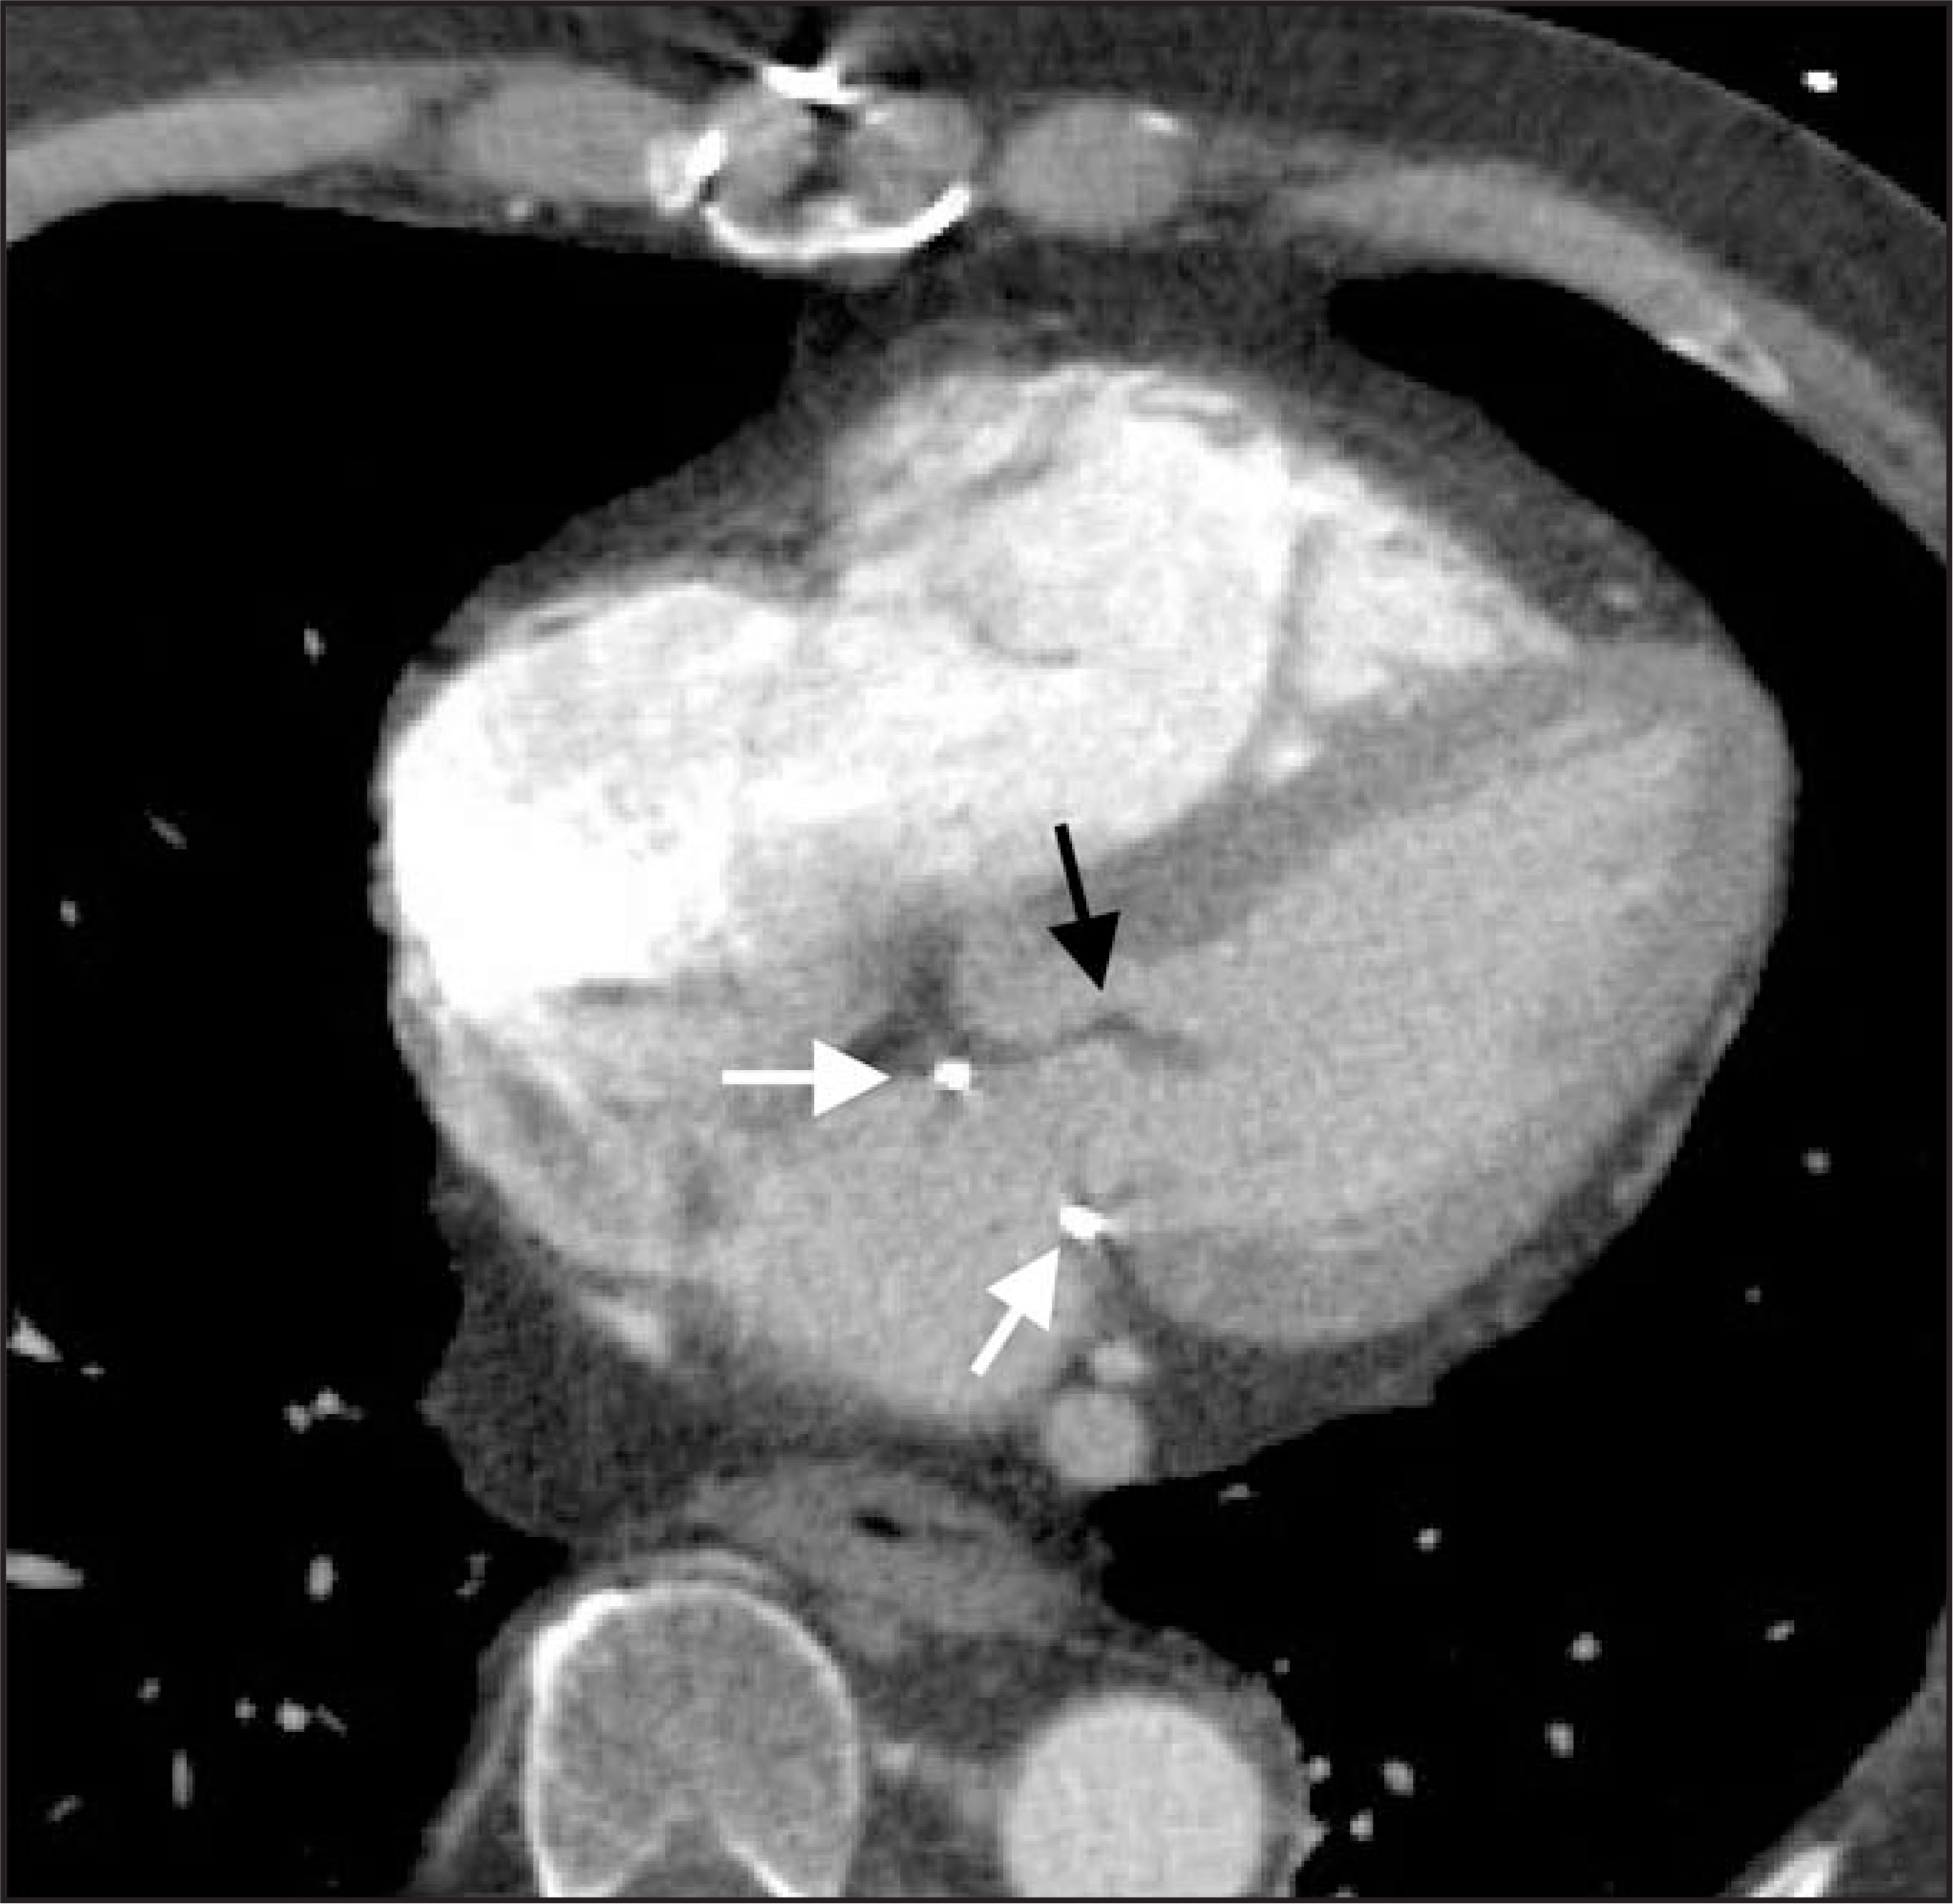
Two of the most widely used prosthetic valves are the St. Jude Medical and Carpentier-Edwards bovine pericardial valves. The St. Jude valve is a mechanical valve with 2 half-moon shaped leaflets.18 When the valve is open, the leaflets are oriented parallel to the direction of blood flow; when the valve is closed, the leaflets are oriented horizontally to each other18 (Figure 29). The Carpentier-Edwards bovine pericardial valve has a distinct appearance on CT. In cross section, its 3 metallic struts appear as 3 crosses that are oriented in the shape of a triangle. When viewed in profile, the struts have an elongated narrow U shape (Figure 30). Mitral anuloplasty rings come in many shapes, but similar to mitral annular calcium, are readily recognized by their characteristic location and lack of leaflets15 (Figure 31). Tricuspid annuloplasty rings and valves are similar in appearance to their mitral counterparts, but on the other side of the heart.
Conclusion
A large number of cardiac abnormalities may be visible on standard thoracic CT. A conscientious effort in evaluating the heart and applying these principles may provide important information for the clinician caring for the patient and, as a side benefit, enhance your credibility to your local cardiologist.
References
- Brenner D, Hall E. Computed tomography – an increasing source of radiation exposure. NEJM. 2007;357(22):2277-2284.
- Bruzzi J, Remy-Jardin M, Delhaye D. When, why, and how to examine the heart during thoracic CT: Part 1 and part 2, the basic principles. AJR. 2006;186:324-341.
- Guthaner D, Wexler L, Harell G. CT demonstration of cardiac structures. AJR. 1979;133:75-81.
- Tatli S, Lipton M. CT for intracardiac thrombi and tumors. The International Journal of Cardiovascular Imaging. 2005;21(1):115-131.
- Schoepf U, Becker C, Ohnesorge B, Yucel E. CT of coronary artery disease. Radiology. 2004;232:18-37.
- Murthy P, Mohammed T, Read K. MDCT of coronary artery aneurysms. AJR. 2005;184:S19-S20.
- Mahnken A, Mühlenbruch G, Das M. MDCT detection of mitral valve calcification: Prevalence and clinical relevance compared with echocardiography. AJR. 2007;188:1264-1269.
- Gilkeson R, Markowitz A, Balgude A, Sachs P. MDCT evaluation of aortic valvular disease. AJR. 2006;186:350-360.
- Wang Z, Reddy G, Gotway M. CT and MR imaging of pericardial disease. Radiographics. 2003;23:S167-S180.
- Best A, Dobson R, Ahmad A. Best cases from the AFIP; Cardiac Angiosarcoma. Radiographics. 2003;23:S141-S145.
- Chiles C, Woodard P, Gutierres F, Link K. Metastatic involvement of the heart and pericardium: CT and MR imaging. Radiographics. 2001;21(2):439-449.
- Engelke C, Schaefer-Prokop C, Schirg E. High-resolution CT and CT angiography of peripheral pulmonary vascular disorders. Radiographics. 2002;22(4):739-764.
- Ng C, Wells A, Padley S. A CT sign of chronic pulmonary arterial hypertension: The ratio of main pulmonary artery to aortic diameter. J Thorac Imaging. 1999;14(4):270-278.
- Ravin C. Radiographic analysis of pulmonary vascular distribution: A review. Bull NY Acad Med. 1983;59(8):728-743.
- Hunter T, Taljanovic M, Tsau P. Medical devices of the chest. Radiographics. 2004;24:1725-1746.
- Marano R, Storto M, Merlino B. Pictorial review of coronary artery bypass grafts at multidetector row CT. Chest. 2005;127(4):1371-1377.
- Frazier A, Qureshi F, Read K. Coronary artery bypass grafts: Assessment with multidetector CT in early and late postoperative settings. Radiographics. 2005;25:881-896.
- Castenada-Zuniga W, Nicoloff D, Jorgensen C. In vivo radiographic appearance of the St. Jude valve prosthesis. Radiology. 1980;134(3):775.
Citation
. Detecting cardiac abnormalities on routine chest CT. Applied Radiology. 2009;38(6):28-37. doi:10.37549/AR1700.