Diffusion imaging in the spine
Applied Radiology — Vol. 40 , Issue 4 , pp. 9 -15
DOI: 10.37549/AR1814
Published: April 1, 2011
Categories
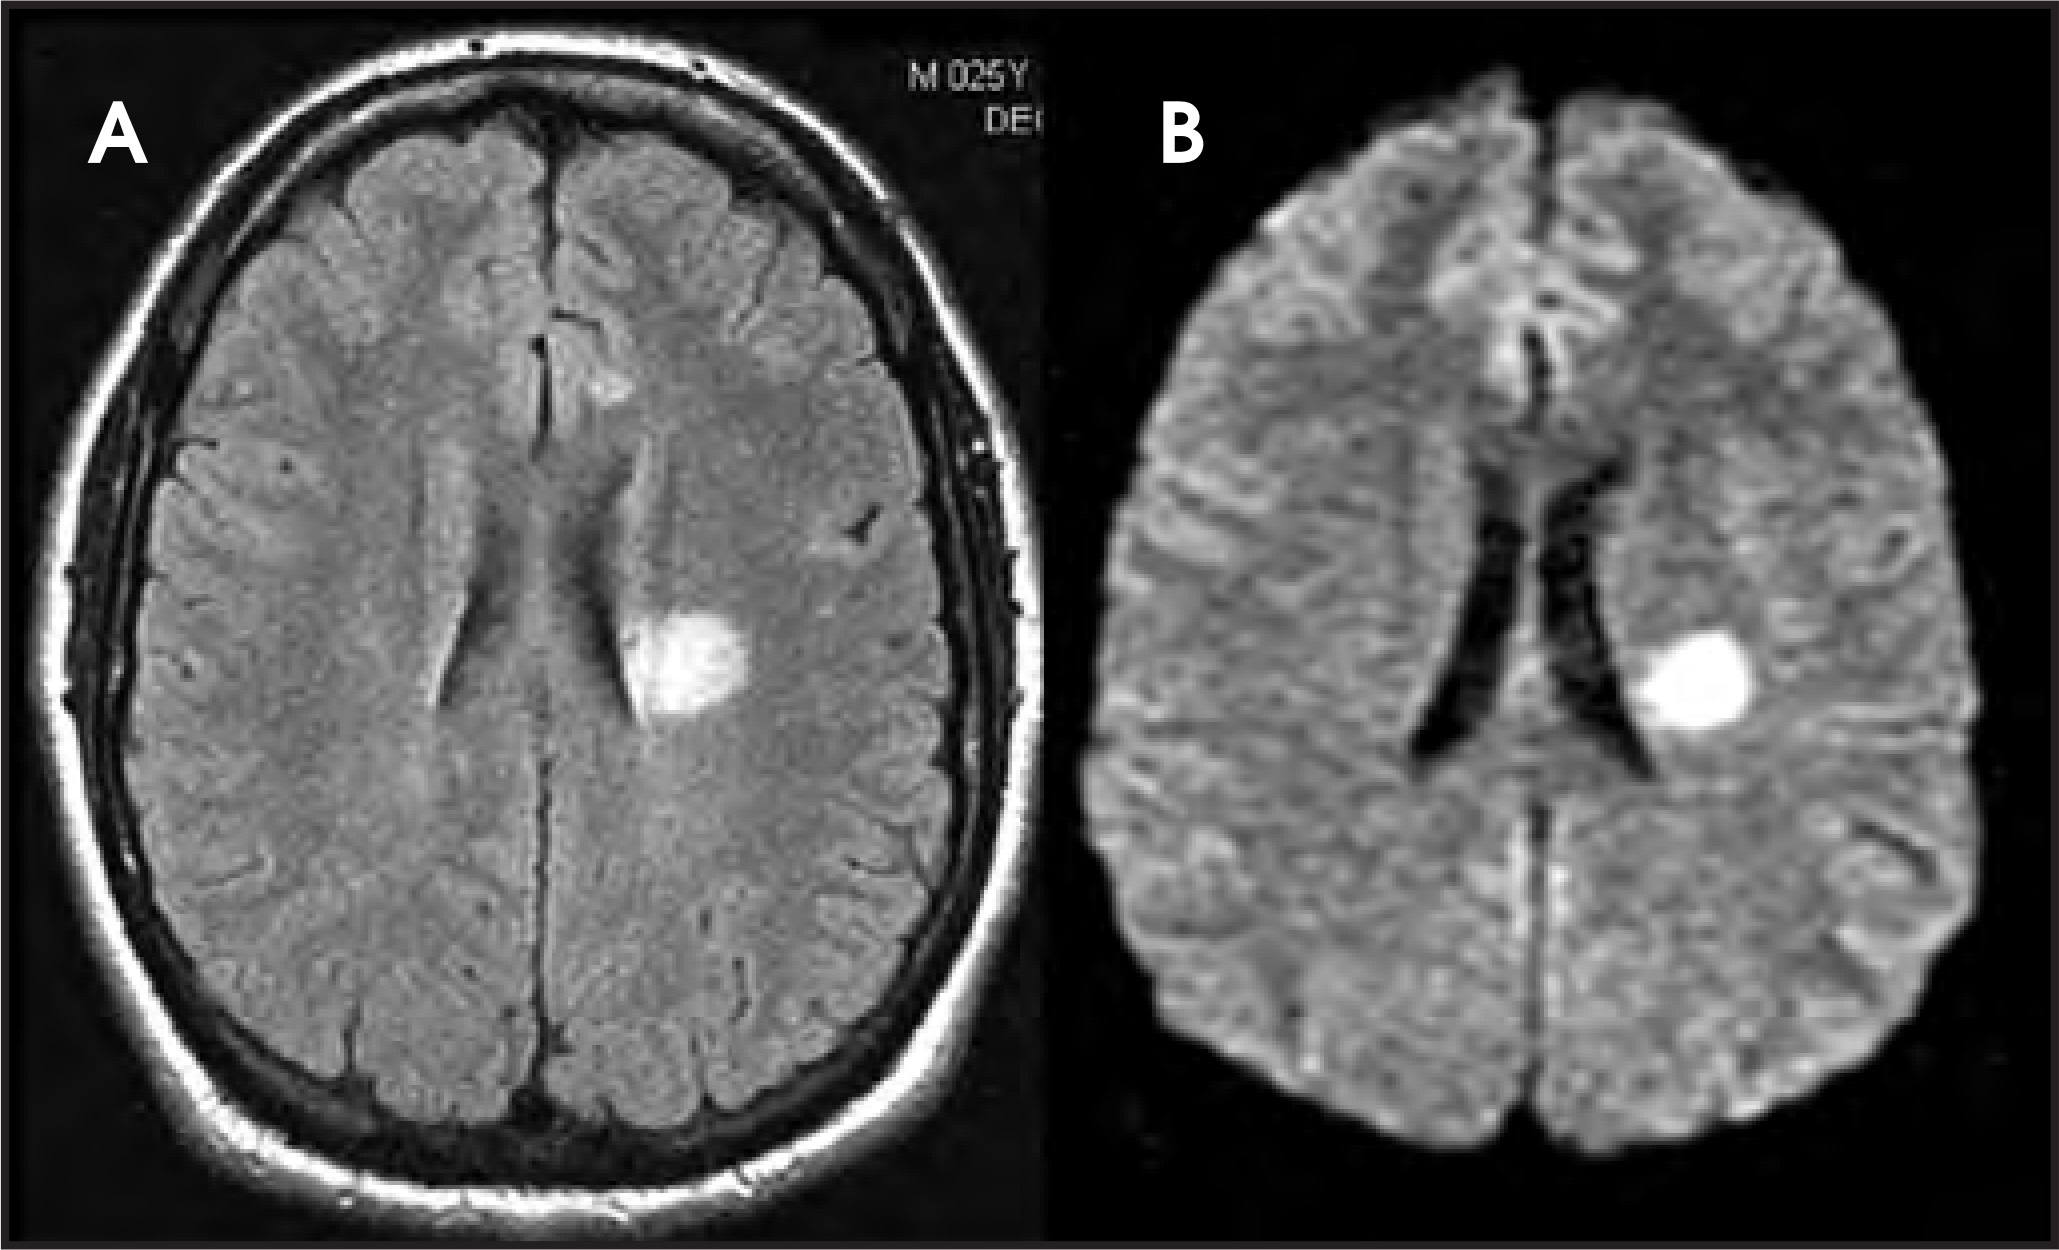
Diffusion-weighted imaging (DWI) is a powerful tool for tissue interrogation with magnetic resonance imaging (MRI). By sensitizing the MR image to perturbations of the random motion of water molecules in tissues, DWI provides unique insight into pathologic physiology. DWI revolutionized the evaluation of patients with suspected stroke by providing exquisite sensitivity to the presence of brain infarction, virtually immediately after onset. DWI also provides the critical ability to differentiate chronic ischemic brain changes from those due to recent stroke in patients who present in the subacute stroke setting. Perhaps the most impactful role of DWI in the brain is in lesion characterization—the differentiation of stroke and abscess from tumor, and in the assessment and surveillance of demyelinating disease (Figure 1).
DWI of the spine
Of late, DWI has become popular for imaging outside the brain and is now used for routine MR studies of the breast and body, providing a boost in lesion sensitivity as well as valuable characterization information. One of the most fruitful extracranial extensions of DWI is to the spine, offering information similar to that provided for brain studies when assessing the spinal cord as well as making a powerful contribution to the detection and characterization of intradural-extramedullary, epidural, and osseous lesions.
Spinal cord lesions
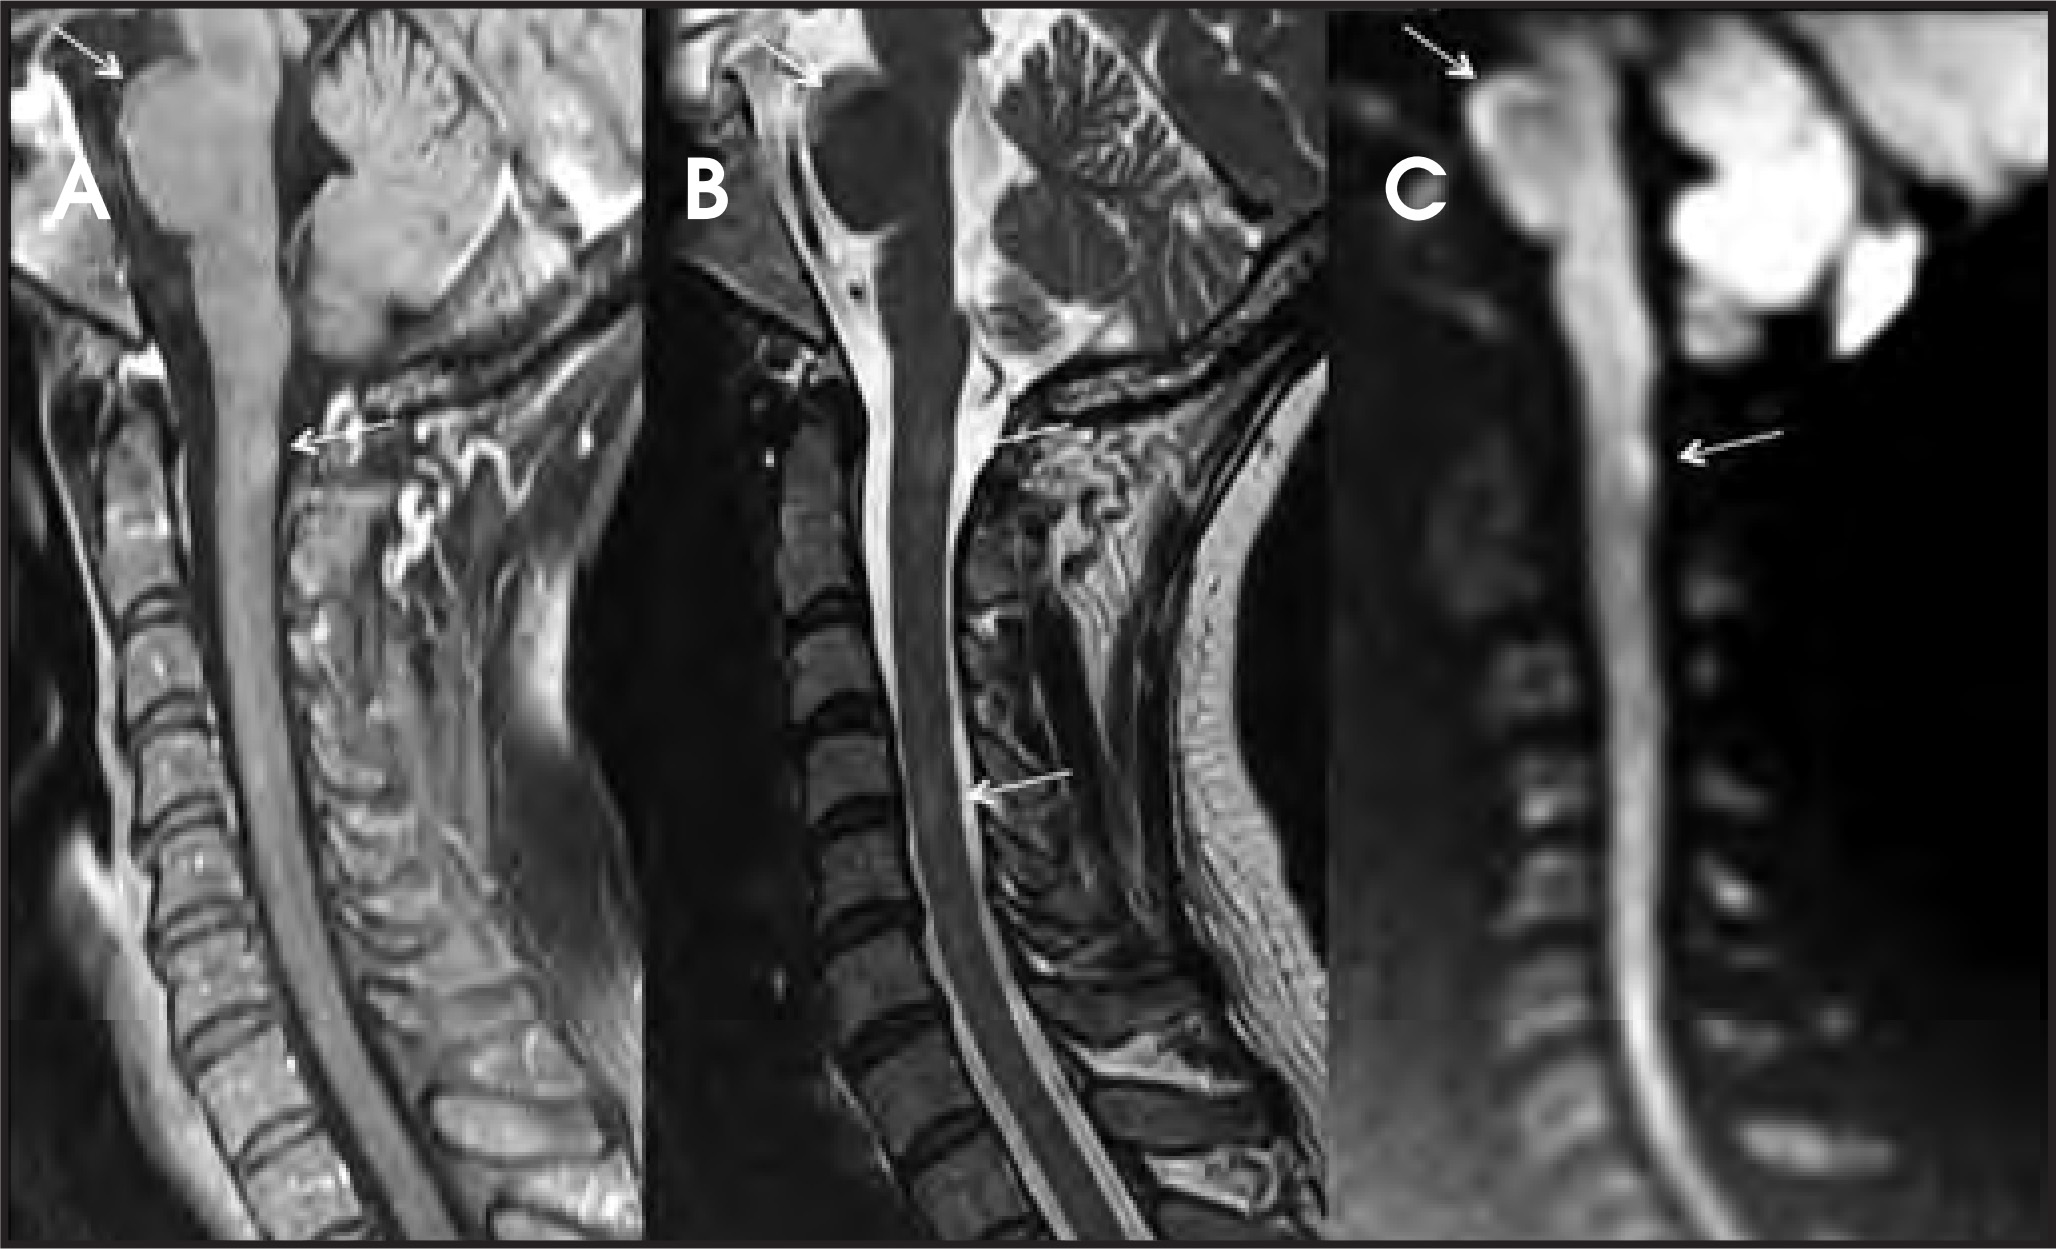
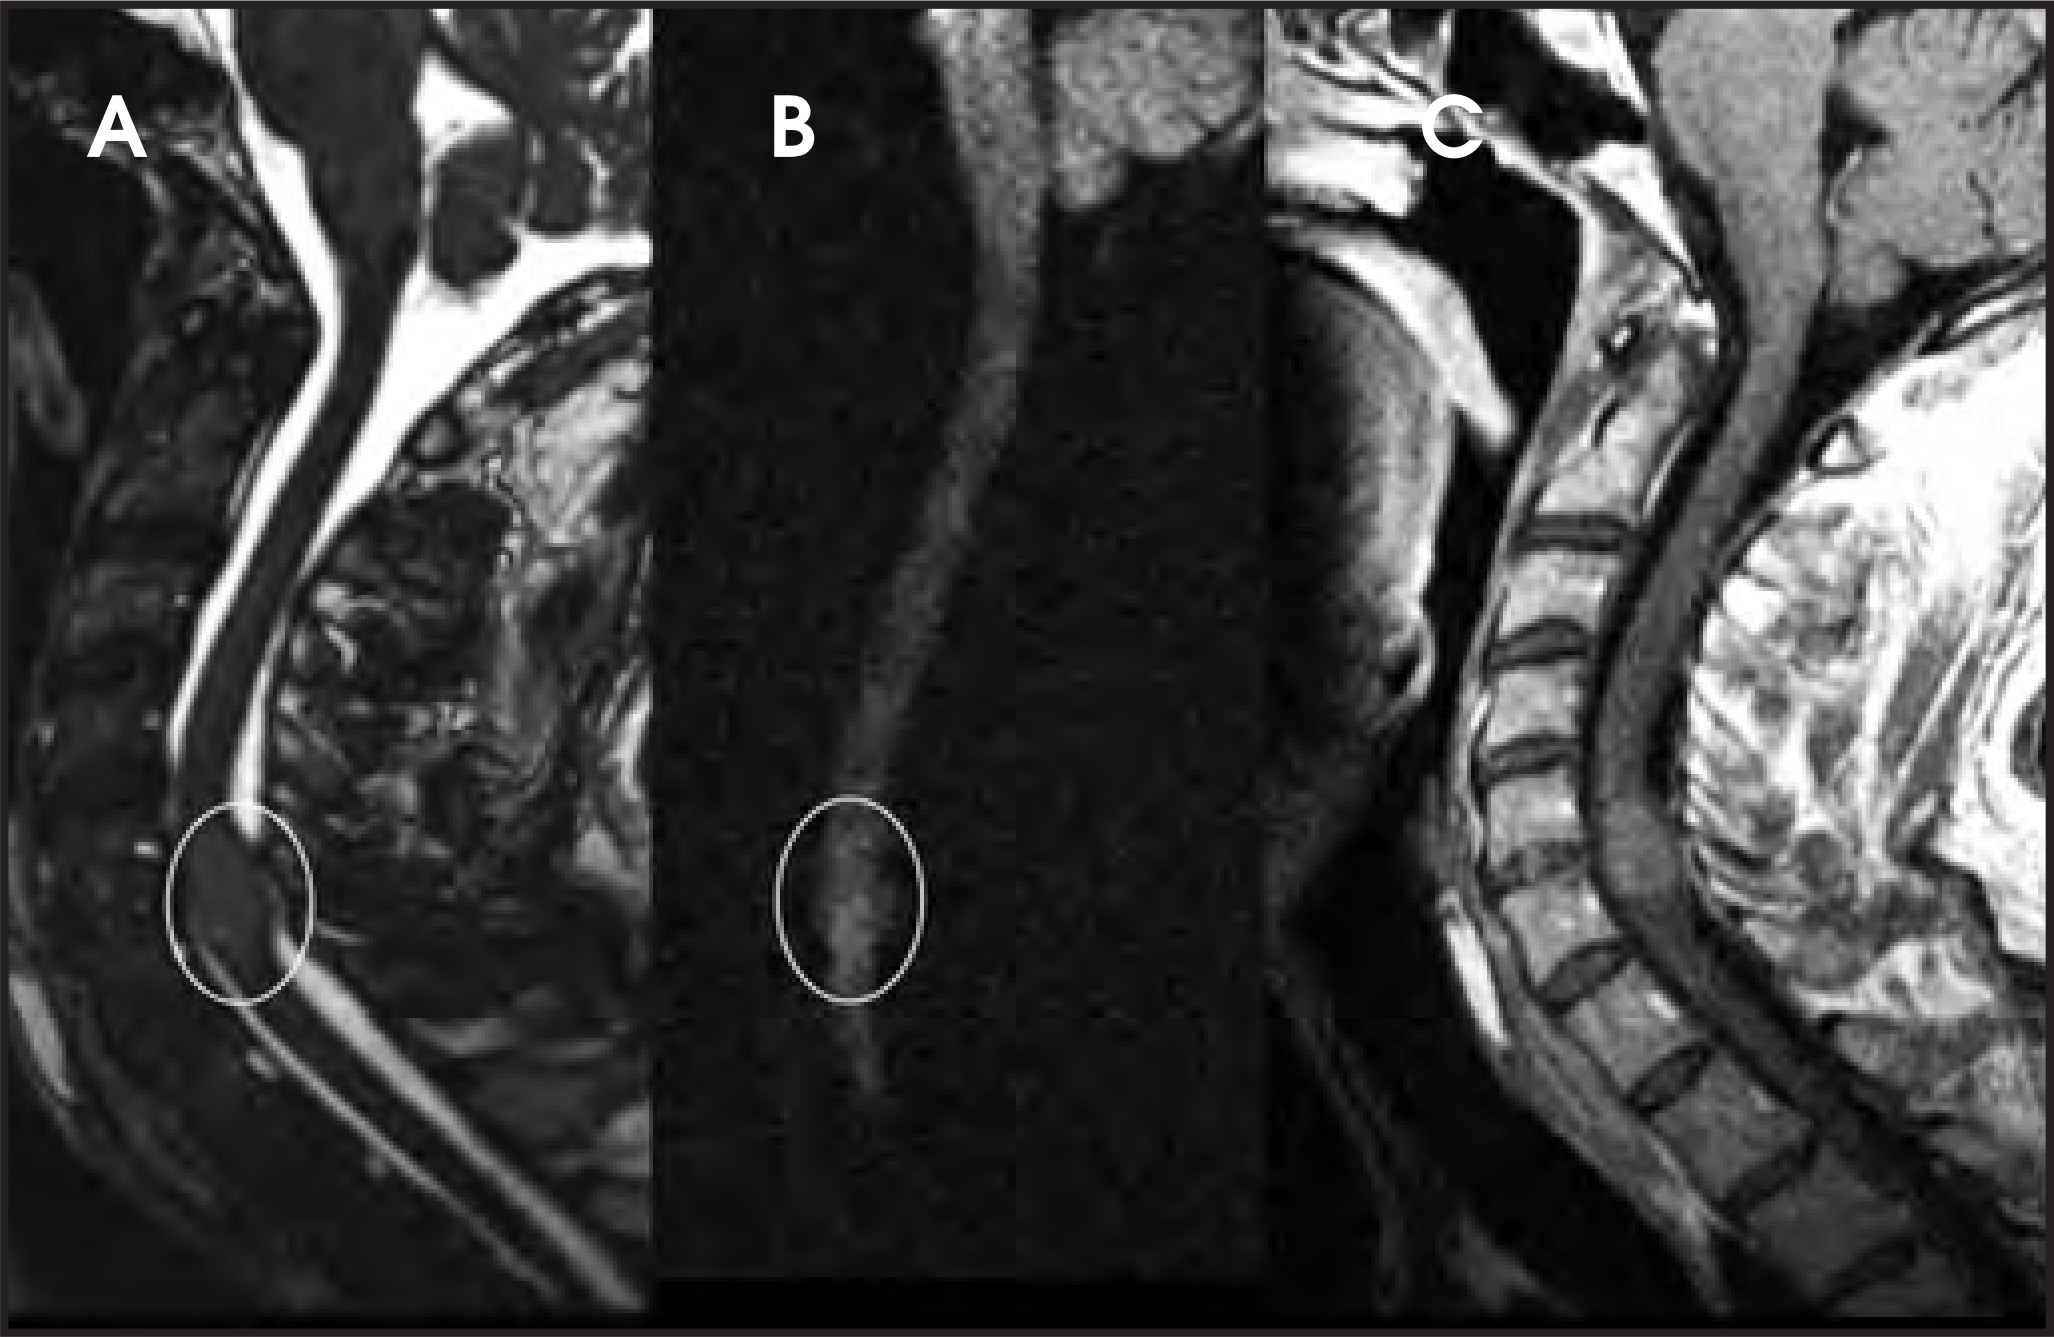
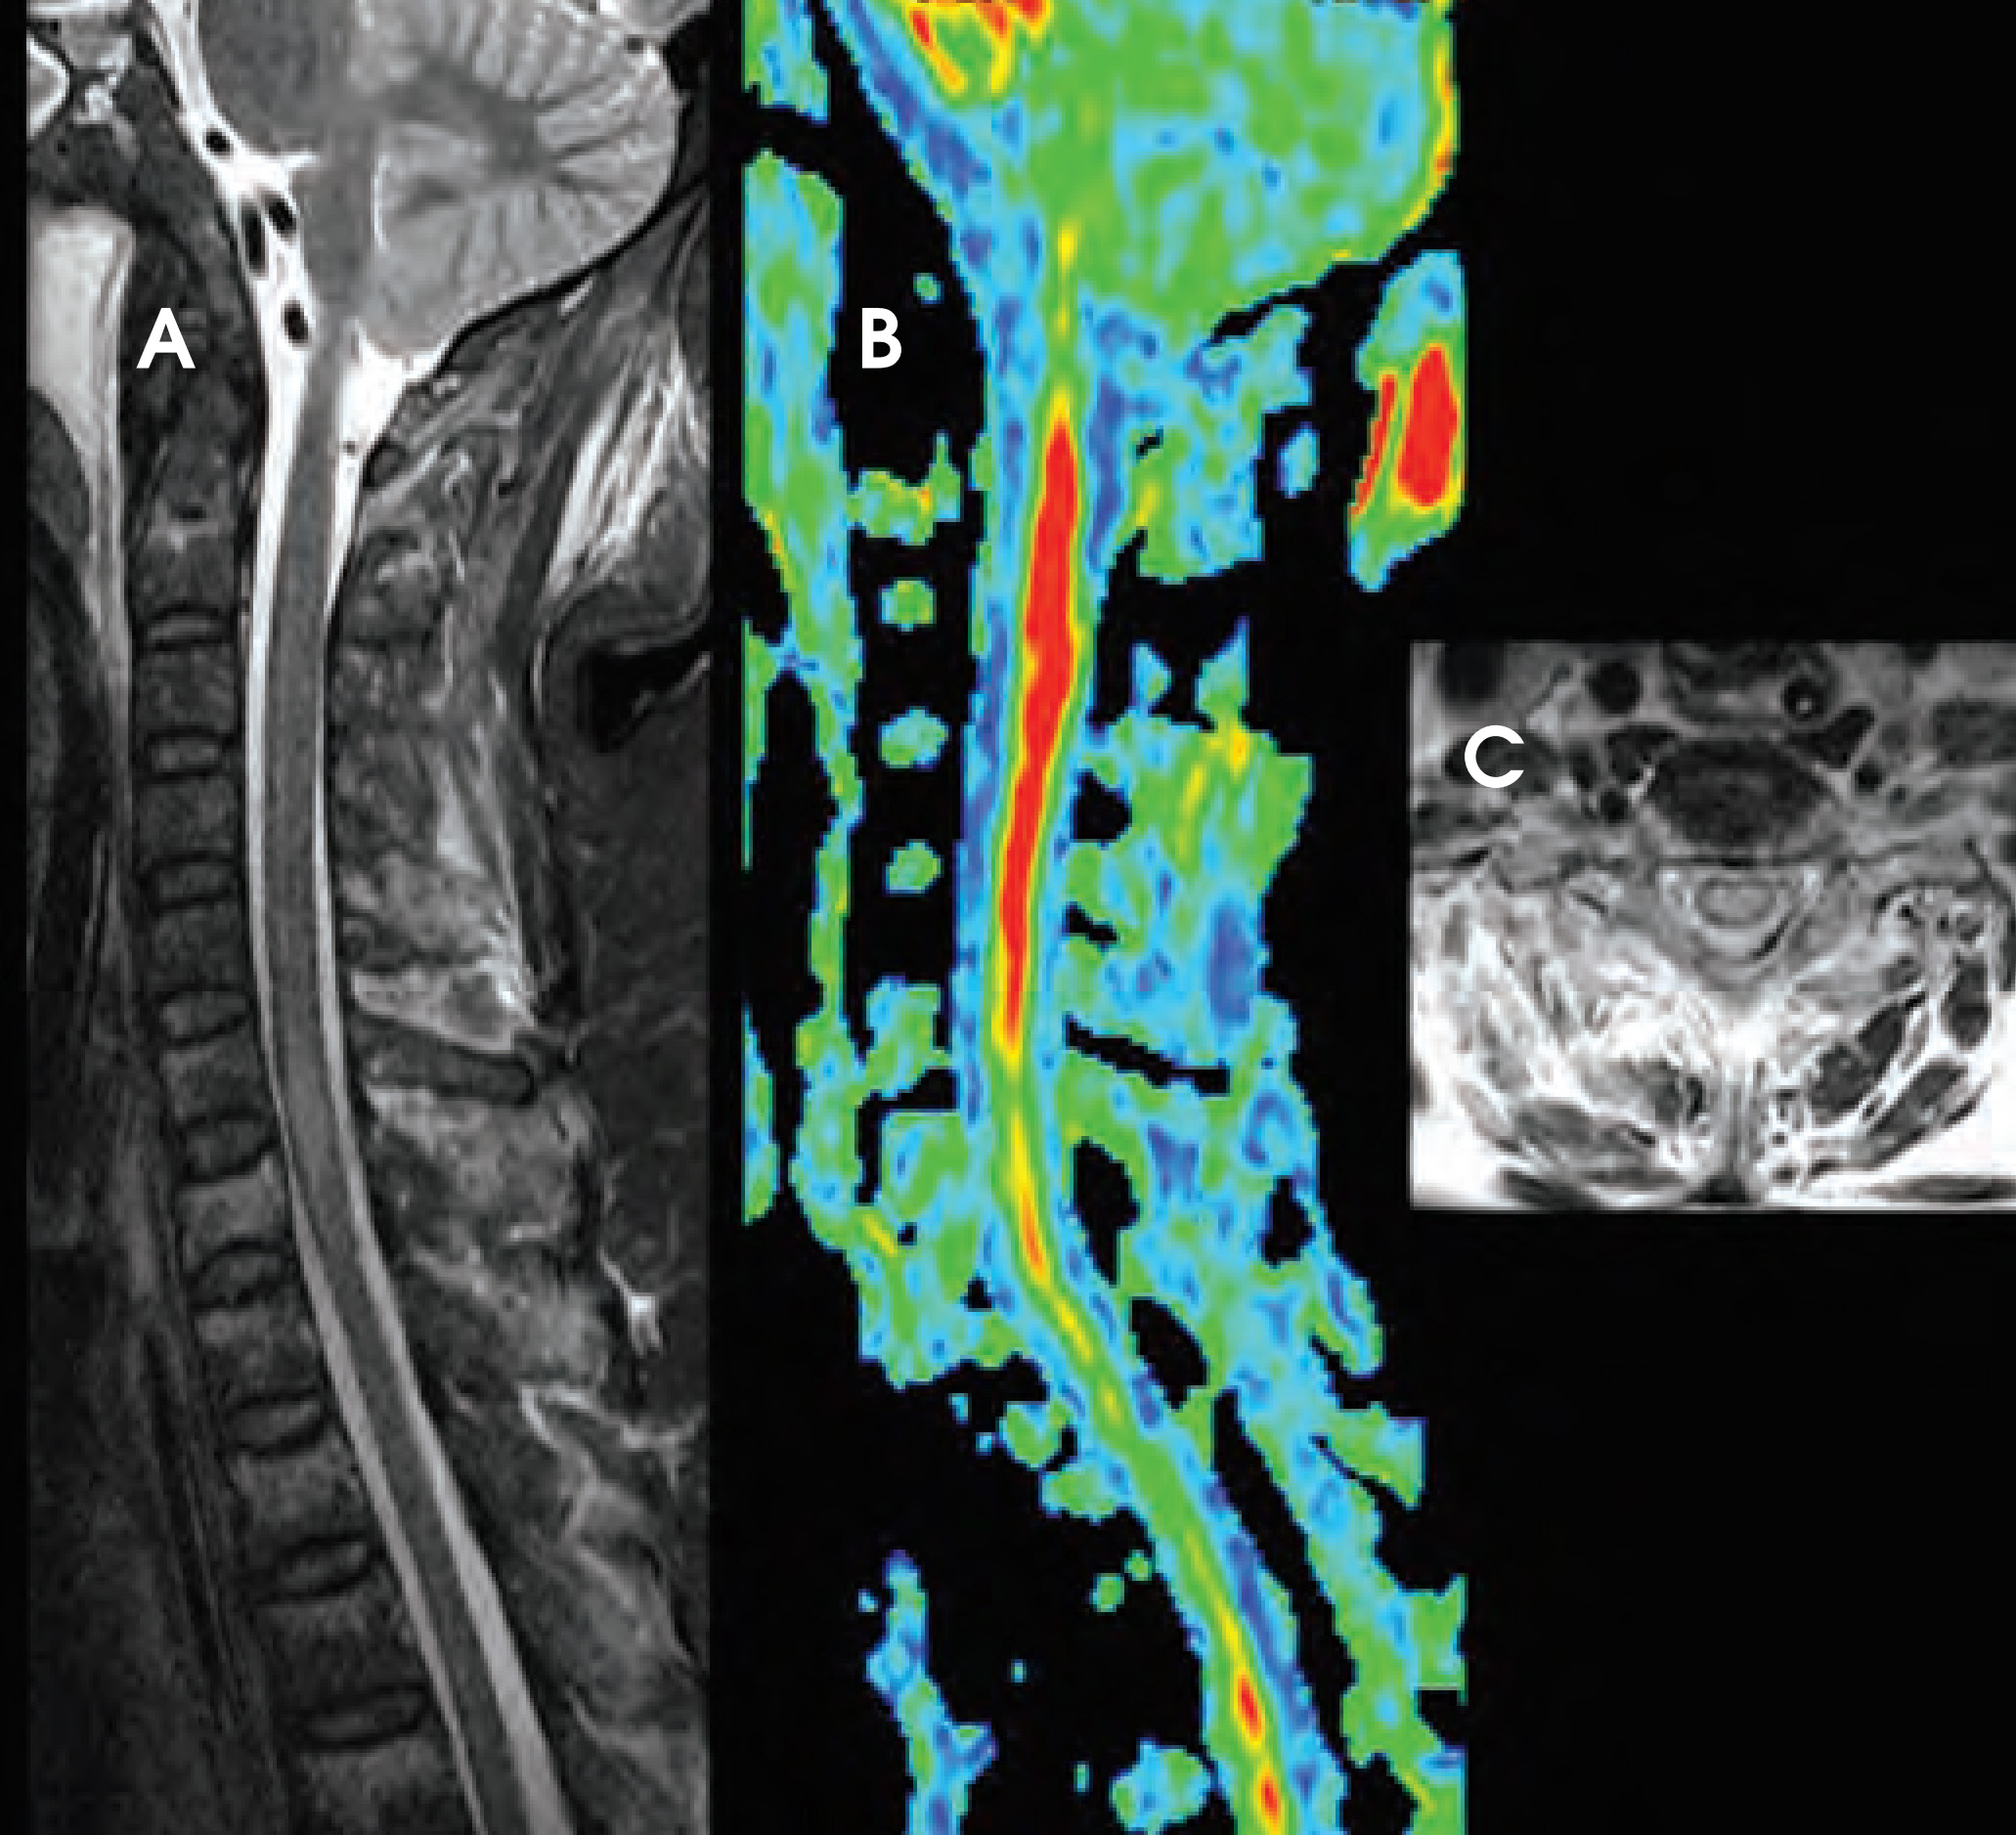
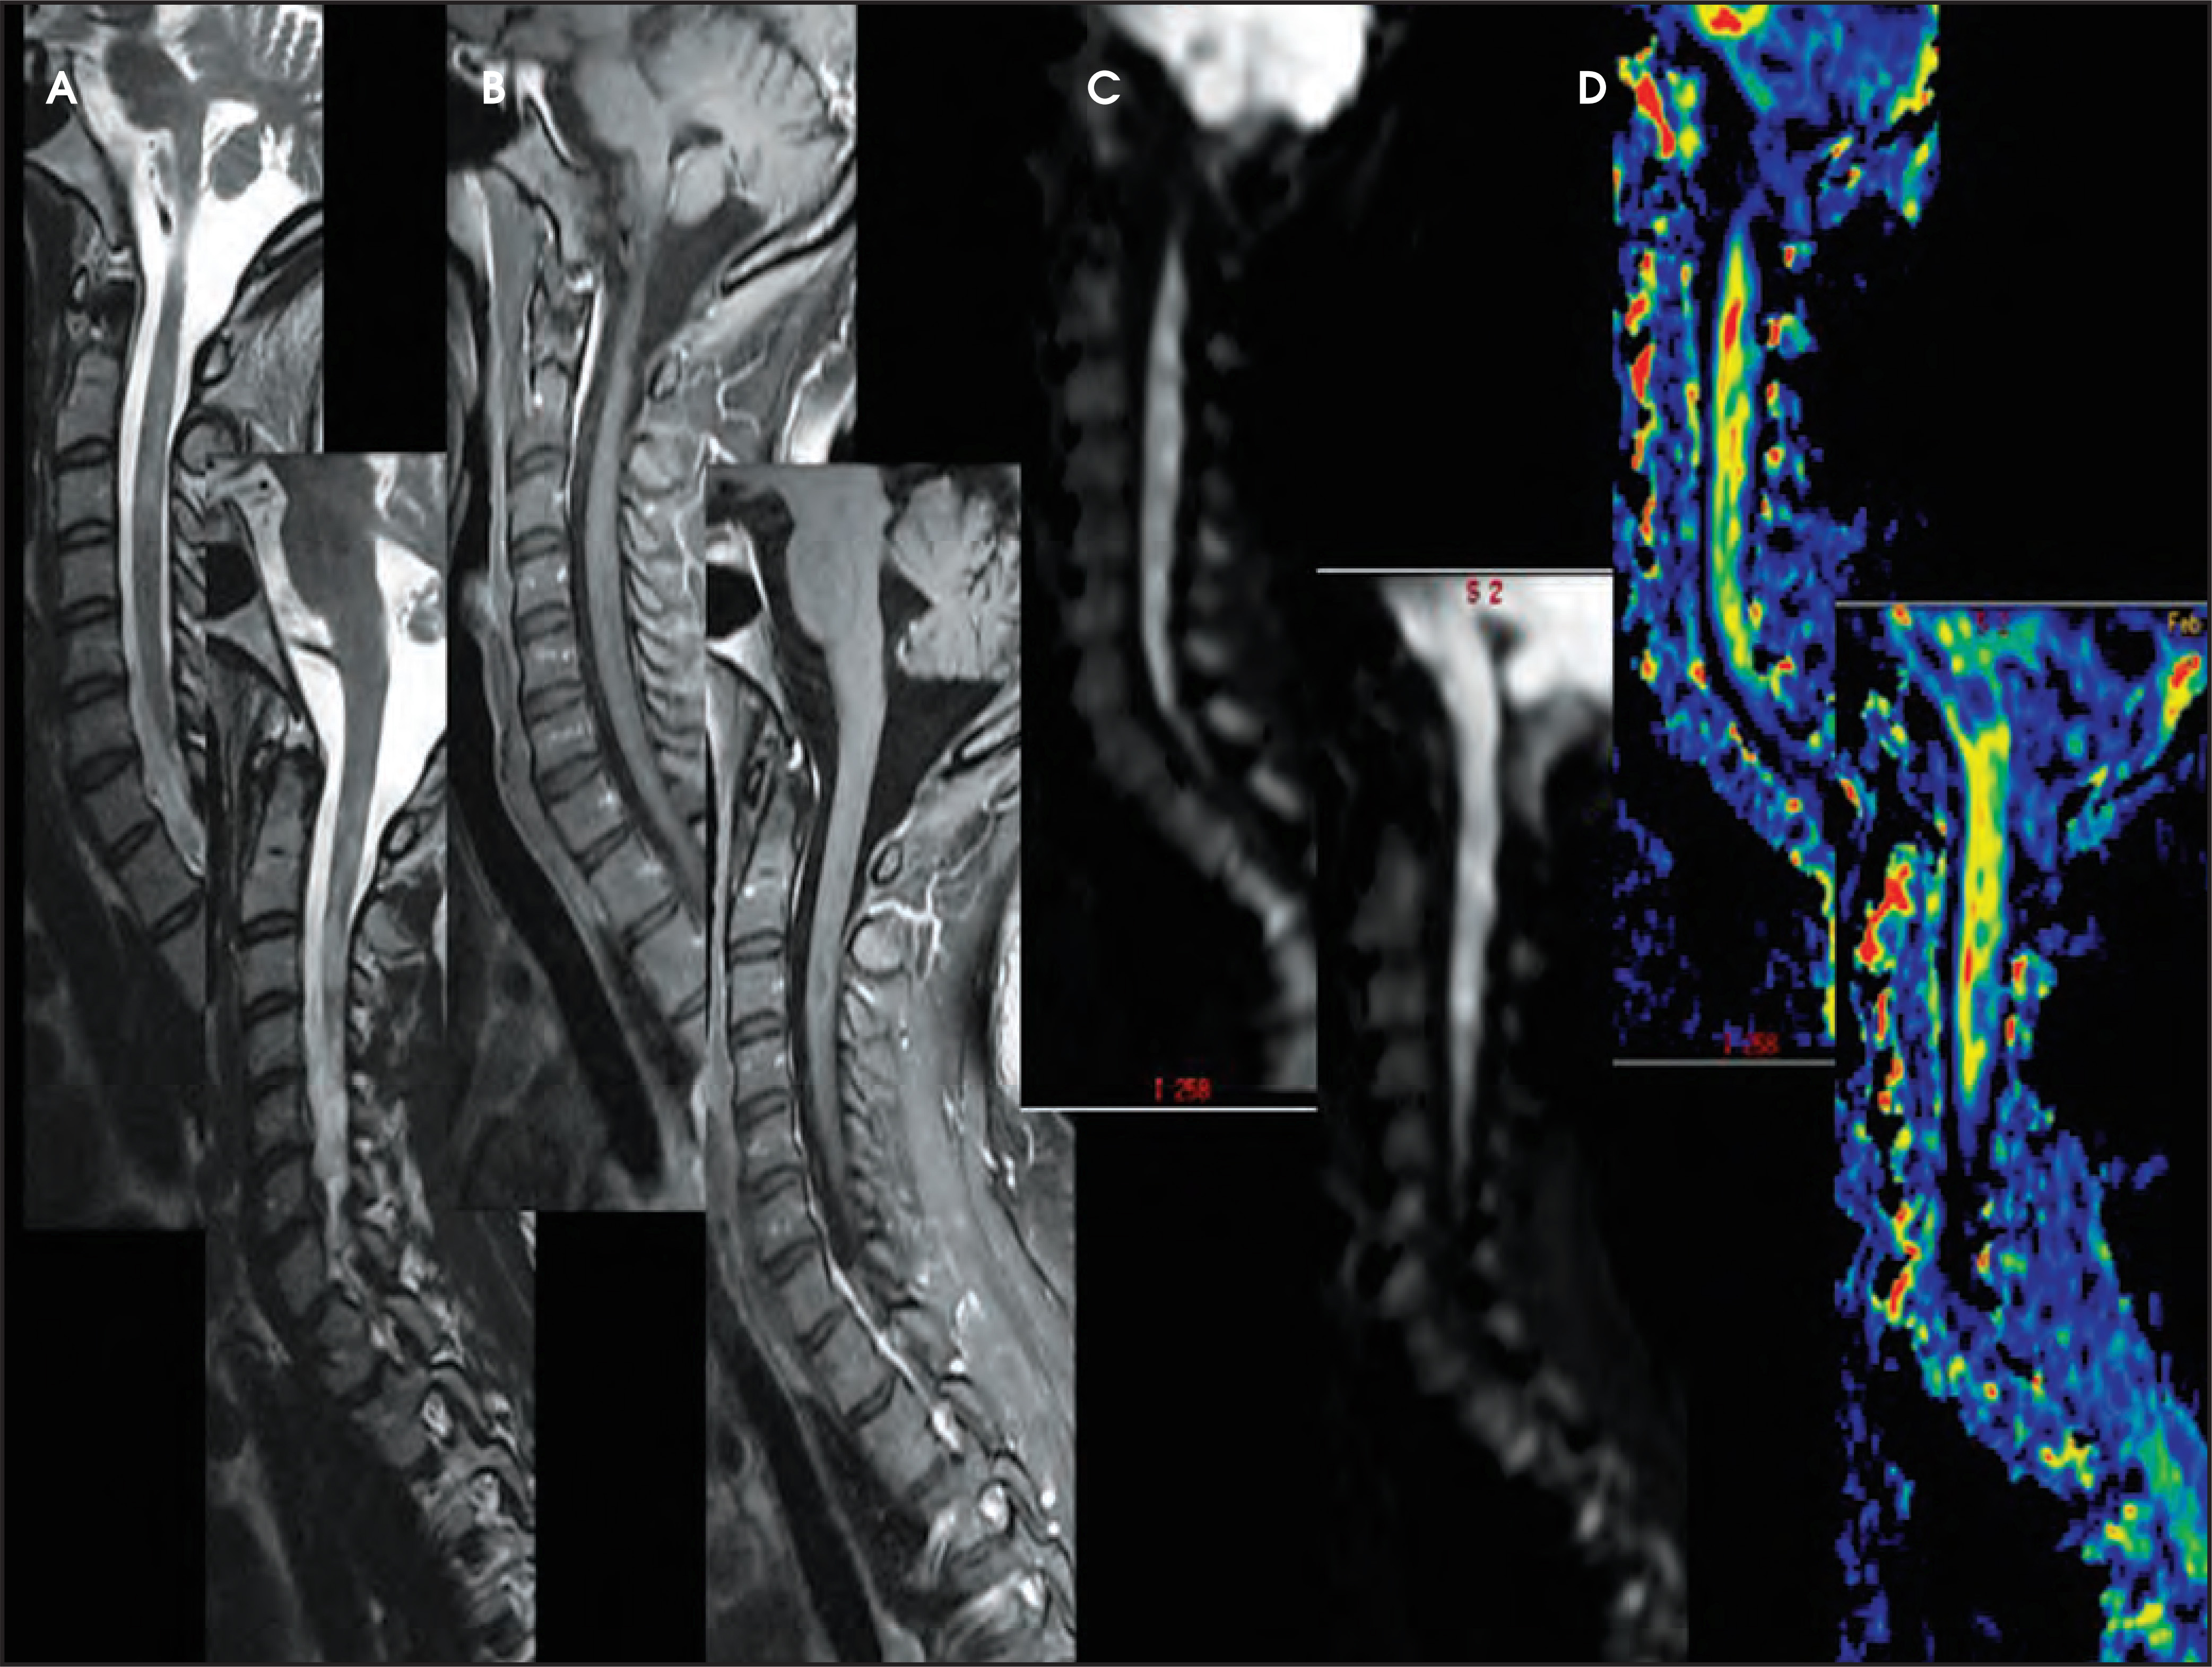
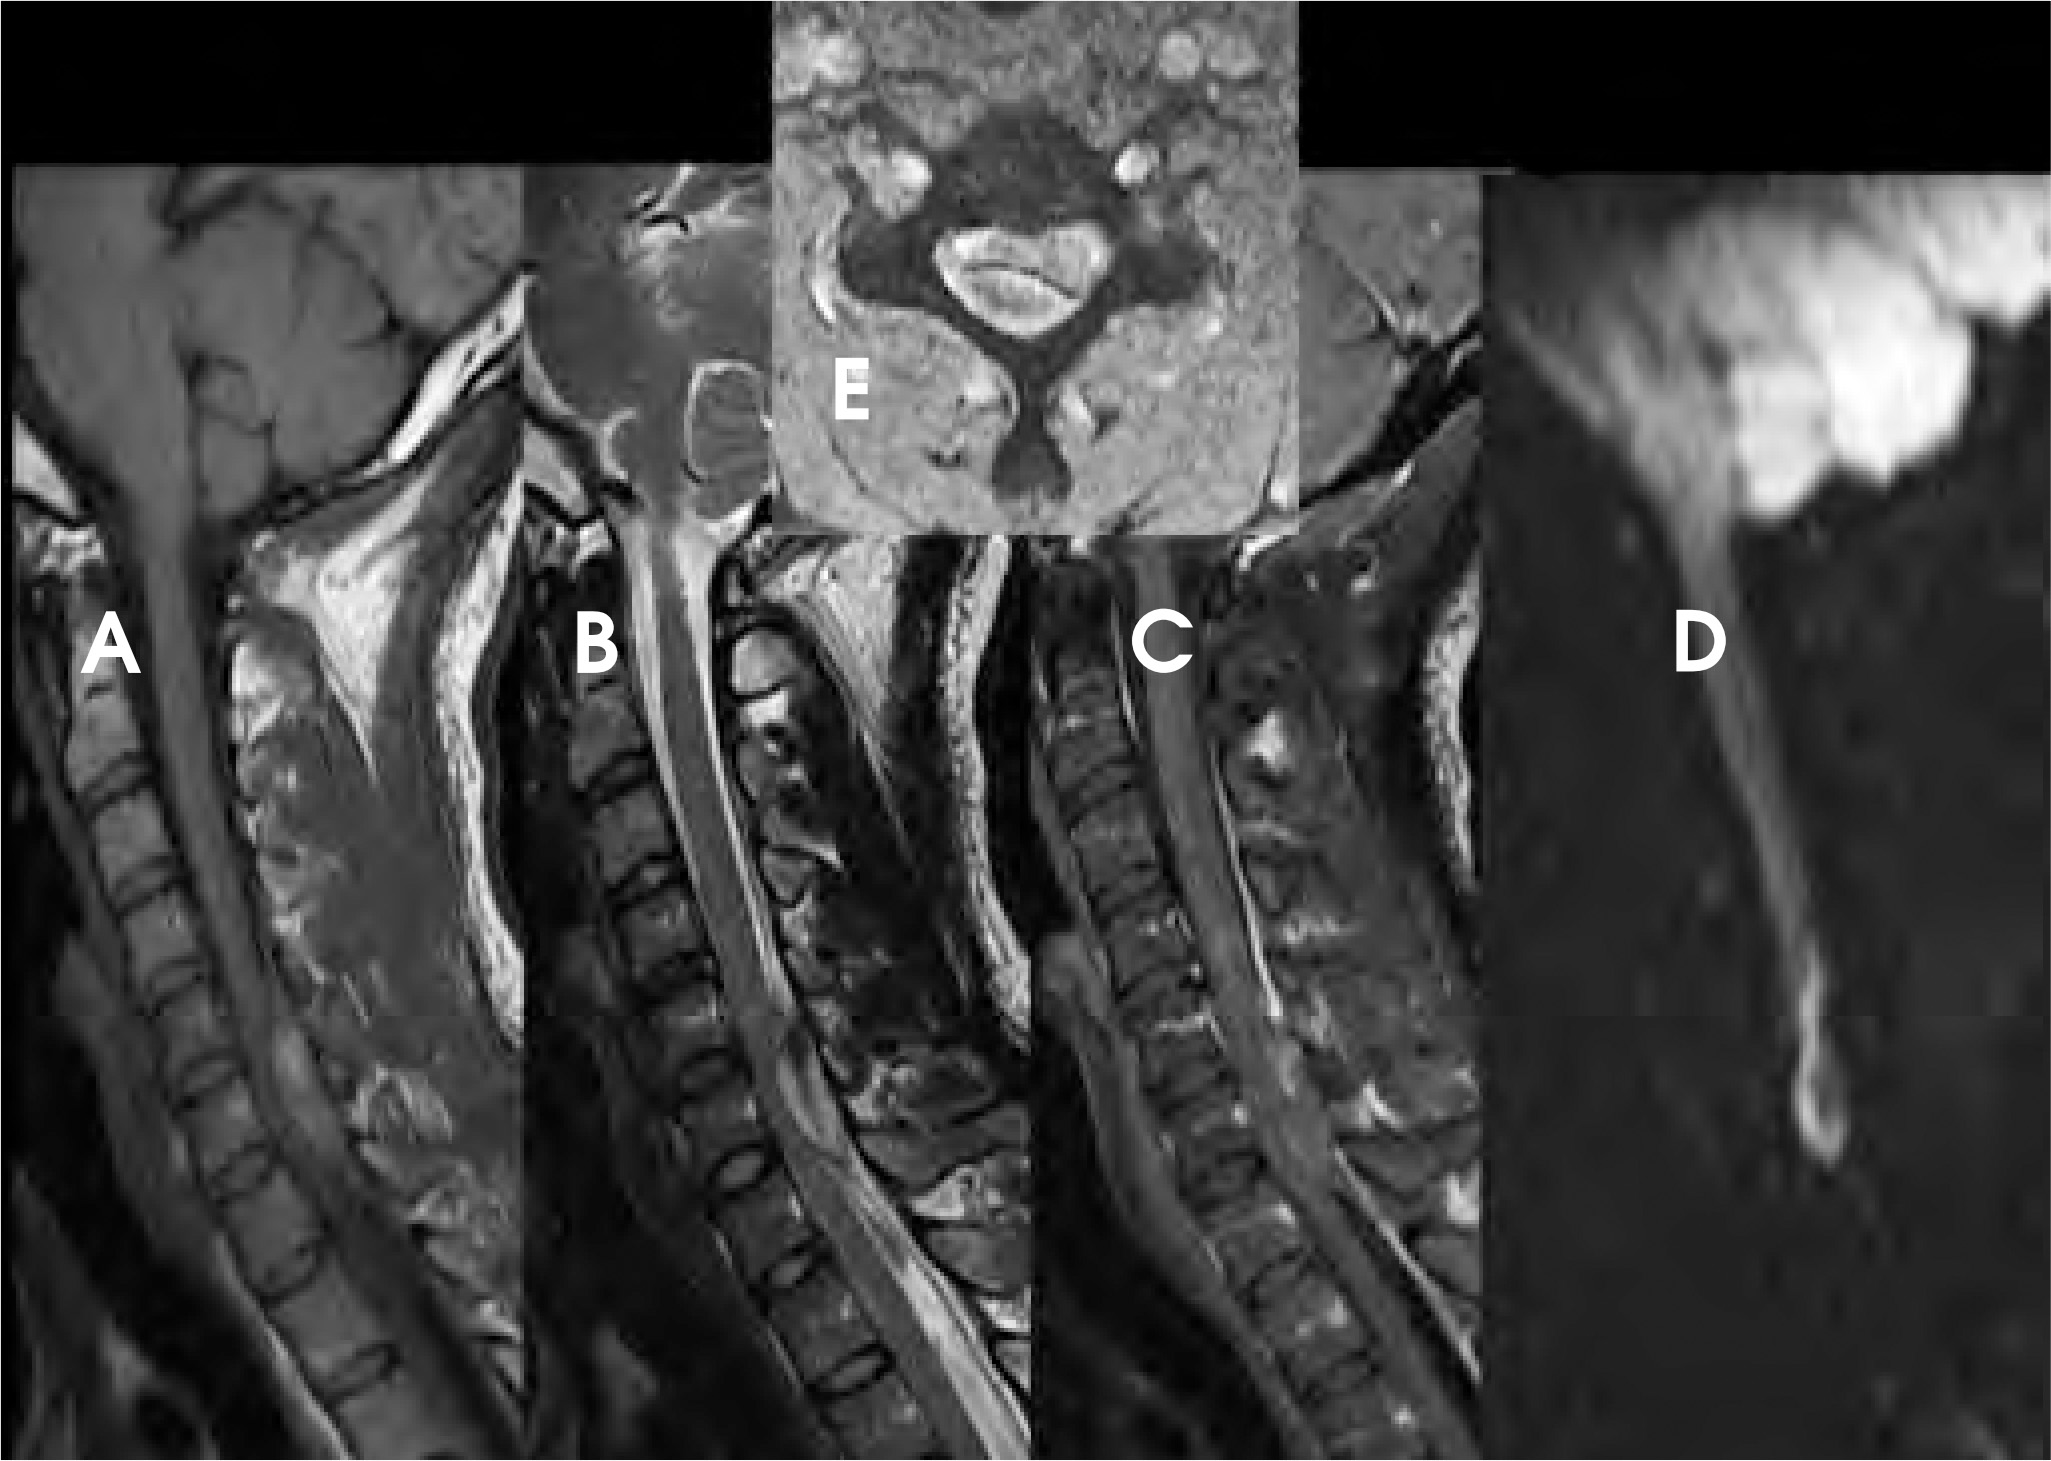
DWI can be very helpful in the characterization of cord lesions. Active demyelinating lesions tend to be hyperintense on DWI (Figure 2). This can assist in the differentiation from neoplastic lesions (Figure 3) as well as chronic demyelination, both of which tend tobe more isointense with the normal cord. Primary cord tumors tend to be closer to isointense with the normal spinal cord (Figure 4) asdo metastatic lesions. As in the brain, if lesions are hemorrhagic or exhibit a dense cellularity due to a high nuclear to cytoplasmicratio, some hyperintensity on DWI will result (Figure 5). As in the brain, acute infarctions of the cord will exhibit diffusion restriction(Figure 6). The characteristic hyperintensity of DWI is useful in the differentiation of infarction from neoplasm. Acute traumatic cord injuries tend to exhibit hyperintensity on DWI (Figure 7). A well-known diagnostic challenge is differentiation of edema from myelomalacia in the setting of spondylosis and cord compression. Edema from acute cord compression tends to reveal diffusion hyperintensity, while myelomalacia tends to appear isointense to hypointense with the adjacent normal cord (Figure 8).
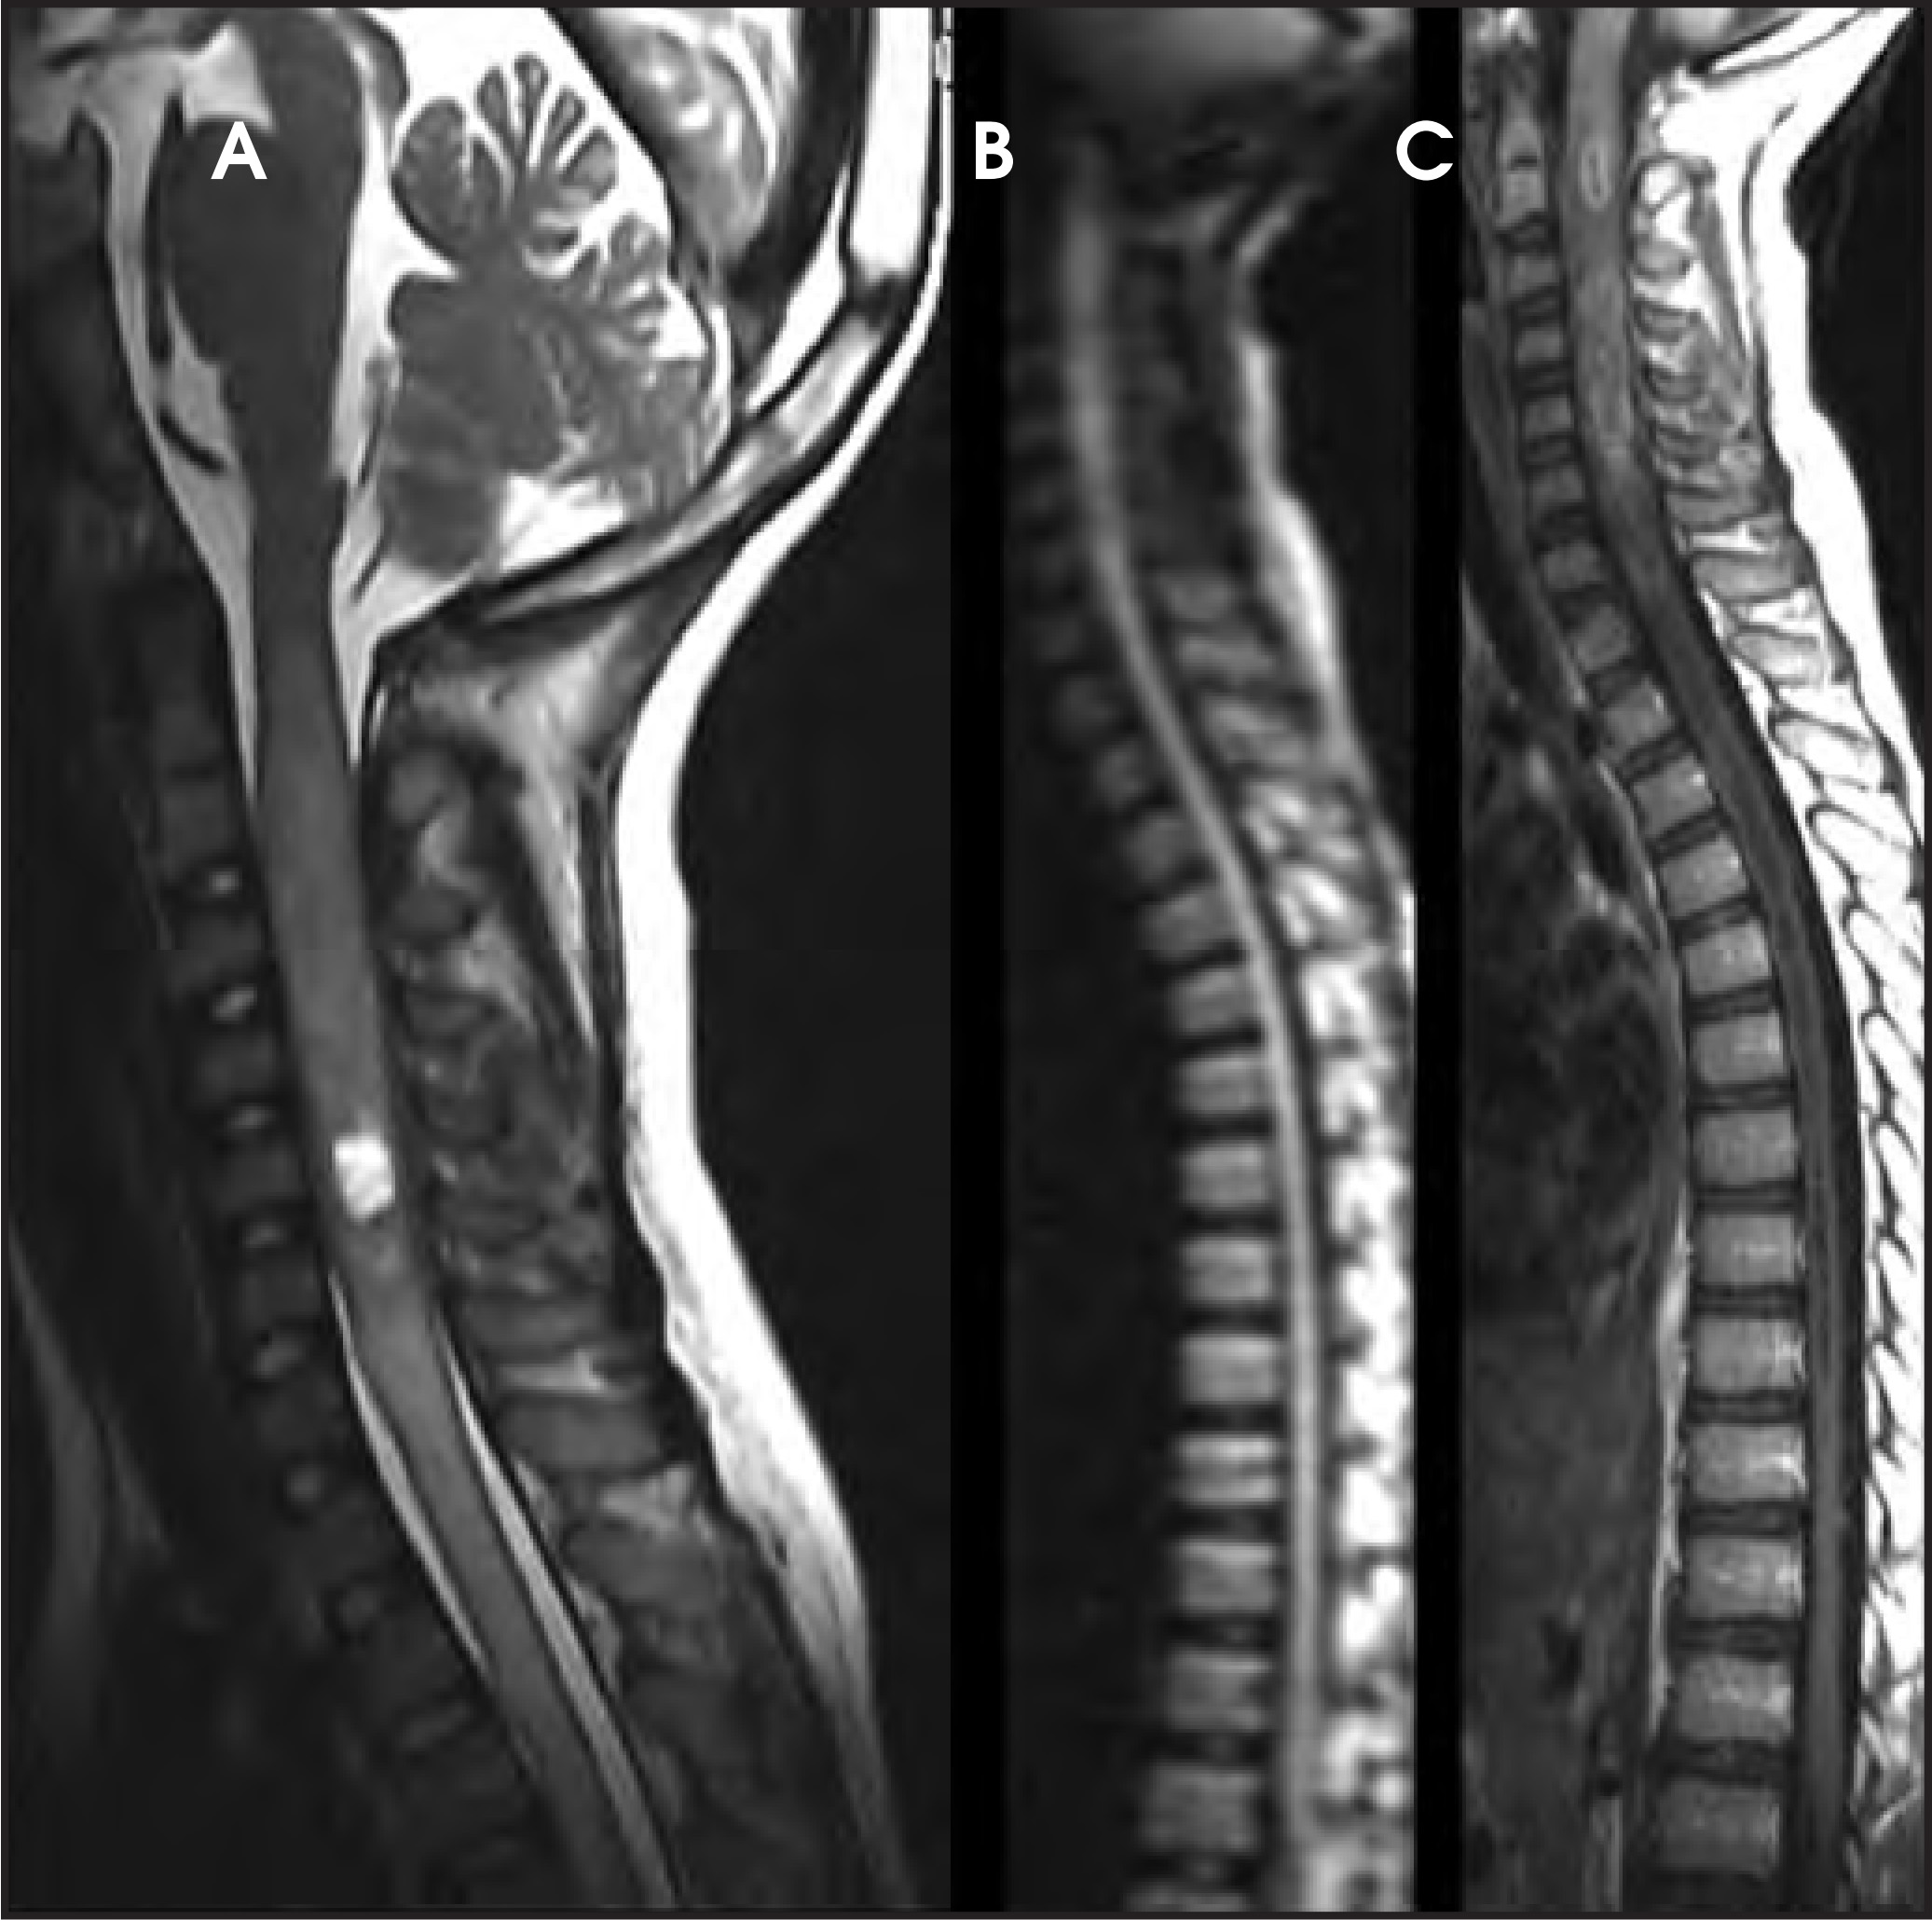
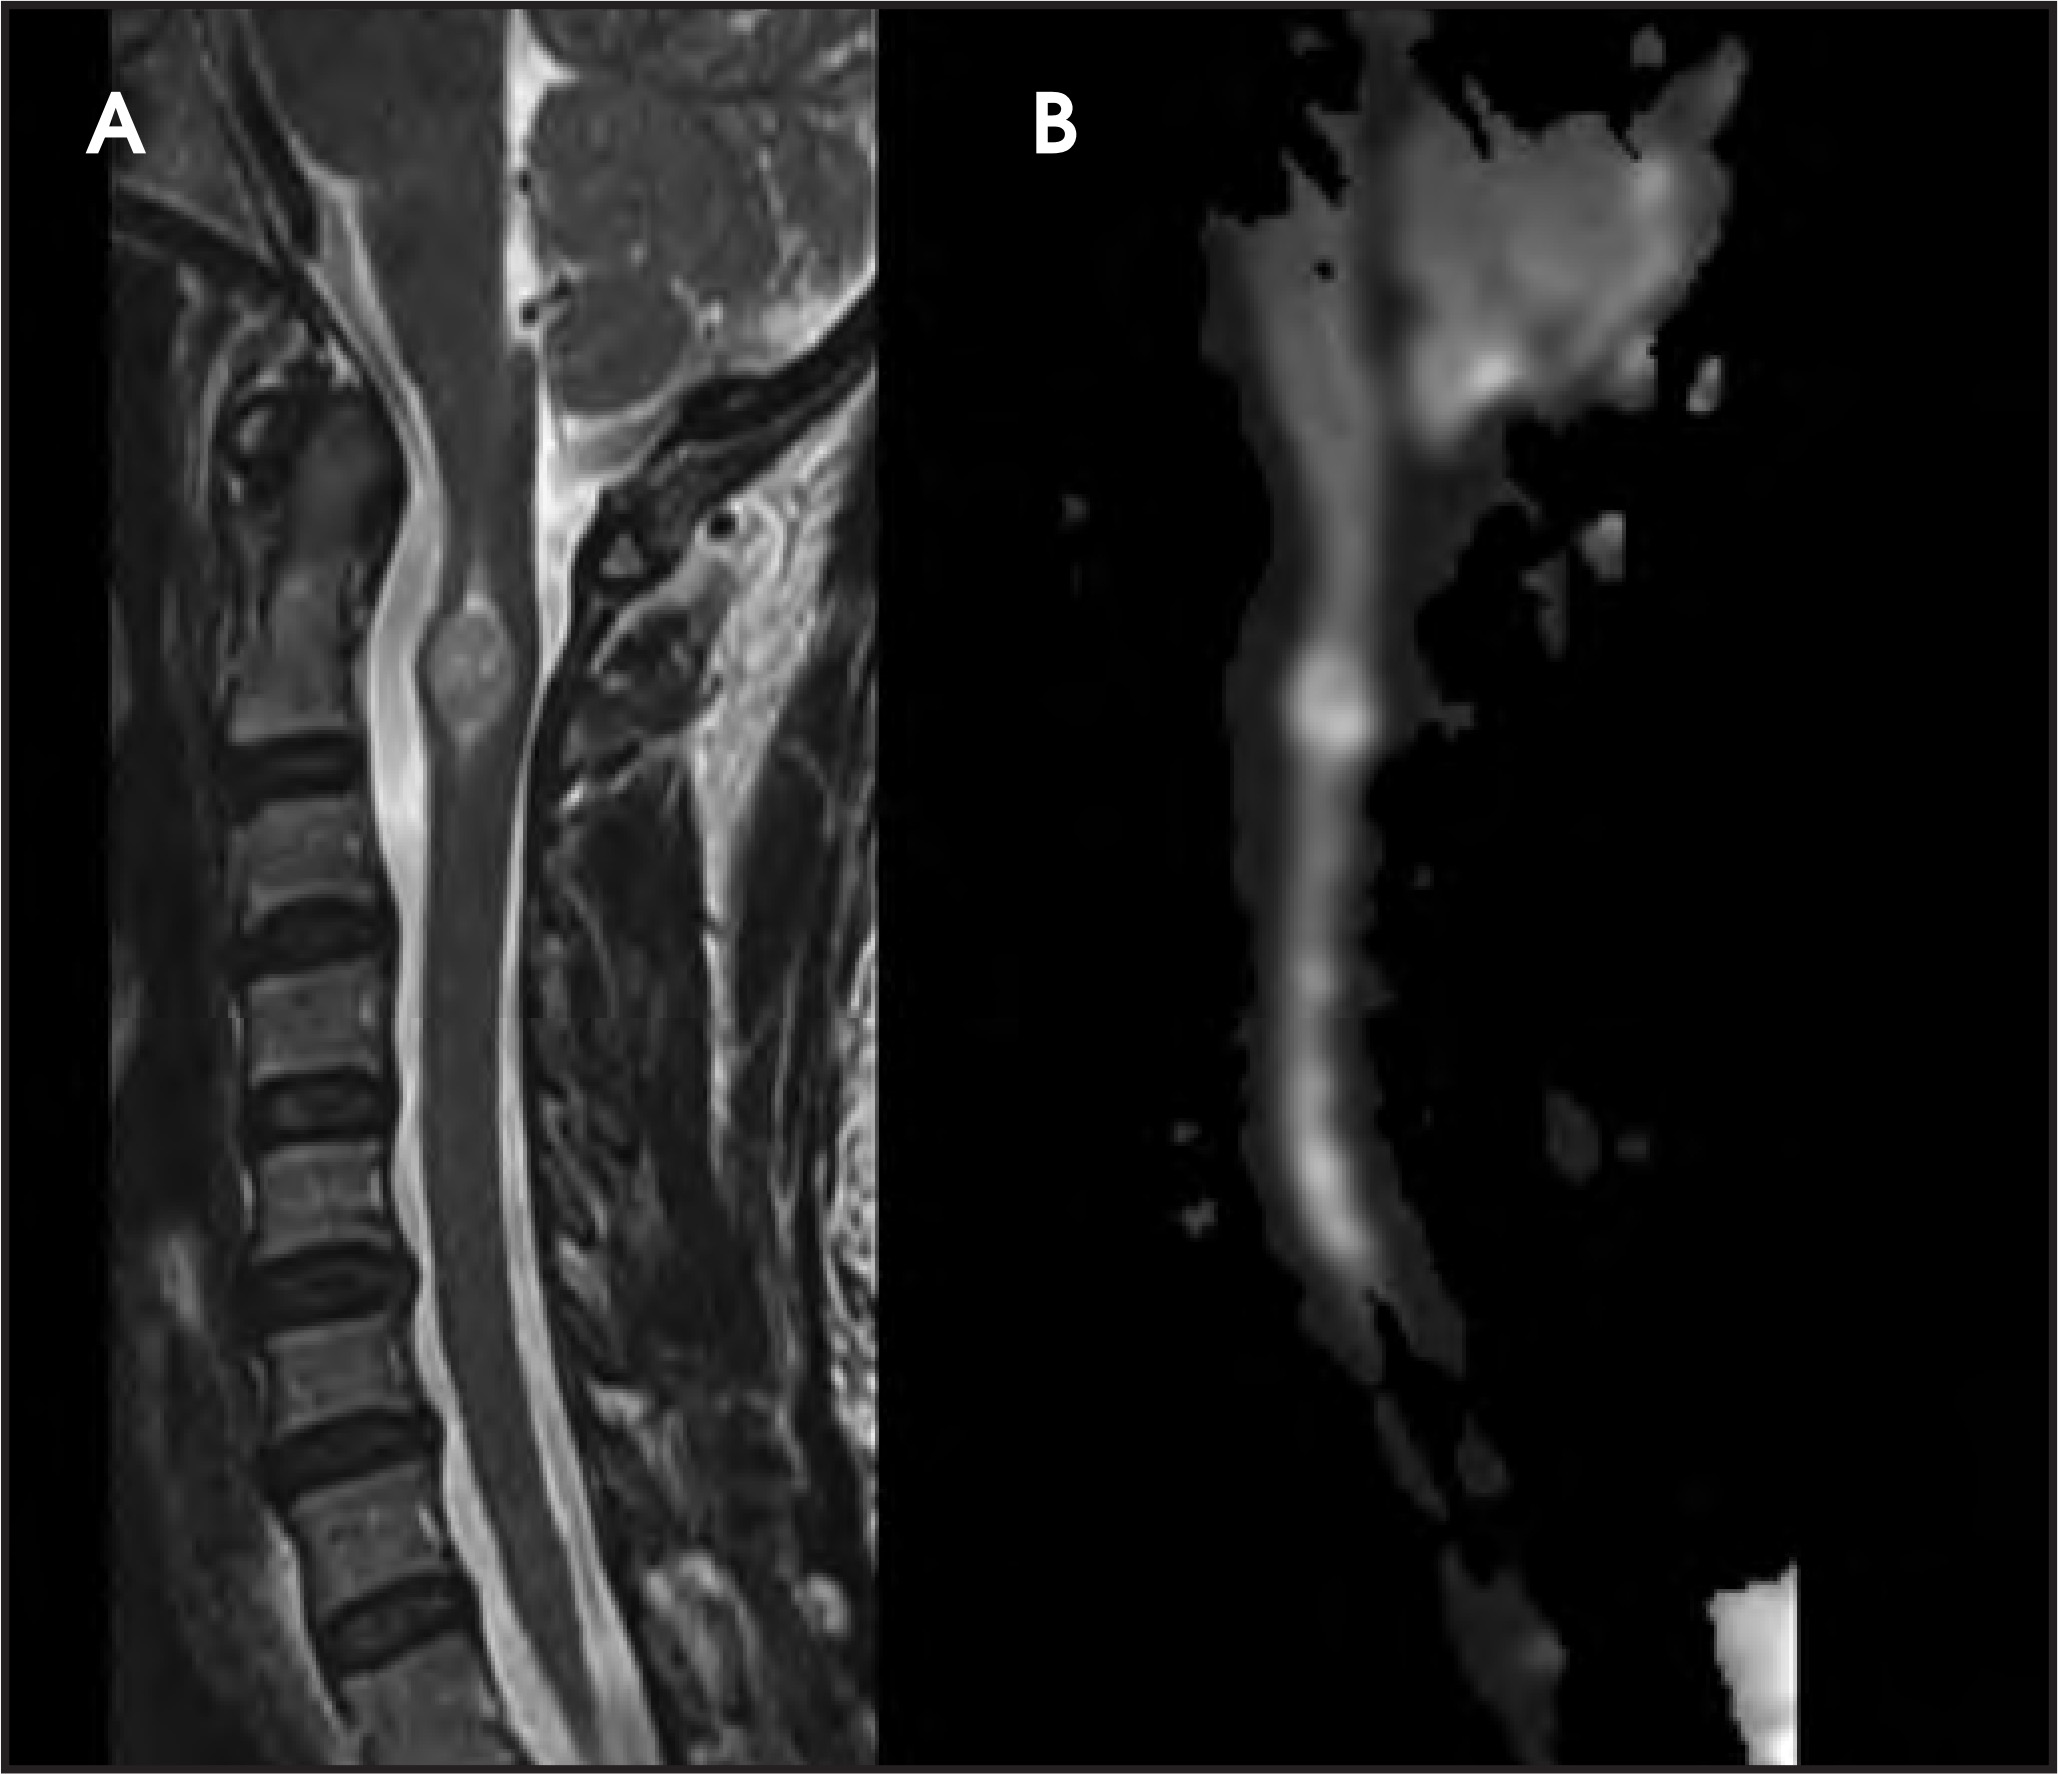
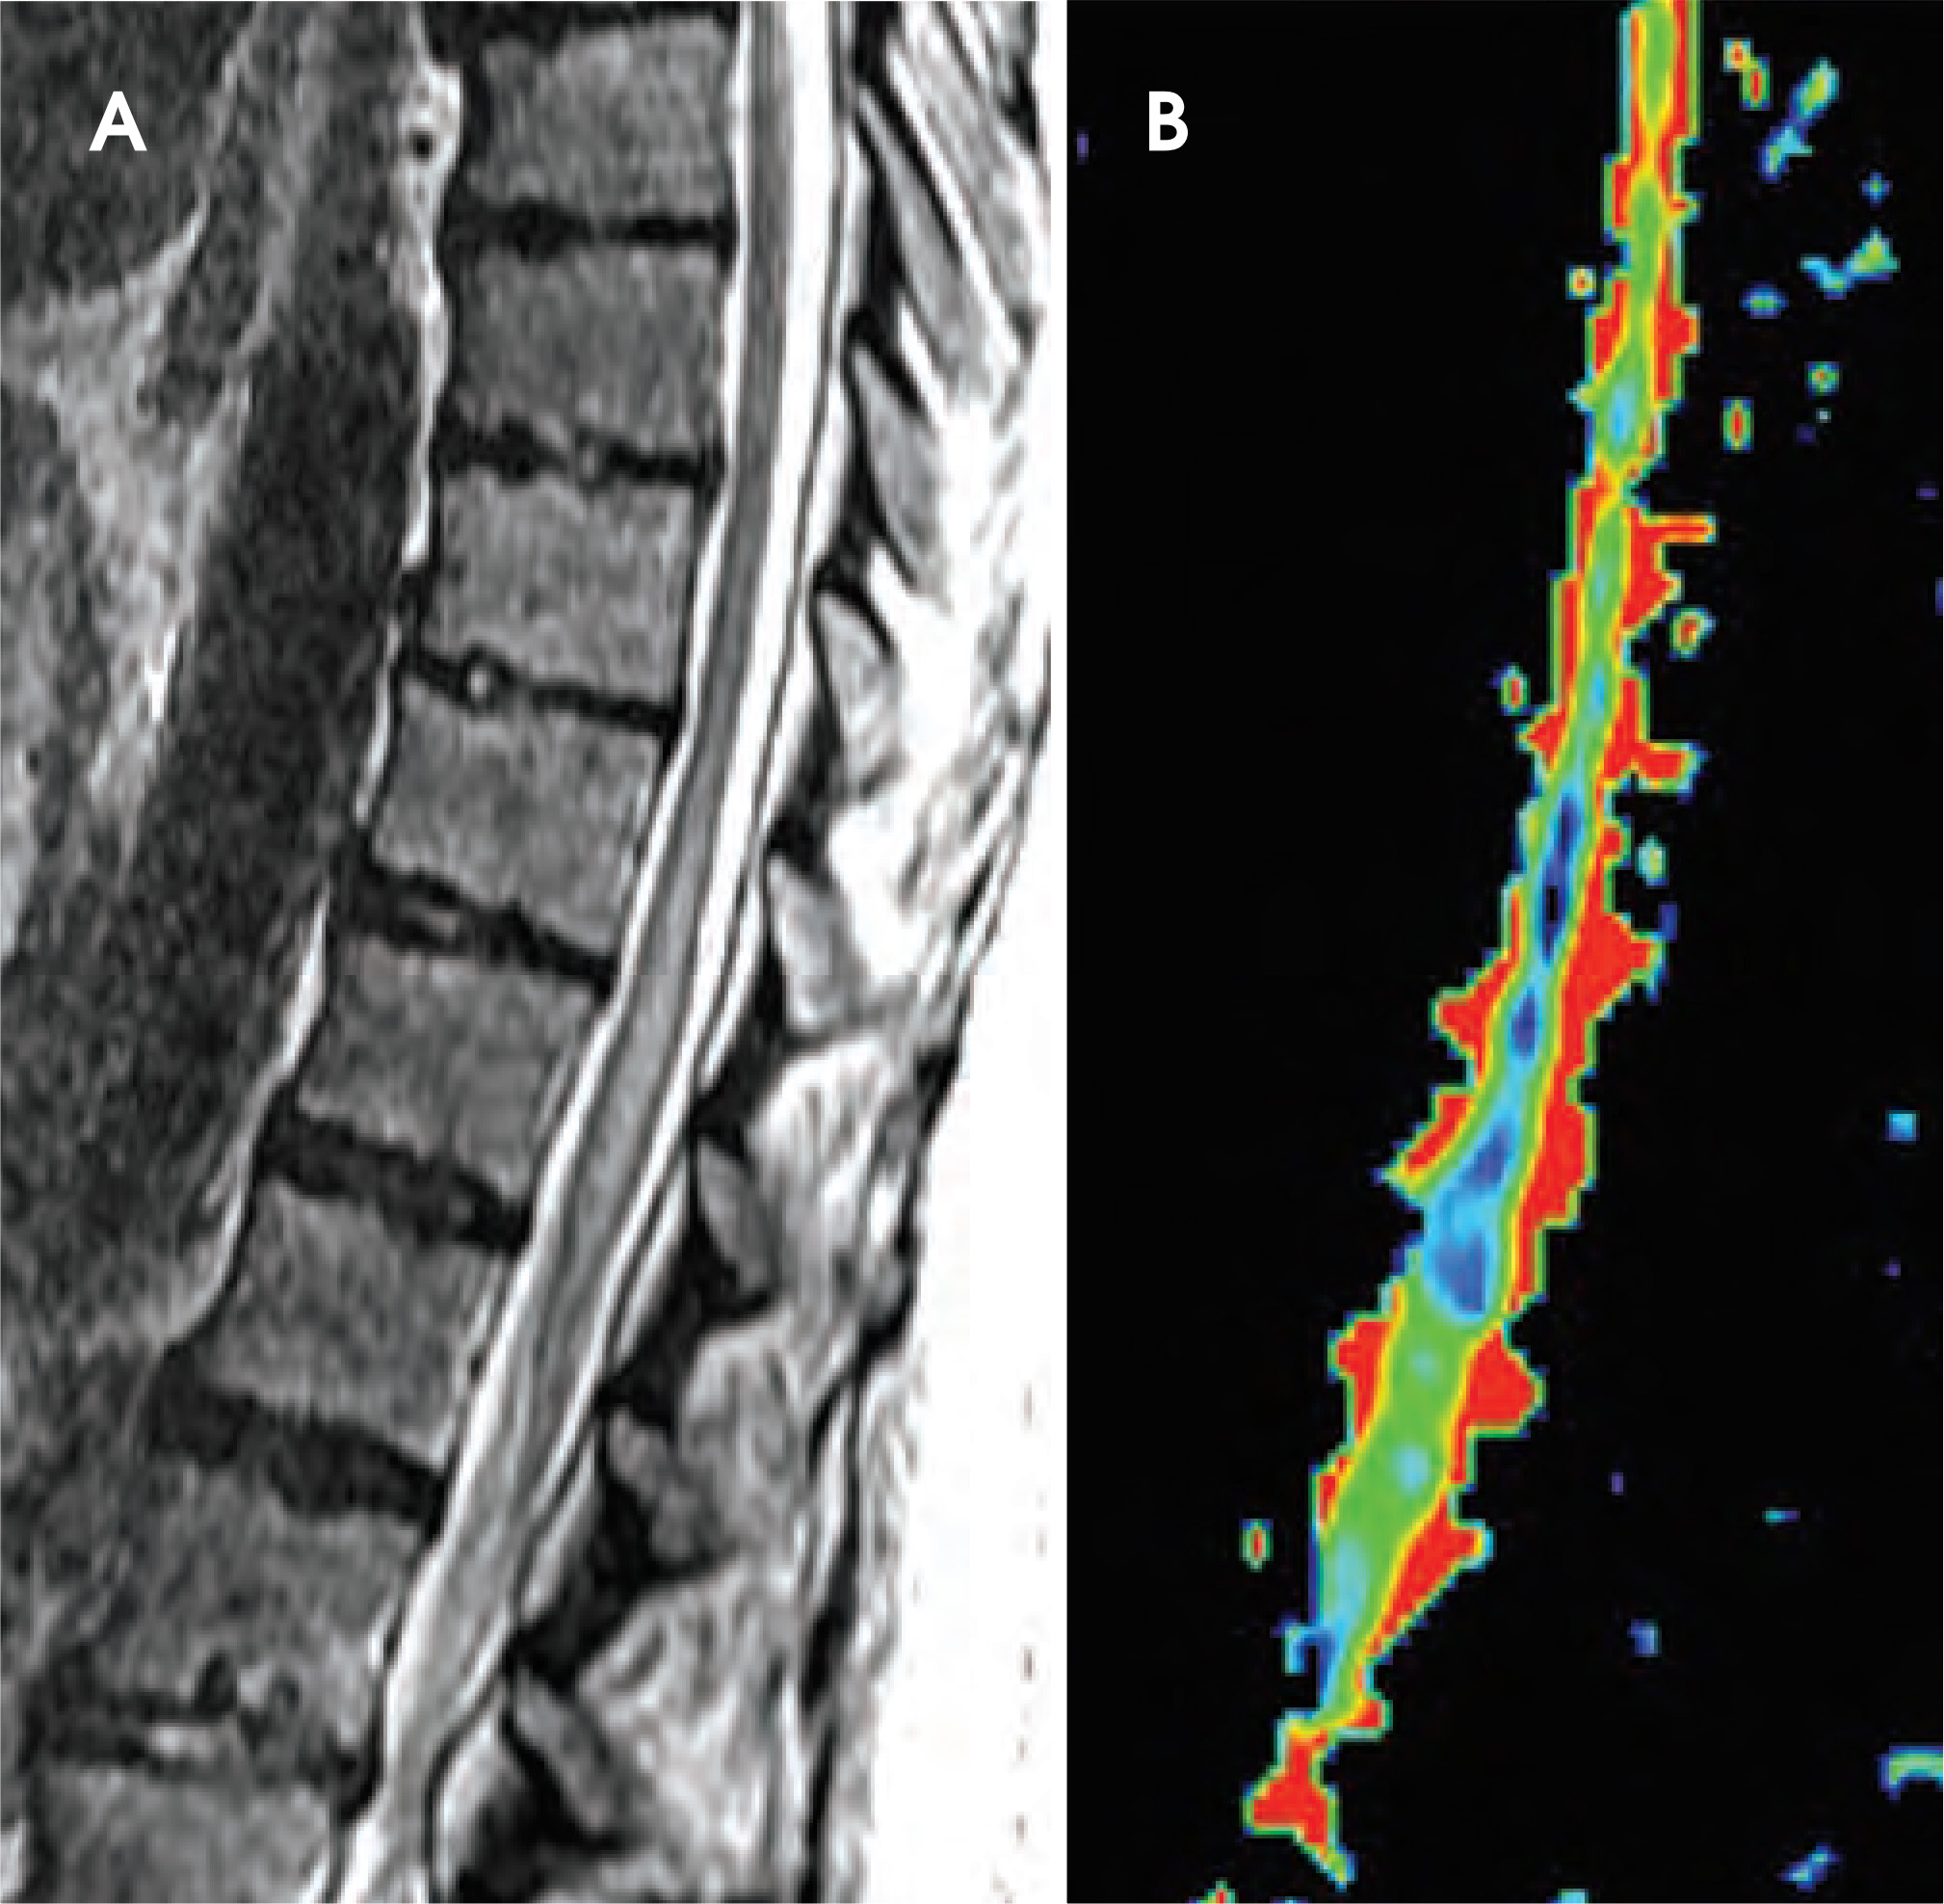
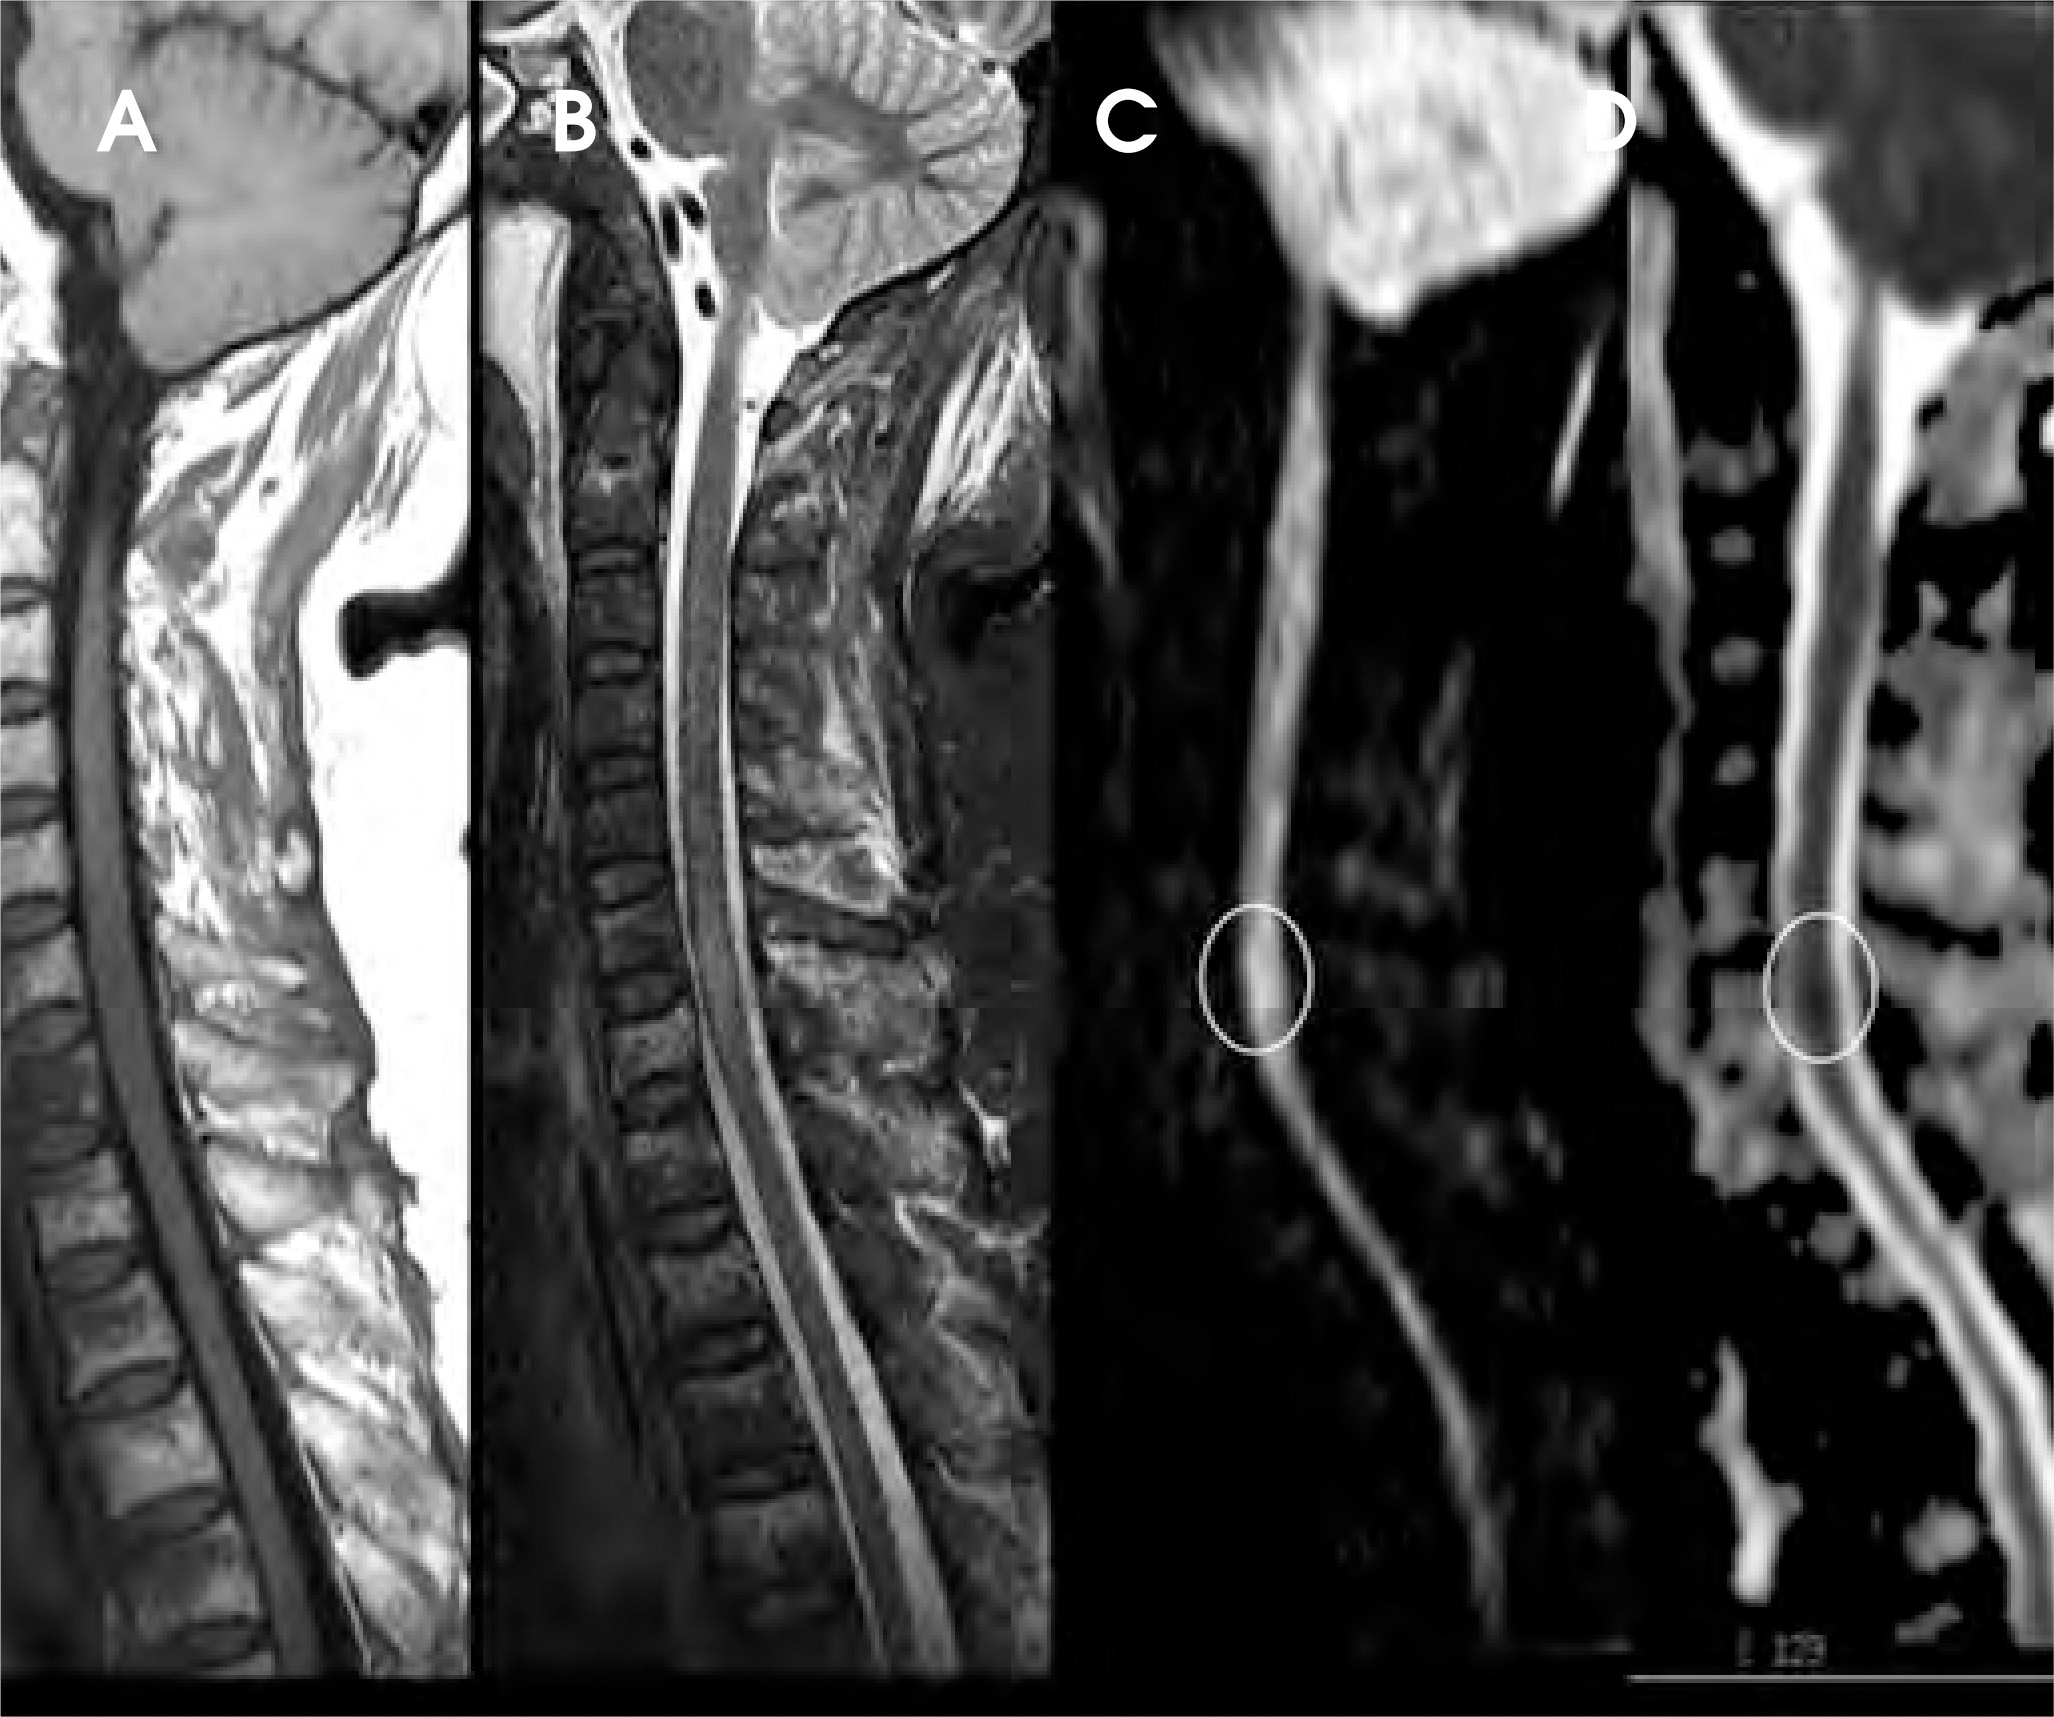
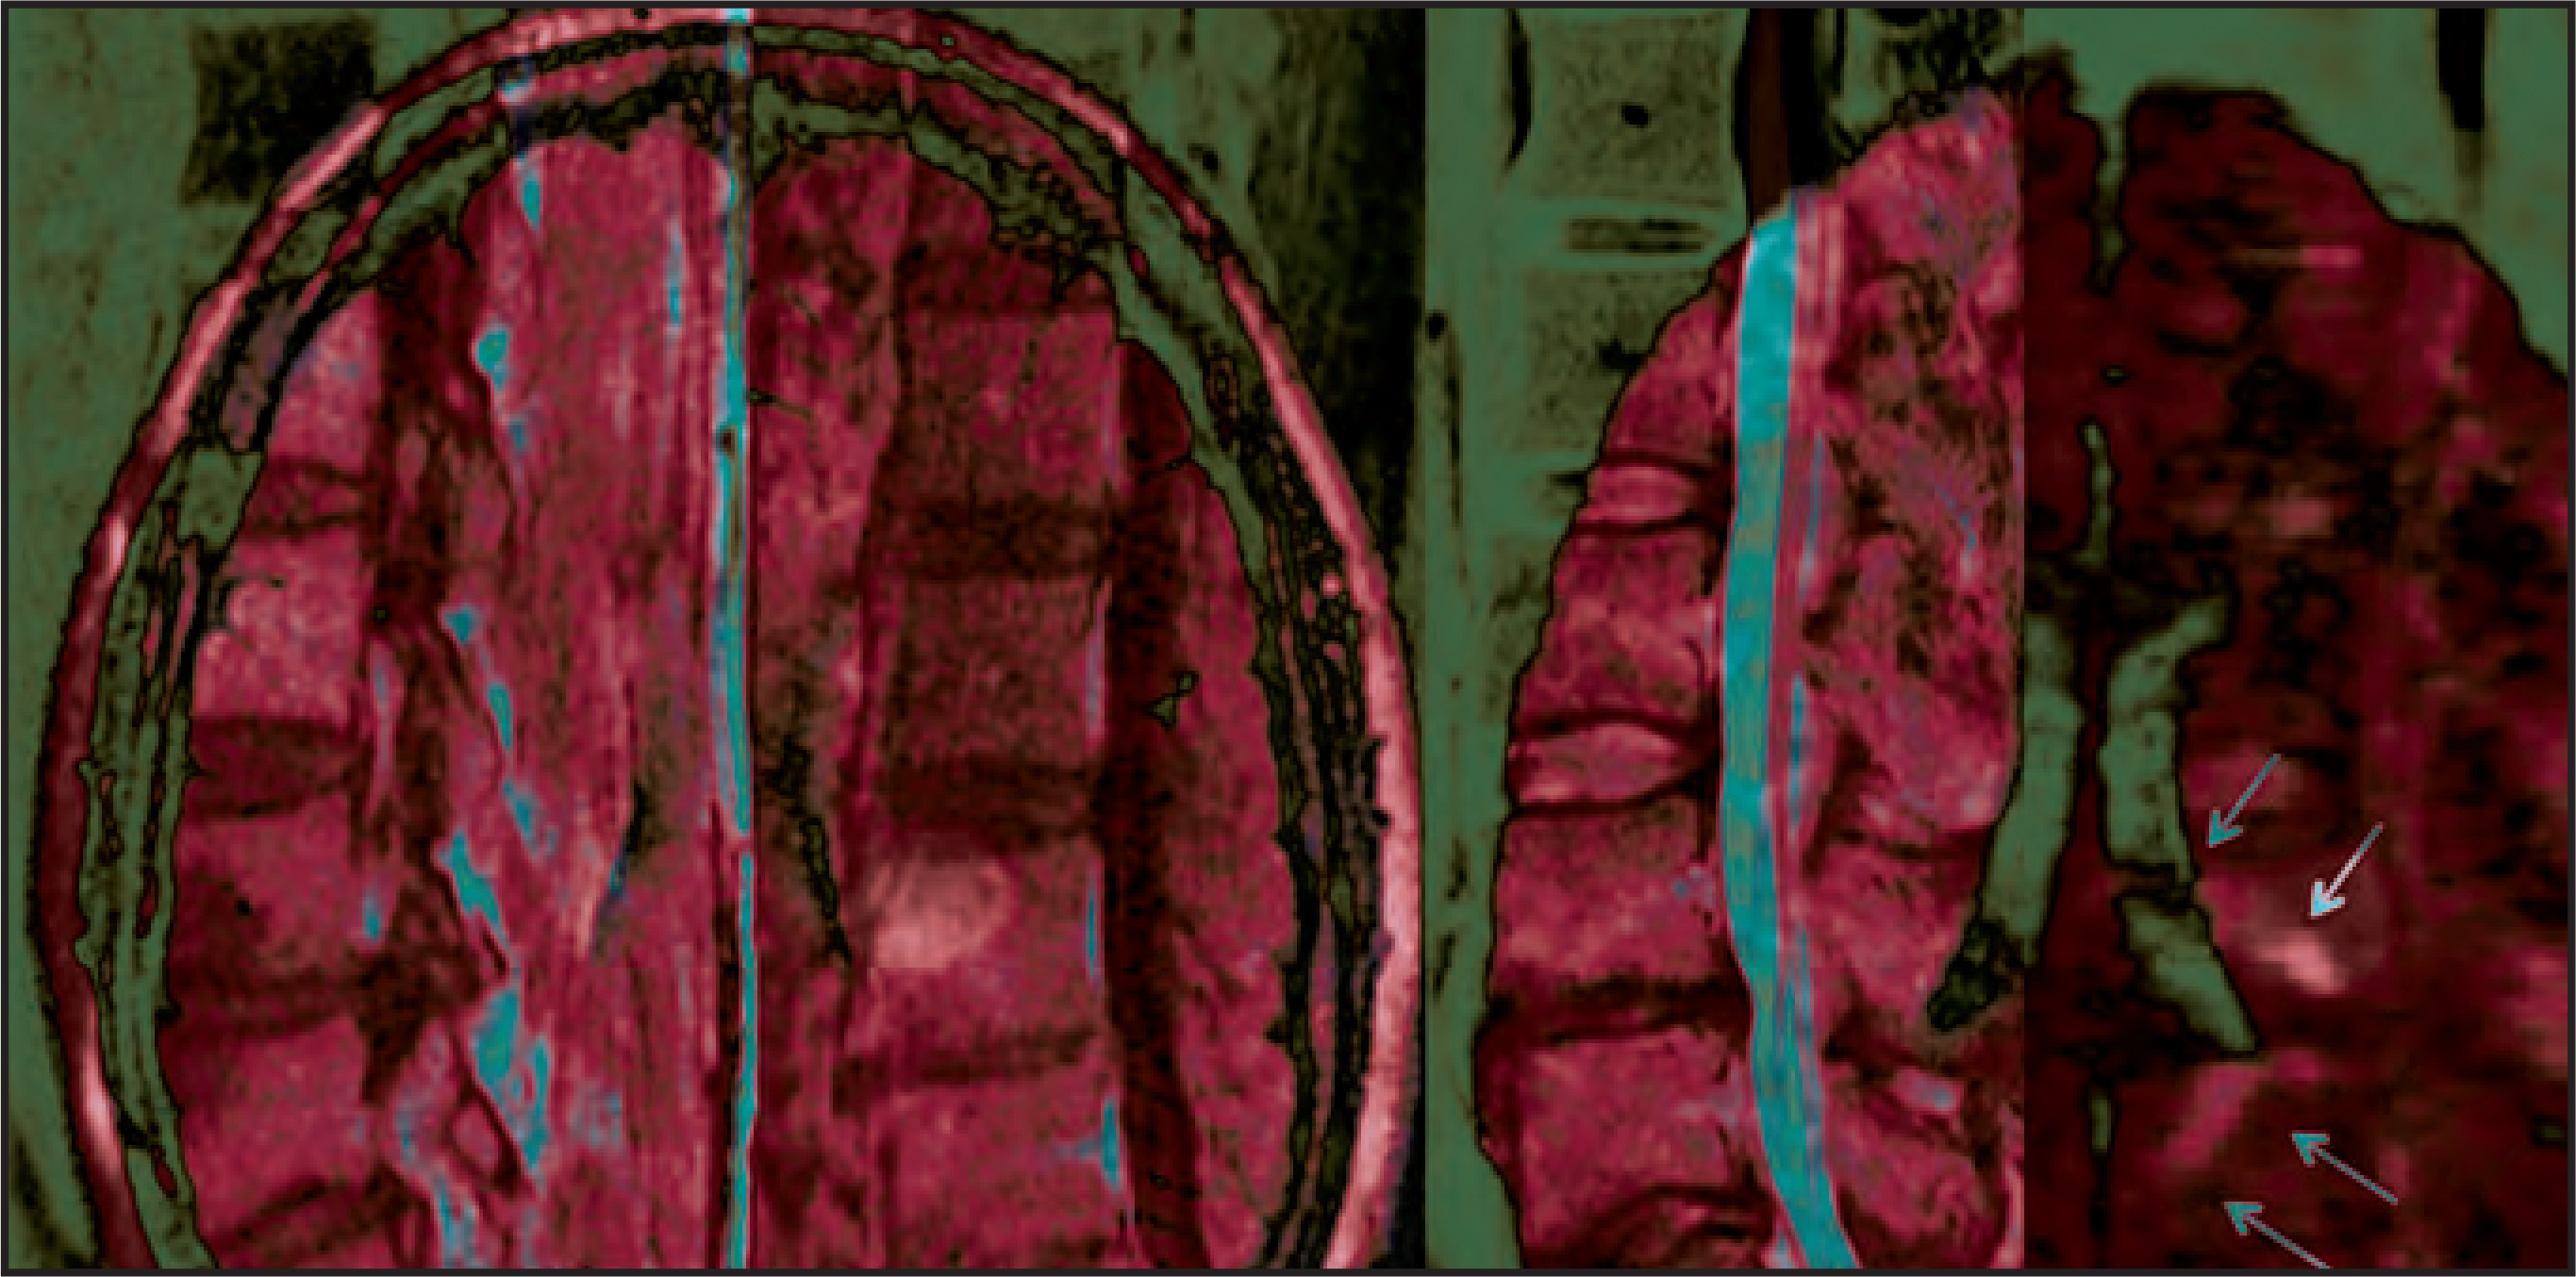
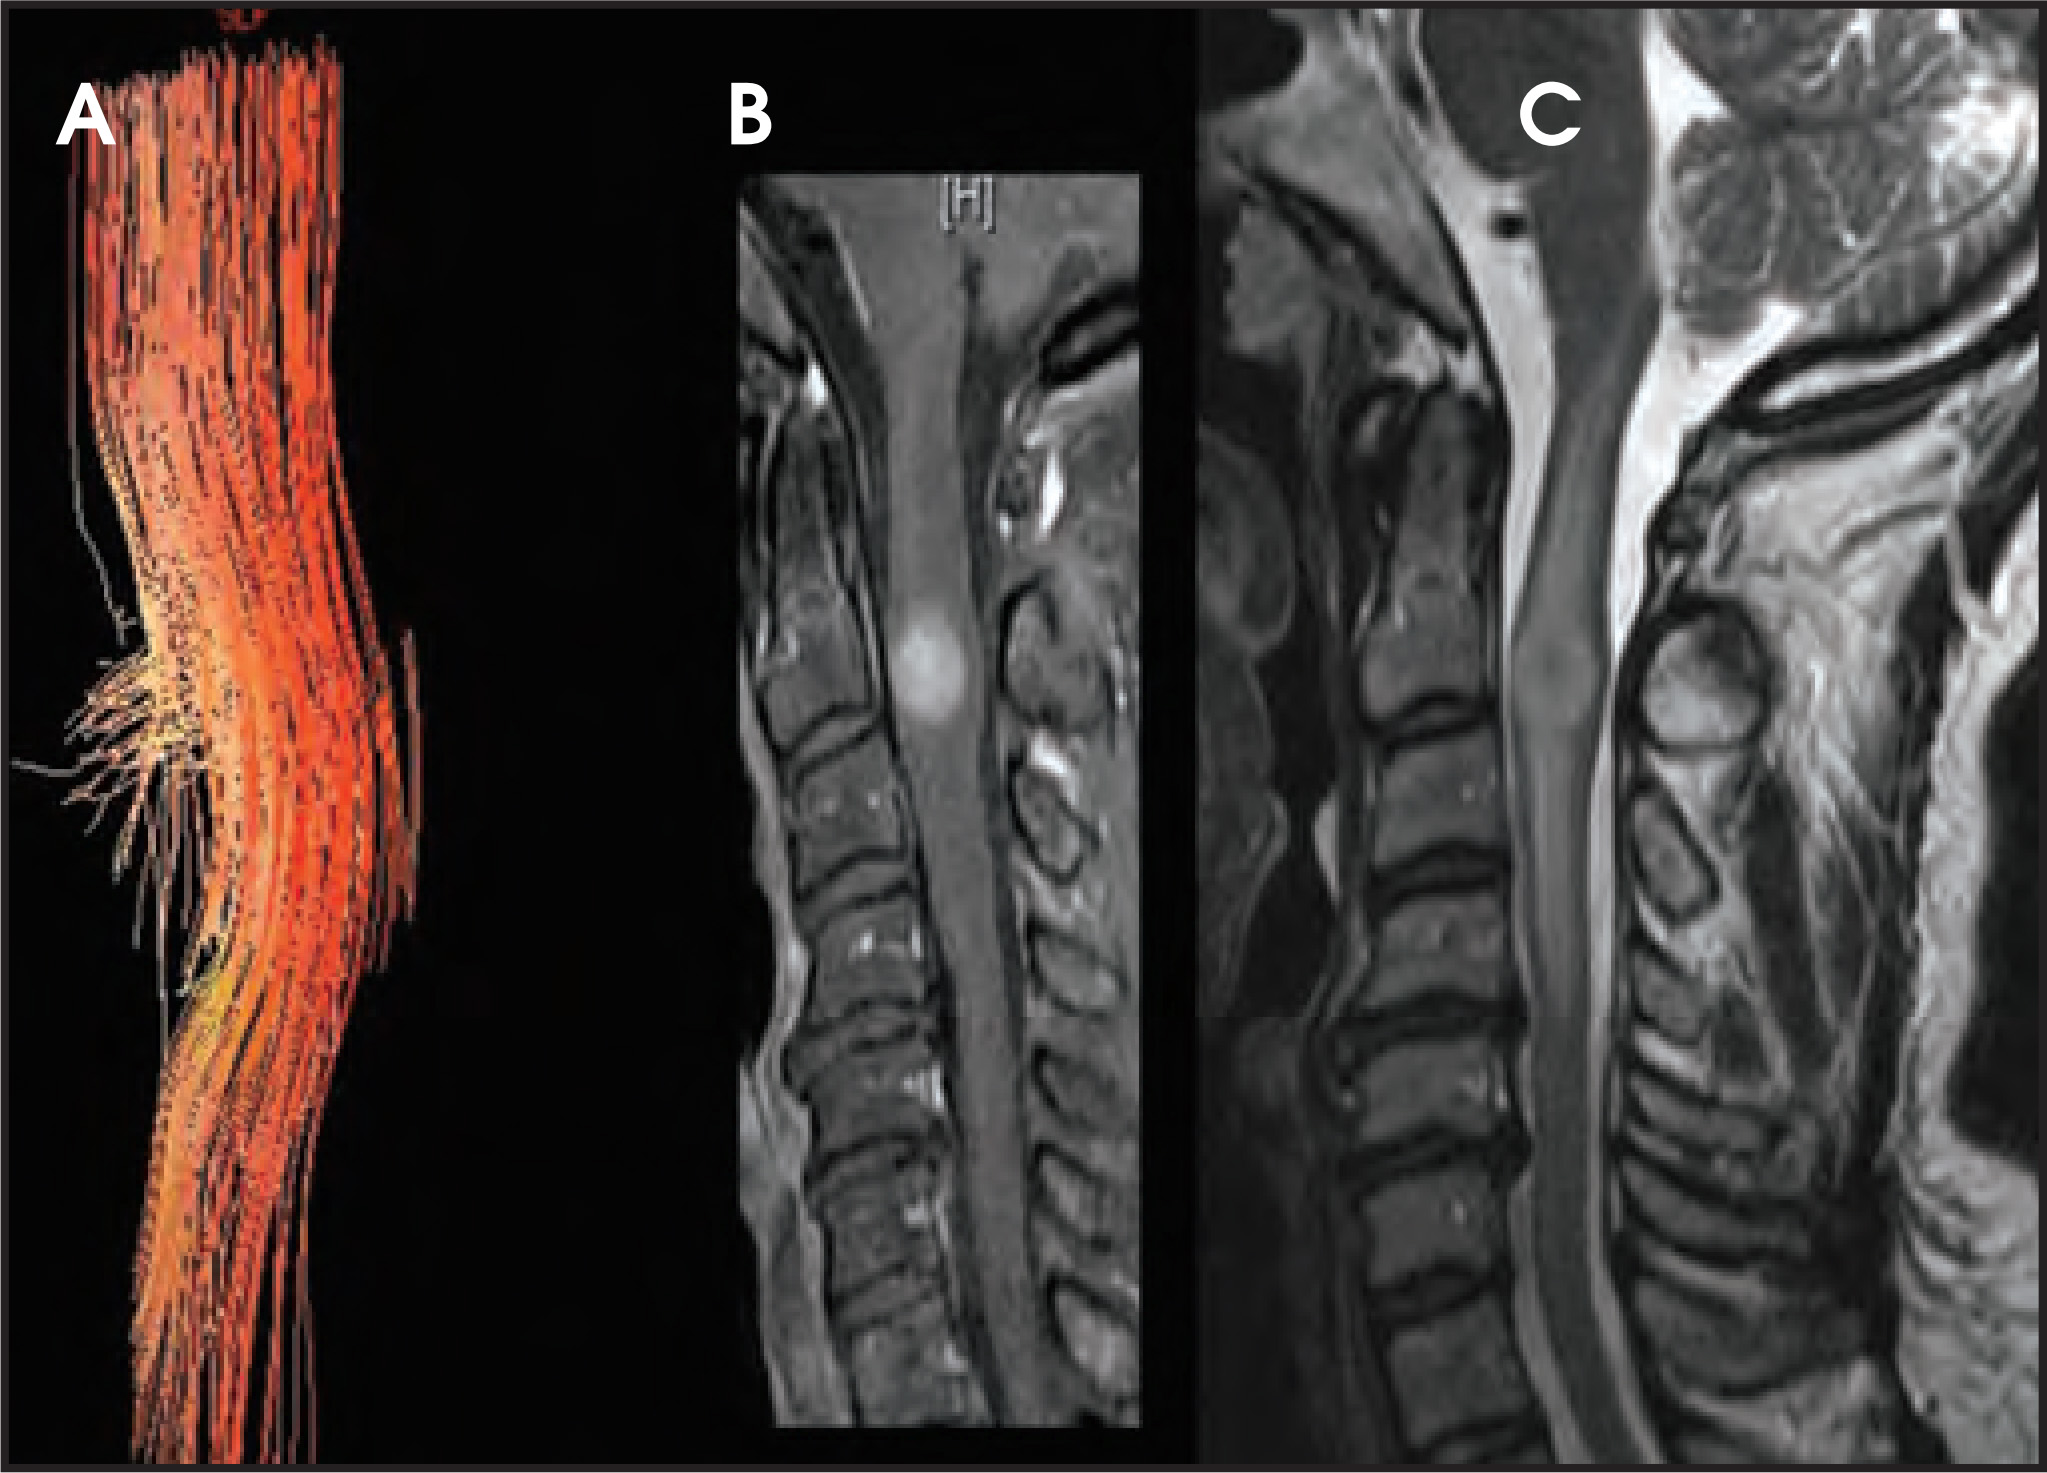
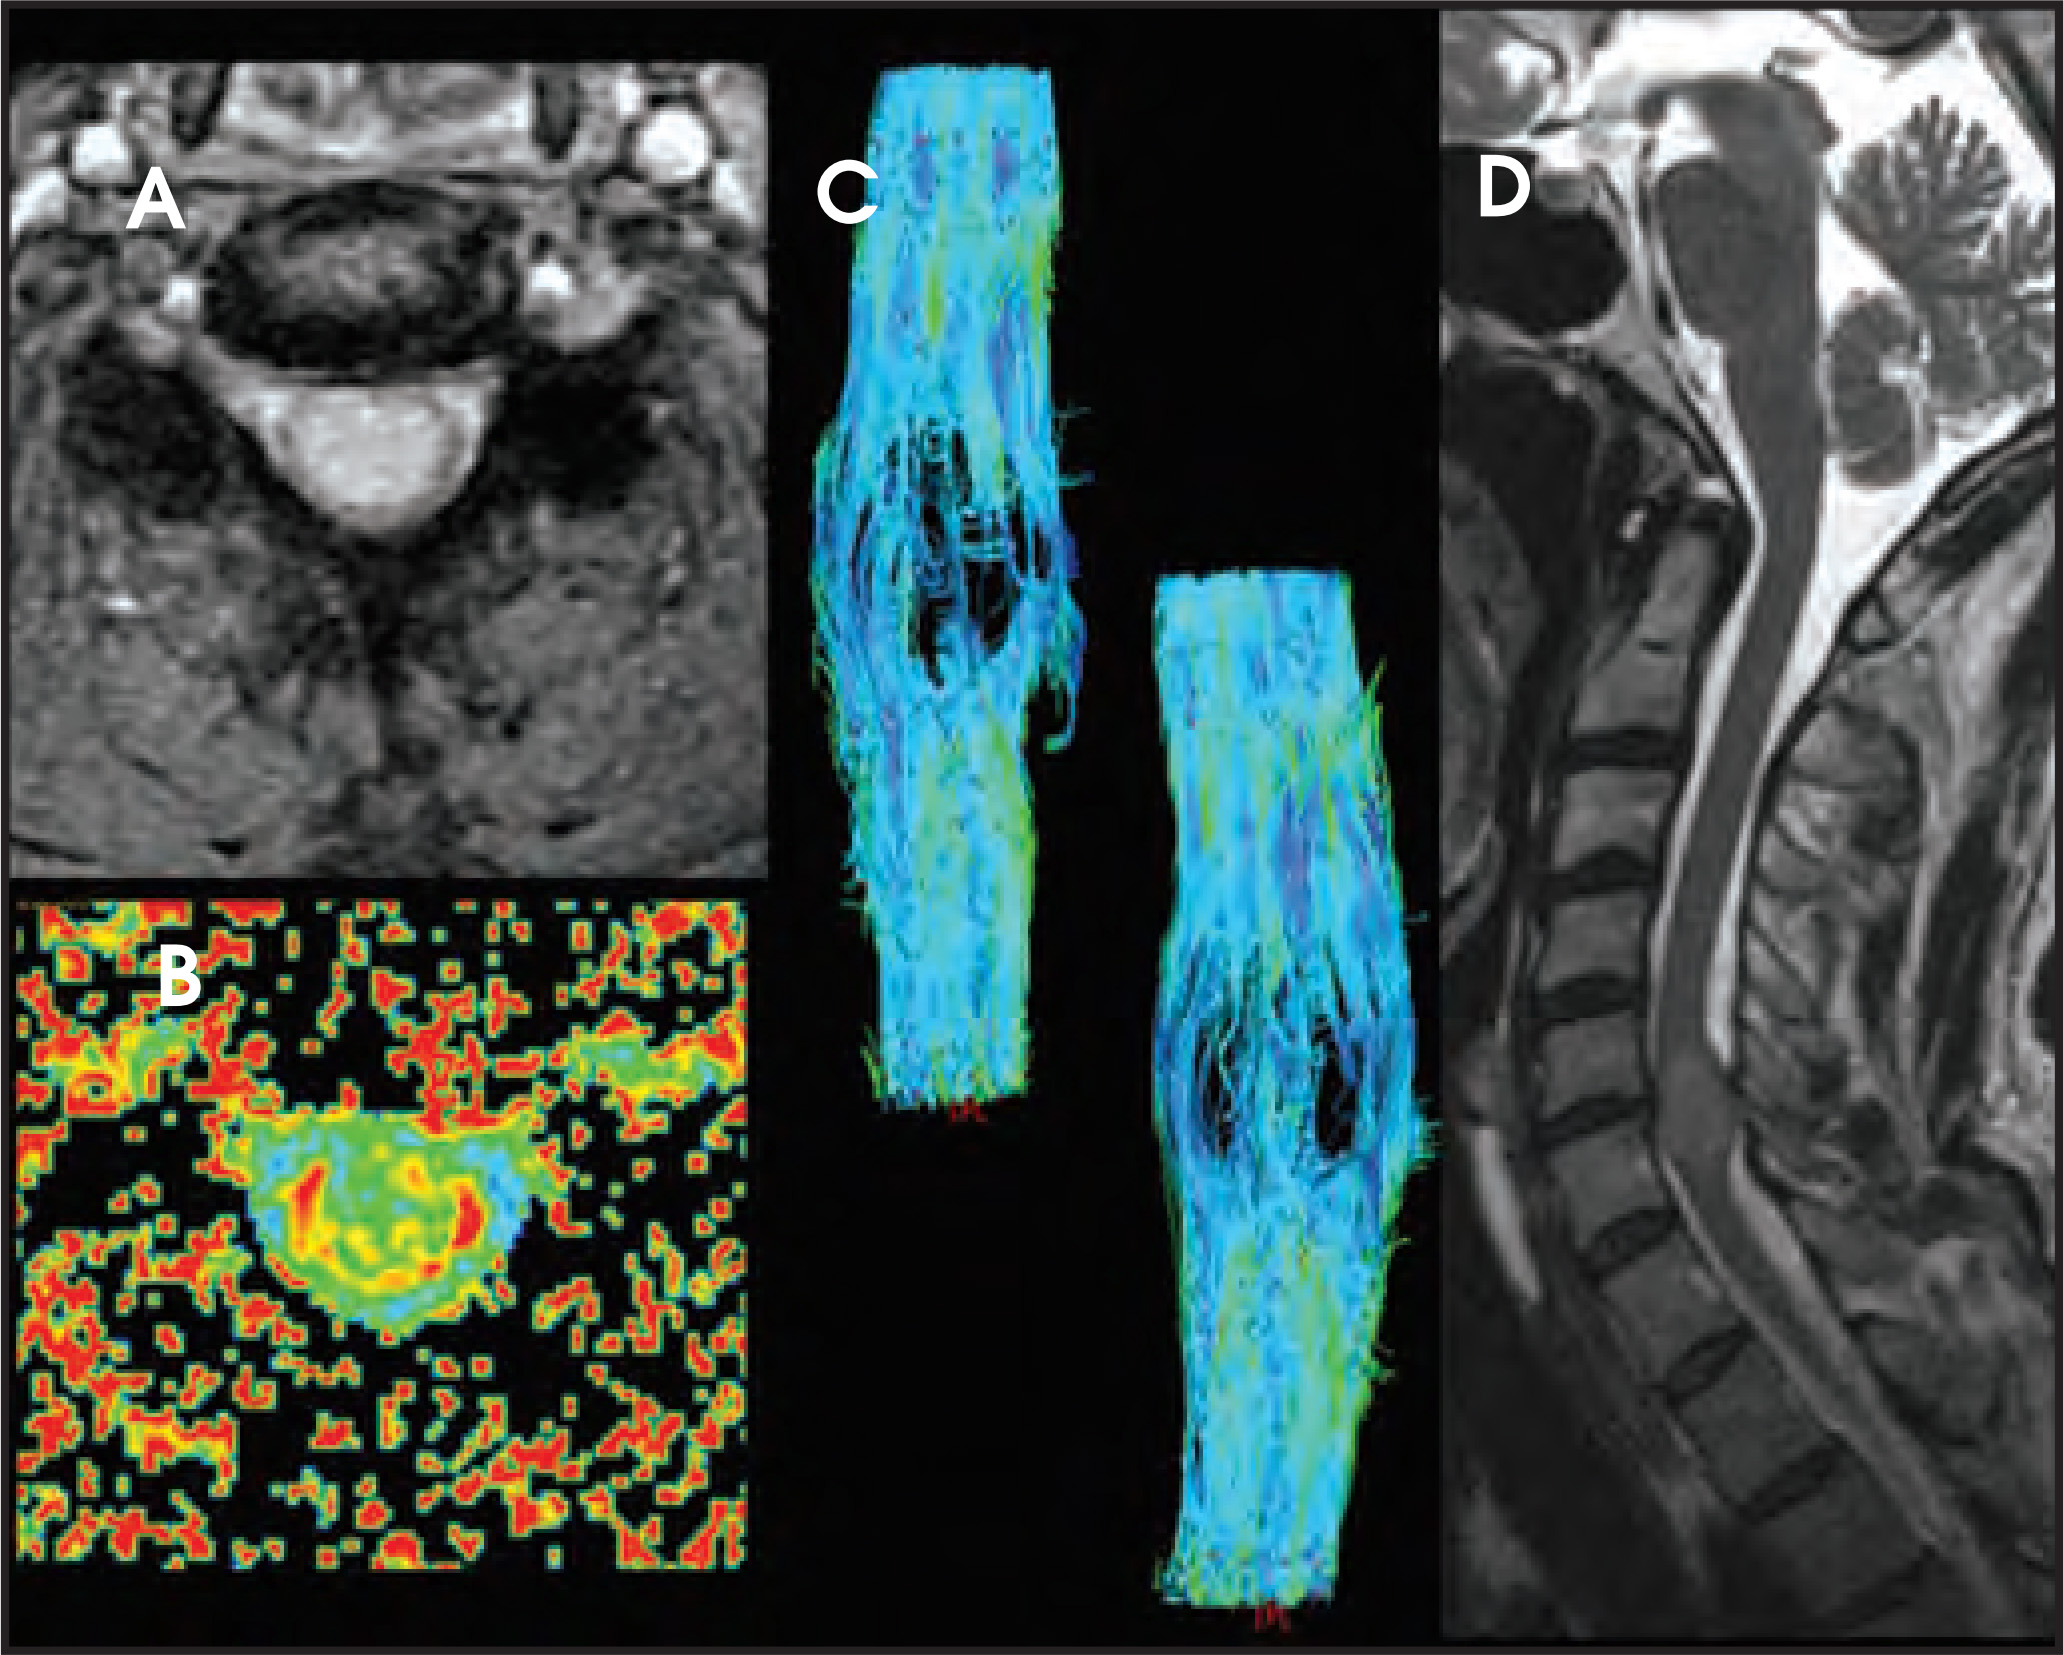
By scanning a minimum of 6 unique direction-sensitized diffusion images, one can display the diffusion tensor. Diffusion tensor imaging (DTI) assists in assessing the integrity and orientation of white matter tracts leveraging their inherent ordering or anisotropy. This can give insight into the present and extent of myelopathic changes that may be too subtle for routine imaging to reveal (Figures 9 and 10). Diffusion tensor myelograms (DTM) can be helpful in localizing lesions as intrinsic or extrinsic to the cord and refining differential diagnosis (Figure 11). DTM may also be helpful in differentiation between types of intramedullary lesions by displaying displacement rather than infiltration of cord fibers (Figure 12).
Extradural lesions
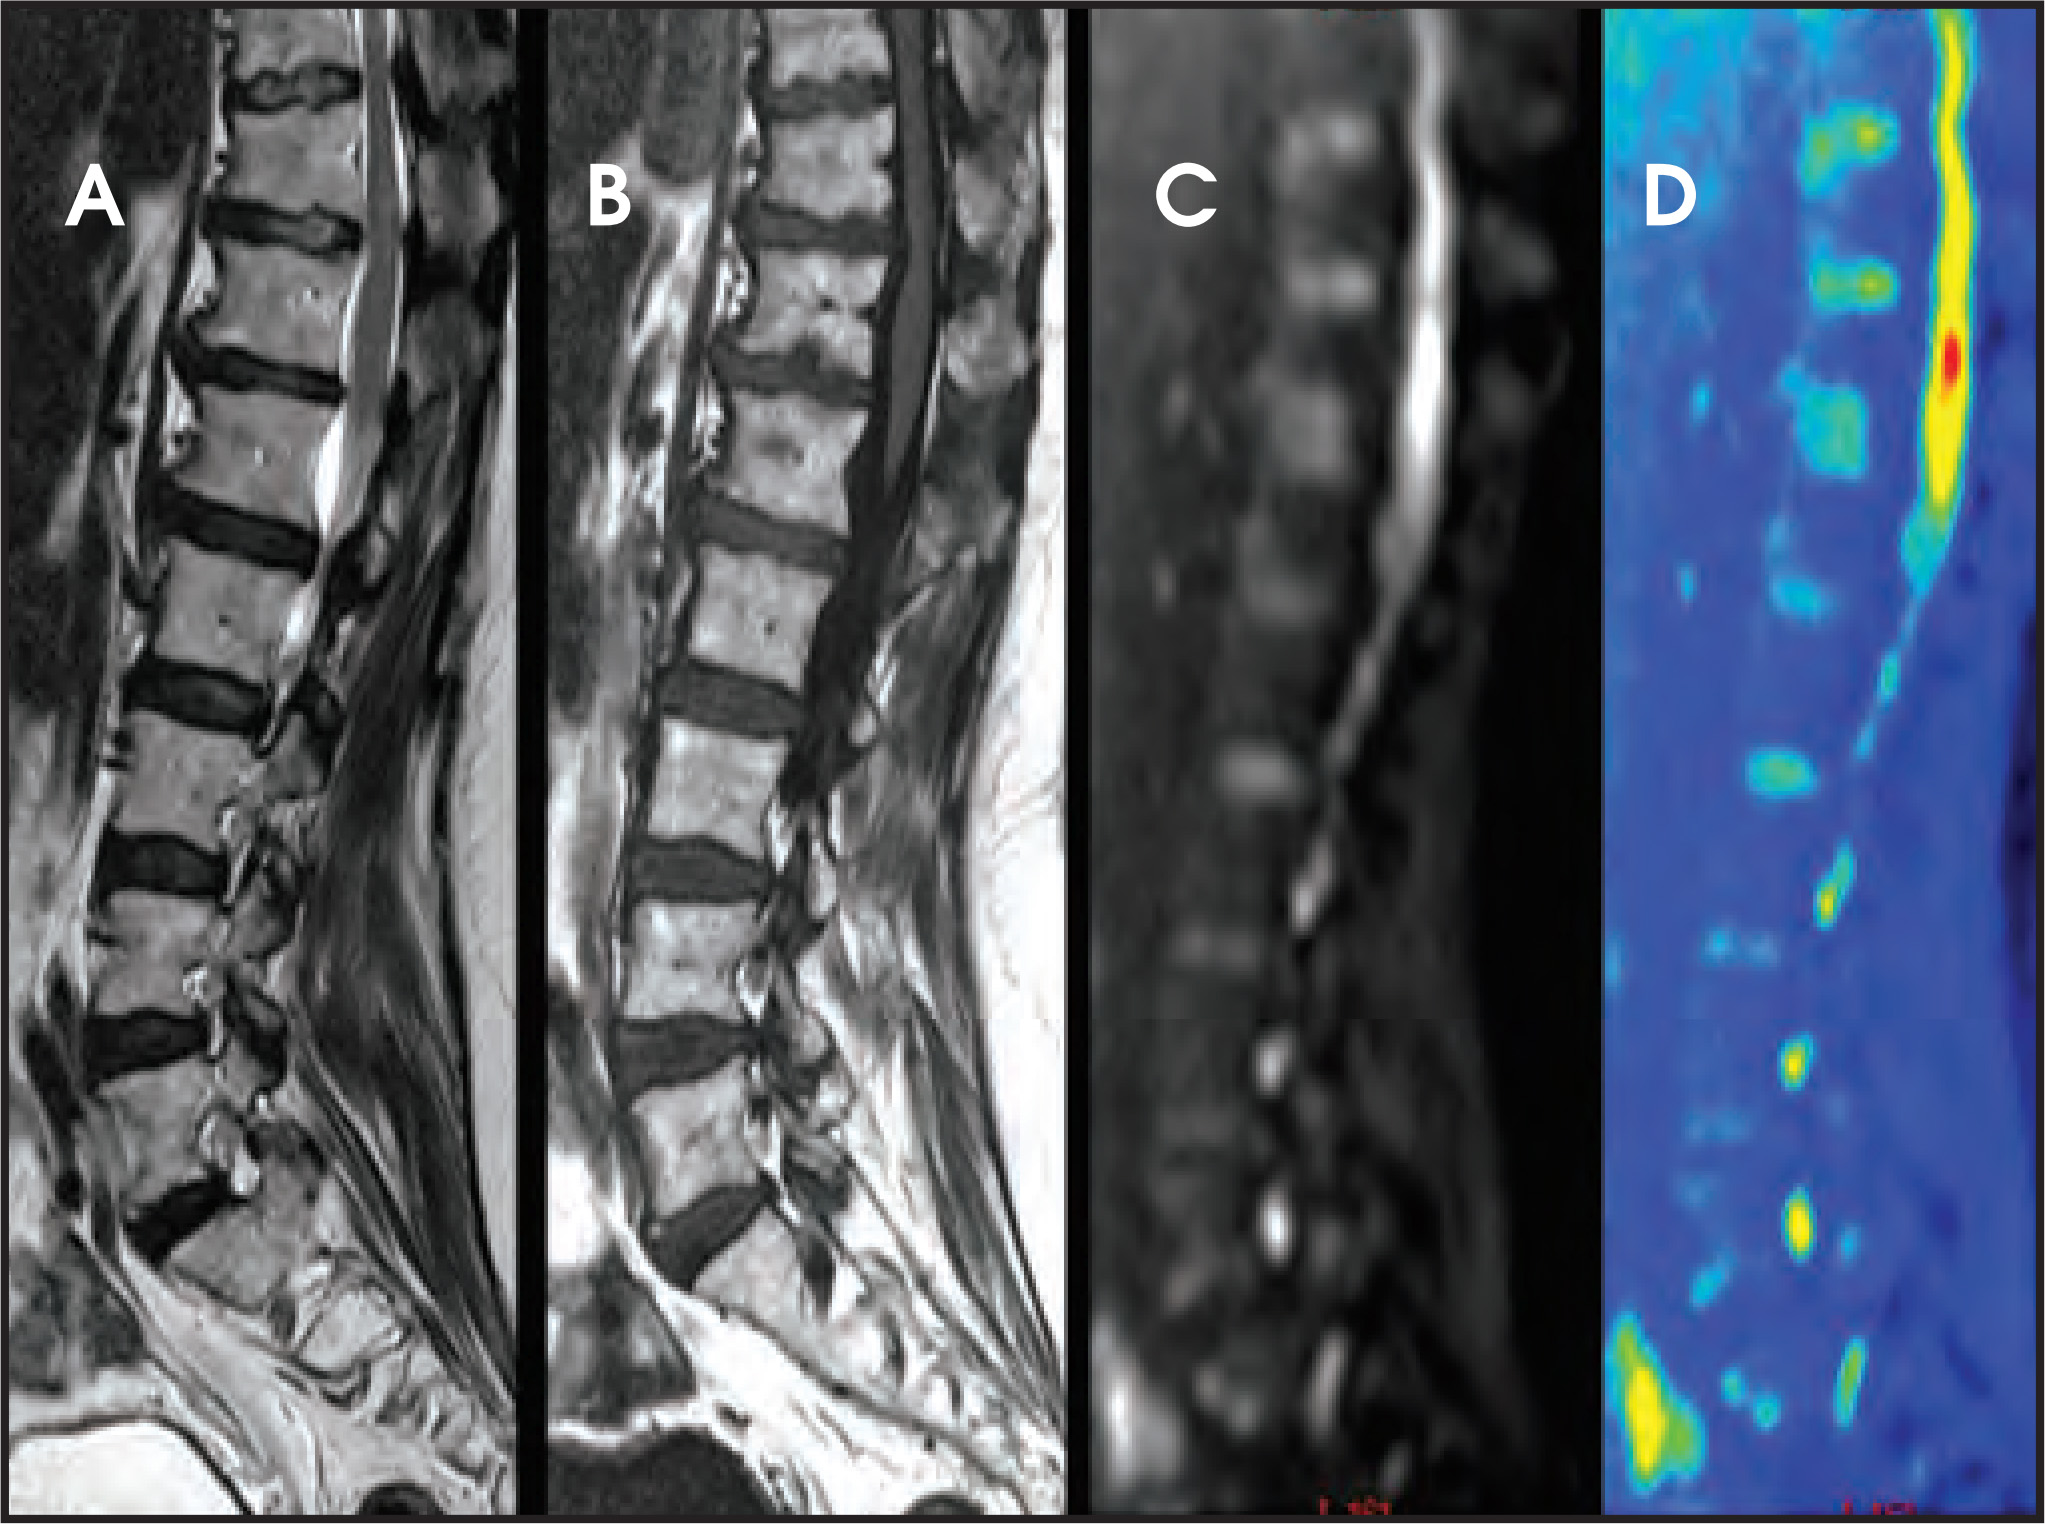
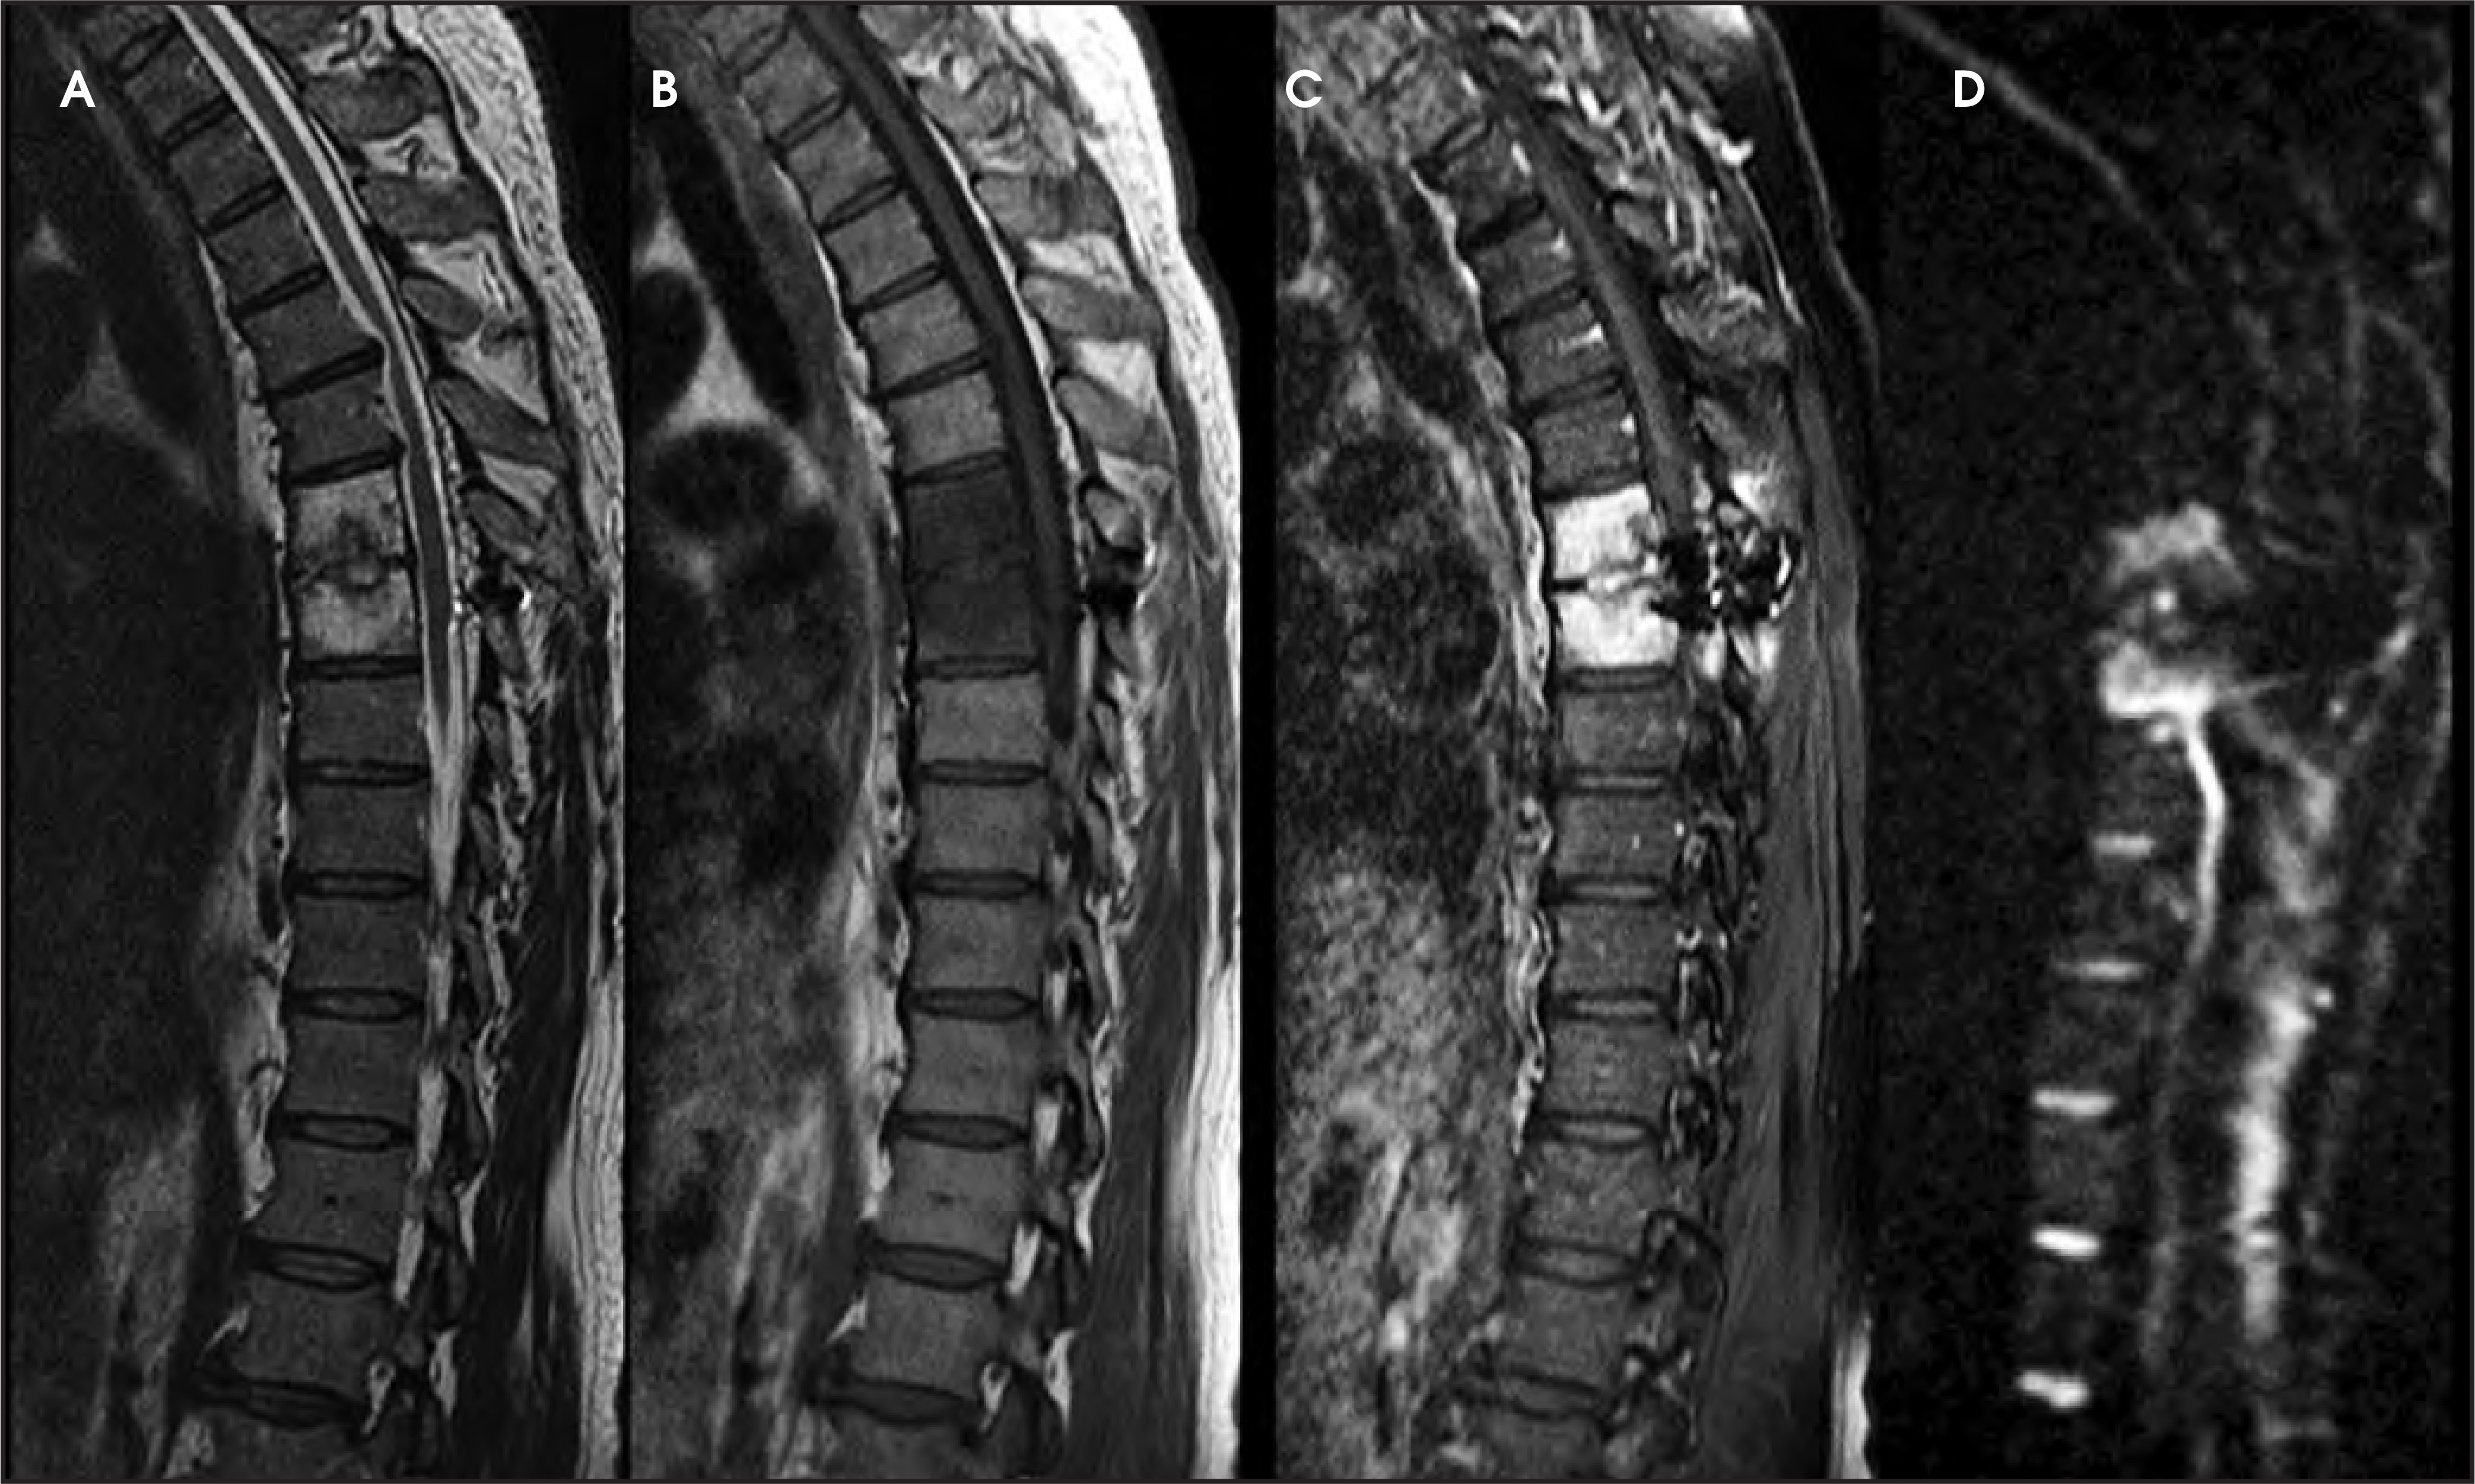
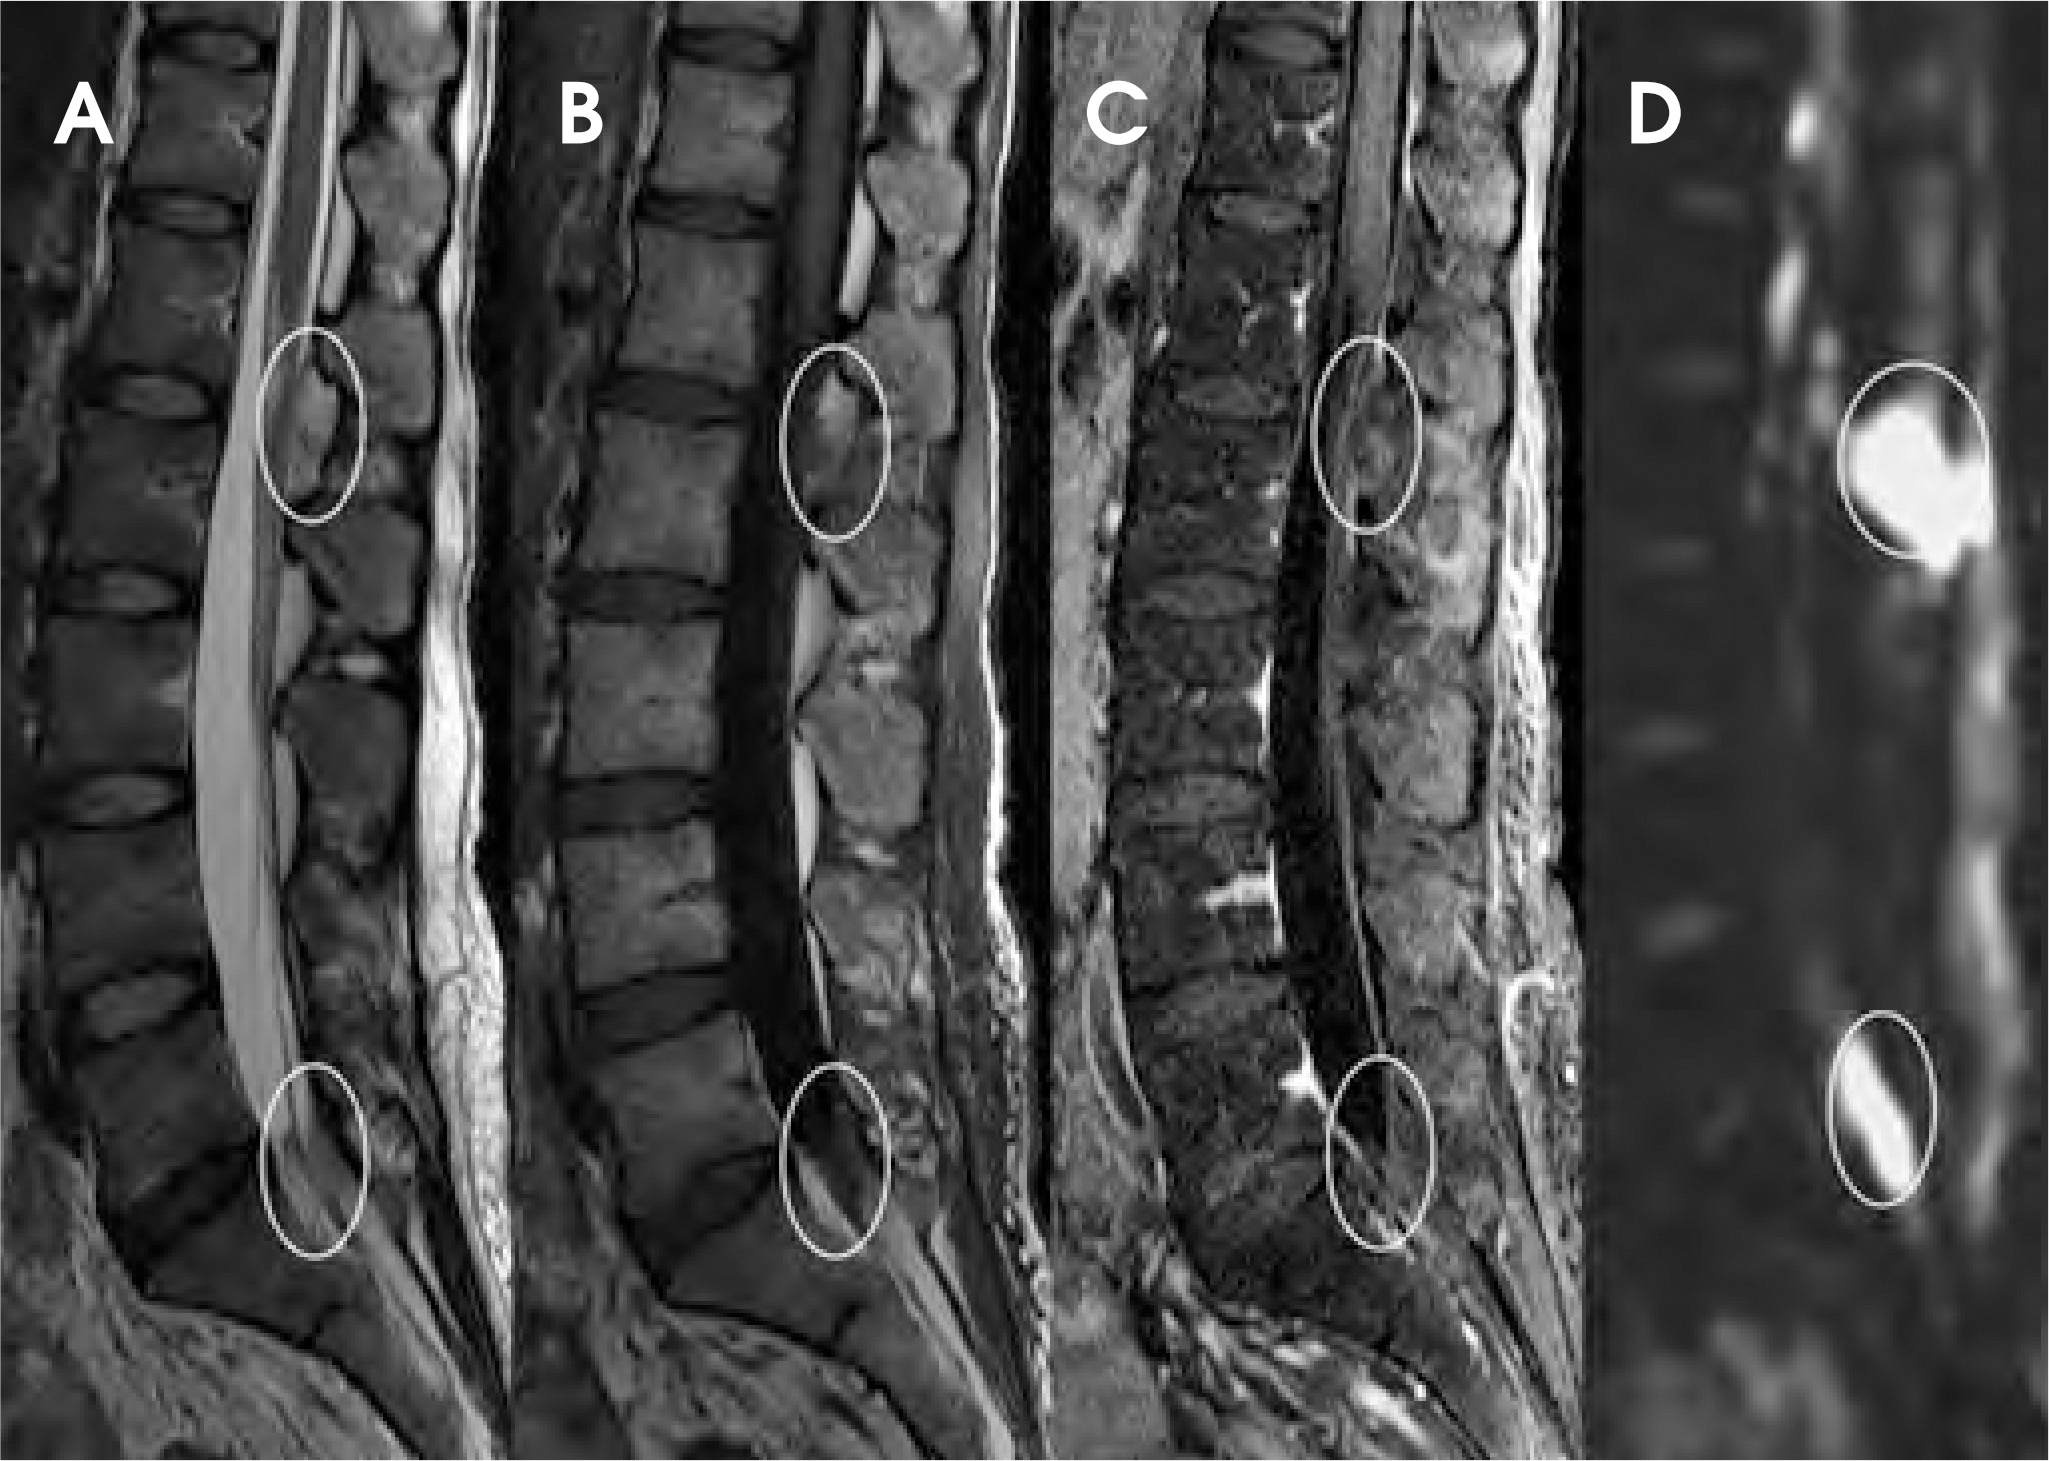
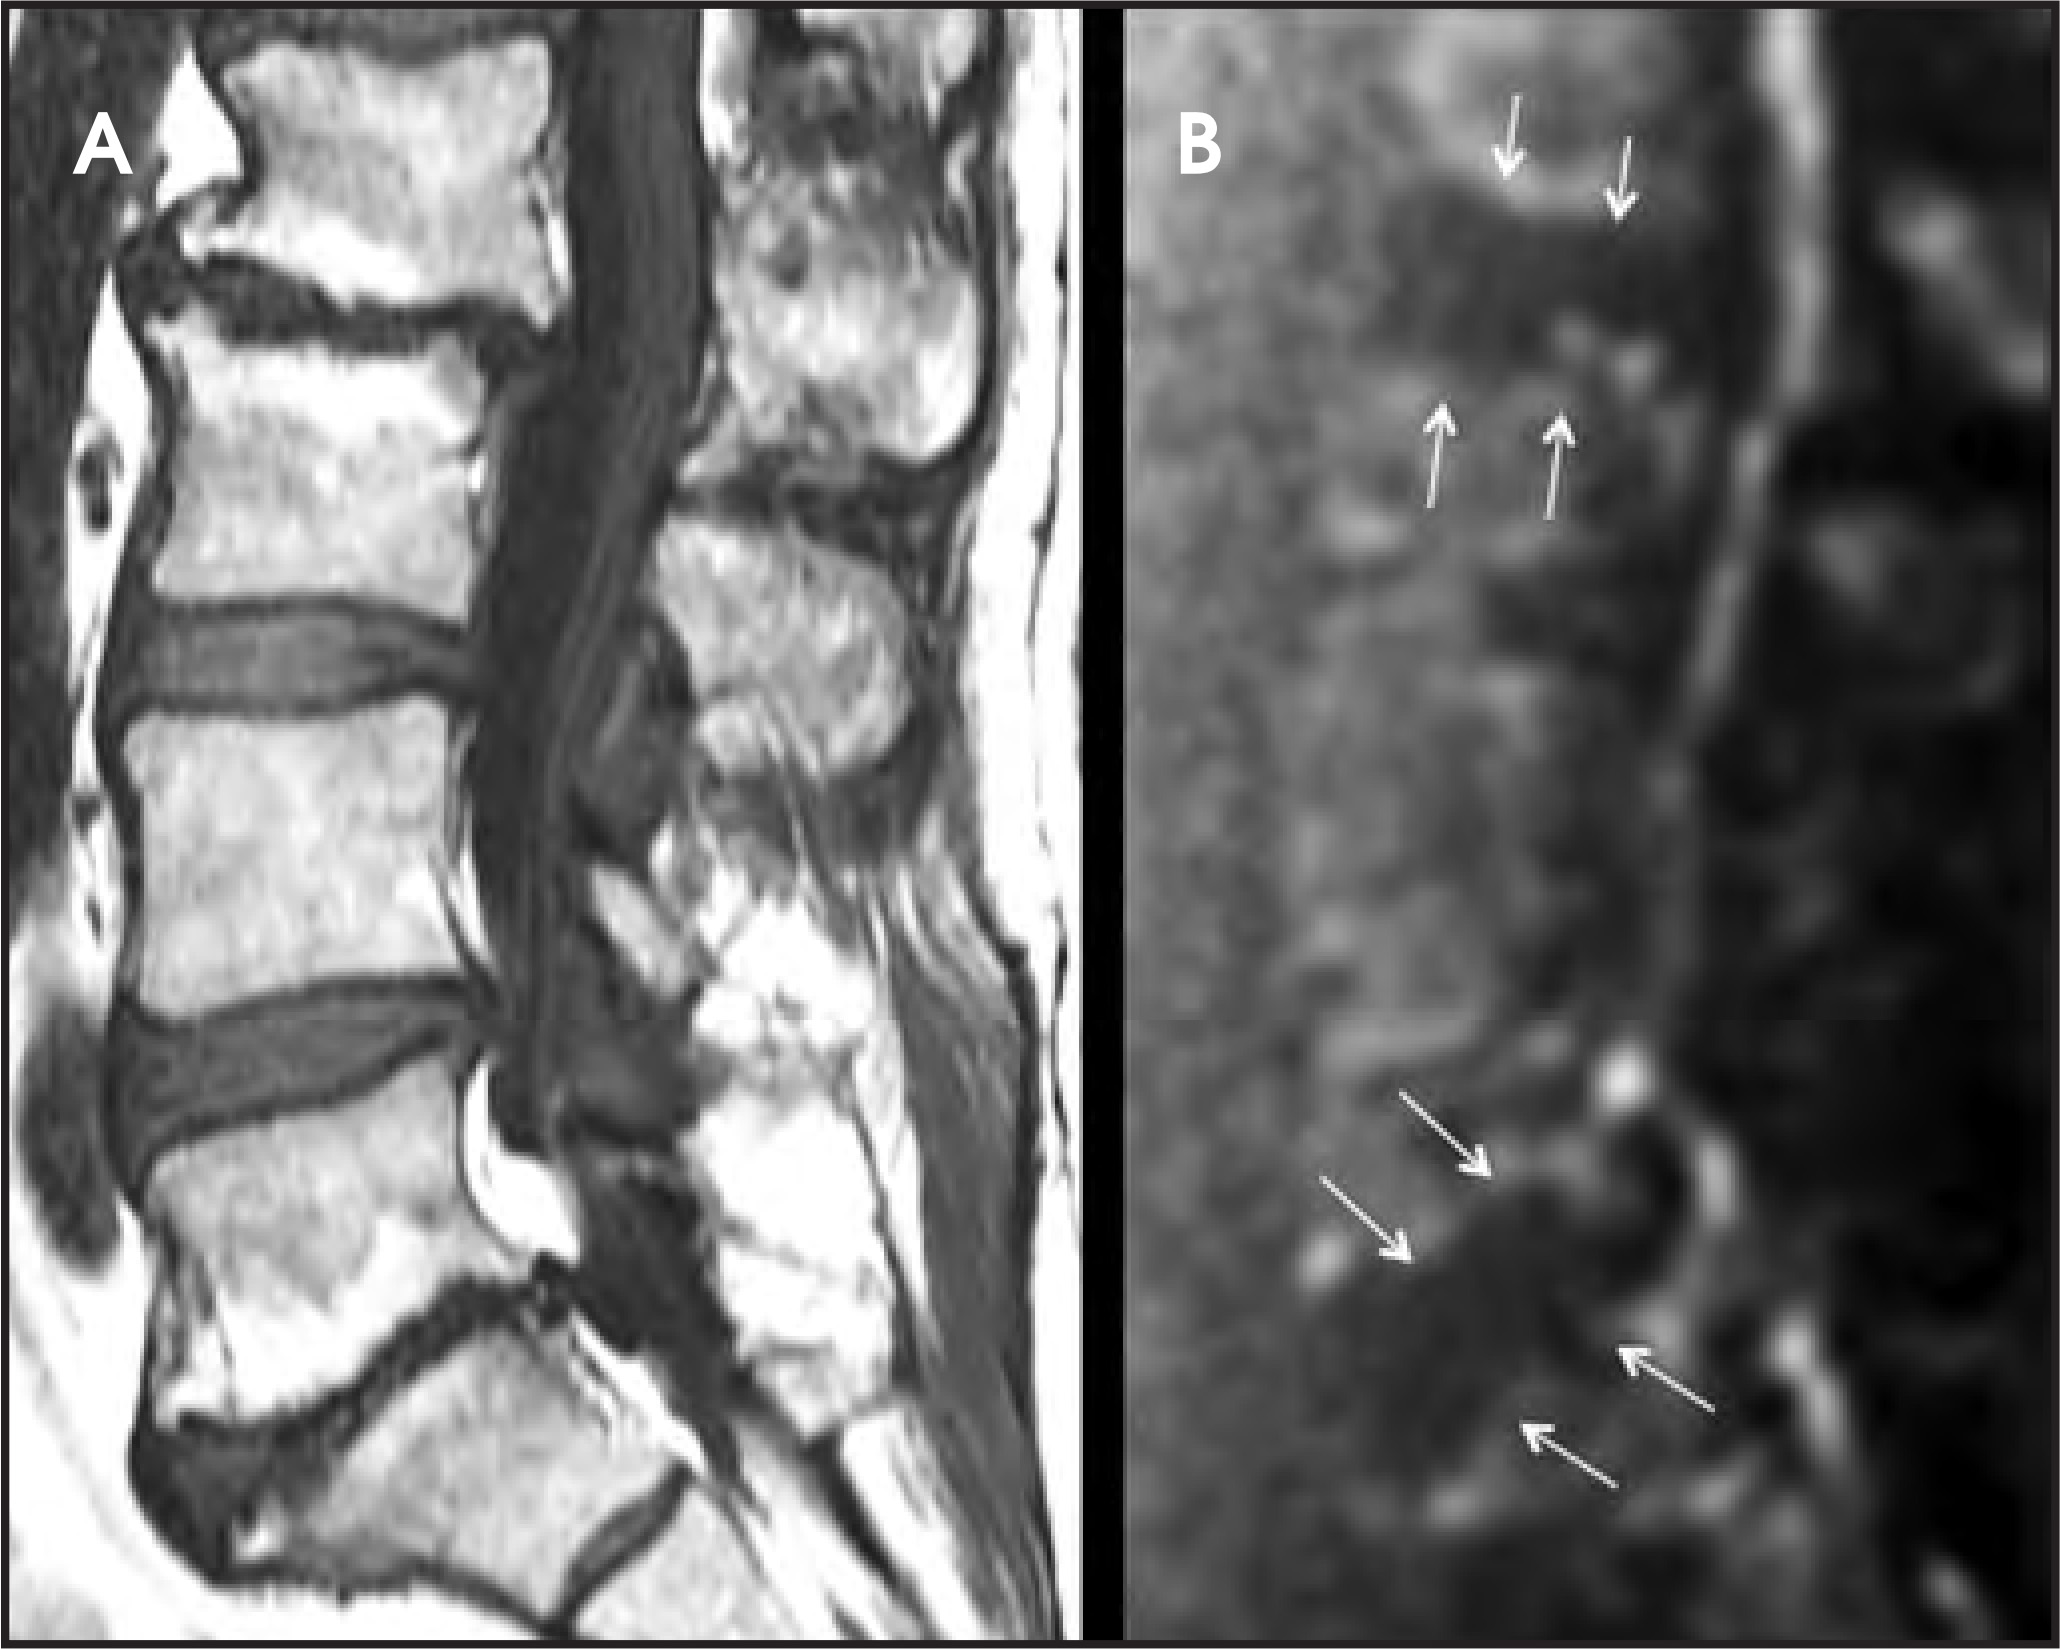
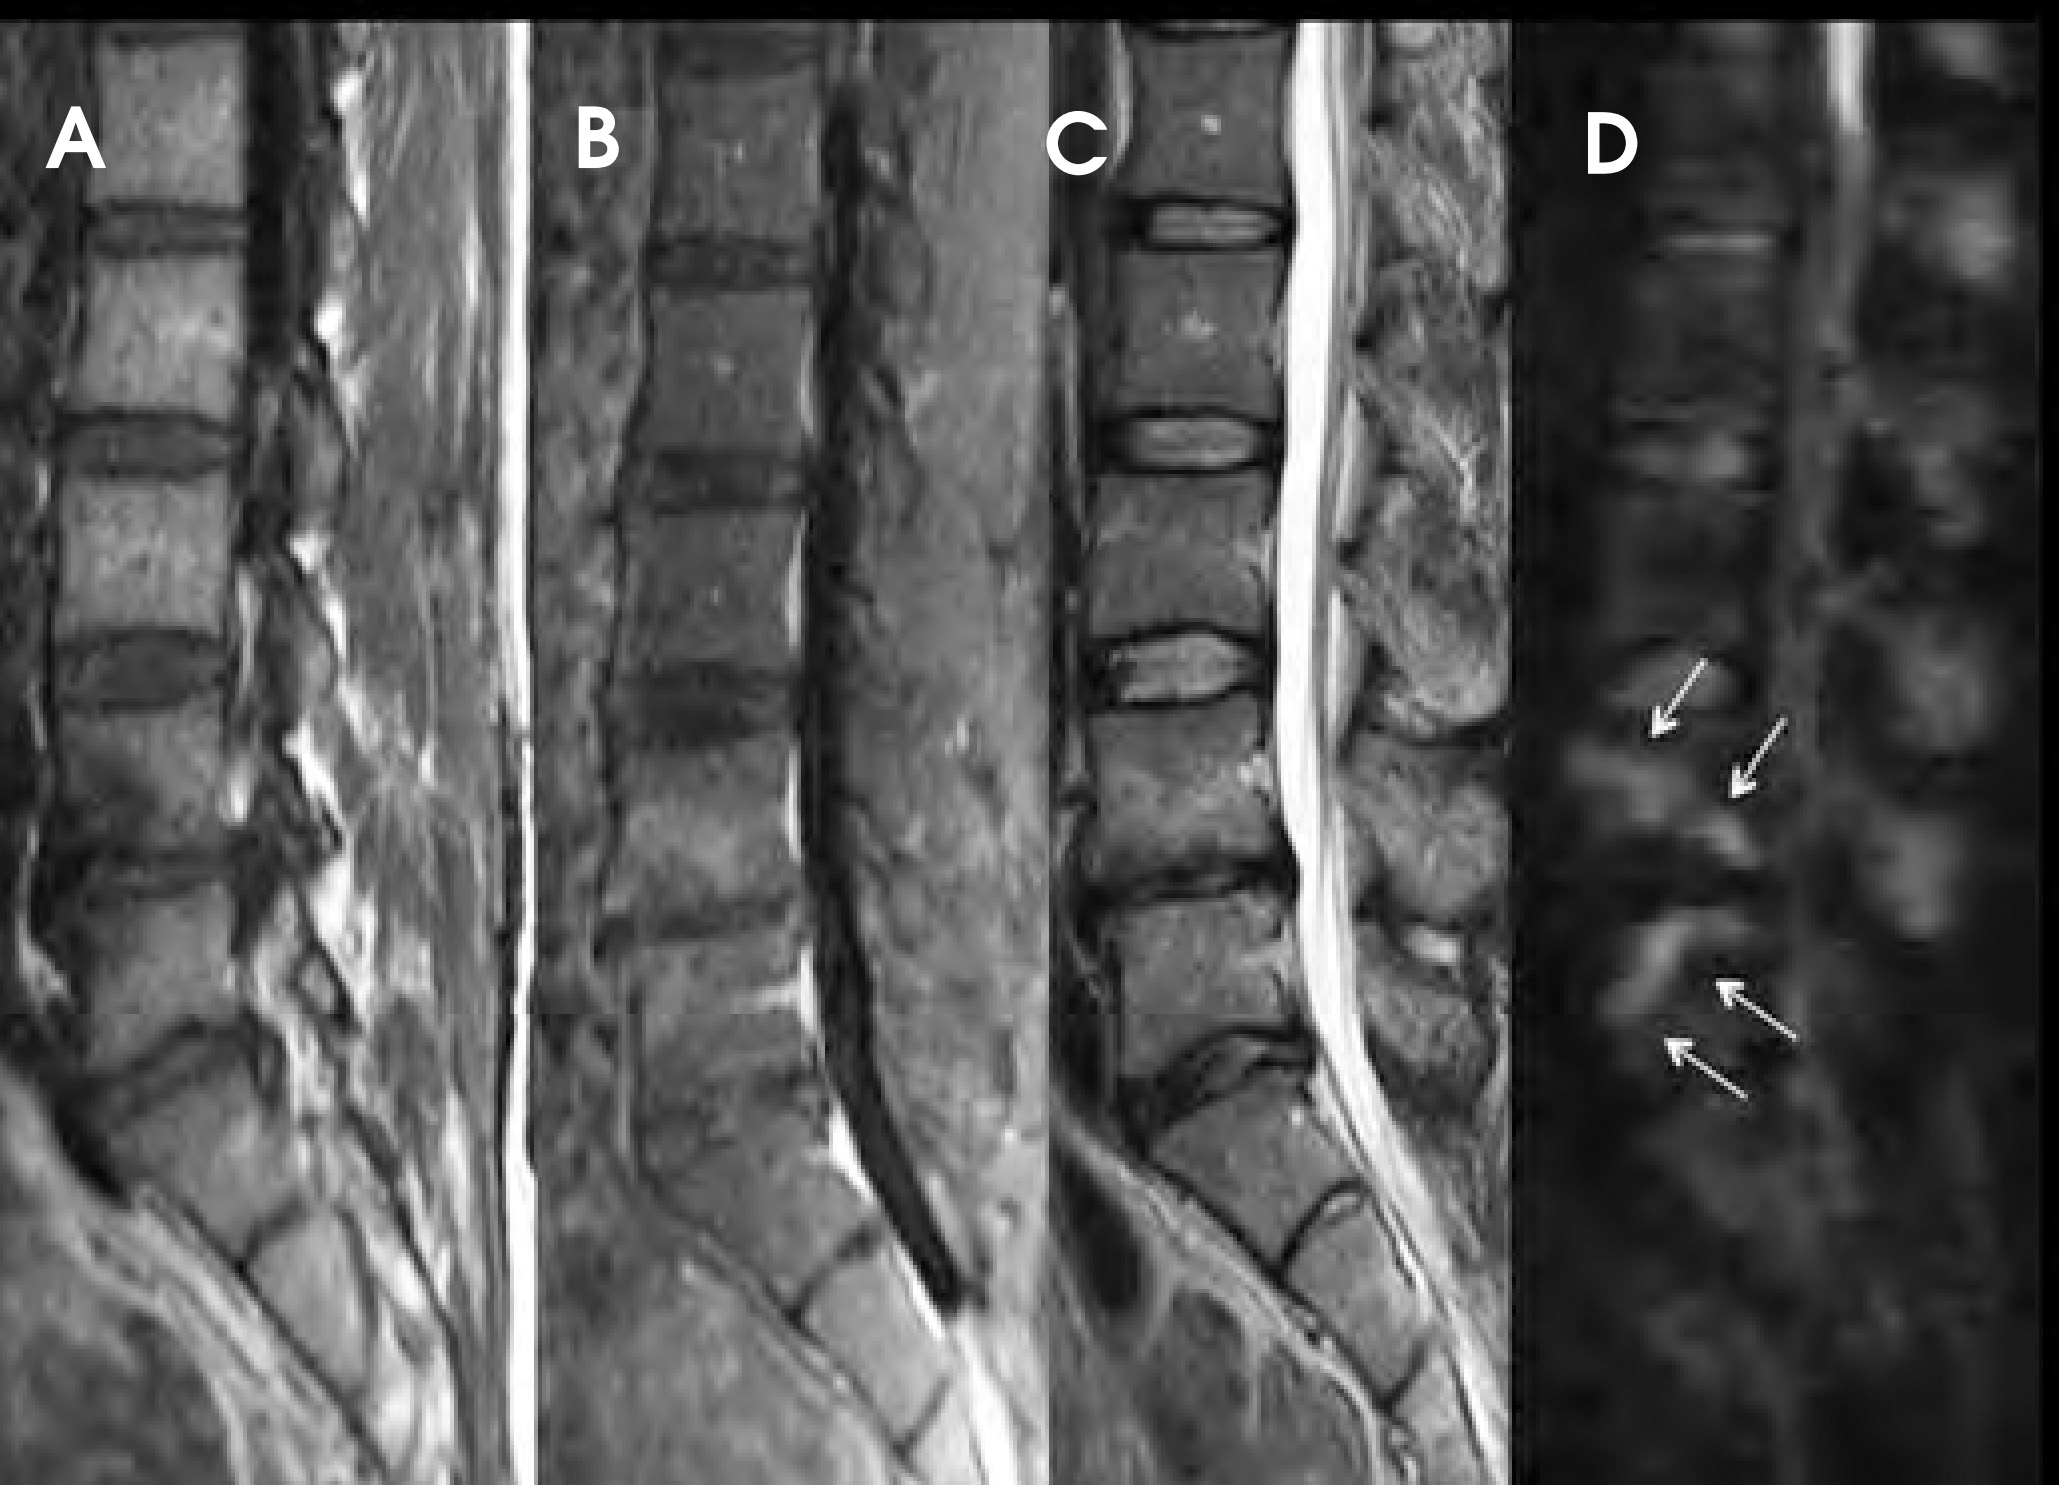
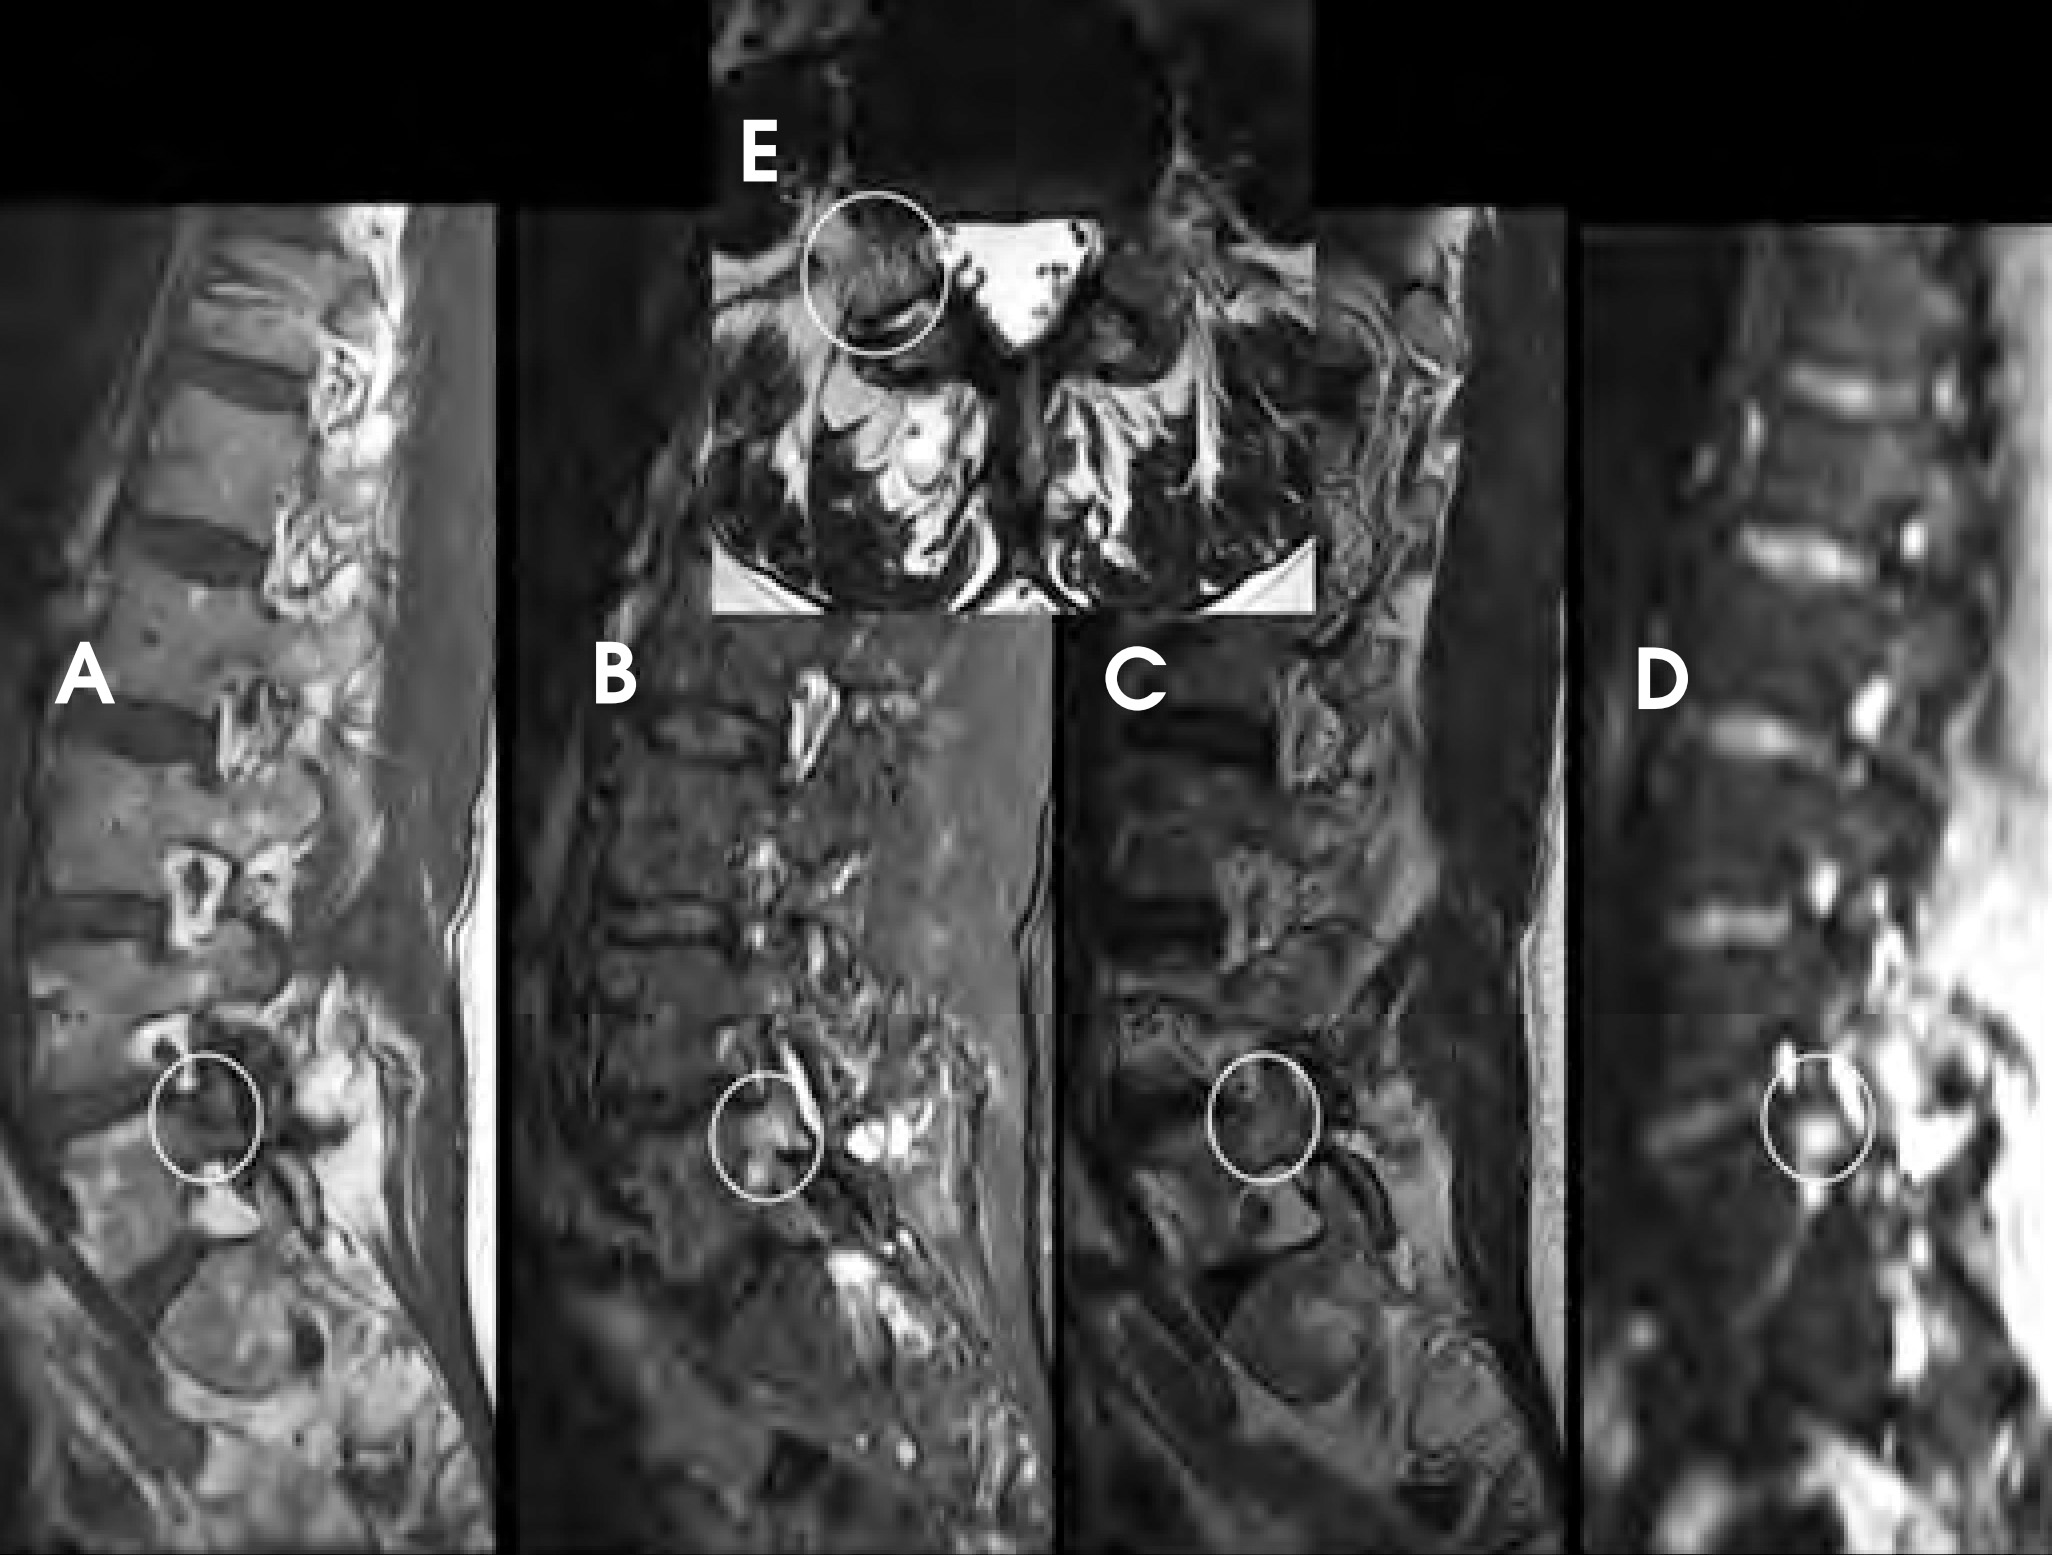
DWI is a powerful adjunct to the routine imaging of extradural lesions. DWI can add sensitivity to the presence of osseous lesions of the spine.1 When added to the routine sequences employed for the assessment of suspected metastatic disease and myeloma,DWI improves the detectability and conspicuity of many lesions. In recent trials,2,3 approximately 50% of lesions, identified as part of an MRI neoplastic survey, were most conspicuous on DWI compared to routine sequences, including short TI inversion recovery (STIR), T1 pre- and postcontrast techniques. While approximately 20% of lesions were better seen on routine sequences, up to 10% of lesions were seen only onDWI or were solely evident in retrospect with routine scanning techniques (Figures 13 and 14). Though quite powerful in the evaluation of osseous tumors, DWI has not proven to be a definitive tool for the challenging differentiation of benign senescent compression fractures from pathologic fractures4-6 (Figures 15 and 16). Just as in the and fractures can be difficult to appreciate with routine spine imaging sequences employing fast spin-echo T2-weighted images, particularly if fat-suppressed or STIR techniques are not employed. These conditions create conspicuous signal changes on DWI that may assist in their identification (Figure 22).
Technique
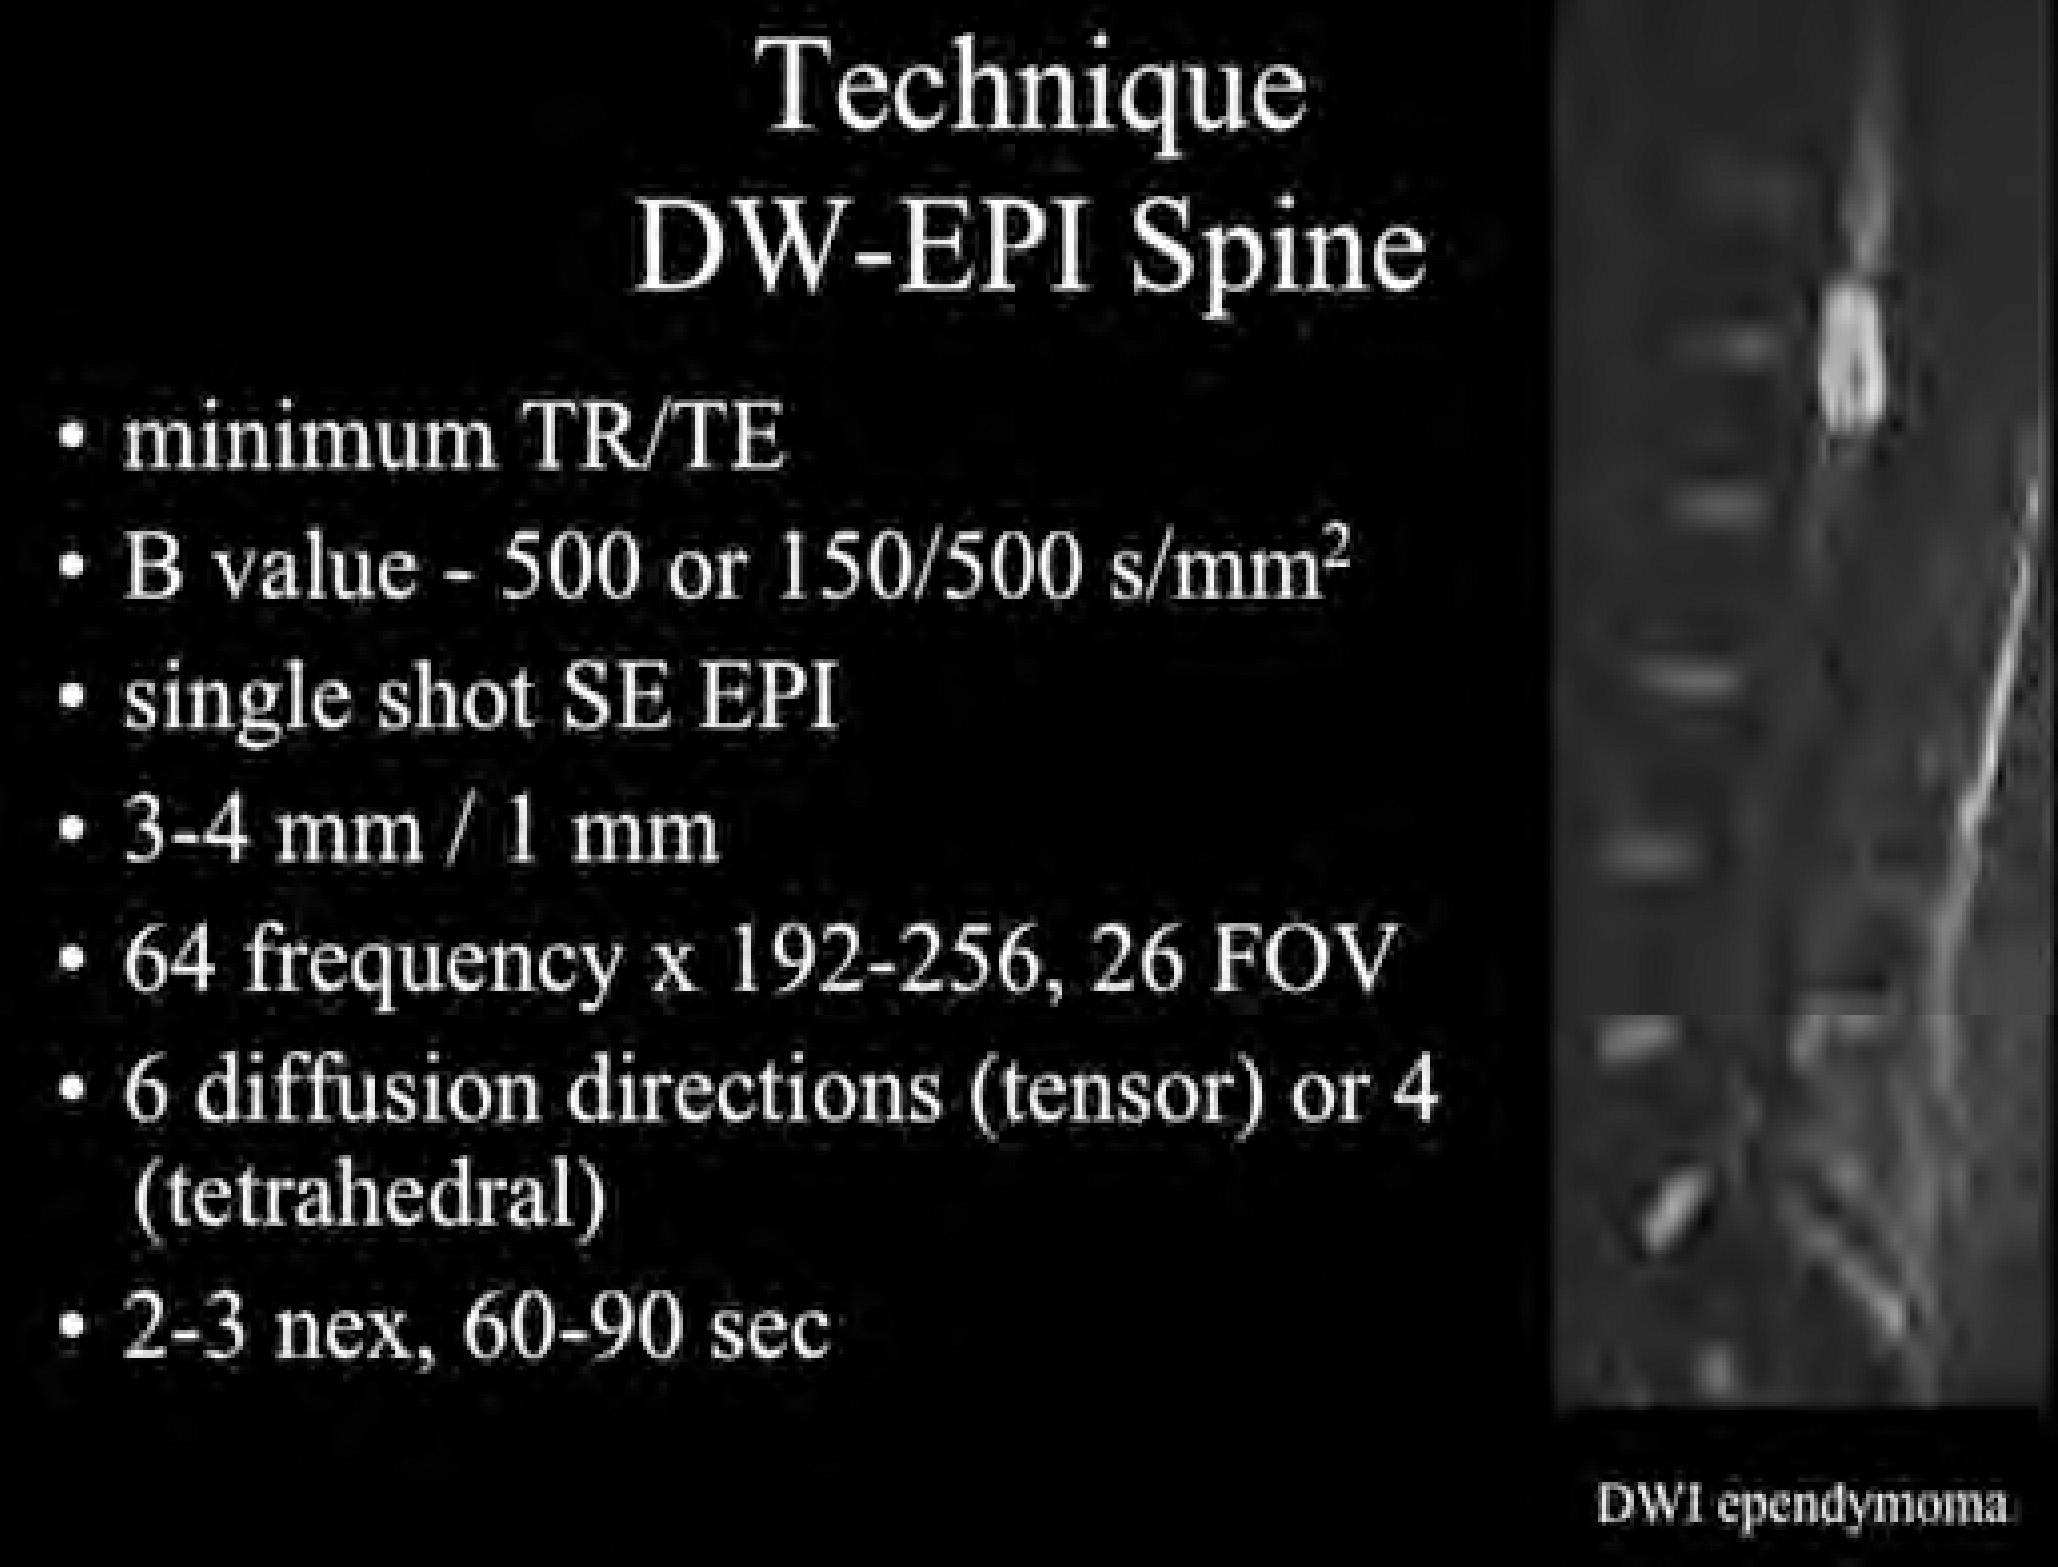
While currently available, echo-planar imaging (EPI) techniques for DWI are not ideal for imaging the spine due to issues of susceptibility artifact and distortion. With minor modifications to the protocol parameters in use for brain imaging, satisfactory studies of the spine can be obtained (Figure 23). A more moderate B value (between 400 and 500) is chosen to maintain a short echo time(TE). Minimizing the frequency encoding steps reduces TE as well. Lower TE values improve signal to noise and reduce distortion. New techniques for DWI, including reduced field-of-view EPI should provide even better image quality in the near future.
Conclusion
DWI is one of the most powerful tools available in clinical MRI. Adding this technique to the array of sequences employed for routine scanning of the spine offers a valuable boost in sensitivity and the ability to characterize lesions.
References
- Dietrich O, Biffar A, Reiser M, Baur-Melnyk A. Diffusion-weighted imaging of bone marrow. Semin Musculoskelet Radiol. 2009;13:134-144.
- Parag Y, Delman B, Pawha P, Tanenbaum L. Diffusion weighted imaging facilitates detection of spinal metastases and assists in the diagnosis of equivocal lesions. Paper presented at: American Society of Spine Radiology Annual Meeting 2010;. 2010.
- Kessler J, Pawha P, Shpilberg K, Tanenbaum L. Diffusion weighted imaging facilitates detection of spinal multiple myeloma and assists in diagnosing equivocal lesions. Paper presented at: American Society of Spine Radiology Annual Symposium 2011. 2011.
- Castillo M, Arbelaez A, Smith J, Fisher L. Diffusion-weighted MR imaging offers no advantage over routine noncontrast MR imaging in the detection of vertebral metastases. AJNR Am J Neuroradiol. 2000;21:948-953.
- Karchevsky M, Babb J, Schweitzer M. Can diffusion-weighted imaging be used to differentiate benign from pathologic fractures? A meta-analysis. Skeletal Radiol. 2008;37:791-795.
- Castillo M. Diffusion-weighted imaging of the spine: Is it reliable?. AJNR Am J Neuroradiol. 2003;24:1251-1253.
Citation
. Diffusion imaging in the spine. Applied Radiology. 2011;40(4):9-15. doi:10.37549/AR1814.