Dual energy CT in practice: Basic principles and applications
Applied Radiology — Vol. 45 , Issue 7 , pp. 6 -12
DOI: 10.37549/AR2291
Published: July 1, 2016
Categories
Computed tomography (CT) is the workhorse of modern medical imaging, accounting for approximately 65 million adult scans in the United States each year.1 Technical advances such as faster scan times, thinner slices, multiplanar reformatting, and 3D rendering have revolutionized the scope of CT. An exciting development that offers great promise to further increase the modality’s potential is dual energy CT (DECT). Also known as “spectral imaging,” DECT was first conceptualized in the 1970s.2-5 However, the clinical application of DECT has only recently been realized as a result of robust improvements in performance and post-processing capabilities.
Conventional or single energy CT (SECT) utilizes a single polychromatic X-ray beam (ranging from 70 to 140 kVp with a standard of 120 kVp) emitted from a single source and received by a single detector. The inherent contrast of the image dataset generated by this process depends on differences in photon attenuation of the various materials that constitute the human body (ie, soft tissue, air, calcium, fat). The degree that a material will attenuate the X-ray beam is dependent on (1) tissue composition and (2) photon energy level and how closely it exceeds the k-edge (ie, inner electron shell binding energy) of the material. Therefore, tissue attenuation can be manipulated by changing photon energy levels. In DECT, two energy levels (typically 80 and 140 kVp) are used to acquire images that can be processed to generate additional datasets.
There are currently three DECT platforms marketed by three of the major CT vendors. Dual source DECT (dsDECT) [Somatom Definition Flash, Siemens Medical Solutions, Forchheim, Germany] utilizes two X-ray tubes and two detectors to obtain simultaneous dual energy acquisition and data processing. Single source DECT (ssDECT) [Discovery 750HD, GE Healthcare, Milwaukee, WI] uses a single X-ray tube that rapidly alternates between low and high energies (fast-switching) and a single detector that quickly registers information from both energies. In detector based spectral CT [IQon spectral CT, Philips Healthcare, Eindhoven, The Netherlands], a single X-ray tube with full dose modulation capabilities is paired with a detector made of two layers (sandwich detector) that simultaneously detects two energy levels.
Material separation
Dual energy CT offers the potential to analyze material composition through image acquisition at two different energy levels. Since materials have unique attenuation profiles at different energy levels according to their linear attenuation coefficient, DECT can utilize mathematical algorithms to examine tissues when exposed to both low and high-energy polychromatic X-ray beams. Materials with low atomic numbers (eg, water) demonstrate small differences in attenuation between high and low X-ray energies while materials with high atomic numbers (eg, iodine) show large differences in attenuation at different photon energies.
DECT scanners can process both routine diagnostic images and material decomposition (also known as material-specific or material density) images. Routine diagnostic images are intended to mirror the standard images produced by SECT. Blended images (Siemens) are created through a combination of the acquired low-energy (80 kVp) and high-energy (140 kVp) data to simulate a standard 120 kVp dataset. Virtual monochromatic (VMC) or monoenergetic (VME) [GE/Siemens] images are generated to simulate a scan obtained at a single energy level. VMC/VME images with specific energies (40 to 140 keV) provide more reliable attenuation measurements compared to polychromatic SECT. VMC images can be customized to a specific energy level for various clinical applications. Low-energy VMC images are suggested for studies with high contrast between lesions and adjacent tissues (eg, CT angiography; 45-55 keV). Intermediate-energy VMC images (60-75keV) are ideal for evaluation of soft tissues due to the balance between adequate contrast and reduced image noise. High-energy VMC images (95-140keV) reduce artifacts from metal implants.
The algorithms for material decomposition are unique for each CT manufacturer. ssDECT algorithms mathematically transform material attenuation information into the amount (or concentration) of two-material pairs that would be necessary to produce the measured attenuation level within each image voxel based on the difference of atomic numbers of the materials present within the voxel. The two-material decomposition algorithm creates material-specific image pairs, such as water and iodine images. dsDECT utilizes a three material decomposition algorithm to create soft tissue, fat, and iodine material-specific images.
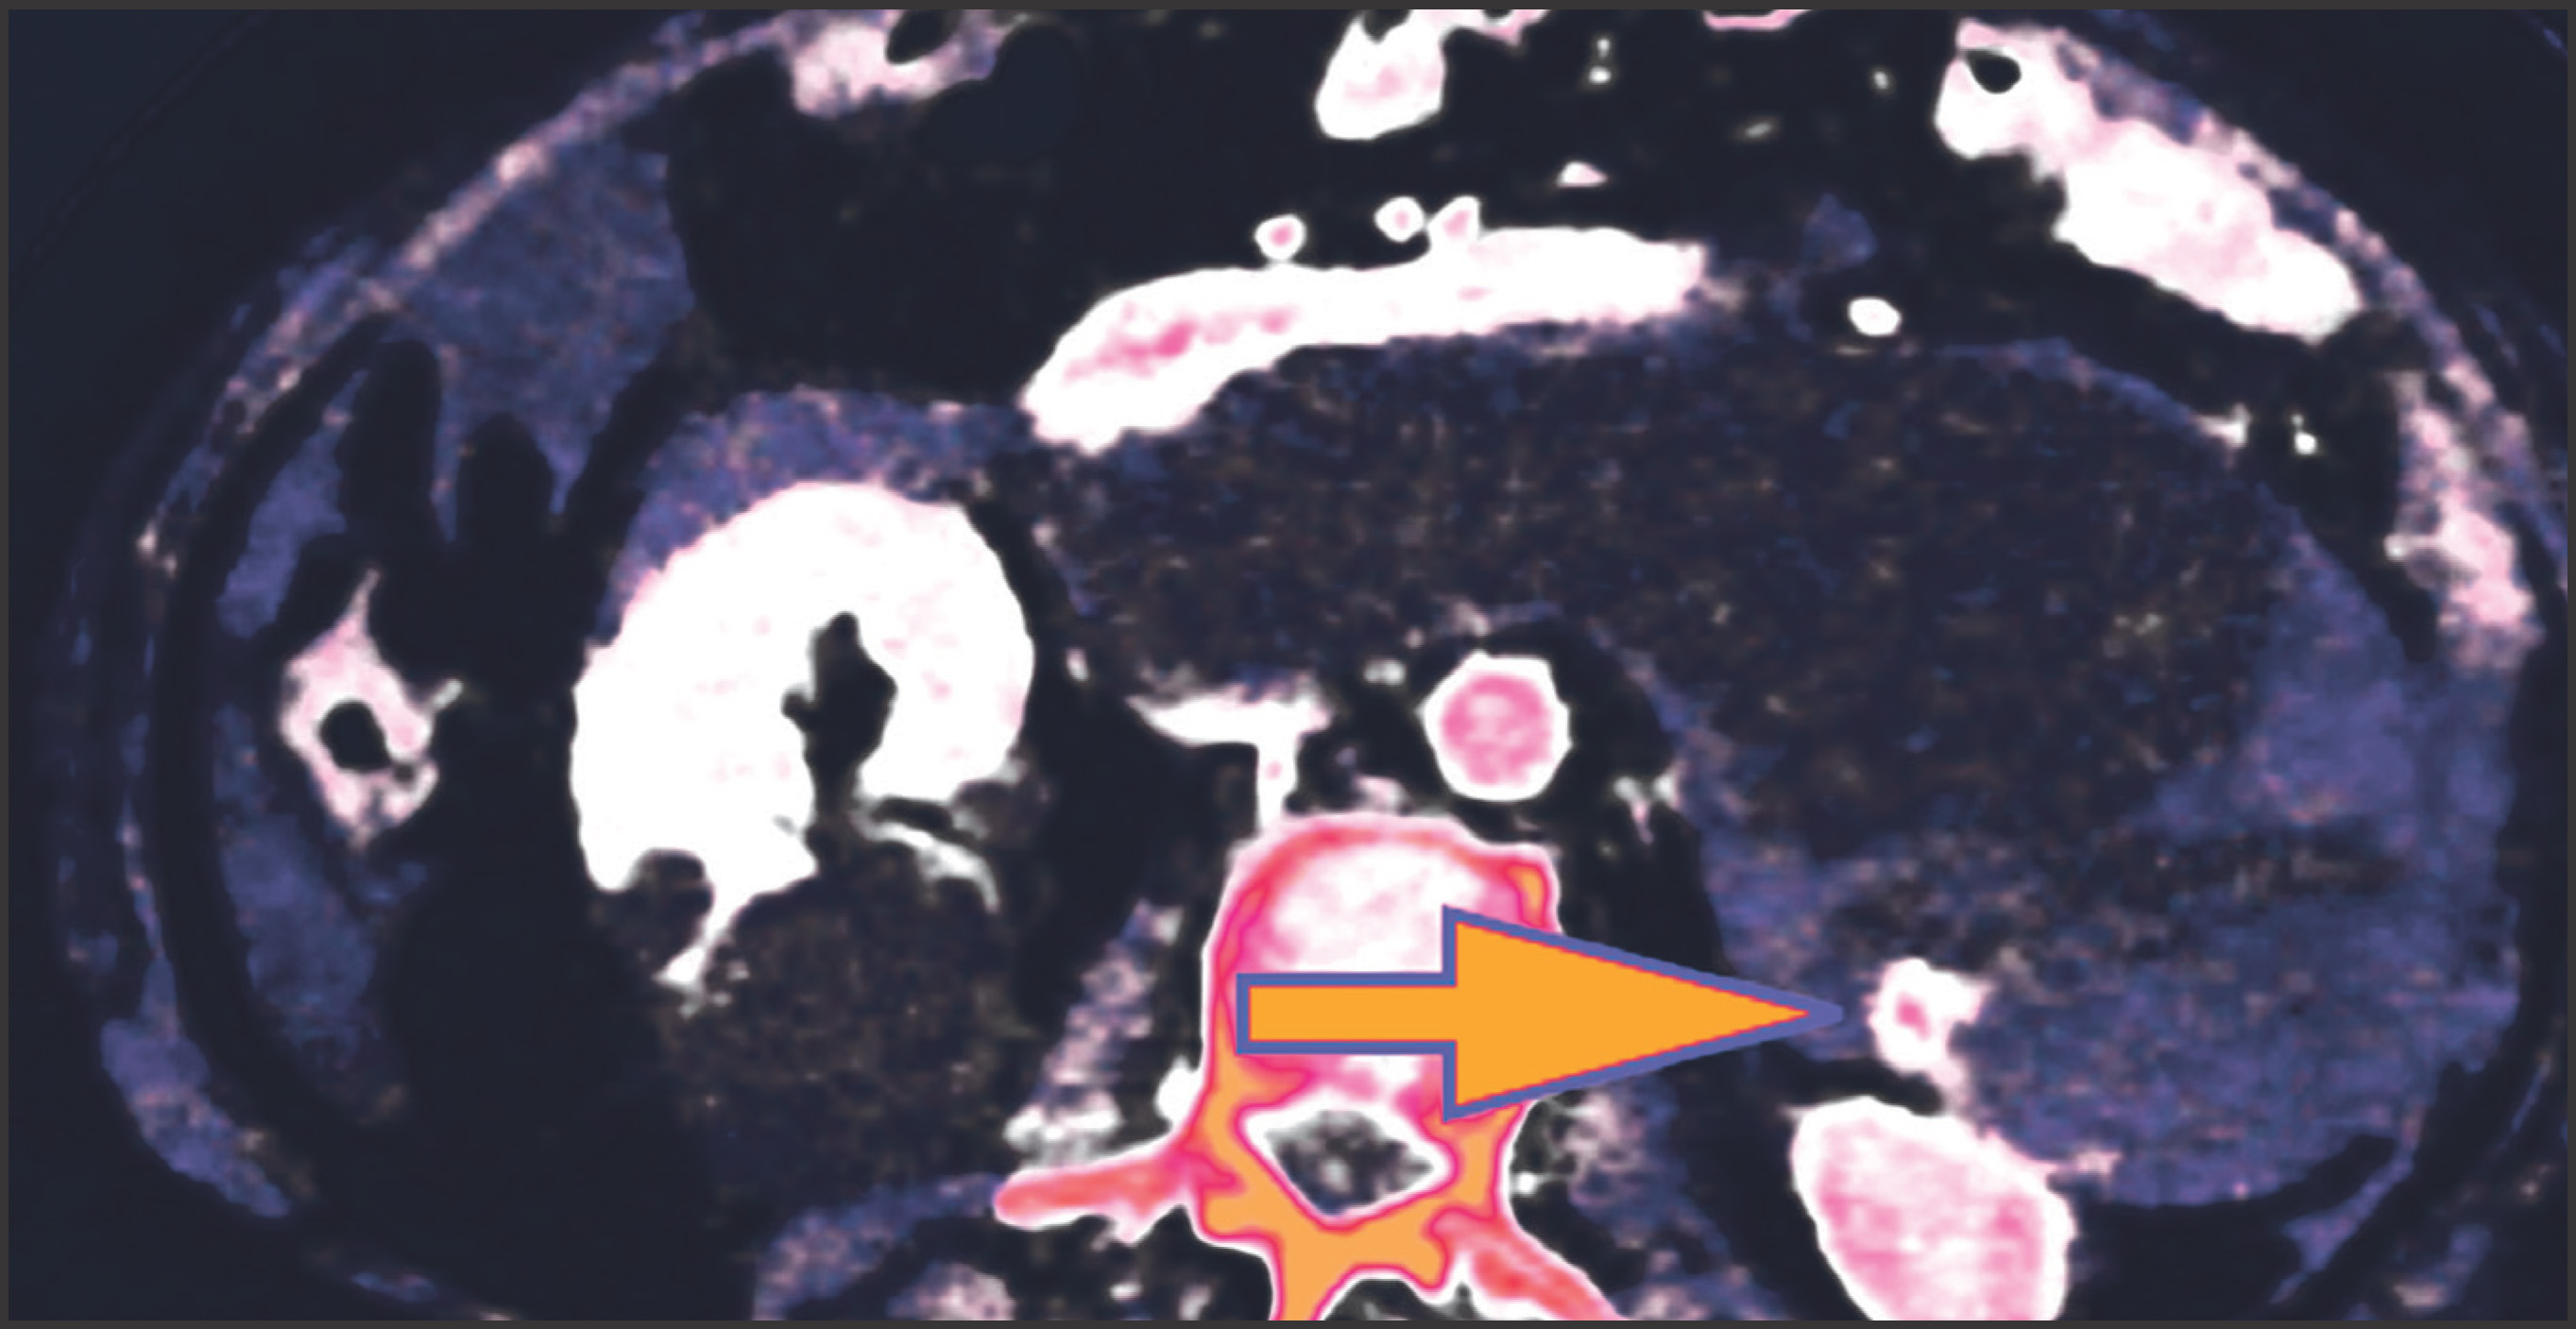
Of all the possible material-specific images, iodine and water (or virtual unenhanced) images offer the most practical datasets for everyday clinical imaging (Figure 1). Iodine images demonstrate the amount of iodine (mg/ml) within an image voxel and its distribution in tissues. Because iodine images are independent of inherent tissue attenuation, they are a more reliable measure of enhancement compared to conventional contrast-enhanced studies. Water (ssDECT) or virtual unenhanced (dsDECT) images can be used to simulate true unenhanced images, therefore, possibly eliminating the need for an unenhanced acquisition altogether. This would reduce both radiation dose and exam time.
Tissue characterization
Dual energy applications add value to CT imaging due to superior lesion detection and characterization. The single most important property that governs the interpreter’s ability to detect a lesion in the background of normal tissue is contrast-to-noise ratio (CNR). The lower energy level of DECT acquisition (typically 80 kVp) improves CNR because the average photon energy is closer to the k-edge of iodine (33.2 keV) compared to a single energy polychromatic beam of 120 kVp. This results in higher X-ray absorption with improved contrast between hypervascular lesions, hypovascular lesions, and normally enhancing parenchyma.6 VMC images (60-75 keV) can be used not only to increase CNR but also to improve overall image quality due to reduced beam hardening artifact (as a result of the elimination of very low energy photons that contribute only to image noise).7
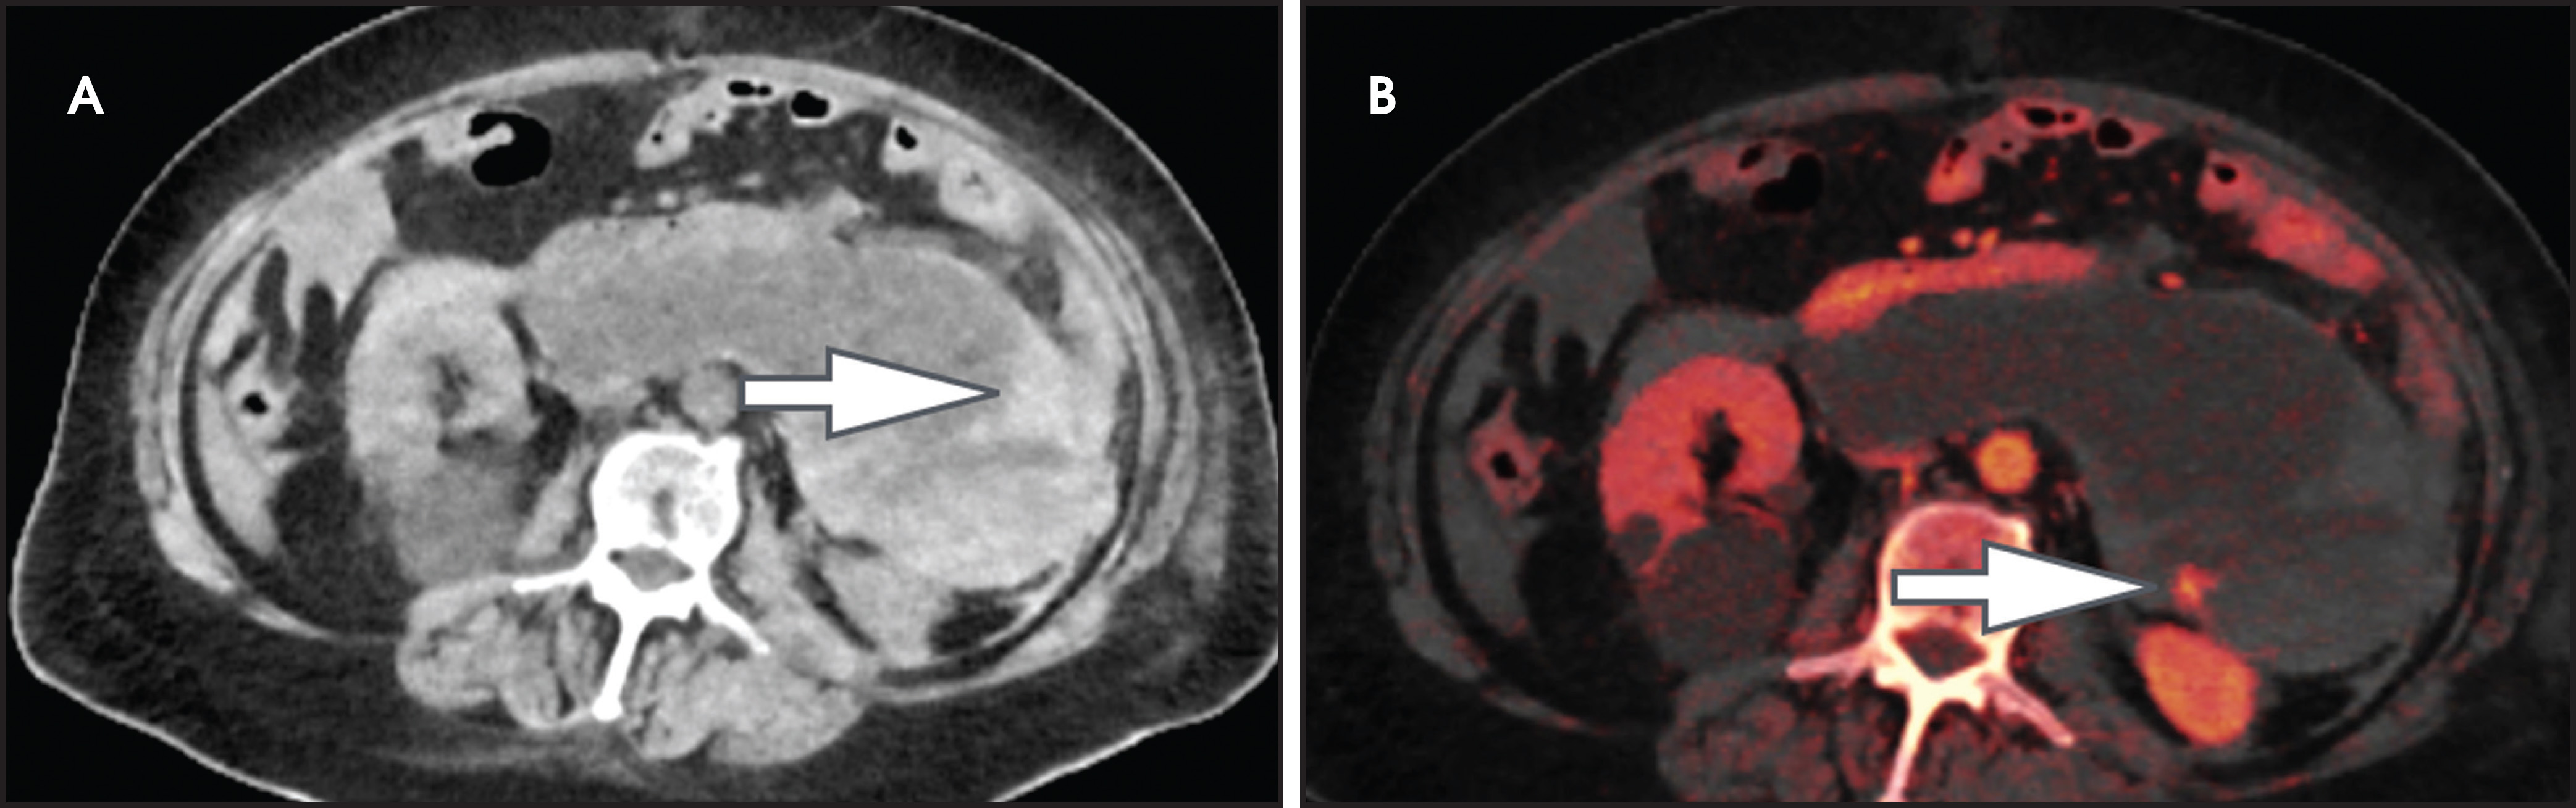
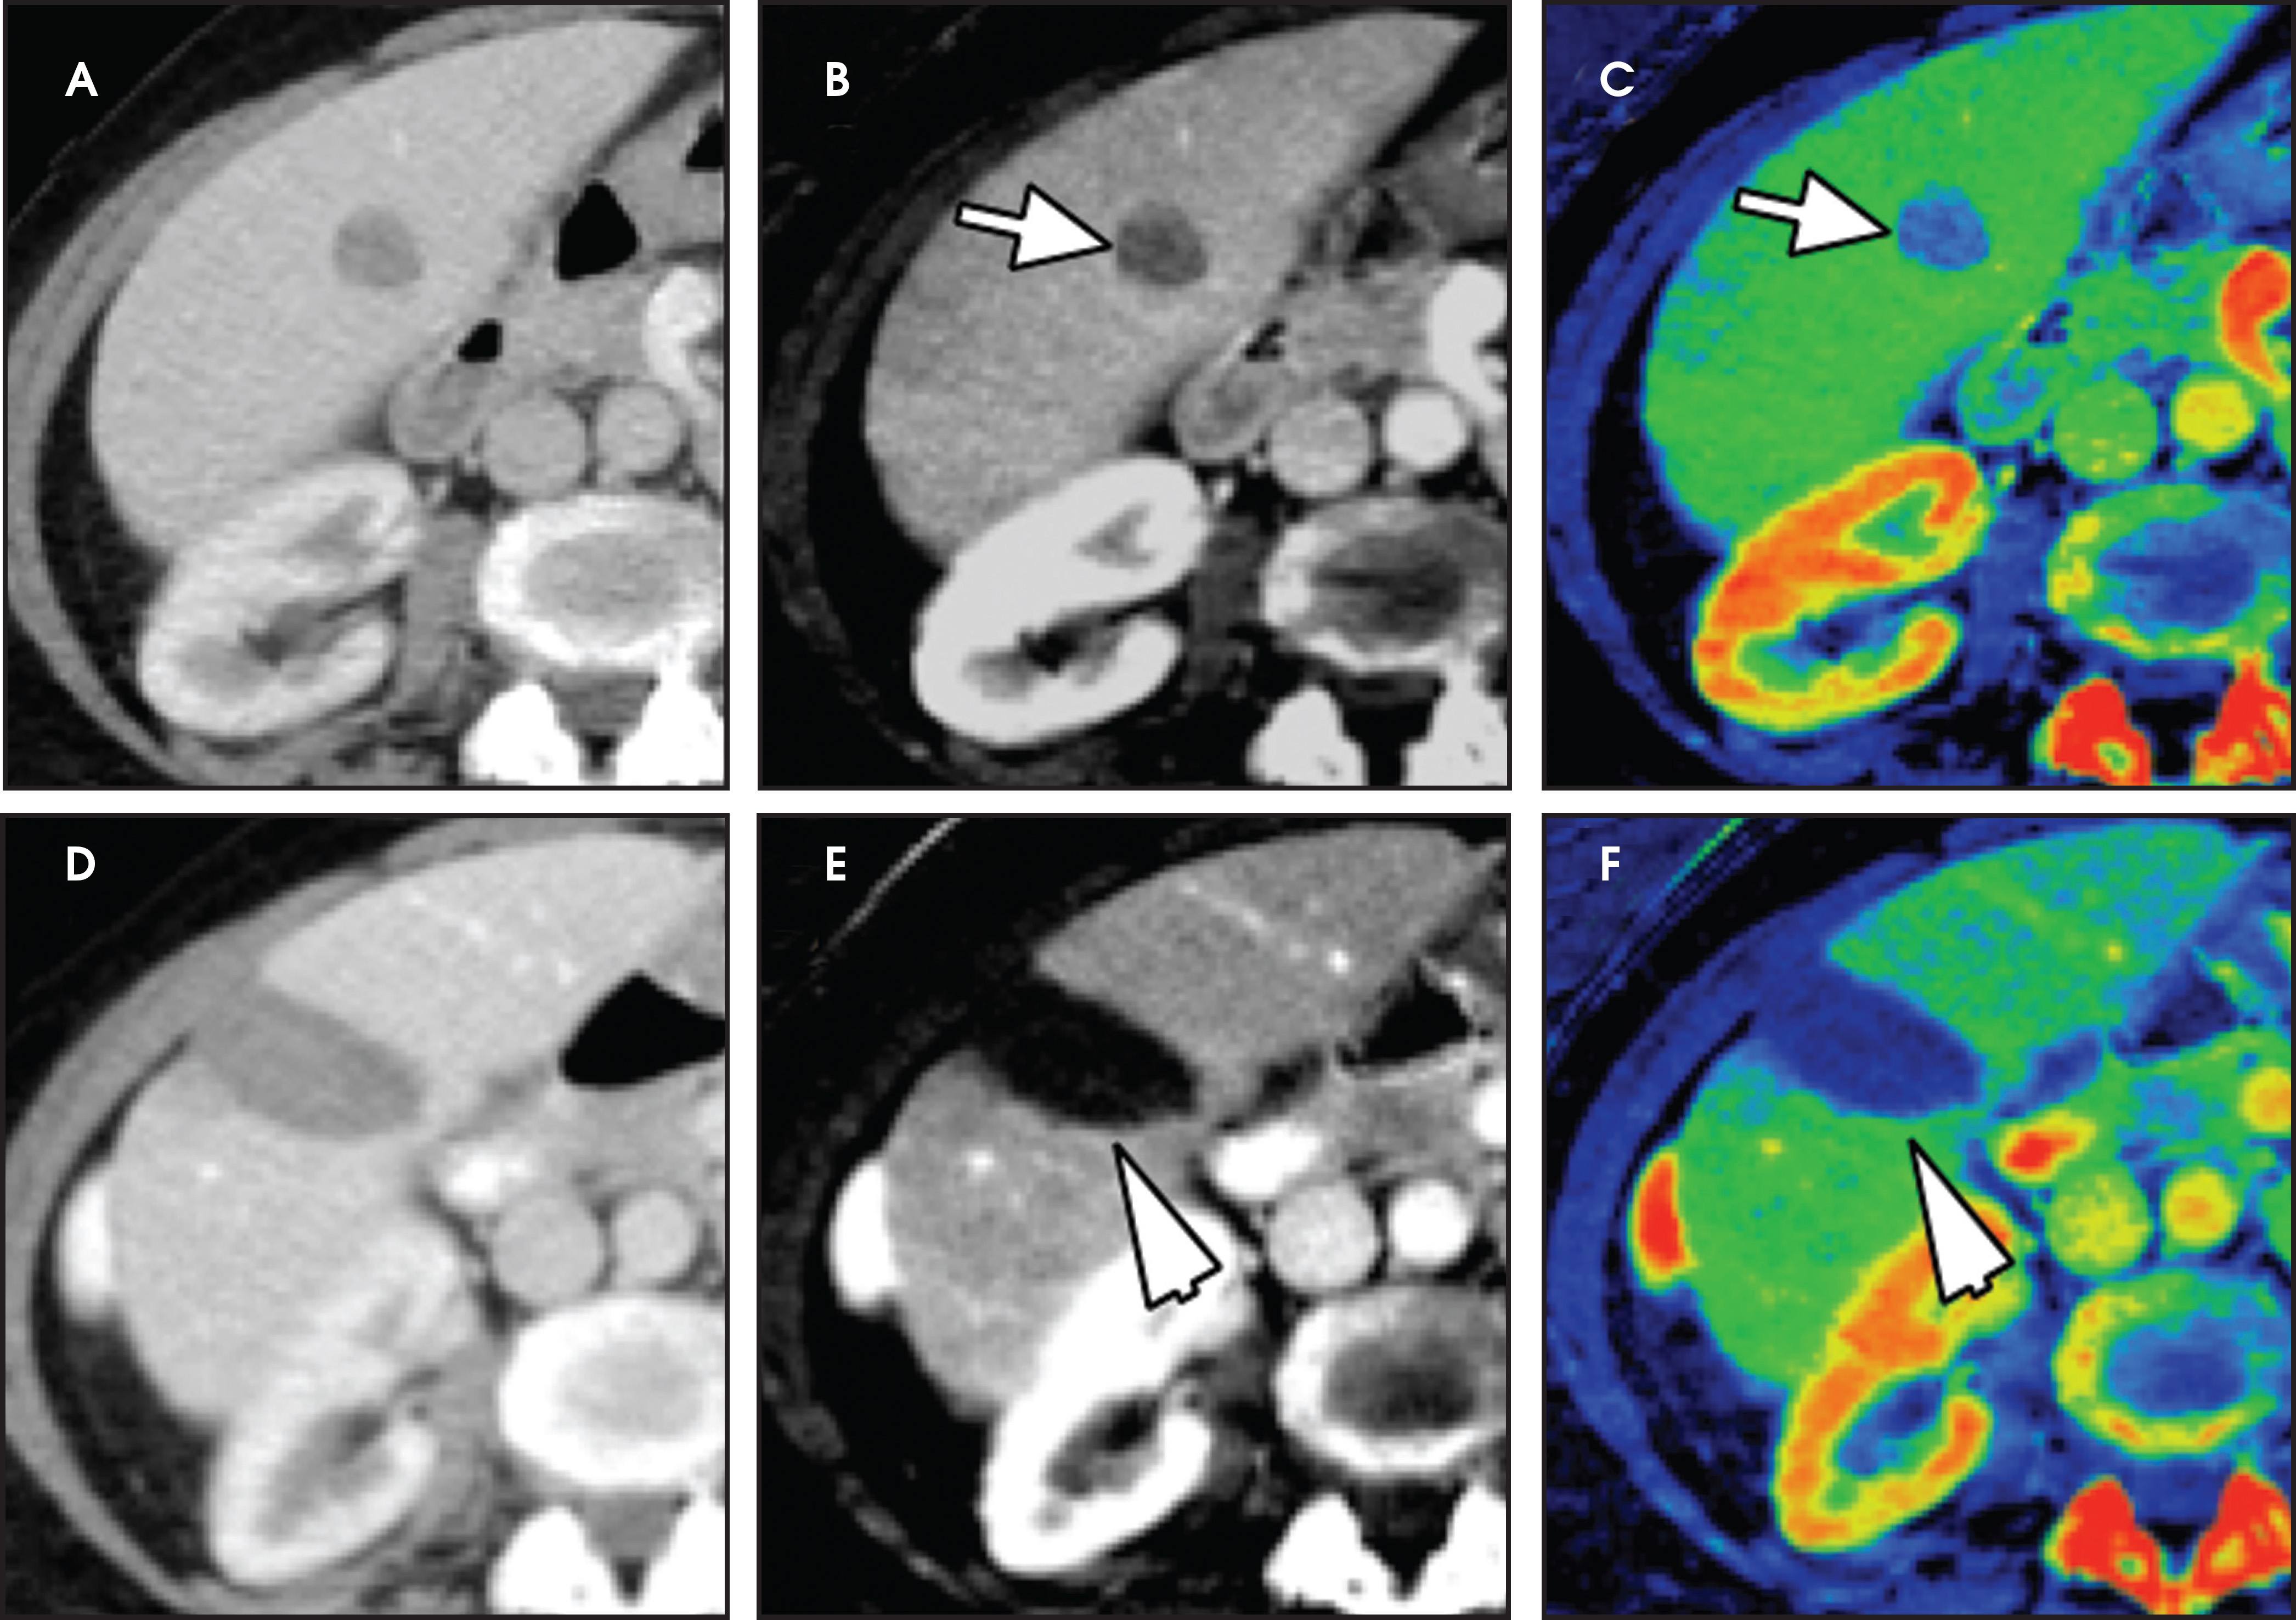
Iodine images play a critical role in DECT’s ability to improve lesion conspicuity. They can be displayed as quantitative gray-scale images or color overlay maps, both of which improve lesion conspicuity due to differences in iodine content between lesions and normal parenchyma (Figure 2). Iodine images detect and quantify iodine within each image voxel, allowing for detection of even a small amount of enhancement within a lesion. To illustrate improved tissue characterization, liver lesion, renal mass, and renal stone characterization will be briefly discussed. The role of DECT in oncologic imaging will also be outlined.
Liver lesion characterization
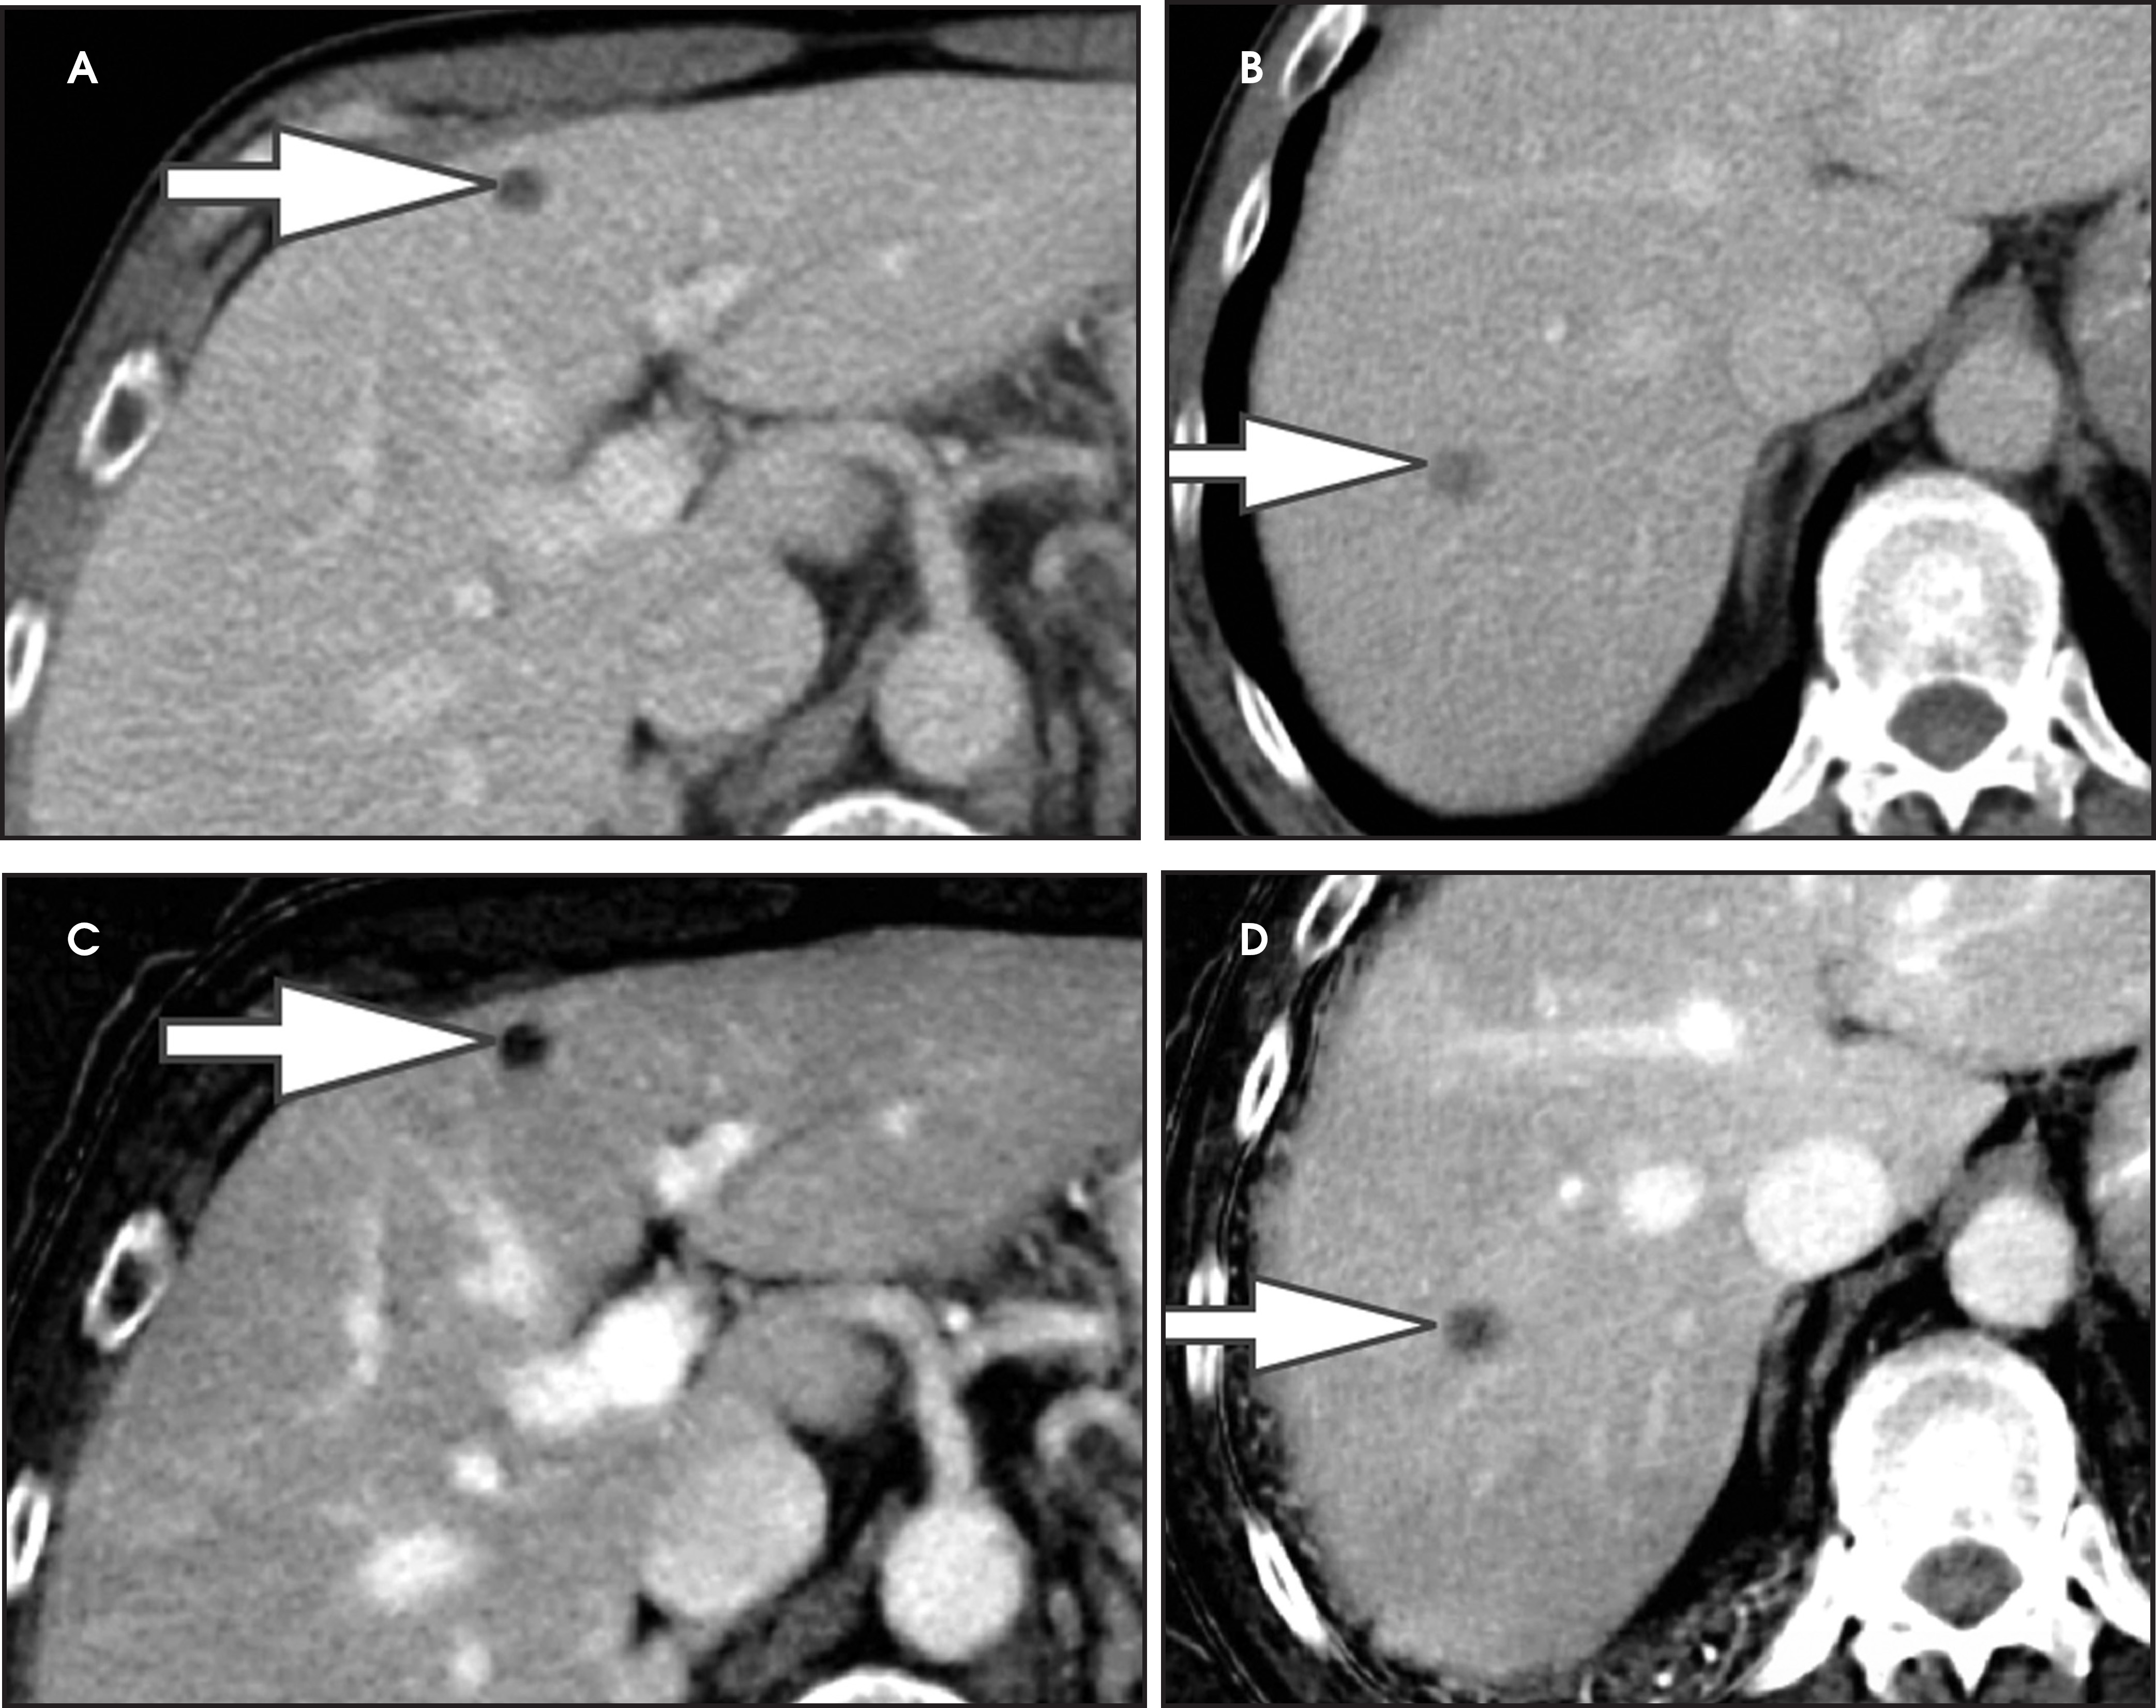
Evaluation of small liver lesions on conventional CT can be a diagnostic dilemma. Subcentimeter lesions are often “too small to characterize,” leading to further workup with MRI or biopsy. However, cysts can be differentiated from small hypodense masses (ie, metastases) on iodine images in a DECT acquisition because a metastasis will show iodine uptake while a cyst will not (Figure 3). Improved lesion detection and characterization by DECT could potentially reduce the need for short interval follow-up studies, decrease the number of unnecessary biopsies, and improve screening for hypervascular liver tumors in cirrhotic patients.
Renal mass characterization
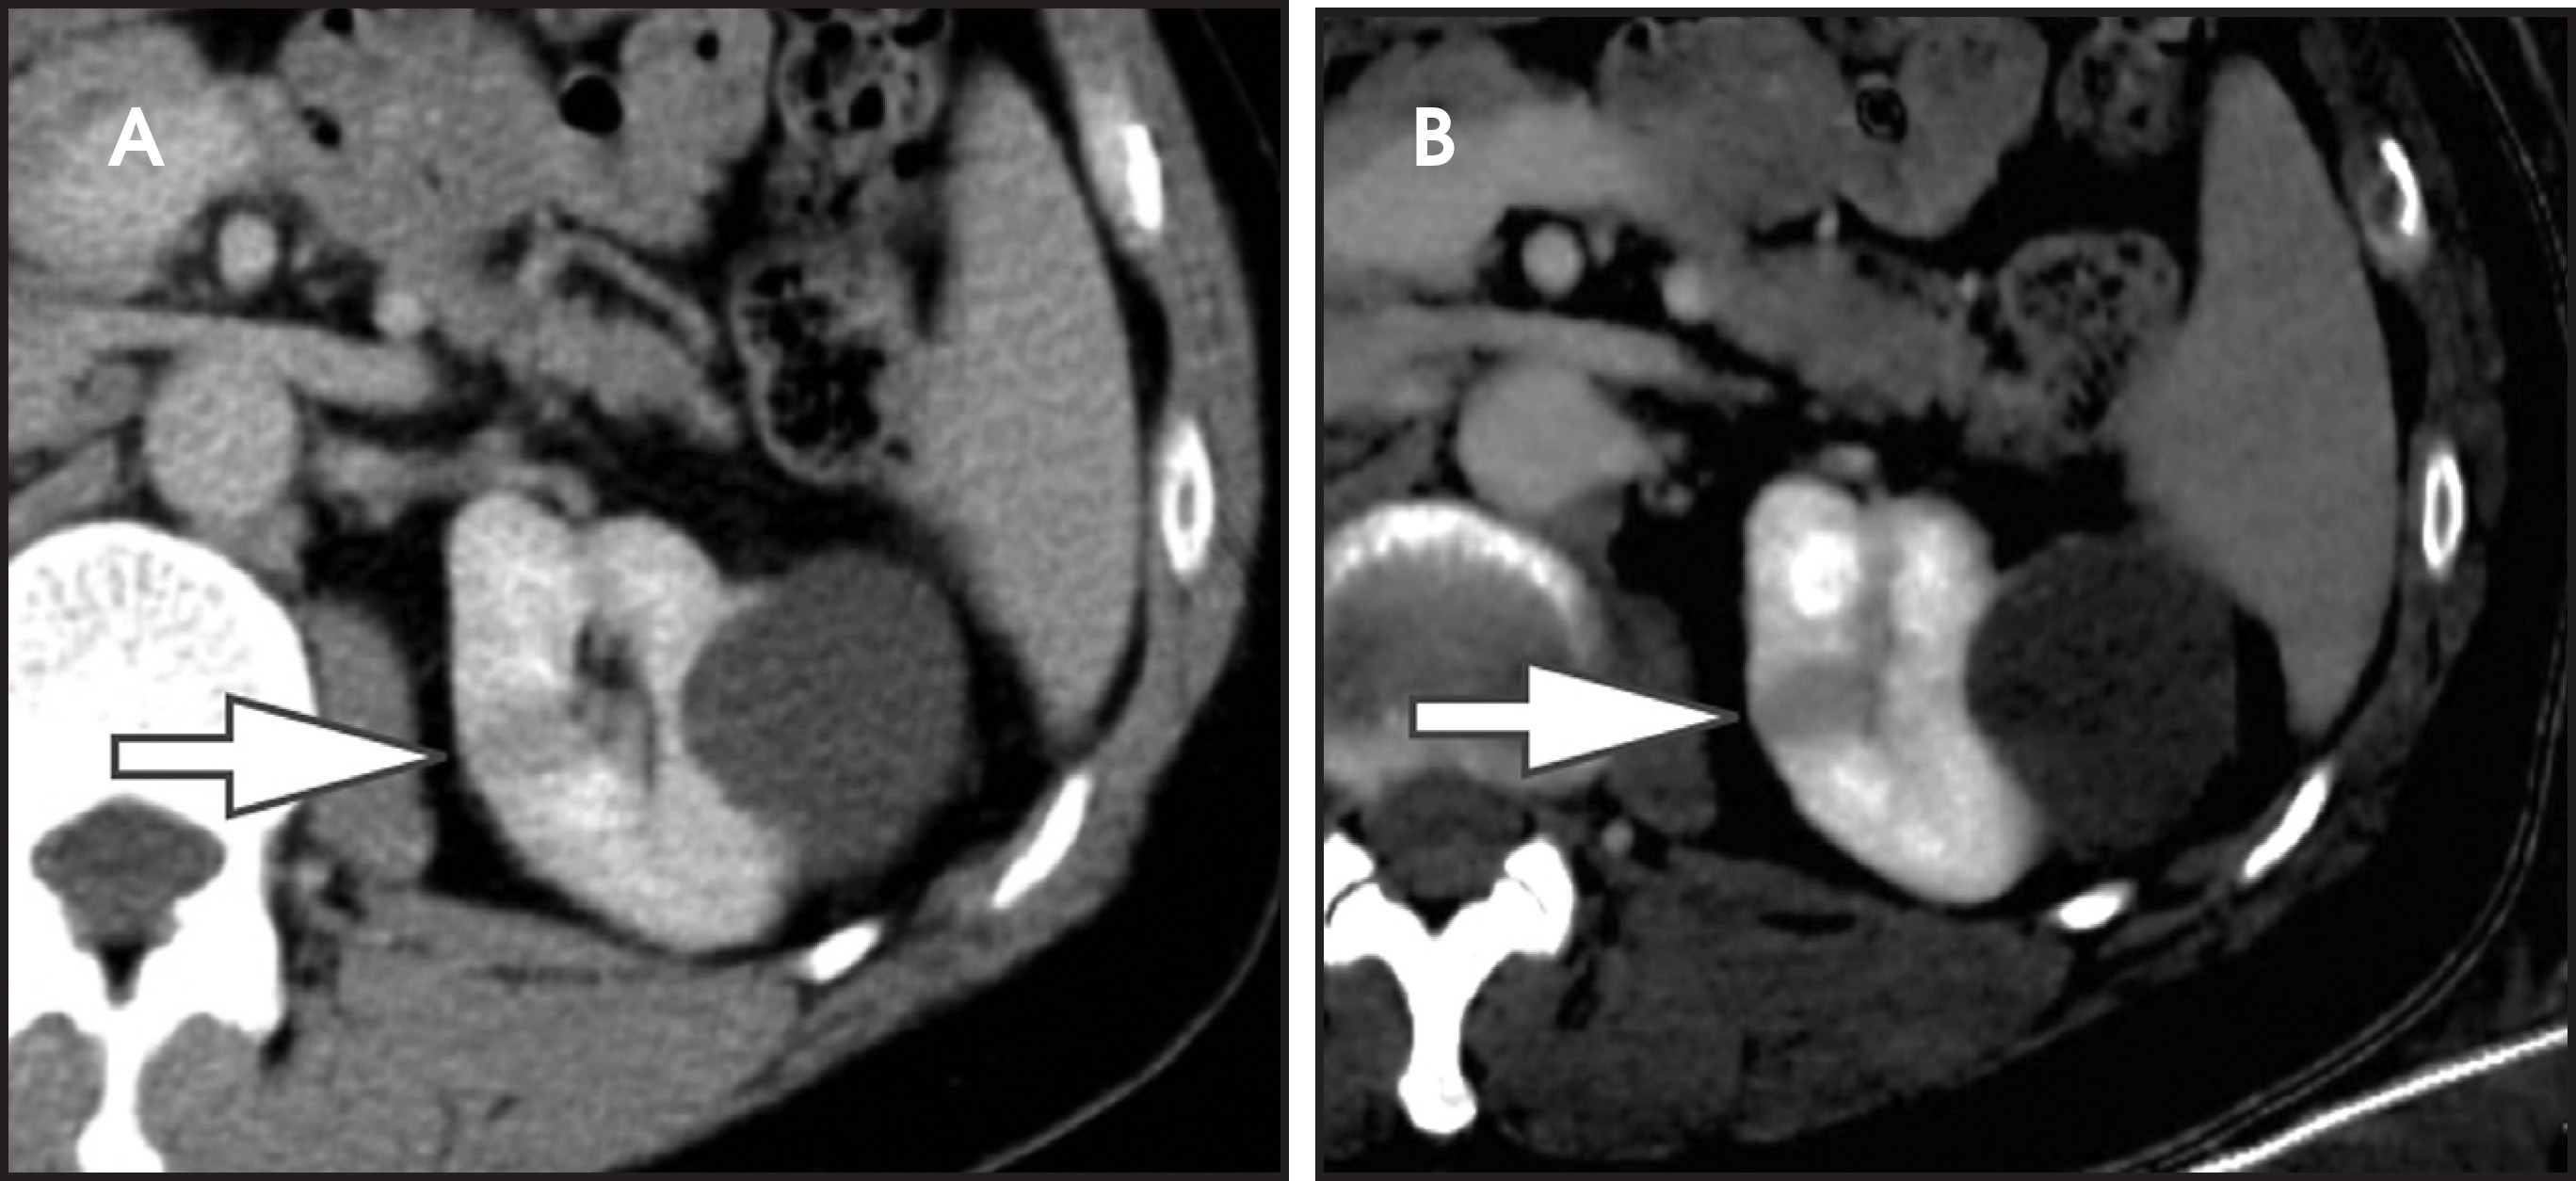
Differentiation of a hyperdense cyst from an enhancing renal mass is a common diagnostic challenge at single-phase CT. DECT can facilitate this challenge through the generation of virtual unenhanced (or water) and iodine images.8-16 Hyperdense cysts will demonstrate increased attenuation on virtual unenhanced images but show no iodine content on iodine images. Conversely, renal cell carcinomas will show iodine uptake on iodine images. These two lesions with vastly different prognoses and management can easily be differentiated at DECT in a single acquisition, which offers substantially less radiation than a multiphase renal mass protocol. Virtual unenhanced images can also provide supplementary information of fat, hemorrhage, and calcification within the lesion in the same fashion as true unenhanced images.
Renal stone characterization
In addition to symptoms, size, and location, the composition of renal stones is critical for appropriate clinical management. It is important for the urologist to differentiate uric acid stones (treated medically) from non-uric acid stones (treated with invasive methods like extracorporeal shockwave lithotripsy or percutaneous nephrolithotripsy). Although uric acid stones tend to have lower attenuation values than non-uric acid stones (ie, struvite, cystine, and calcium) on SECT, they may be difficult to distinguish due to overlap in attenuation values.17
DECT can help differentiation via analysis of underlying material composition, as uric acid stones are composed of lighter elements (hydrogen, carbon, oxygen, and nitrogen) while non-uric acid stones are composed of heavier elements (calcium, phosphorus, and sulfur). Uric acids stones demonstrate increased photon attenuation at 140 kVp because the attenuation is driven primarily by Compton scatter (due to lighter element chemical composition). Conversely, non-uric acid stones demonstrate increased attenuation at 80 kVp due to increased photoelectric effect contribution from the heavier elements nearing the k-edge of calcium (Z=20).
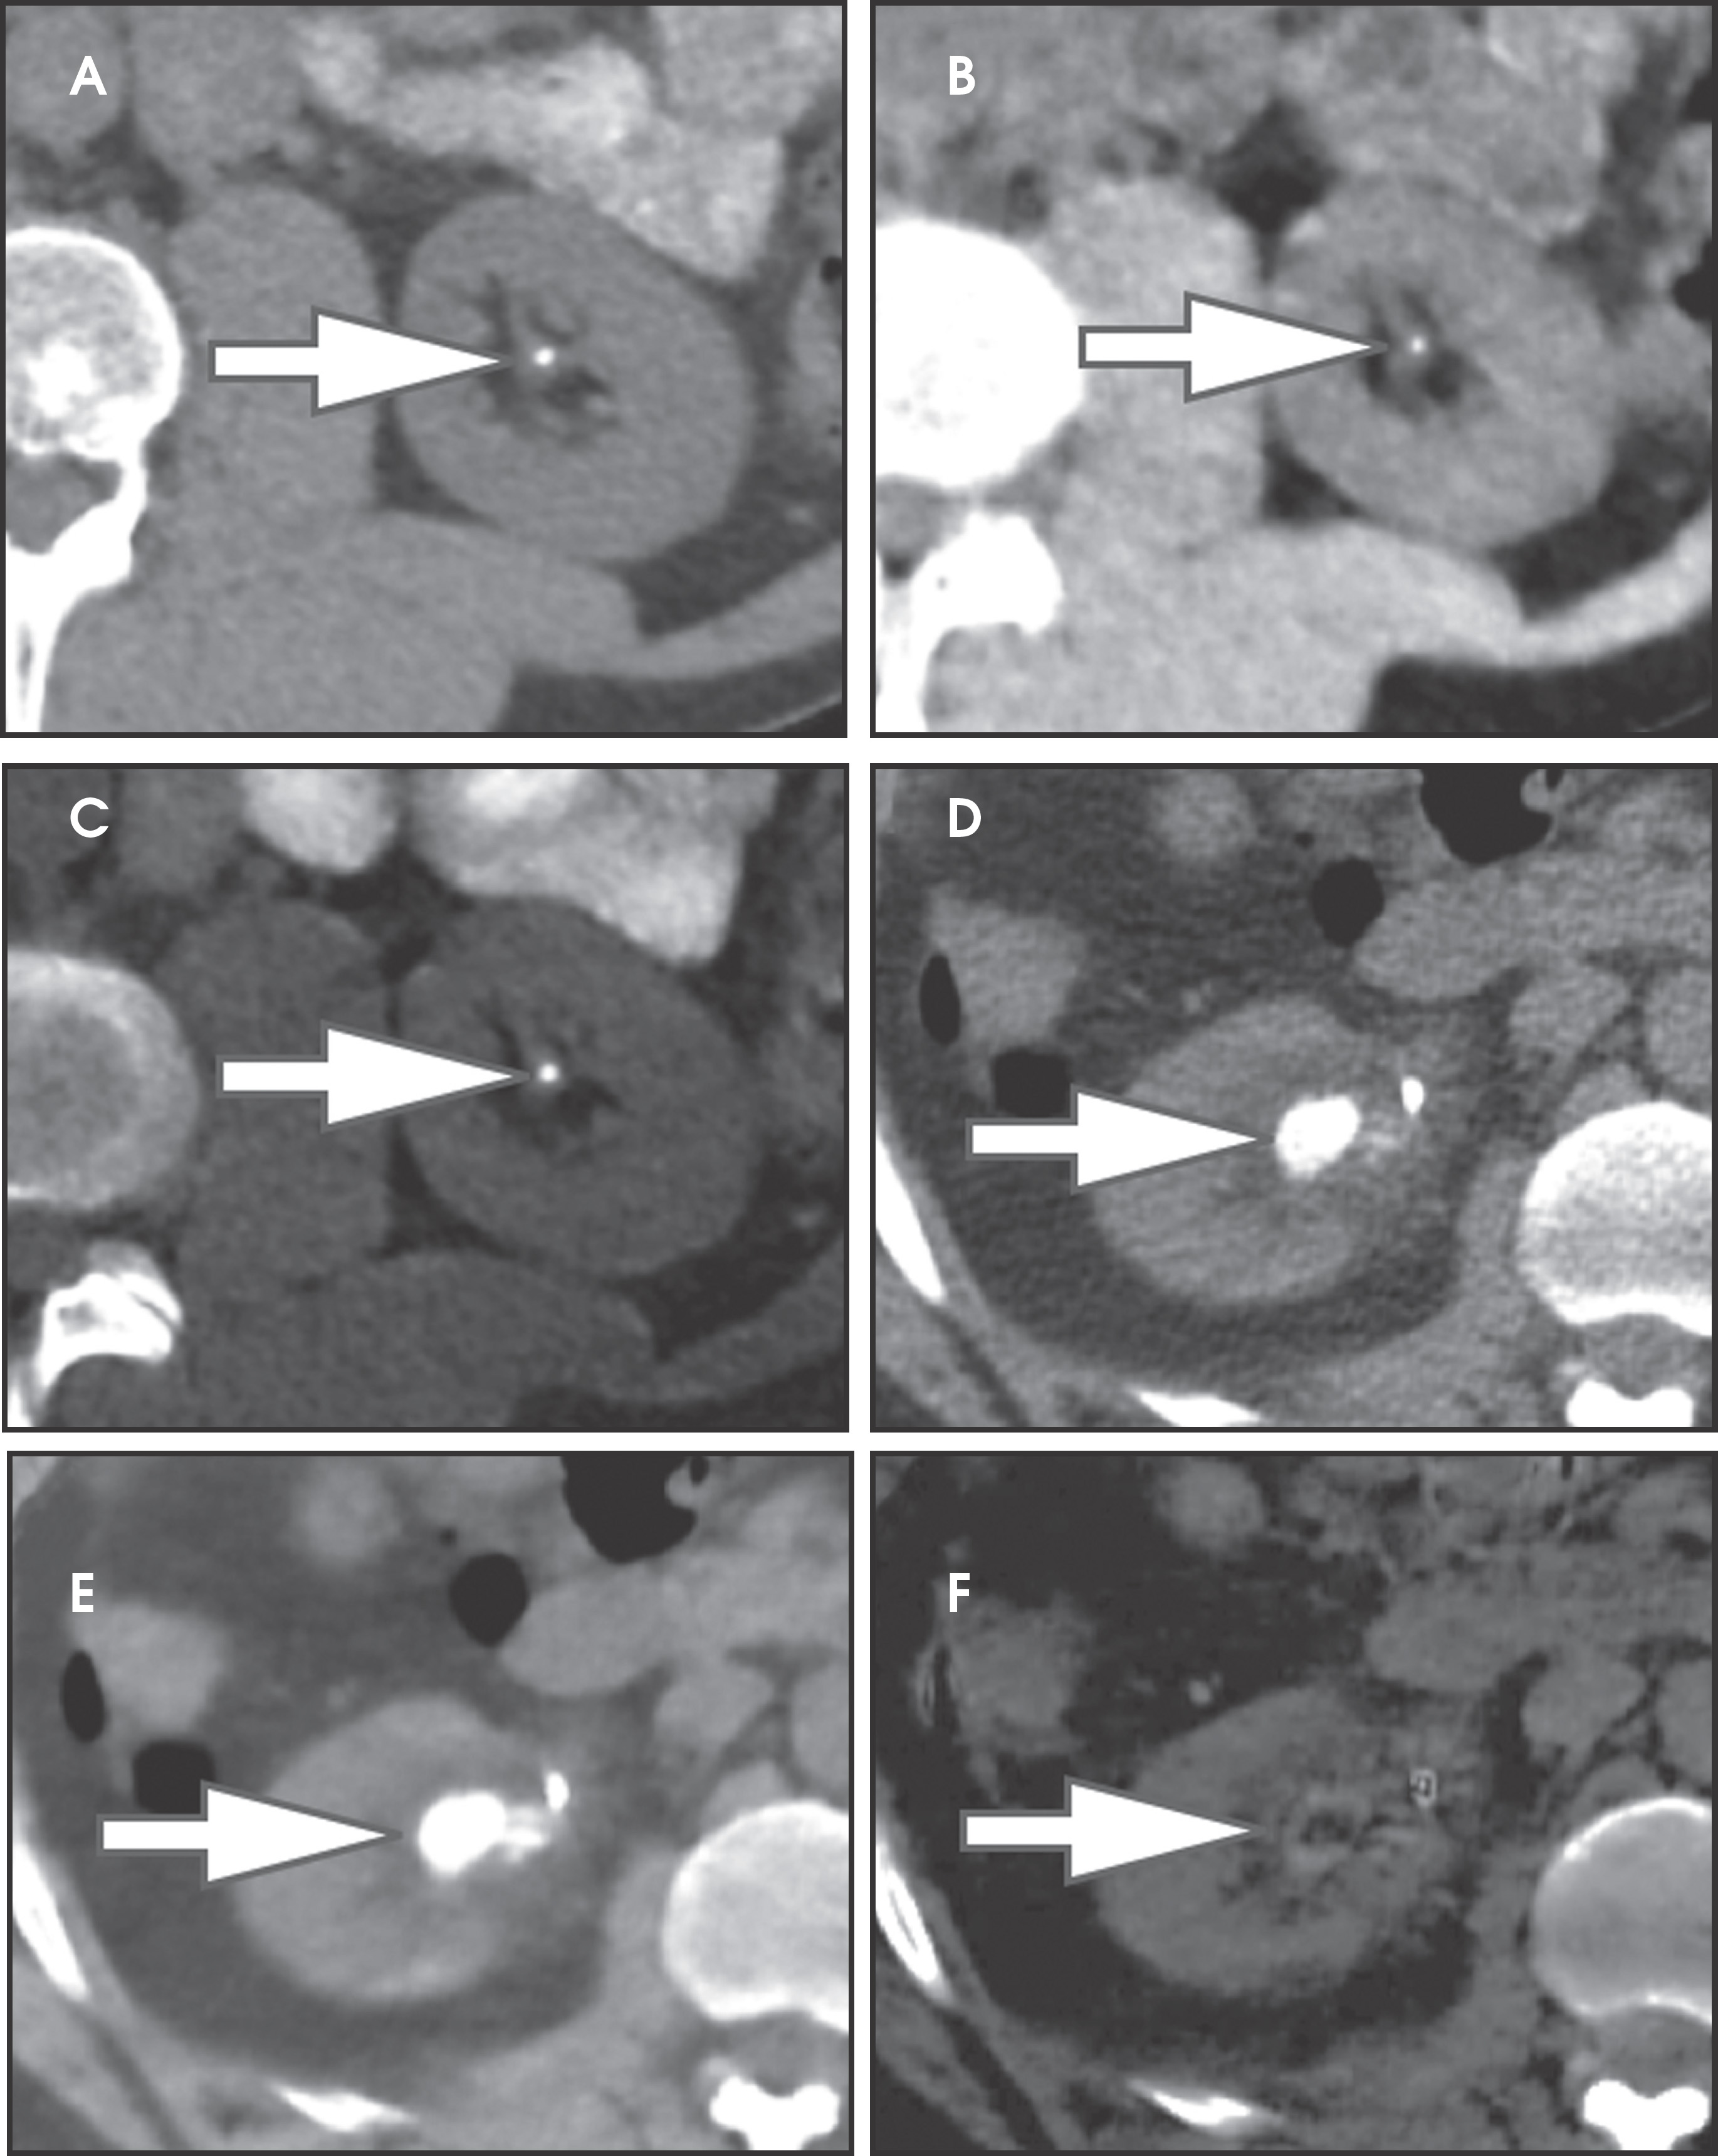
Using the two-material (basis pair) decomposition approach on ssDECT, water and iodine image datasets are generated. Stone visualization on water images only suggests uric acid calculi, whereas visualization on both water and iodine images implies non-uric acid stones (Figure 4). Effective Z (Zeff) images are an alternative approach for renal stone characterization and can be generated in an offline workstation. Zeff weights both the attenuation and atomic number of certain materials, thereby facilitating the identification of predominant materials within mixed stones. Low Zeff is commonly seen in uric acid stones, whereas high Zeff is seen in non-uric acid stones.
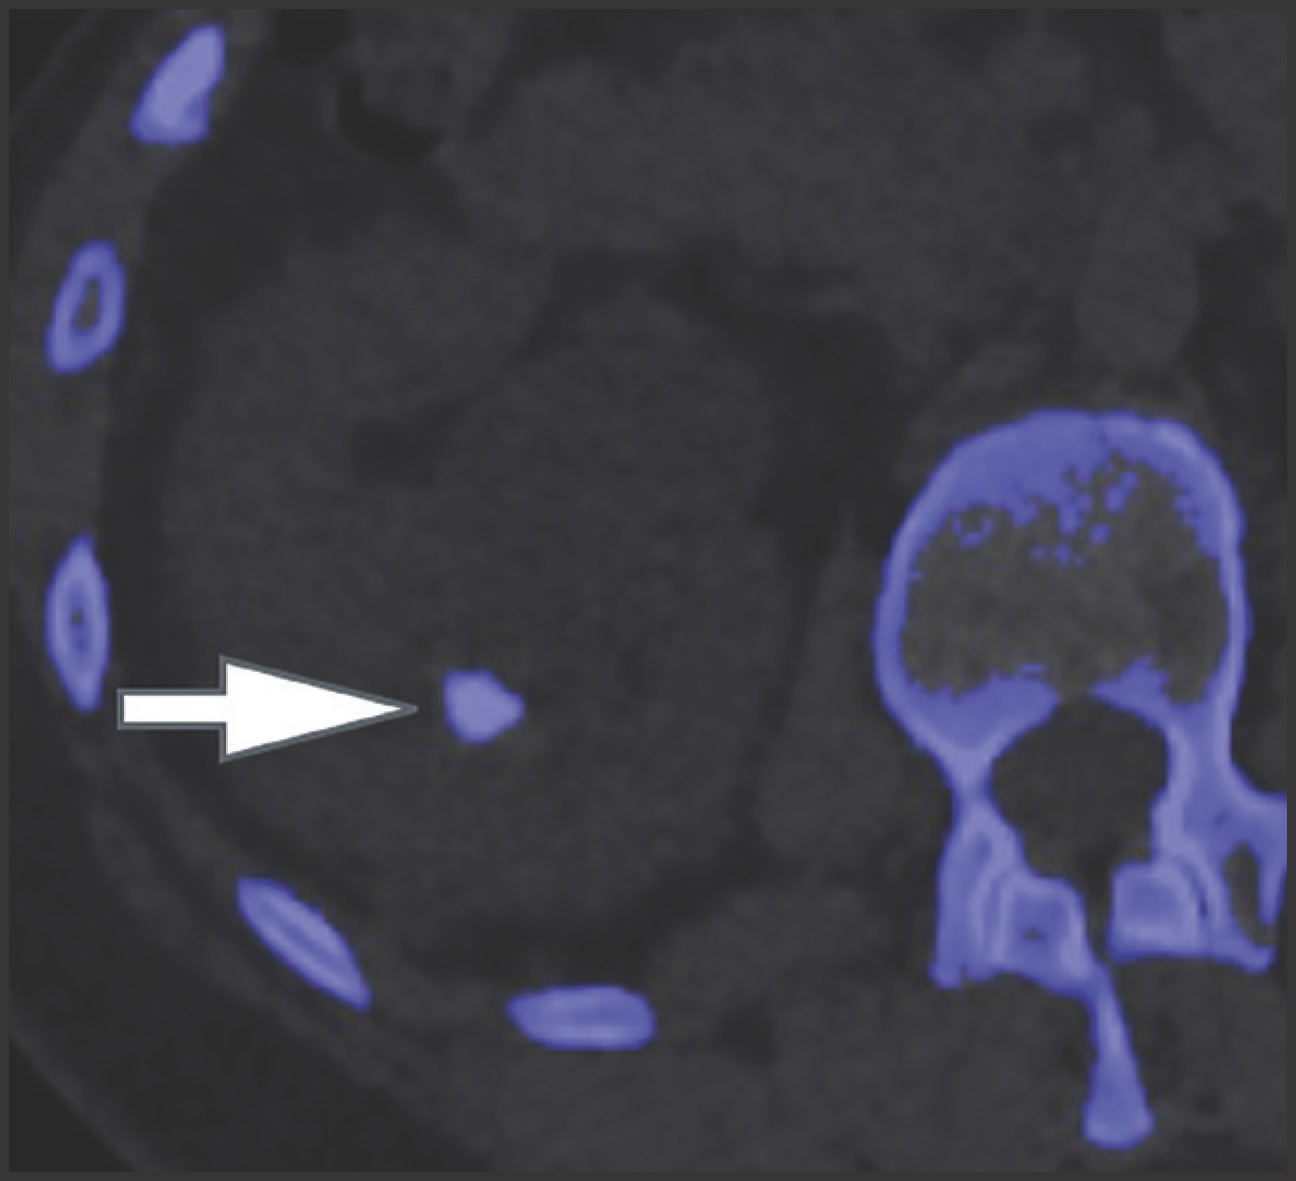
The algorithm for kidney stones in dsDECT assumes that all voxels are a mixture of calcium, uric acid, and water. Stones with X-ray attenuation profiles similar to calcium appear blue while stones with profiles similar to uric acid appear red (Figure 5).
Oncologic imaging
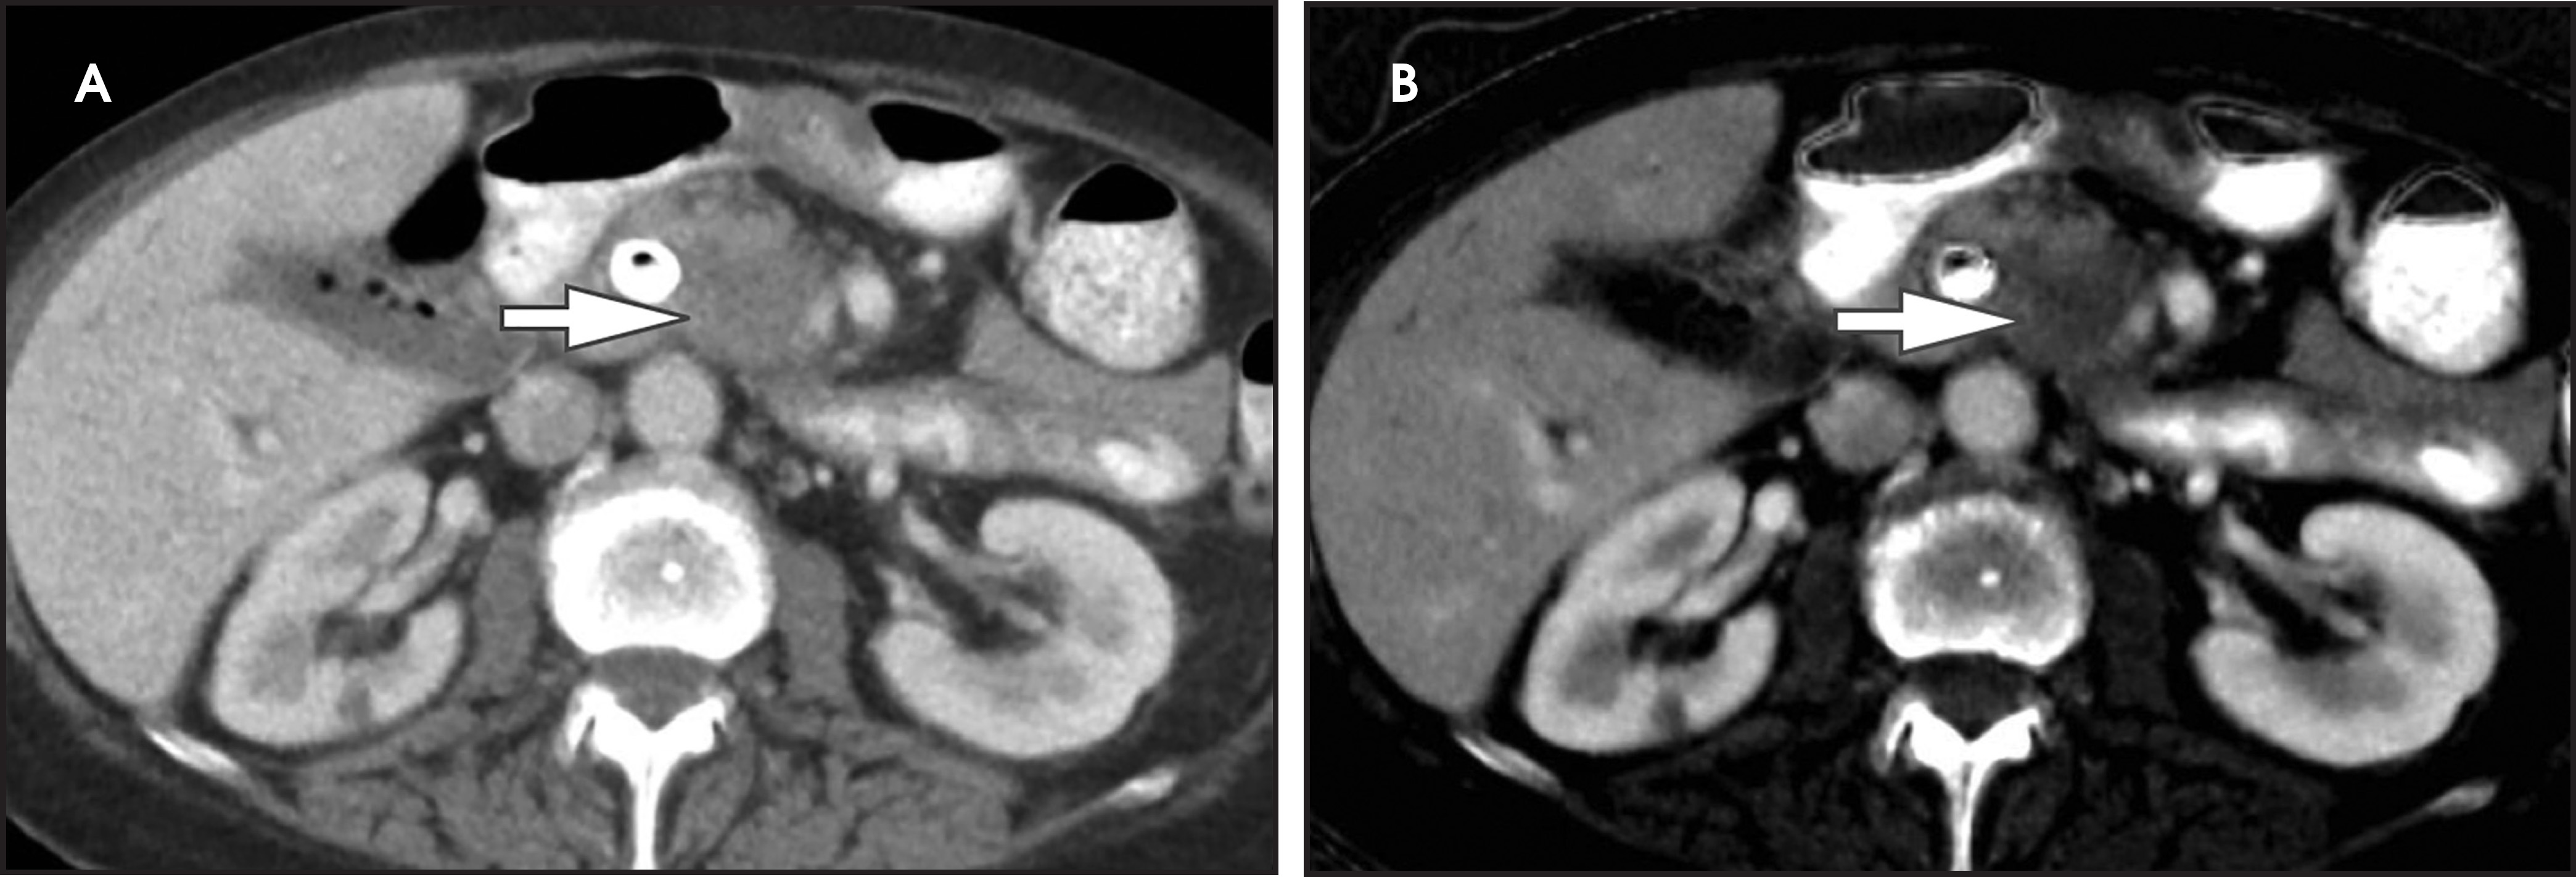
DECT has several applications in both initial and post-treatment oncologic imaging. By increasing lesion conspicuity, tumor margins are better delineated, allowing for more accurate size measurements (Figure 6). Accurate measurement on restaging examinations is important for guiding management, especially for patients in clinical trials in which tumor response is reliant on serial measurements according to Response Evaluation Criteria in Solid Tumors (RECIST) or World Health Organization (WHO) criteria, for example. DECT offers yet more potential for assessing treatment response due to the potential ability of quantitative iodine maps to evaluate and quantify tumor viability. Although this technique requires validation and standardization, it is an exciting development that may allow for characterization of tumor at a functional level that predates any change in size.18-19
In addition to increasing lesion conspicuity, low keV and material density images can also provide accurate delineation of locoregional extent of disease and relationships to adjacent vasculature that is useful to guide treatment planning.18,20 Of particular interest, iodine maps can help differentiate tumor from bland thrombus through qualitative and quantitative demonstration of iodine within the clot. This differentiation is critical in hepatocellular and renal cell carcinoma staging.
Finally, DECT can help assess response to treatment related to locoregional targeted therapies, such as ablation (eg, radiofrequency, microwave, cryo), targeted radiation therapy (eg, protons), and intra-arterial therapy (eg, selective internal radiation therapy [SIRT] and transarterial chemoembolization [TACE]). Iodine maps obtained immediately after radiofrequency ablation have shown better lesion conspicuity and internal homogeneity of the ablation zone, providing an additional benefit for assessing the safety margin after radiofrequency ablation.21 In our practice, we have observed that iodine images are helpful not only immediately after the procedure but also for follow up of patients undergoing hepatic microwave/radiofrequency ablation and renal cryo/radiofrequency ablation (Figure 7).
Vascular imaging
CT angiography (CTA) typically involves a multiphasic protocol with potential for higher contrast loads and radiation doses. DECT can play an important role in vascular imaging by improving image quality with less contrast and lower radiation dose compared to conventional CTA (Figure 8). Since tissues will attenuate more of the X-ray beam at photon energies closer to their k-edge, low energy DECT with customized VMC images can increase the attenuation of intravascular iodine while decreasing the administered contrast bolus. In addition, radiation dose can be significantly decreased through the utilization of virtual unenhanced images, which may eliminate the need for multiphasic imaging. These advantages of DECT can enhance CTA protocols while obtaining exquisite image quality. Such images may even be further improved by implementing calcium subtraction techniques at post-processing.22
Artifact reduction
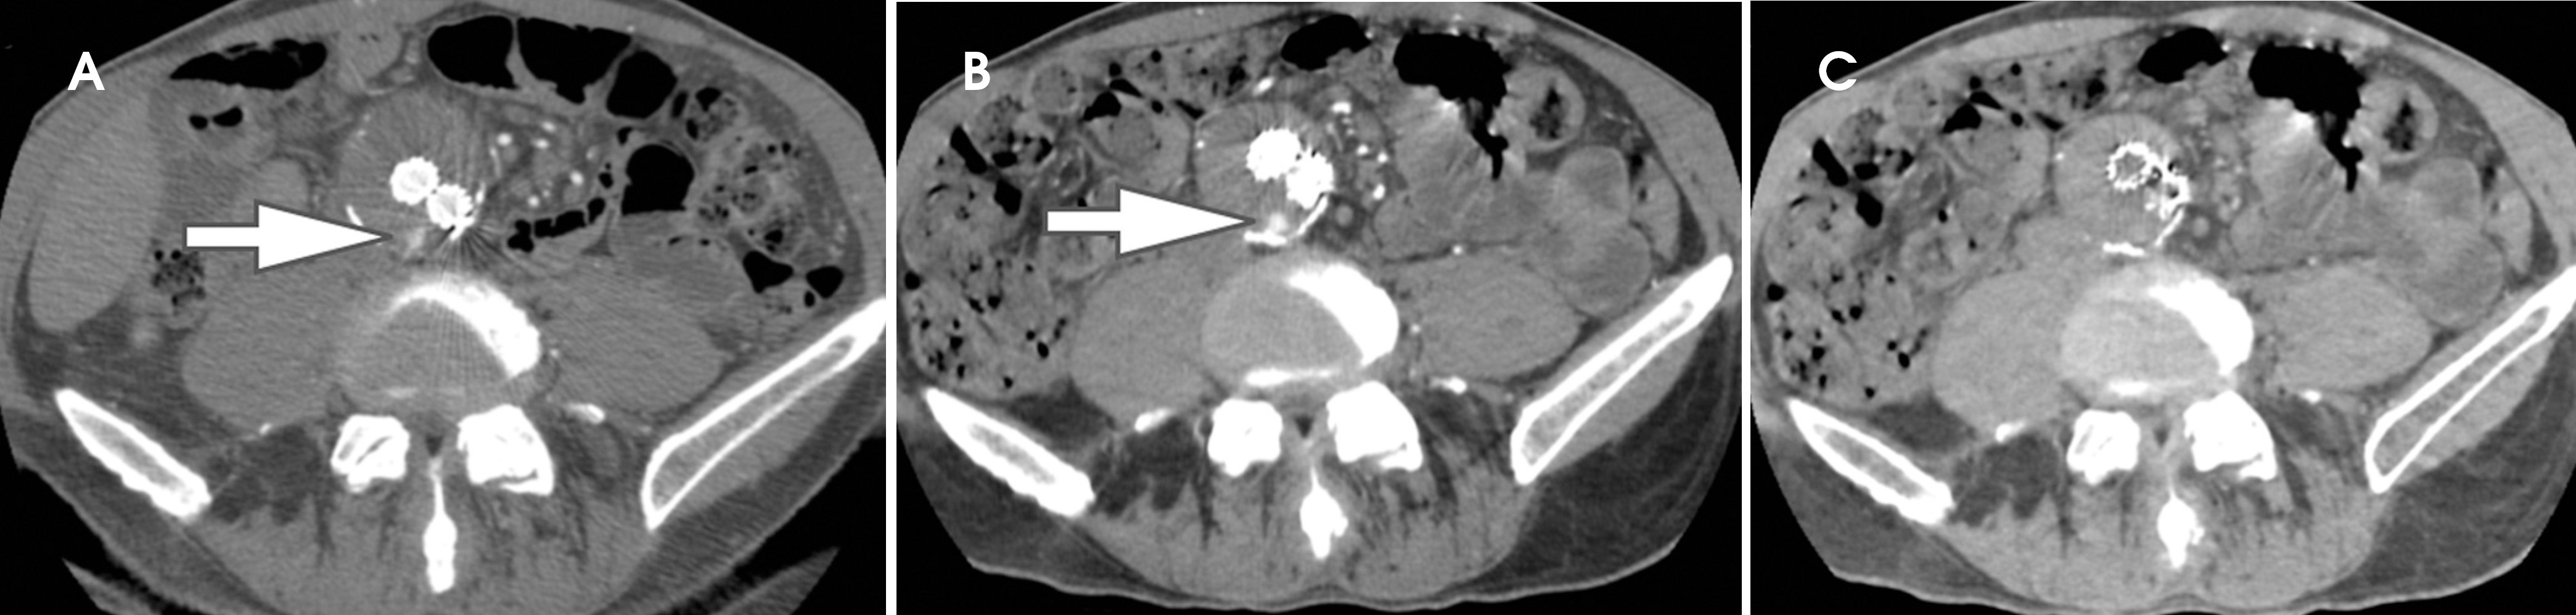
Artifact reduction is another potential benefit of DECT. Interpretation of conventional CT may be compromised in the setting of beam hardening and photon starvation artifacts related to metallic prostheses. Beam hardening commonly occurs as a result of attenuation of low energy photons within a polychromatic X-ray beam that contribute to scatter radiation and artifact but not image quality. By processing VMC images via DECT acquisition, these low energy photons are preferentially removed, eliminating their contribution to noise and artifact. Further artifact reduction can be accomplished through the application of metal artifact reduction software.23 Artifact reduction is helpful clinically when evaluation of the pelvis is limited by beam hardening and streak artifact related to a hip prosthesis, for example. It is also invaluable in vascular imaging, where iodine images can help reduce streak artifact in the assessment for vascular patency and endoleak detection in patients who have been treated with coil and/or Onyx embolization.
Future applications
Although the applications of DECT described in this article demonstrate exciting capabilities, the current clinical techniques only scratch the surface of the potential for material separation. Ongoing areas of active clinical research in abdominal imaging include detection and stratification of liver steatosis and fibrosis.24 Material separation techniques can be used as a tool for electronic cleansing of the colon on CT colonography by differentiating tagged fecal materials from luminal air and air-tagging mixtures.25 In musculoskeletal imaging, uric acid material decomposition images can help identify articular deposition of uric acid crystals (in addition to detection of uric acid renal stones). Material separation can also help detect bone marrow edema on CT to evaluate for subtle fractures in the setting of trauma or possible pathologic fracture. In neuroradiology, iodine images can be used to distinguish intracerebral hemorrhage from contrast after reperfusion therapy for acute ischemic stroke.26 Finally, material separation through DECT may allow for development of new intravenous and oral contrast media as well as quantification of additional materials like gold, iron, copper, and zinc.
Conclusion
Dual energy CT offers exciting applications and possibilities previously unavailable with conventional single energy CT. The potential benefits of DECT include increased lesion detection and characterization, improved oncologic staging and evaluation of treatment response, and reduced artifacts, all at comparable or even reduced radiation doses.
References
- Brenner D. Should we be concerned about the rapid increase in CT usage?. Rev Environ Health. 2010;25((1)):63-68.
- Chiro G, Brooks R, Kessler R. Tissue signatures with dual-energy computed tomography. Radiology. 1979;131((2)):521-523.
- Genant H, Boyd D. Quantitative bone mineral analysis using dual energy computed tomography. Invest Radiol. 1977;12((6)):545-551.
- McDavid W, Waggener R, Dennis M. Estimation of chemical composition and density from computed tomography carried out at a number of energies. Invest Radiol. 1977;12((2)):189-194.
- Millner M, McDavid W, Waggener R. Extraction of information from CT scans at different energies. Med Phys. 1979;6((1)):70-71.
- Patel B, Thomas J, Lockhart M. Single-source dual-energy spectral multidetector CT of pancreatic adenocarcinoma: optimization of energy level viewing significantly increases lesion contrast. Clin Radiol. 2013;68((2)).
- Matsumoto K, Jinzaki M, Tanami Y. Virtual monochromatic spectral imaging with fast kilovoltage switching: improved image quality as compared with that obtained with conventional 120-kVp CT. Radiology. 2011;259((1)).
- Silva A, Morse B, Hara A. Dual-energy (spectral) CT: applications in abdominal imaging. Radiographics. 2011;31((4)):1047-1050.
- Brown C, Hartman R, Dzyubak O. Dual-energy CT iodine overlay technique for characterization of renal masses as cyst or solid: a phantom feasibility study. Eur Radiol. 2009;19((5)).
- Song K, Kim C, Park B. Utility of iodine overlay technique and virtual unenhanced images for the characterization of renal masses by dual-energy CT. AJR Am J Roentgenol. 2011;197((6)).
- Chandarana H, Megibow A, Cohen B. Iodine quantification with dual-energy CT: phantom study and preliminary experience with renal masses. AJR Am J Roentgenol. 2011;196((6)).
- Graser A, Johnson T, Hecht E. Dual-energy CT in patients suspected of having renal masses: can virtual nonenhanced images replace true nonenhanced images?. Radiology. 2009;252((2)).
- Graser A, Becker C, Staehler M. Single-phase dual-energy CT allows for characterization of renal masses as benign or malignant. Invest Radiol. 2010;45((7)).
- Kaza R, Caoili E, Cohan R. Distinguishing enhancing from nonenhancing renal lesions with fast kilovoltage-switching dual-energy CT. AJR Am J Roentgenol. 2011;197((6)).
- Leschka S, Stolzmann P, Baumüller S. Performance of dual-energy CT with tin filter technology for the discrimination of renal cysts and enhancing masses. Acad Radiol. 2010;17((4)).
- Neville A, Gupta R, Miller C. Detection of renal lesion enhancement with dual-energy multidetector CT. Radiology. 2011;259((1)).
- Kulkarni N, Eisner B, Pinho D. Determination of renal stone composition in phantom and patients using single-source dual-energy computed tomography. J Comput Assist Tomogr. 2013;37:37-45.
- DeCecco C, Darnell A, Rengo M. Dual-energy CT: oncologic applications. AJR Am J Roentgenol. 2012;199((5)).
- Jiang T, Zhu A, Sahani D. Established and novel imaging biomarkers for assessing response to therapy in hepatocellular carcinoma. J Hepatol. 2013;58((1)).
- Marin D, Nelson R, Barnhart H. Detection of pancreatic tumors, image quality, and radiation dose during the pancreatic parenchymal phase: effect of a low-tube-voltage, high-tube-current CT technique–preliminary results. Radiology. 2010;256((2)).
- Lee S, Lee J, Kim K. Dual-energy computed tomography to assess tumor response to hepatic radiofrequency ablation: potential diagnostic value of virtual noncontrast images and iodine maps. Invest Radiol. 2011;46((2)).
- Coursey C, Nelson R, Boll D. Dual-energy multidetector CT: how does it work, what can it tell us, and when can we use it in abdominopelvic imaging?. RadioGraphics. 2010;30((4)):1037-1055.
- Lee Y, Park K, Song H. Metal artefact reduction in gemstone spec- tral imaging dual-energy CT with and with- out metal artefact reduction software. Eur Radiol. 2012;22((6)).
- Lamb P, Sahani D, Fuentes-Orrego J. Stratification of patients with liver fibrosis using Dual-Energy CT. IEEE Trans Med Imaging. 2014.
- Cai W, Kim S, Lee J. Informatics in radiology: dual-energy electronic cleansing for fecal-tagging CT colonography. RadioGraphics. 2013;33((3)):891-912.
- Gupta R, Phan C, Leidecker C. Evaluation of dual-energy CT for differentiating intracerebral hemorrhage from iodinated contrast material staining. Radiology. 2010;257((1)):205-211.
Citation
. Dual energy CT in practice: Basic principles and applications. Applied Radiology. 2016;45(7):6-12. doi:10.37549/AR2291.