Focal lesions in the cirrhotic liver
Applied Radiology — Vol. 42 , Issue 10 , pp. 17 -23
DOI: 10.37549/AR2025
Published: October 1, 2013
Categories
The cirrhotic liver provides a challenging background for the detection of hepatocellular carcinoma (HCC).1,2 Although MRI is the most accurate imaging method for the detection and characterization of HCC, all imaging techniques may fail to detect small HCCs.3 There is now broad agreement that in cirrhosis, there is a stepwise progression from regenerative nodules (RN) to HCCs along the following pathway: RN, low-grade dysplastic nodule (DN), high-grade dysplastic nodule (DN), and HCC.4,5 An important caveat in this pathway is that most RNs do not progress to DNs and, although DNs are considered premalignant lesions, they may remain stable or even regress without evolving into HCCs.
Along this pathway, functional changes occur within the lesion that affect its imaging characteristics:
In addition, benign lesions may be present, confounding imaging interpretation.
Ultrasound
Current guidelines recommend that cirrhotic patients undergo ultrasound screening every 6 months.6,7 Small HCCs have a wide range of appearances on ultrasound and can demonstrate increased or decreased echogenicity in relation to the adjacent liver parenchyma (Figures 1 and 2). Large HCCs may show internal heterogeneity due to hemorrhage, necrosis, or fat. Ultrasound usually cannot confidently establish the diagnosis of HCC. Thus, new hepatic nodules detected during ultrasound screening warrant further evaluation, which is based on the lesion’s size:
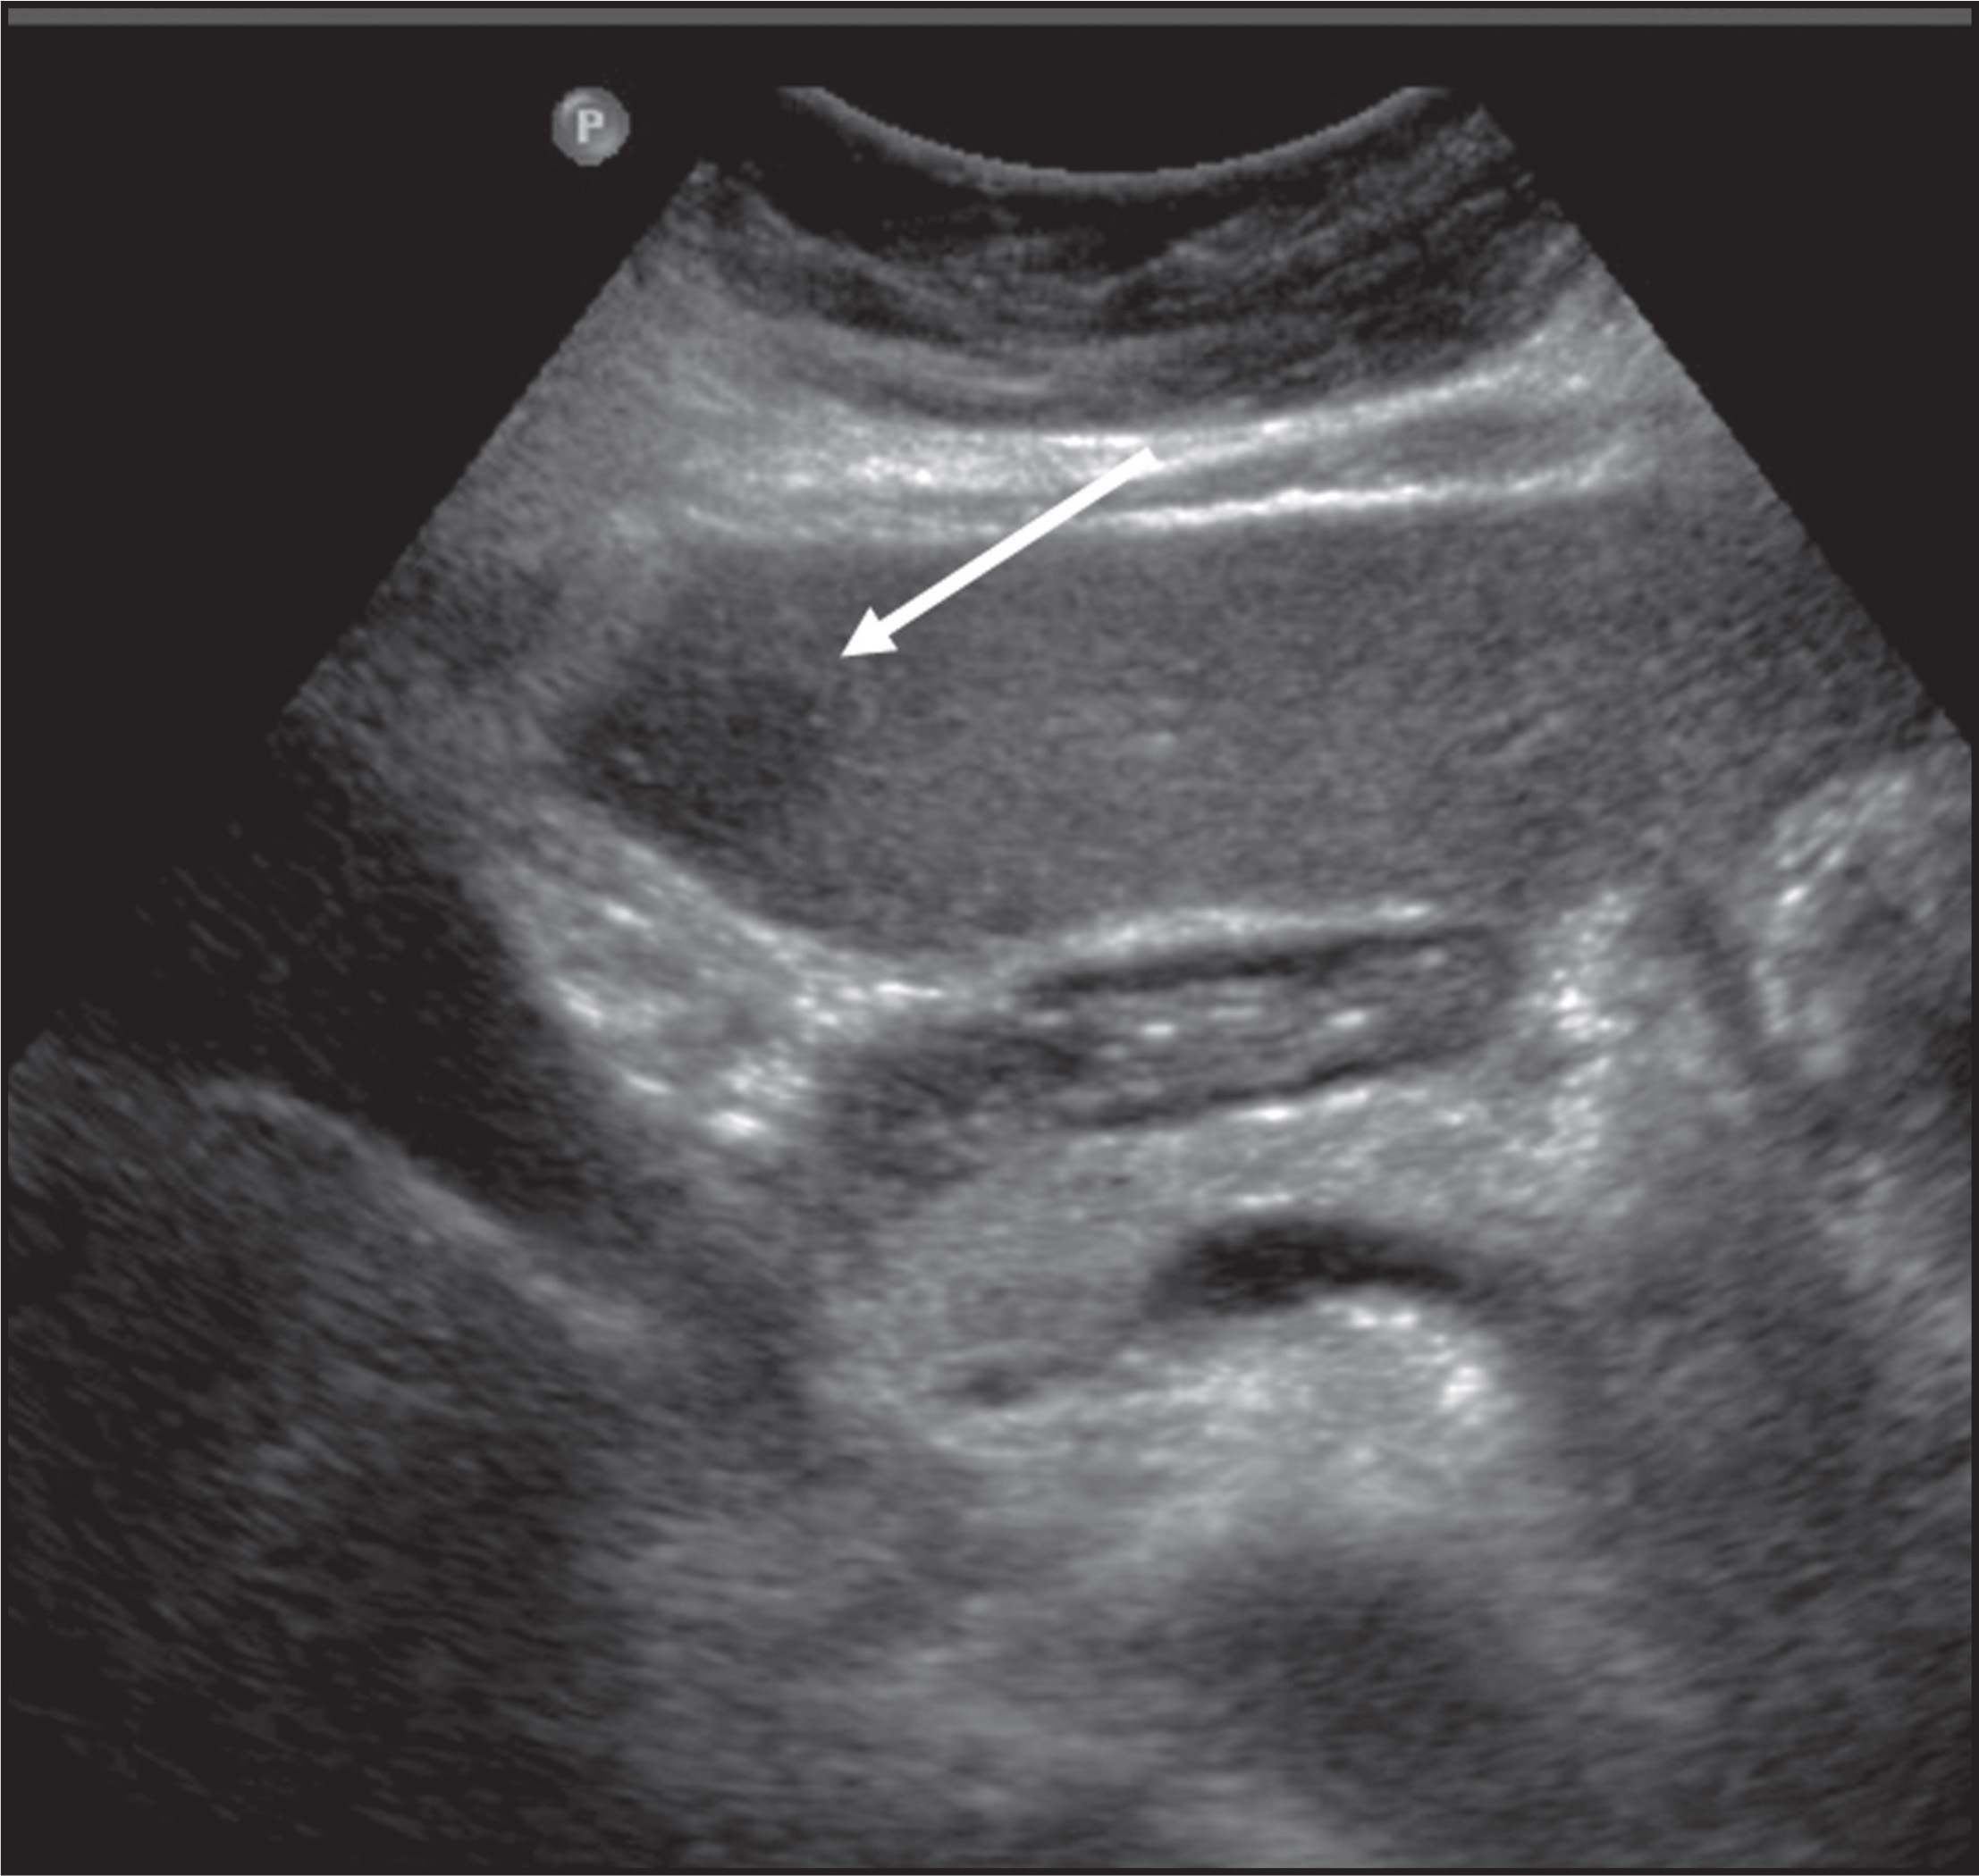
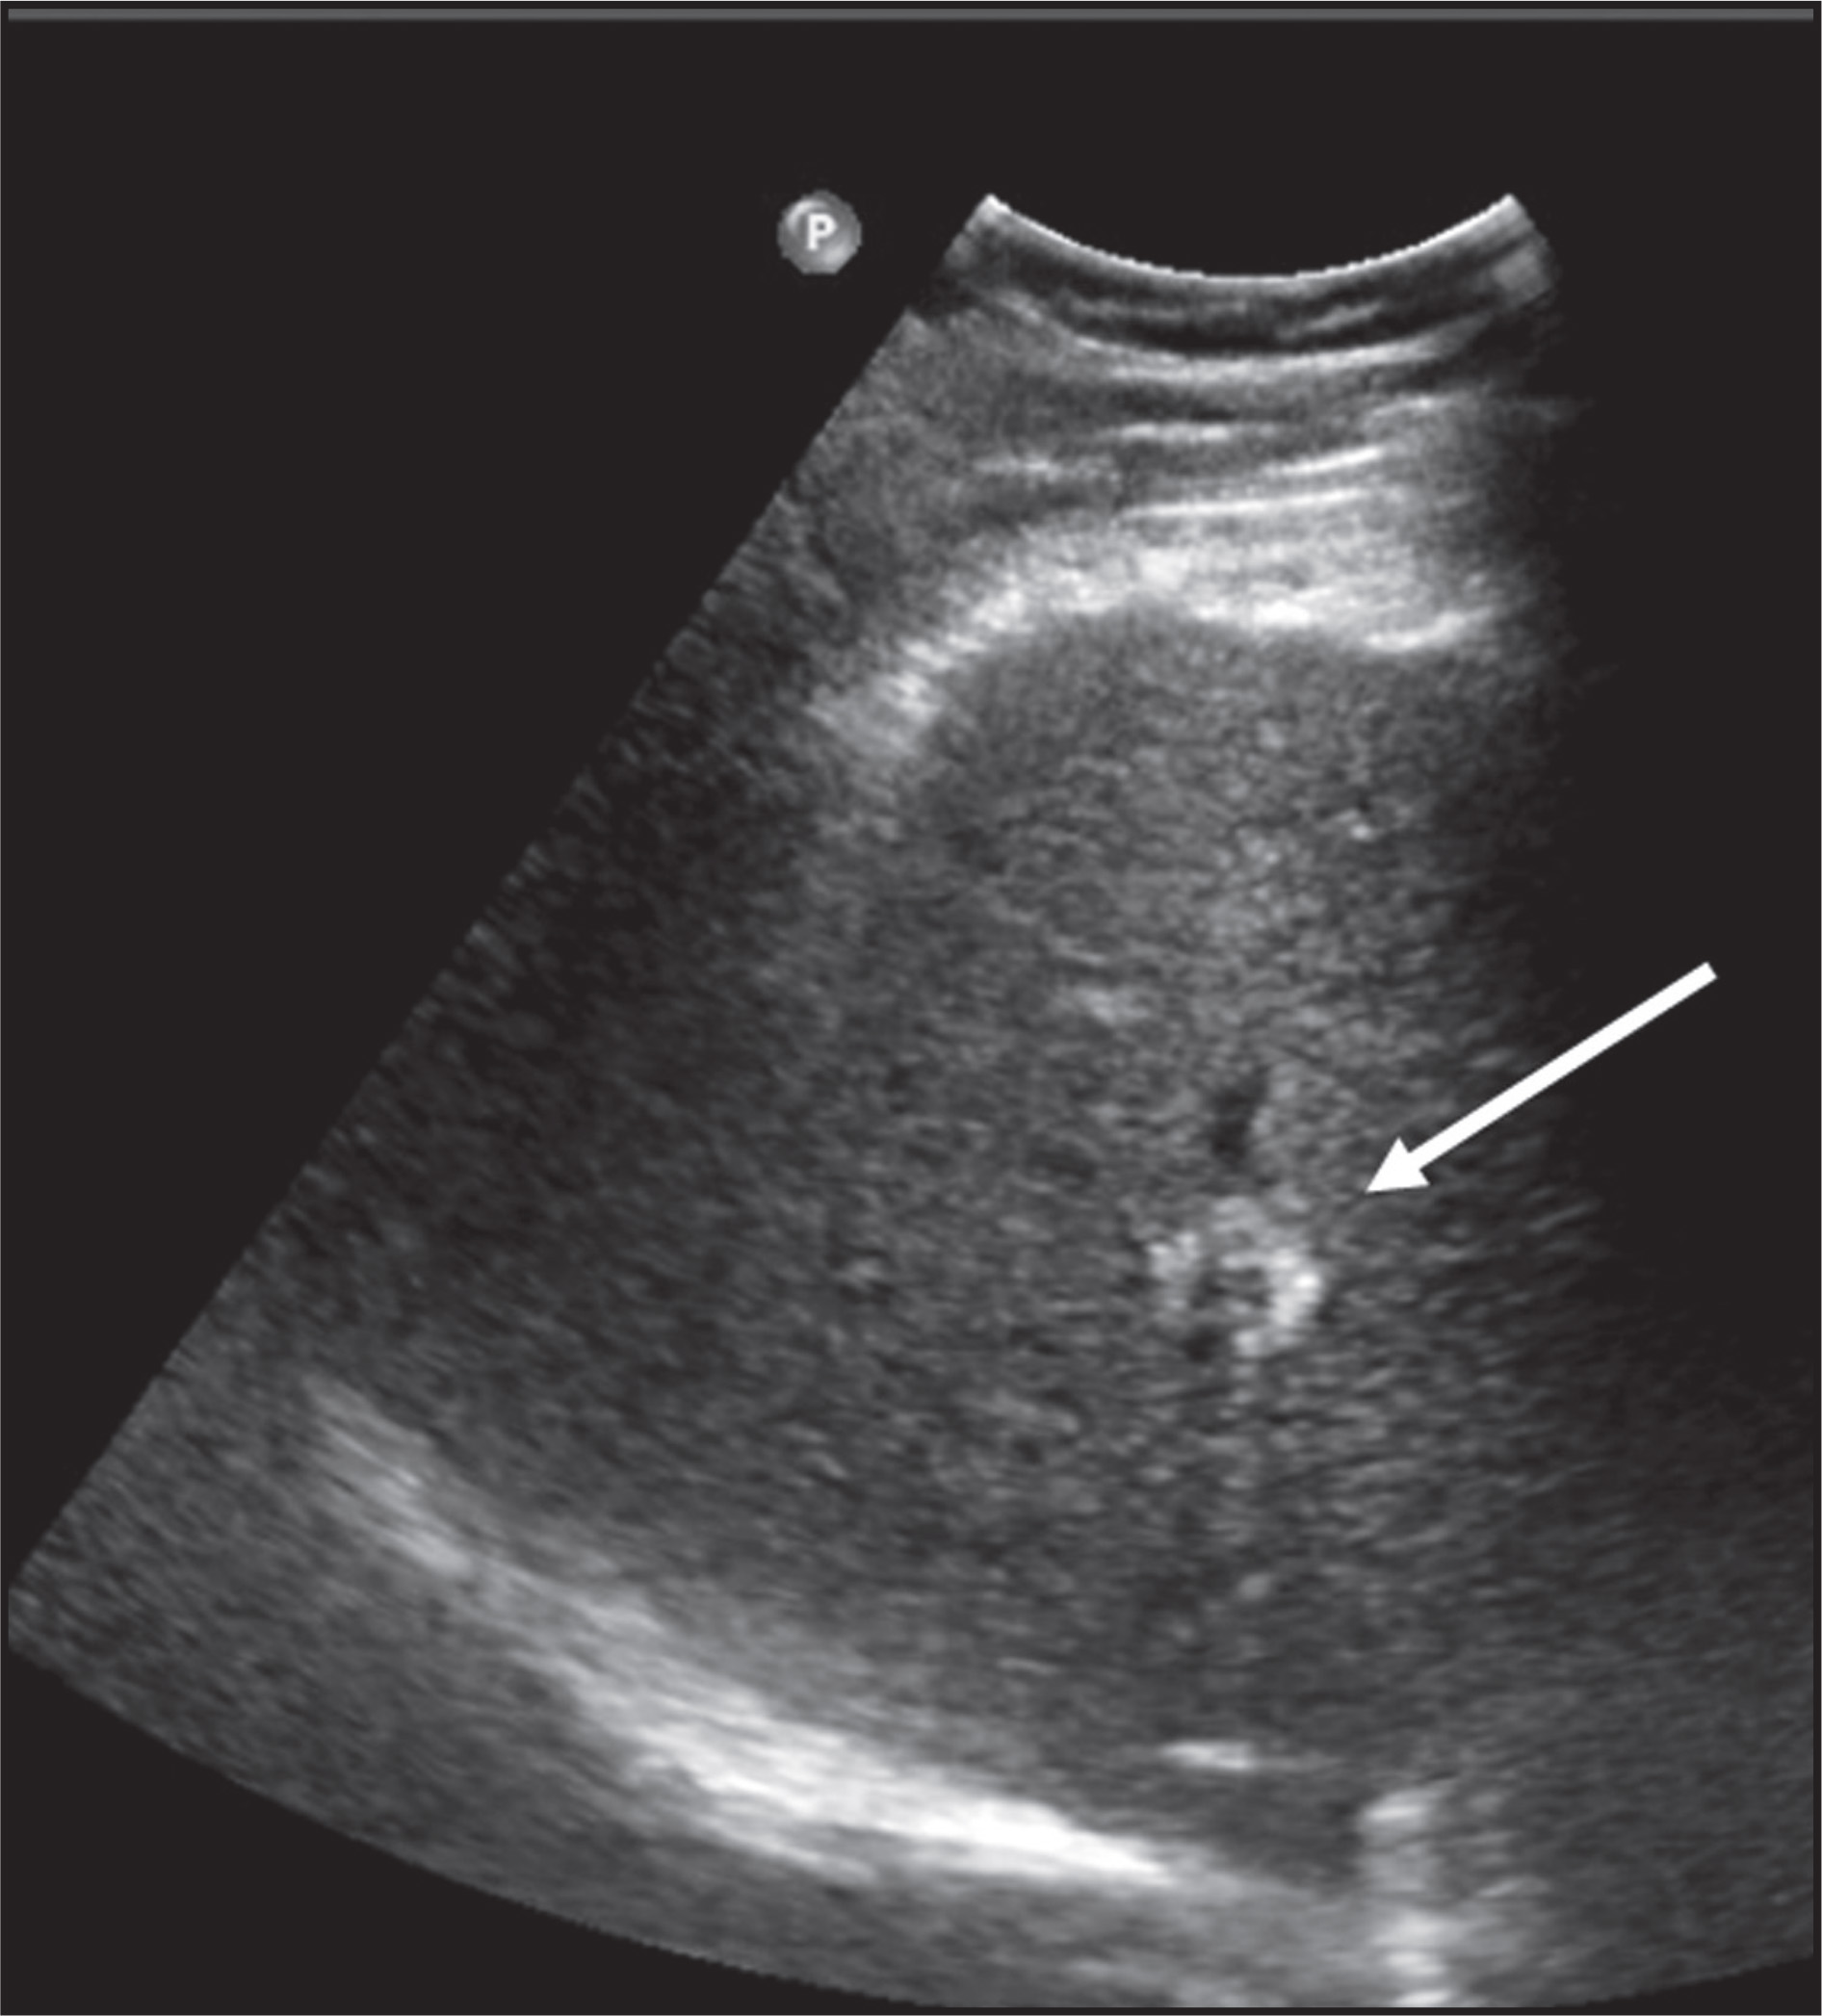
Nodules < 1 cm may be followed-up by ultrasound every 3 to 4 months, for 2 years.8-10
Nodules ranging from 1 to 2 cm should be further characterized at time of detection using contrast-enhanced CT or MRI, or biopsy.8-10
Liver biopsies (and some ablation procedures) are preferably performed under ultrasound guidance. For this reason, it is essential to determine if the nodule is detectable at ultrasound.11
CT and MRI
Technique
Noncontrast imaging is valuable for assessing diffuse hepatic changes, such as fat infiltration and iron deposition, and focal changes such as subtle calcification and hemorrhage.9 However, CT and MRI allow multiphasic postintravenous (IV) contrast imaging, which facilitates detection and characterization of focal liver lesions and is widely used for this purpose. Multiple phases may be obtained during contrast enhancement; these may include early and late arterial phases, as well as portal and equilibrium phases. Protocol optimization and optimal timing of the post contrast phases maximizes the lesion-to-liver contrast. The minimum requirement for liver imaging is an arterial phase (20-40 sec postcontrast injection) and a portal venous phase (60-80 sec postcontrast injection).1,2,12 Many systems allow direct triggering of the acquisition by observing contrast medium arrival in the aorta; this approach provides more consistent results.
MRI has a wider range of contrast mechanisms than CT. A broad range of liver MRI protocols is possible due to the numerous combinations of field strength, pulse sequence implementation, and interdependent sequence parameters available.13-17 Comprehensive liver imaging using MRI now includes T2- and in- and opposed-phase T1-weighted imaging, in addition to dynamic post-contrast imaging.
Regenerative nodules
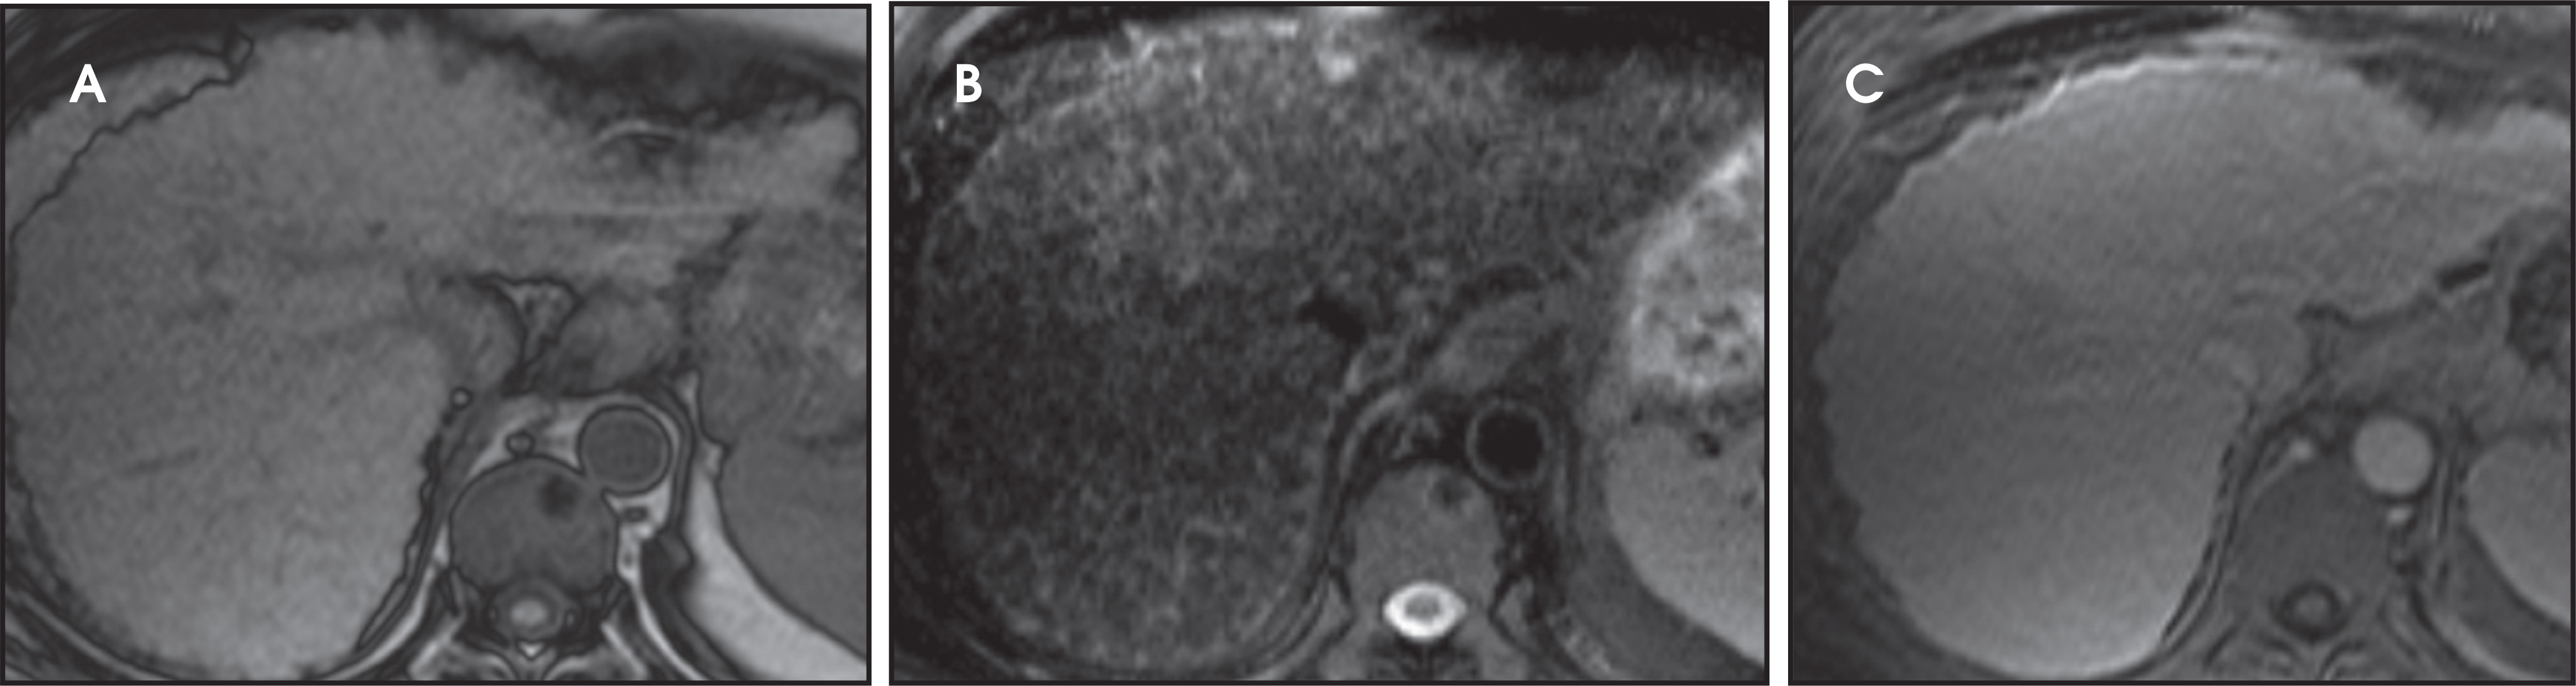
Regenerative nodules (RN) are present throughout the background liver parenchyma of cirrhotic livers (Figure 3). In RNs, all the normal cellular components of liver parenchyma are present: hepatocytes, Kupffer cells, and biliary ducts.4,5 Most RNs are indistinguishable from liver parenchyma on imaging, although some demonstrate iron, glycogen, and copper accumulation, which may allow for their detection on imaging.4,18 At CT, these may appear slightly hypo- or hyperdense compared to the surrounding parenchyma. On T2W images, the accumulation of iron in RNs typically appears as low SI compared to the surrounding liver parenchyma. In addition, fibrous septa surrounding RNs often have increased SI on T2W images. On T1W images, RNs vary in appearance and can demonstrate hypo-, iso-, or hyper-intensity relative to the surrounding liver. Hepatic artery and portal vein blood supply, as well as hepatic venous drainage, are not altered in RNs. Thus, following contrast administration RNs show enhancement similar to the normal liver parenchyma on all phases.4 Finally, RNs are usually smaller than 2 cm.3,4
Dysplastic nodules
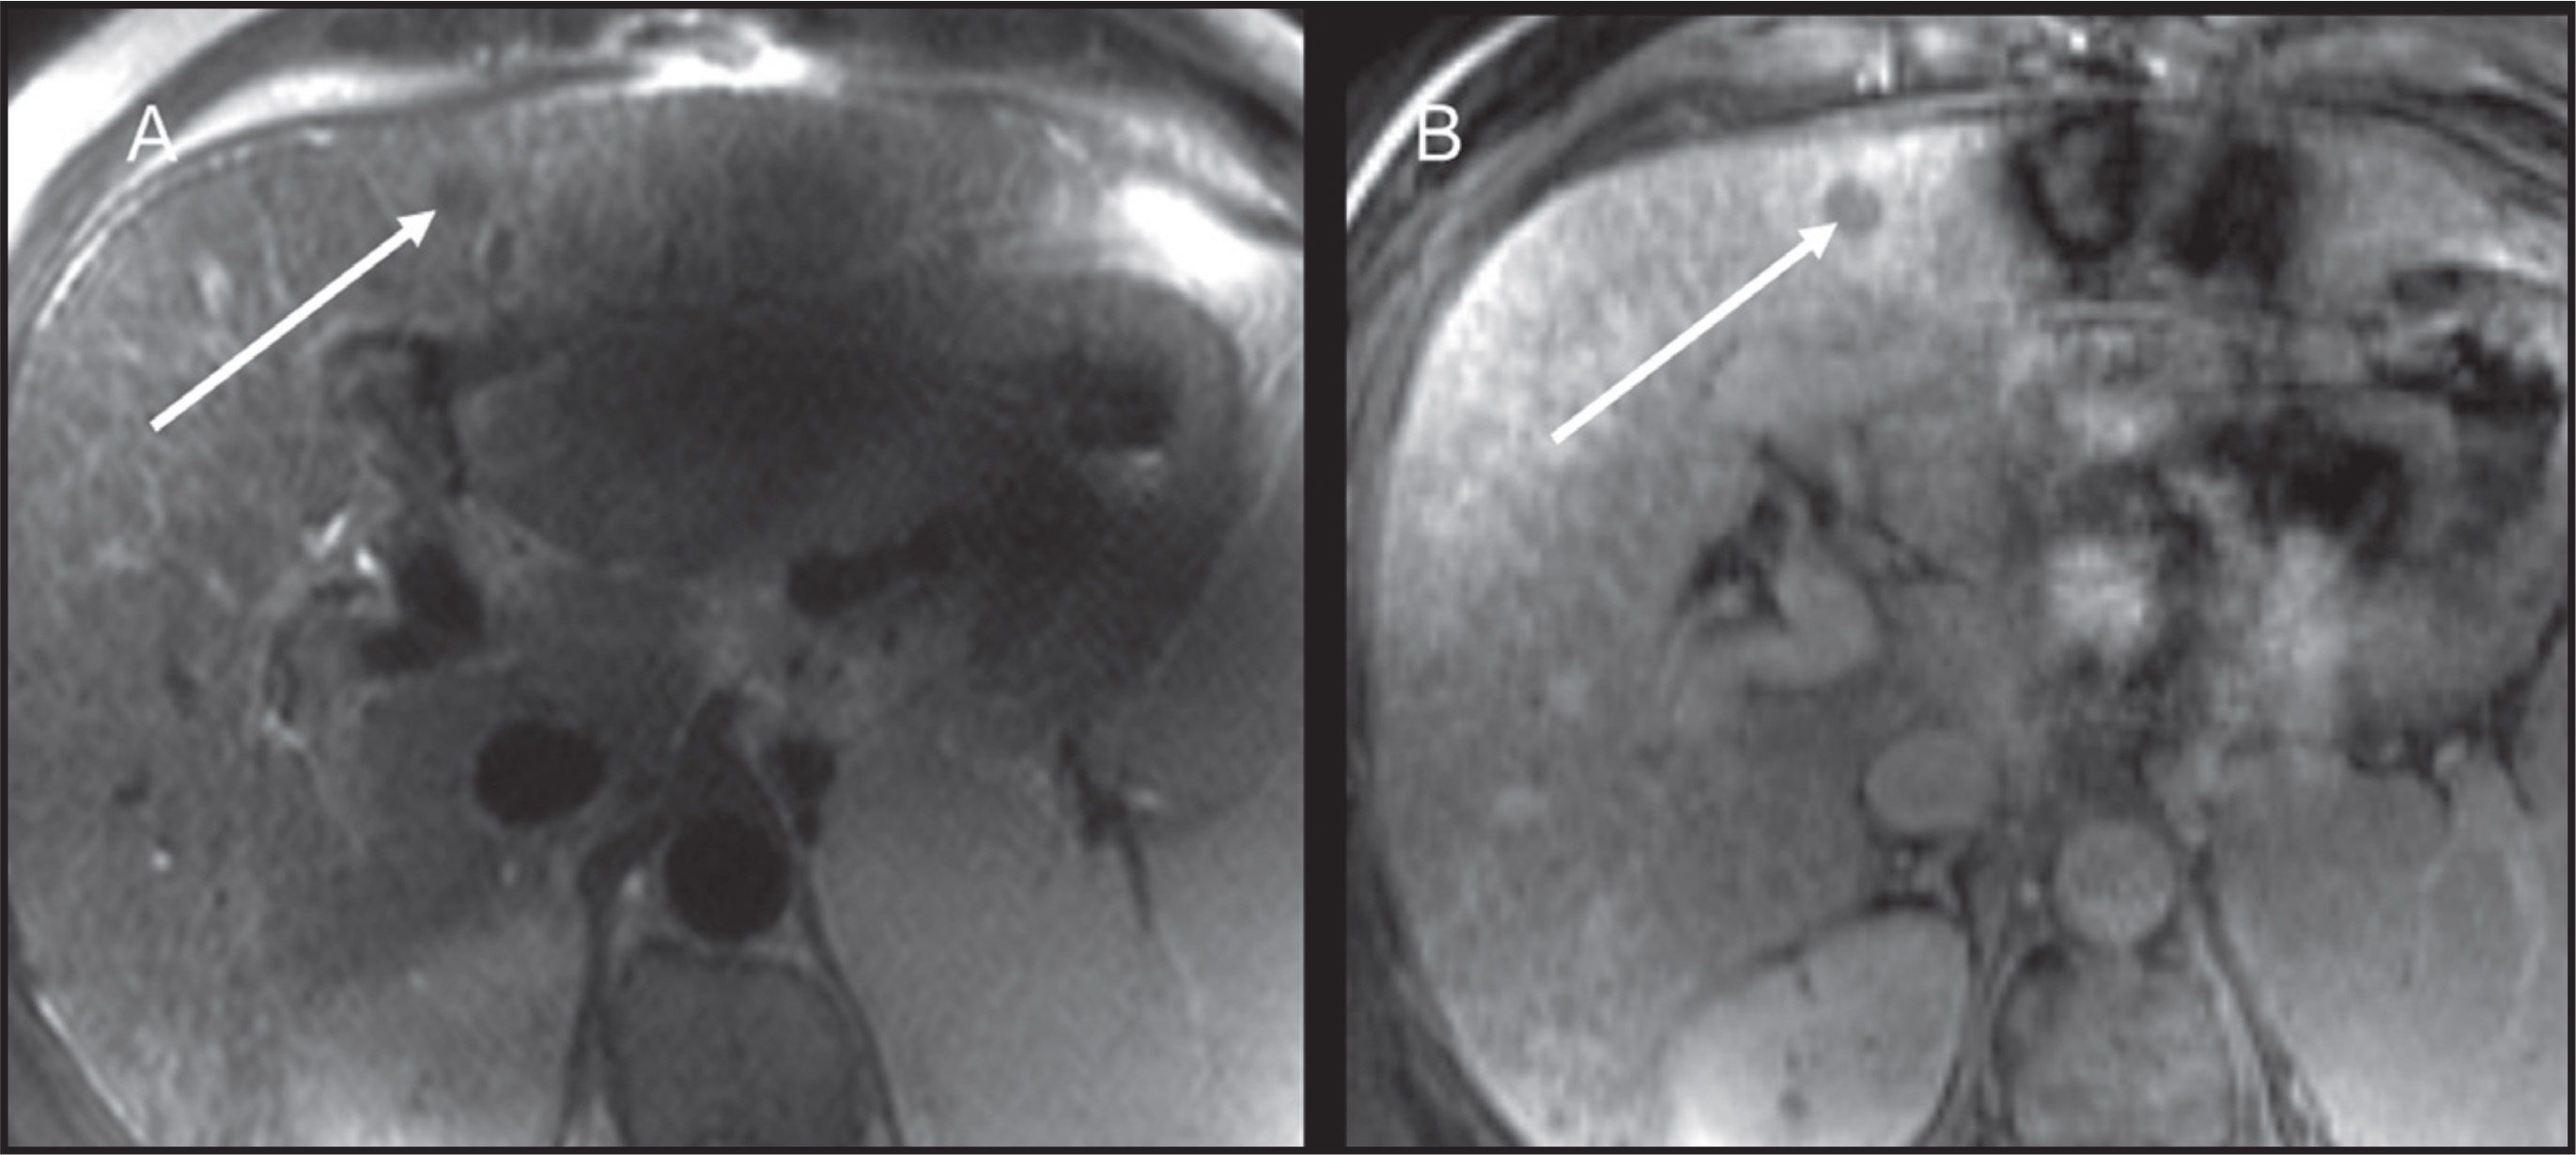
DN may appear identical to RNs and HCCs on MRI and CT imaging (Figure 4). In DNs, all of the usual cellular components of normal liver parenchyma (hepatocytes, Kupffer cells, and biliary ducts) are still found.4 DNs may be divided into low-, moderate-, and high-grade DNs.4 A feature that distinguishes them from RNs is early arterial neovascularization, most prominent in the high-grade nodules. Although DNs may have any signal intensity on T1-weighted images, fat accumulation can be present and can be detected using in- and opposed-phase T1-weighted images.19,20 On T2W images, DNs are usually iso- or hypointense compared to the liver parenchyma. Because of some degree of neovascularization, DNs may show early homogeneous arterial enhancement similar to HCC following IV contrast administration, although they generally do not show washout in the delayed phases.19,20 Like RNs, DNs are usually smaller than 2 cm.
HCCs
Hepatocellular carcinomas may exhibit a spectrum of CT and MR imaging characteristics, in part related to their variable degree of differentiation. Well-differentiated HCCs still exhibit some cellular similarity to hepatocytes, and thus retain some degree of hepatocellular function, whereas in poorly differentiated HCC, hepatocellular function is lost.1-5,9,19,21 In addition, areas of hemorrhage or focal fat can be present within HCCs, leading to variable imaging features (Figure 5). At noncontrast CT imaging, HCCs can be hypo-, iso- or hyperdense compared to liver parenchyma. HCCs are usually hypointense on T1W images, but they can be iso- or hyperintense. Fat is rarely present in HCCs, but like fat-containing benign lesions, it can be demonstrated using in- and opposed-phase T1W images. HCCs typically show mild increased SI on T2W images because of inflammation, edema and necrosis within the lesion (Figure 6). Despite this hyperintensity, differentiation from the surrounding liver parenchyma on T2W imaging can still be difficult, given the possibility of motion and other artifacts, as well as possibly altered T2 signal within the liver parenchyma itself. Furthermore, HCCs with low signal on T2W imaging have been described.
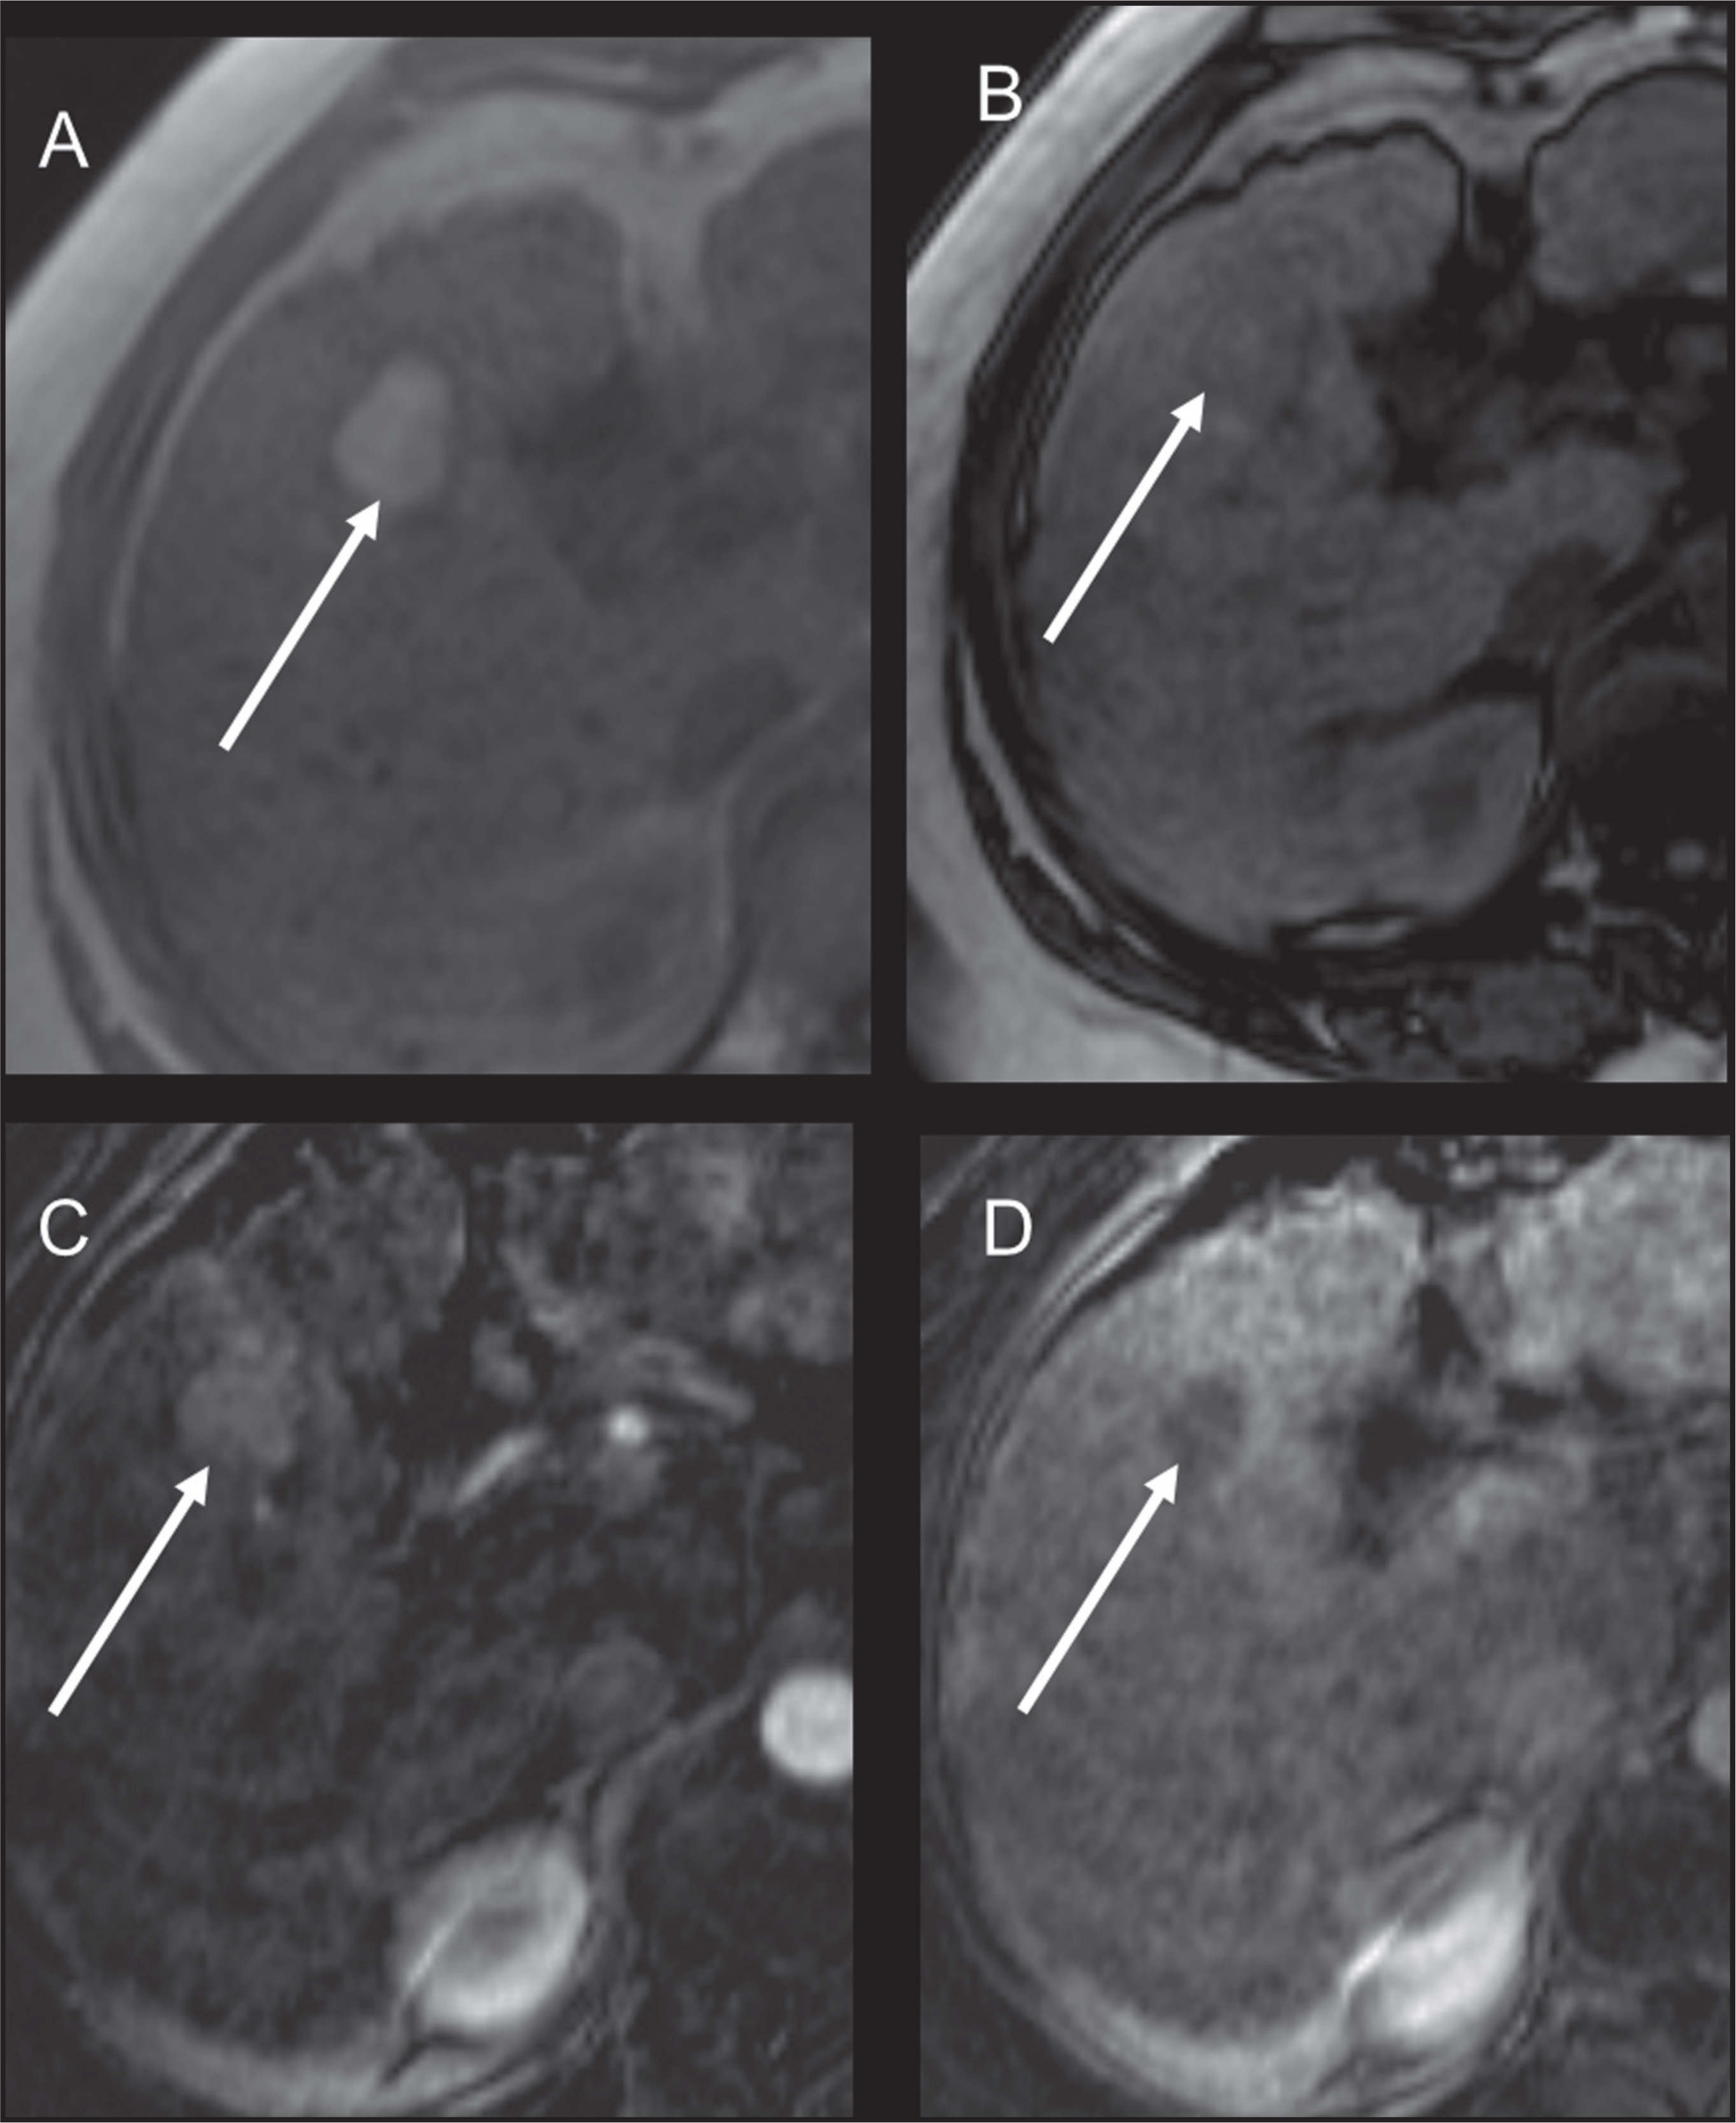
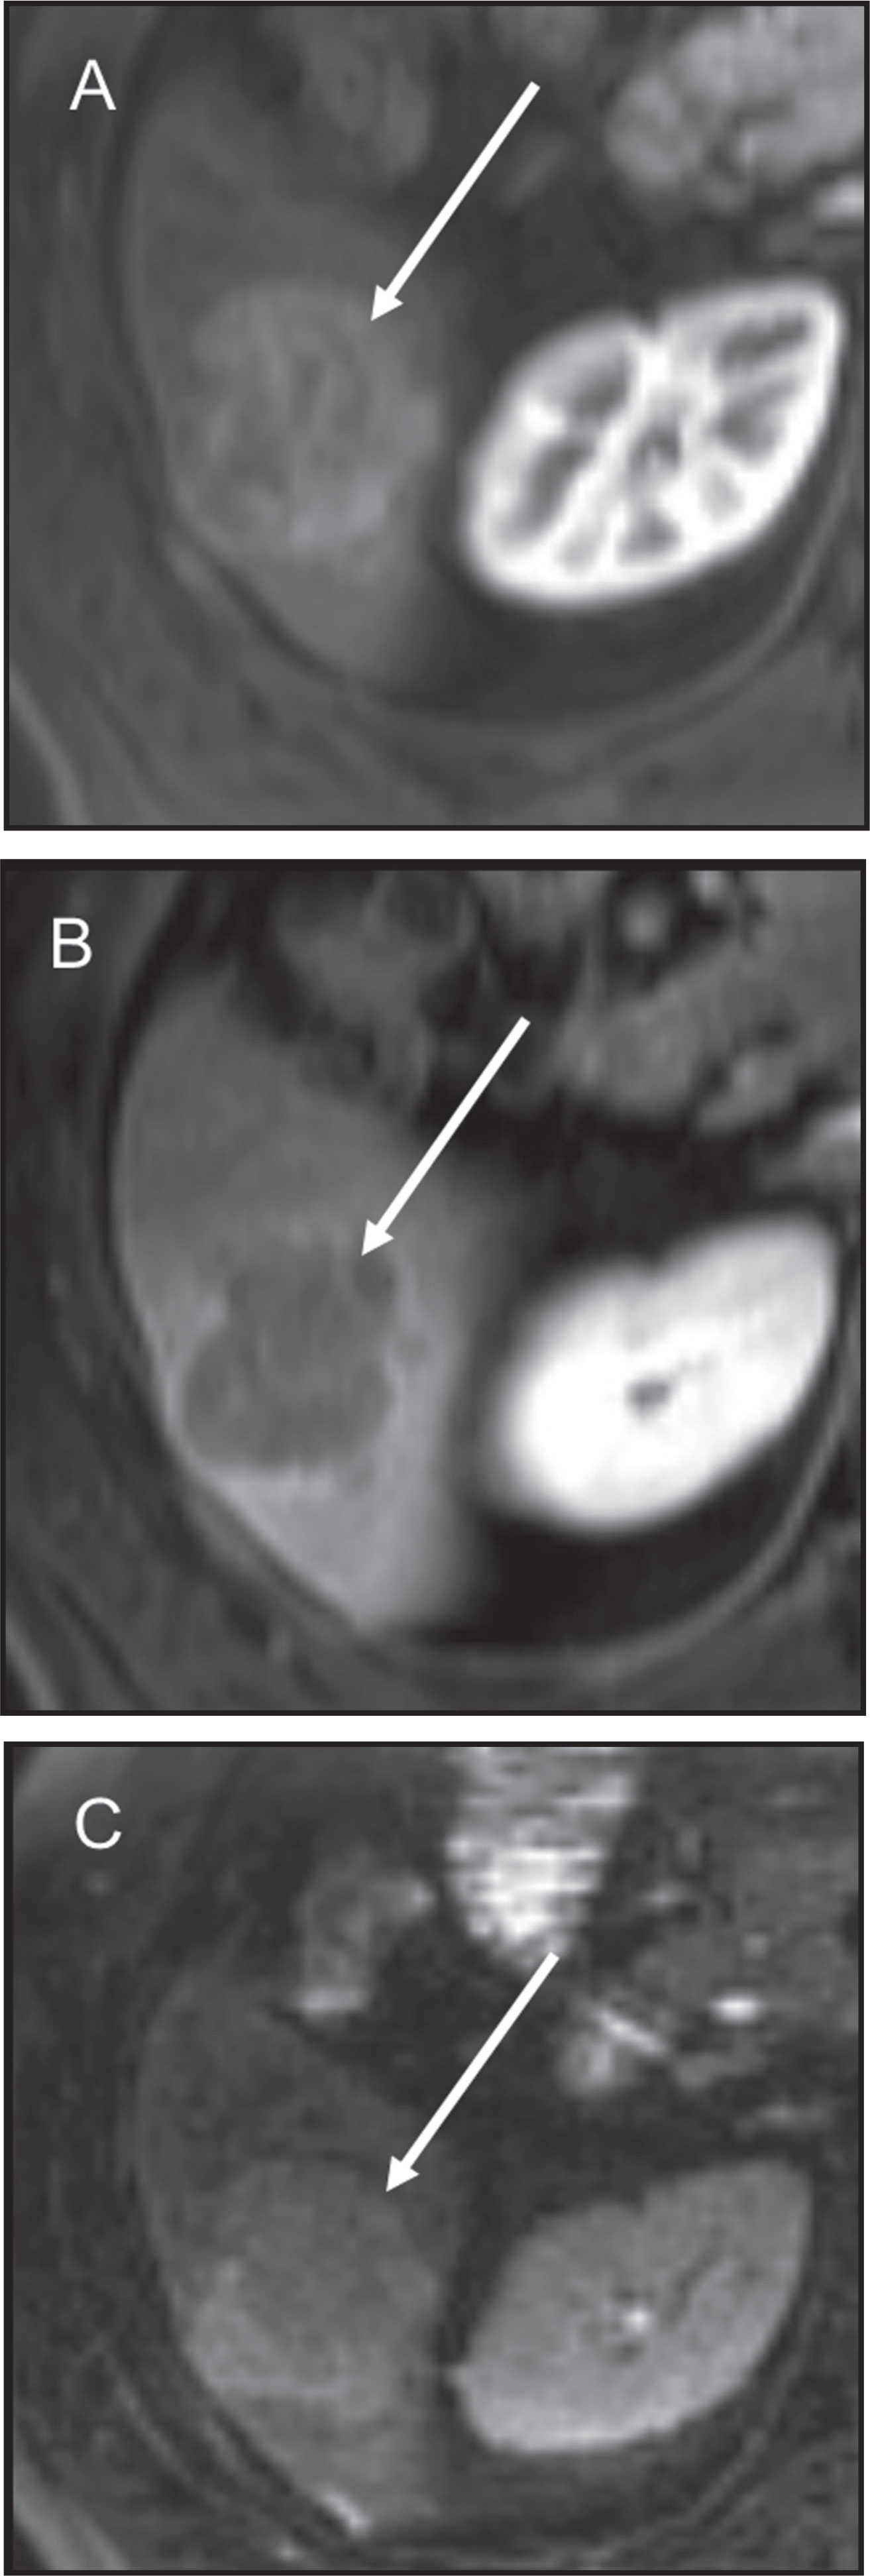
Given the variable imaging features of HCC on noncontrast CT and MRI, postcontrast imaging is critical to accurately detecting HCC with these modalities. Typically, following IV contrast medium administration, HCCs show heterogeneous early arterial enhancement and washout in the delayed phase, reflecting the predominant blood supply from arterial neovascularization (Figure 7). However, in small HCCs, the enhancement pattern can be homogeneous, and the washout may be minimal.1-5,9,19,21 Furthermore, in well-differentiated HCCs, the hepatic artery and portal venous blood supply may still be present in a proportion that makes these lesions difficult to characterize even after contrast administration. At MR imaging, subtraction imaging can help detect both the arterial enhancement and the washout, especially in HCCs that have high SI on pre-contrast, T1W images. A pseudocapsule, presenting as an enhancing peripheral rim, may also be present in the delayed postcontrast phases, both at CT and MRI,1-5,9,19,21 and can be an additional helpful diagnostic feature. Hepatocyte-specific, gadolinium-based MR contrast agents and ferromagnetic MRI contrast agents have also been used to characterize HCC based on the lack of normal biliary metabolism and Kupffer cells within HCC, respectively; however, diagnosis can remain difficult even using these agents, given that well-differentiated HCC tumor cells may still be able to metabolize and accumulate hepatocyte-specific gadolinium-based contrast agents or retain Kupffer cells, thus showing uptake using ferromagnetic contrast agents.1-5,9,19,21
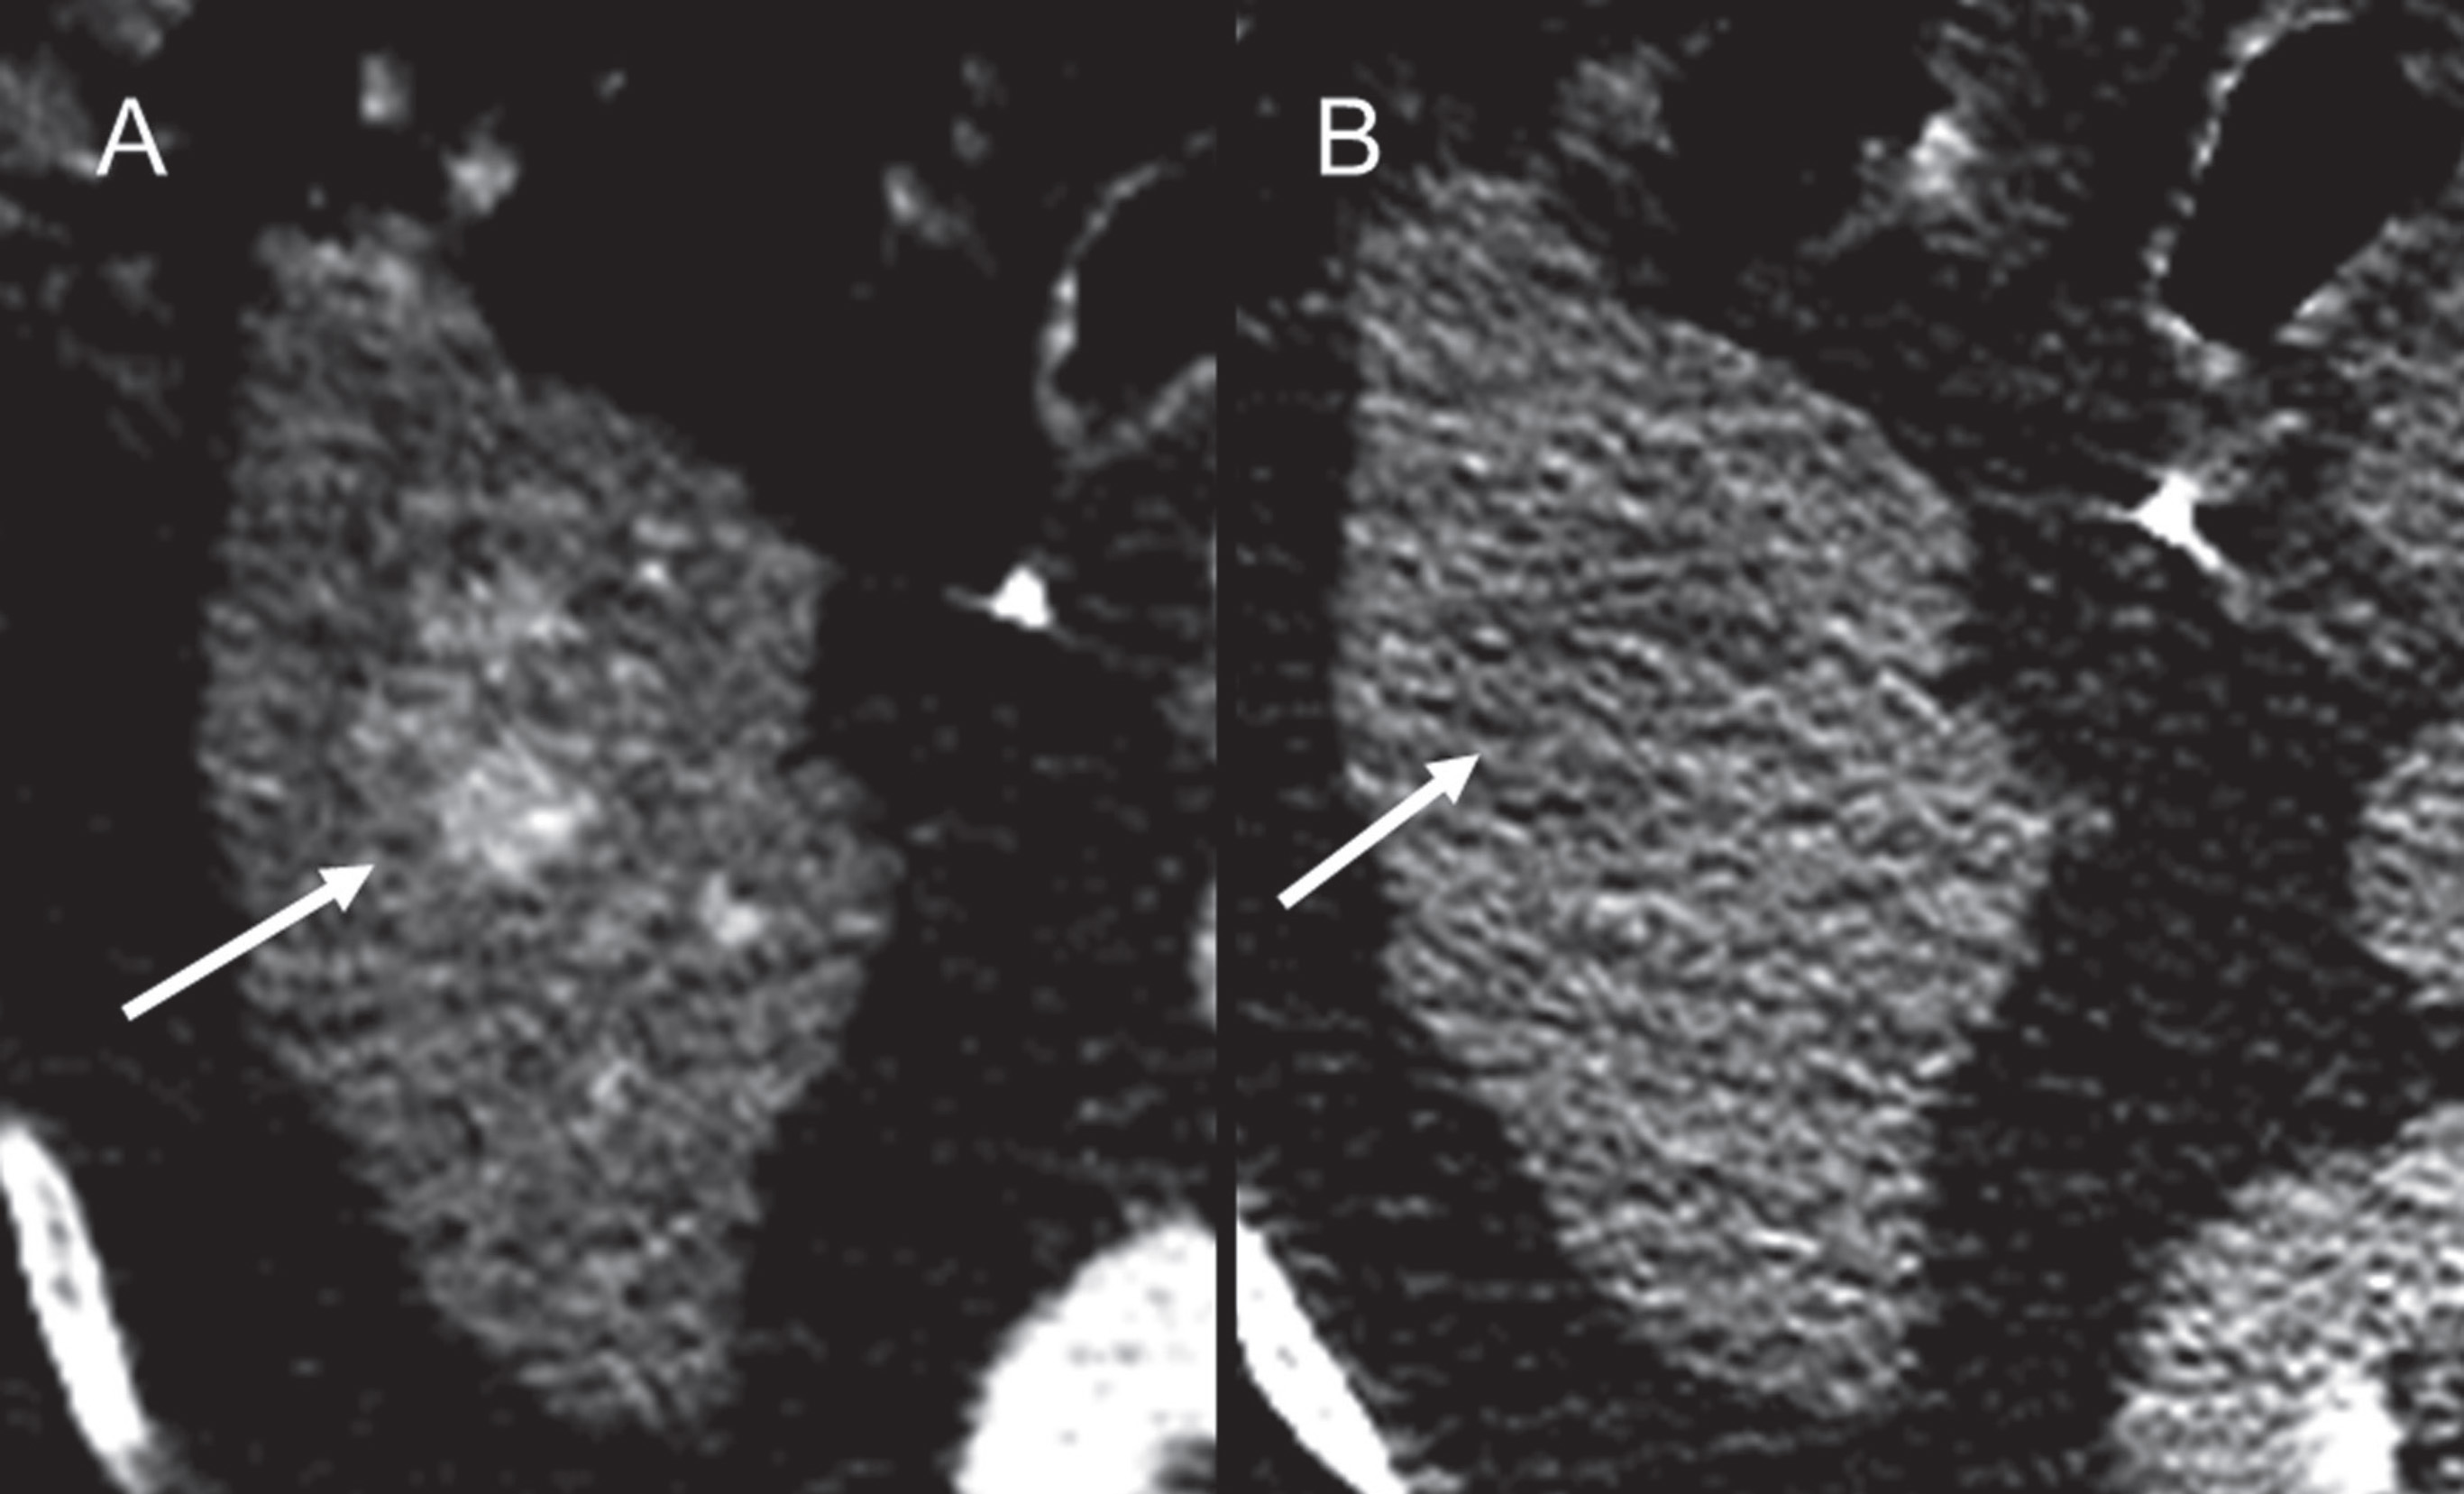
Clearly, detecting and characterizing a lesion as HCC can be challenging, particularly in the cirrhotic patient, where artifacts due to ascites and difficulties in breath holding are common. Comparison and correlation with previous imaging is essential; in a complex case, changes in size on serial examinations may be the most helpful observation for lesion characterization.1-5,9,19,21 In addition, when encountering an indeterminate liver lesion, correlation with an elevated serum alpha-fetoprotein level may be helpful. However, this laboratory test has a limited negative predictive value, especially in the setting of hepatitis C-related cirrhosis, and a normal level does not exclude HCC.22 Finally, diffusion weighted imaging (DWI) is a functional MRI technique that recently has been introduced in liver MR imaging protocol. While this sequence may help detect small lesions within the liver parenchyma (Figure 8), DWI does not currently allow for definitive lesion characterization in the cirrhotic liver. 23-26
Nodule-in-nodule
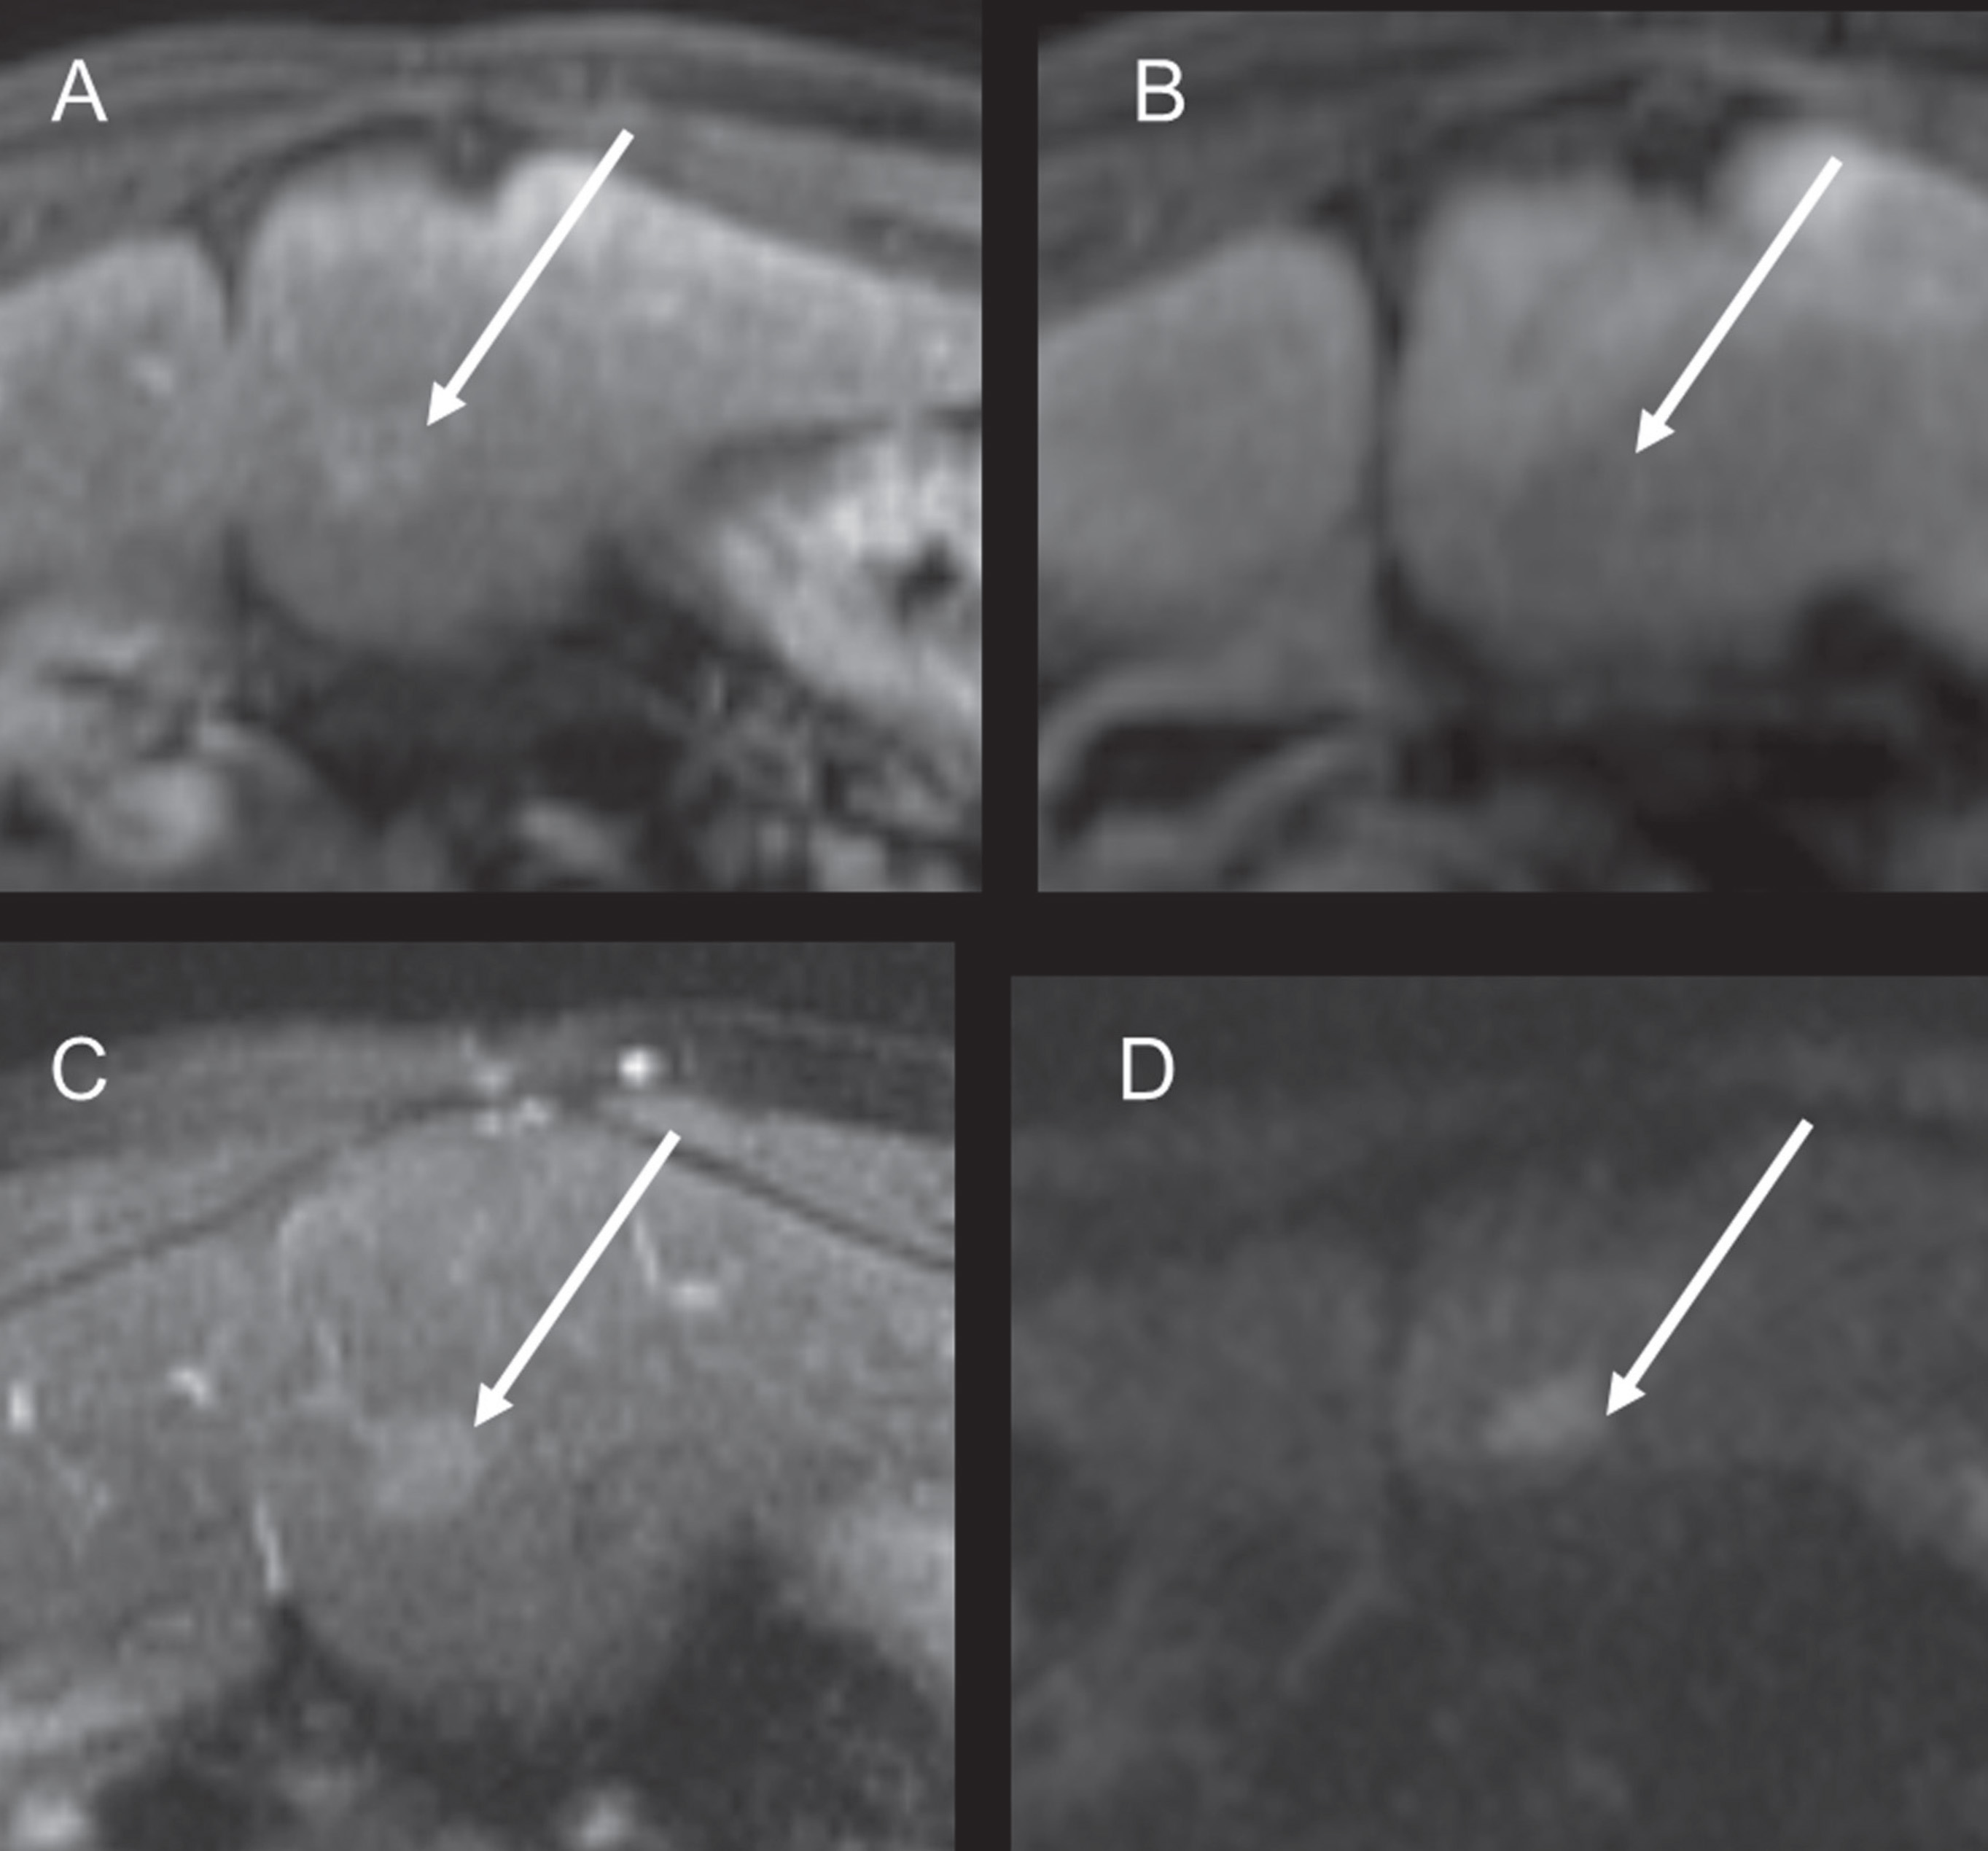
The term nodule-in-nodule is used to describe the appearance of a small HCC arising within a DN (Figure 9). In this case, the lesion will exhibit the previously described imaging characteristics of HCC, while being located within a larger nodule having the characteristics of a DN.4,5
Unidentified bright objects (UBO)
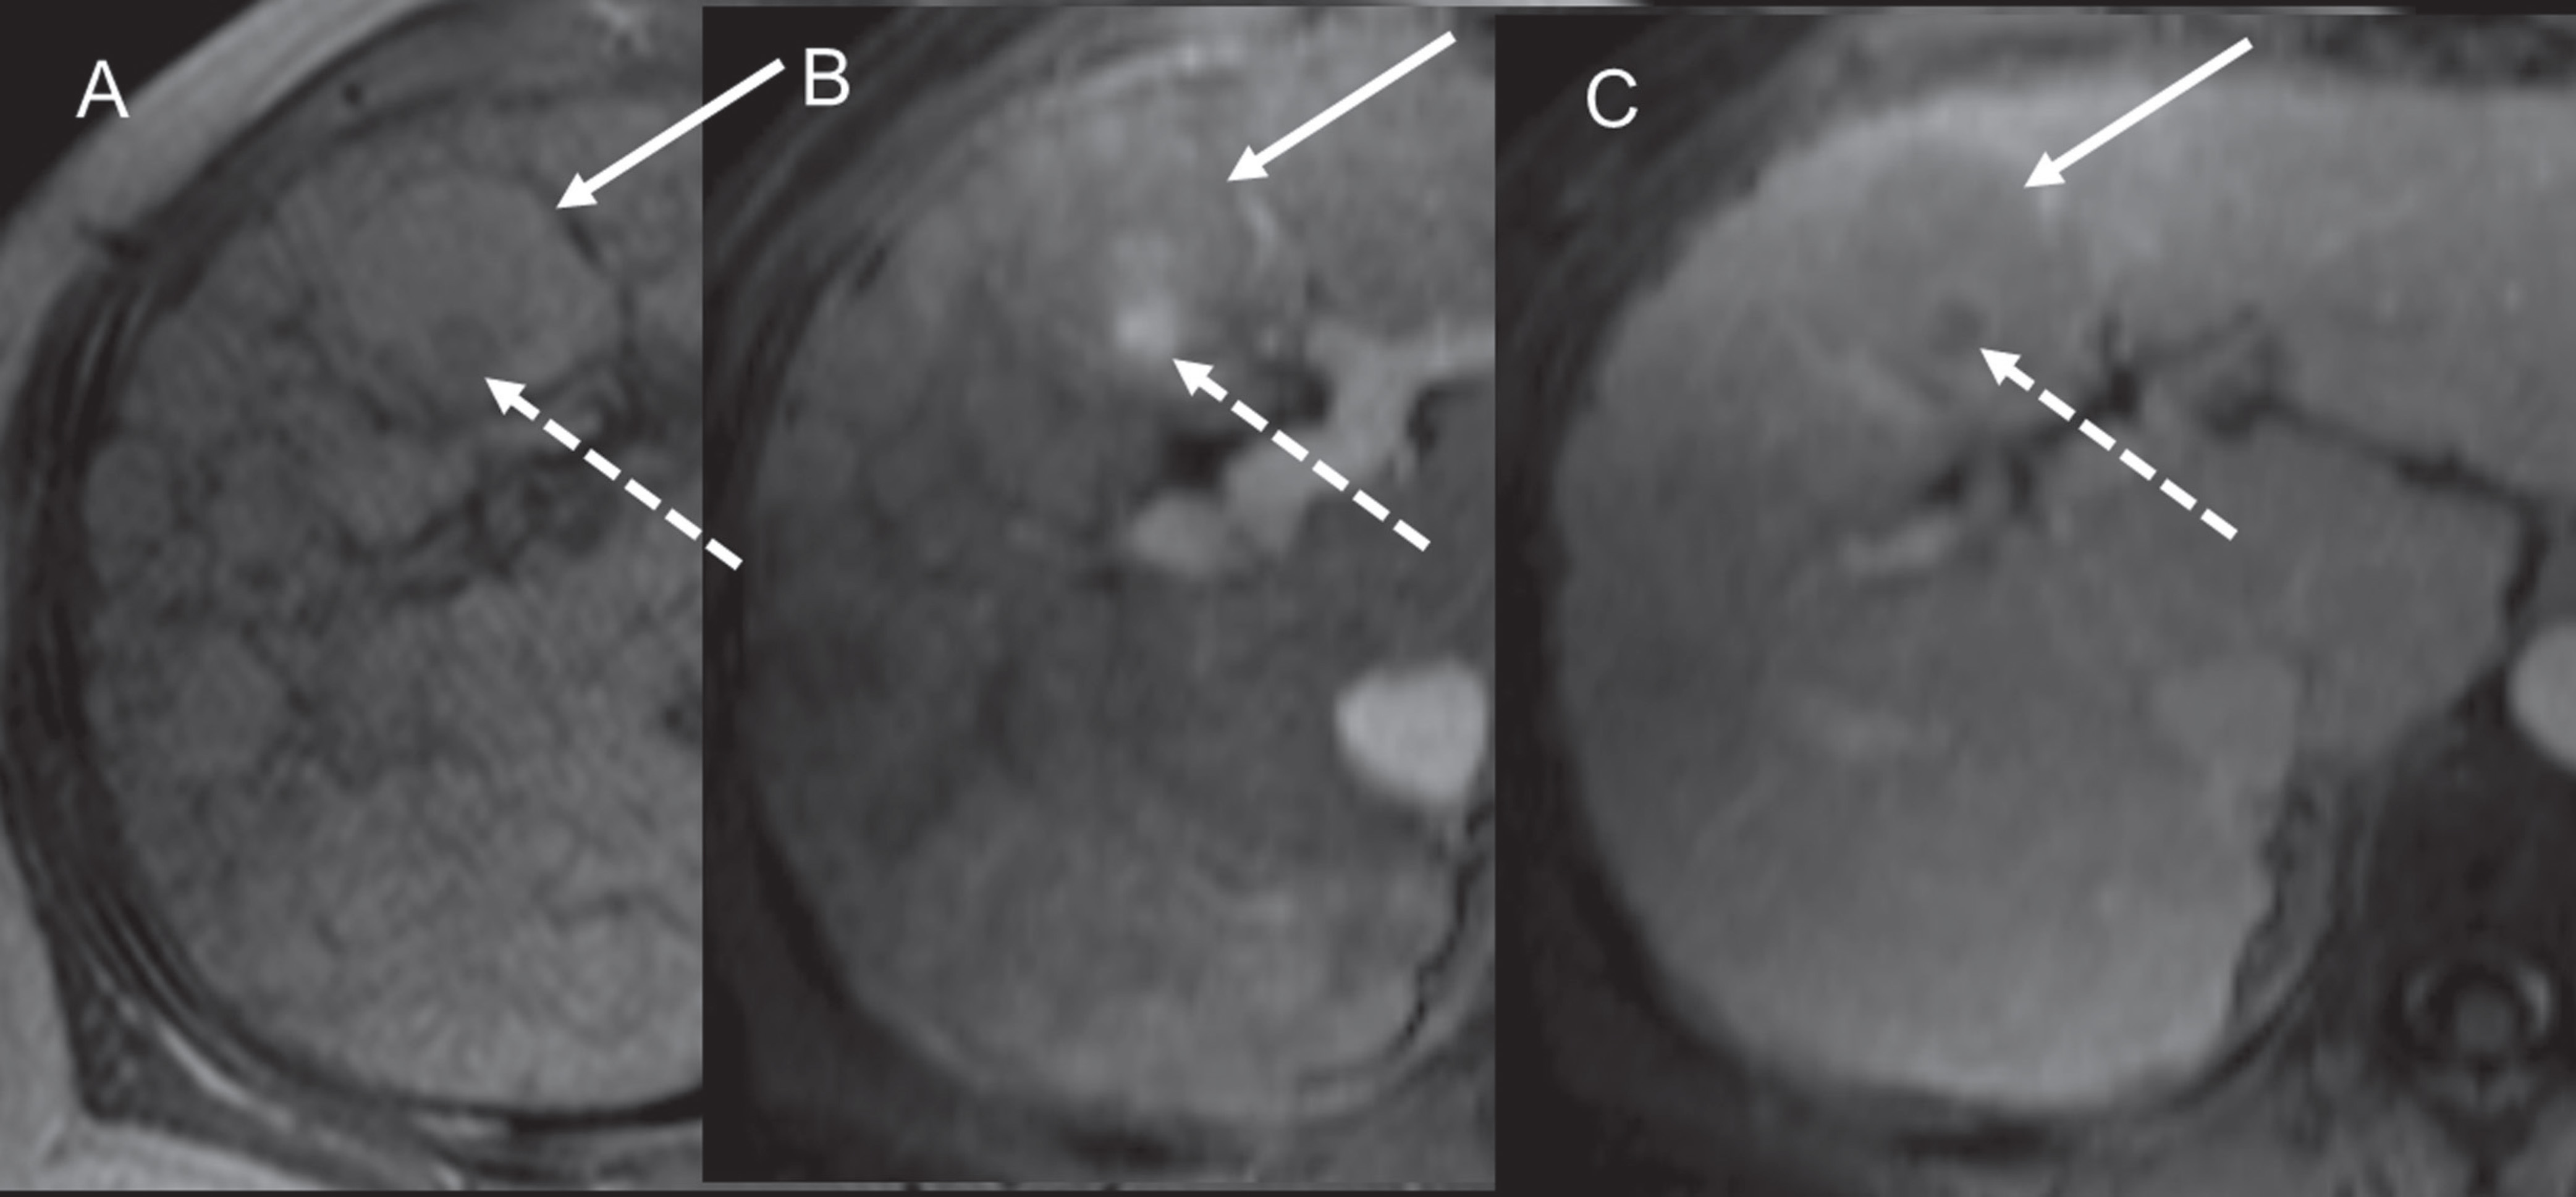
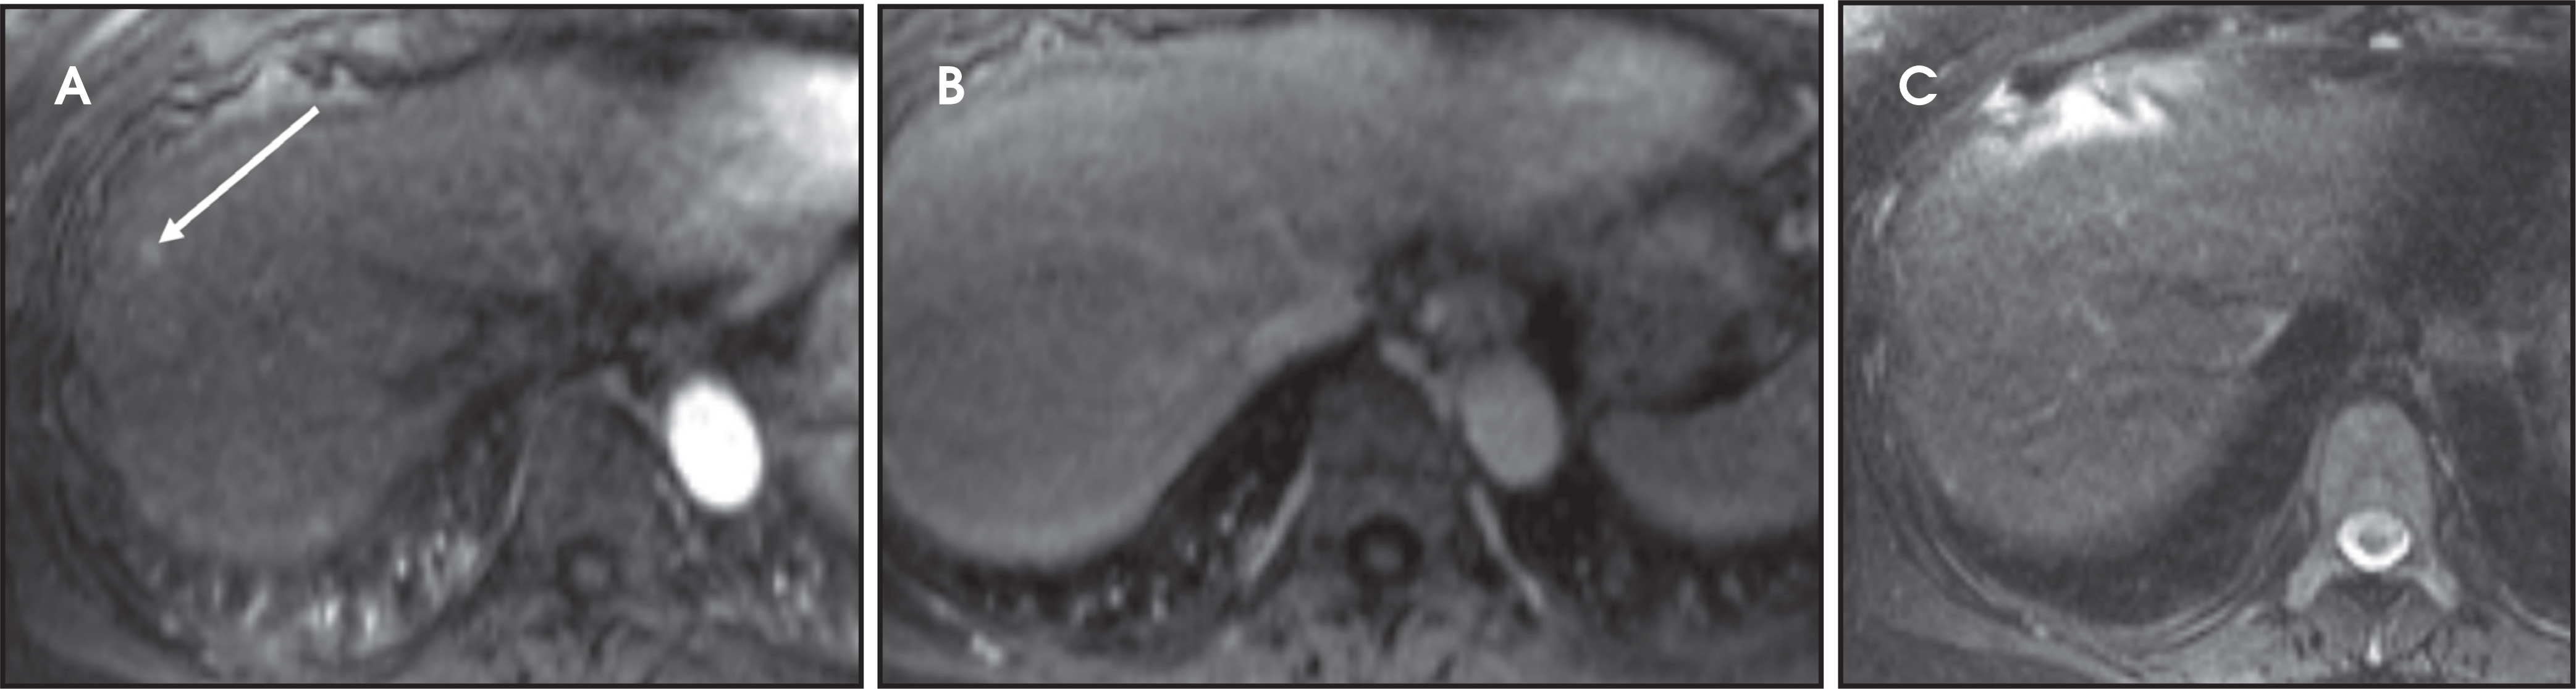
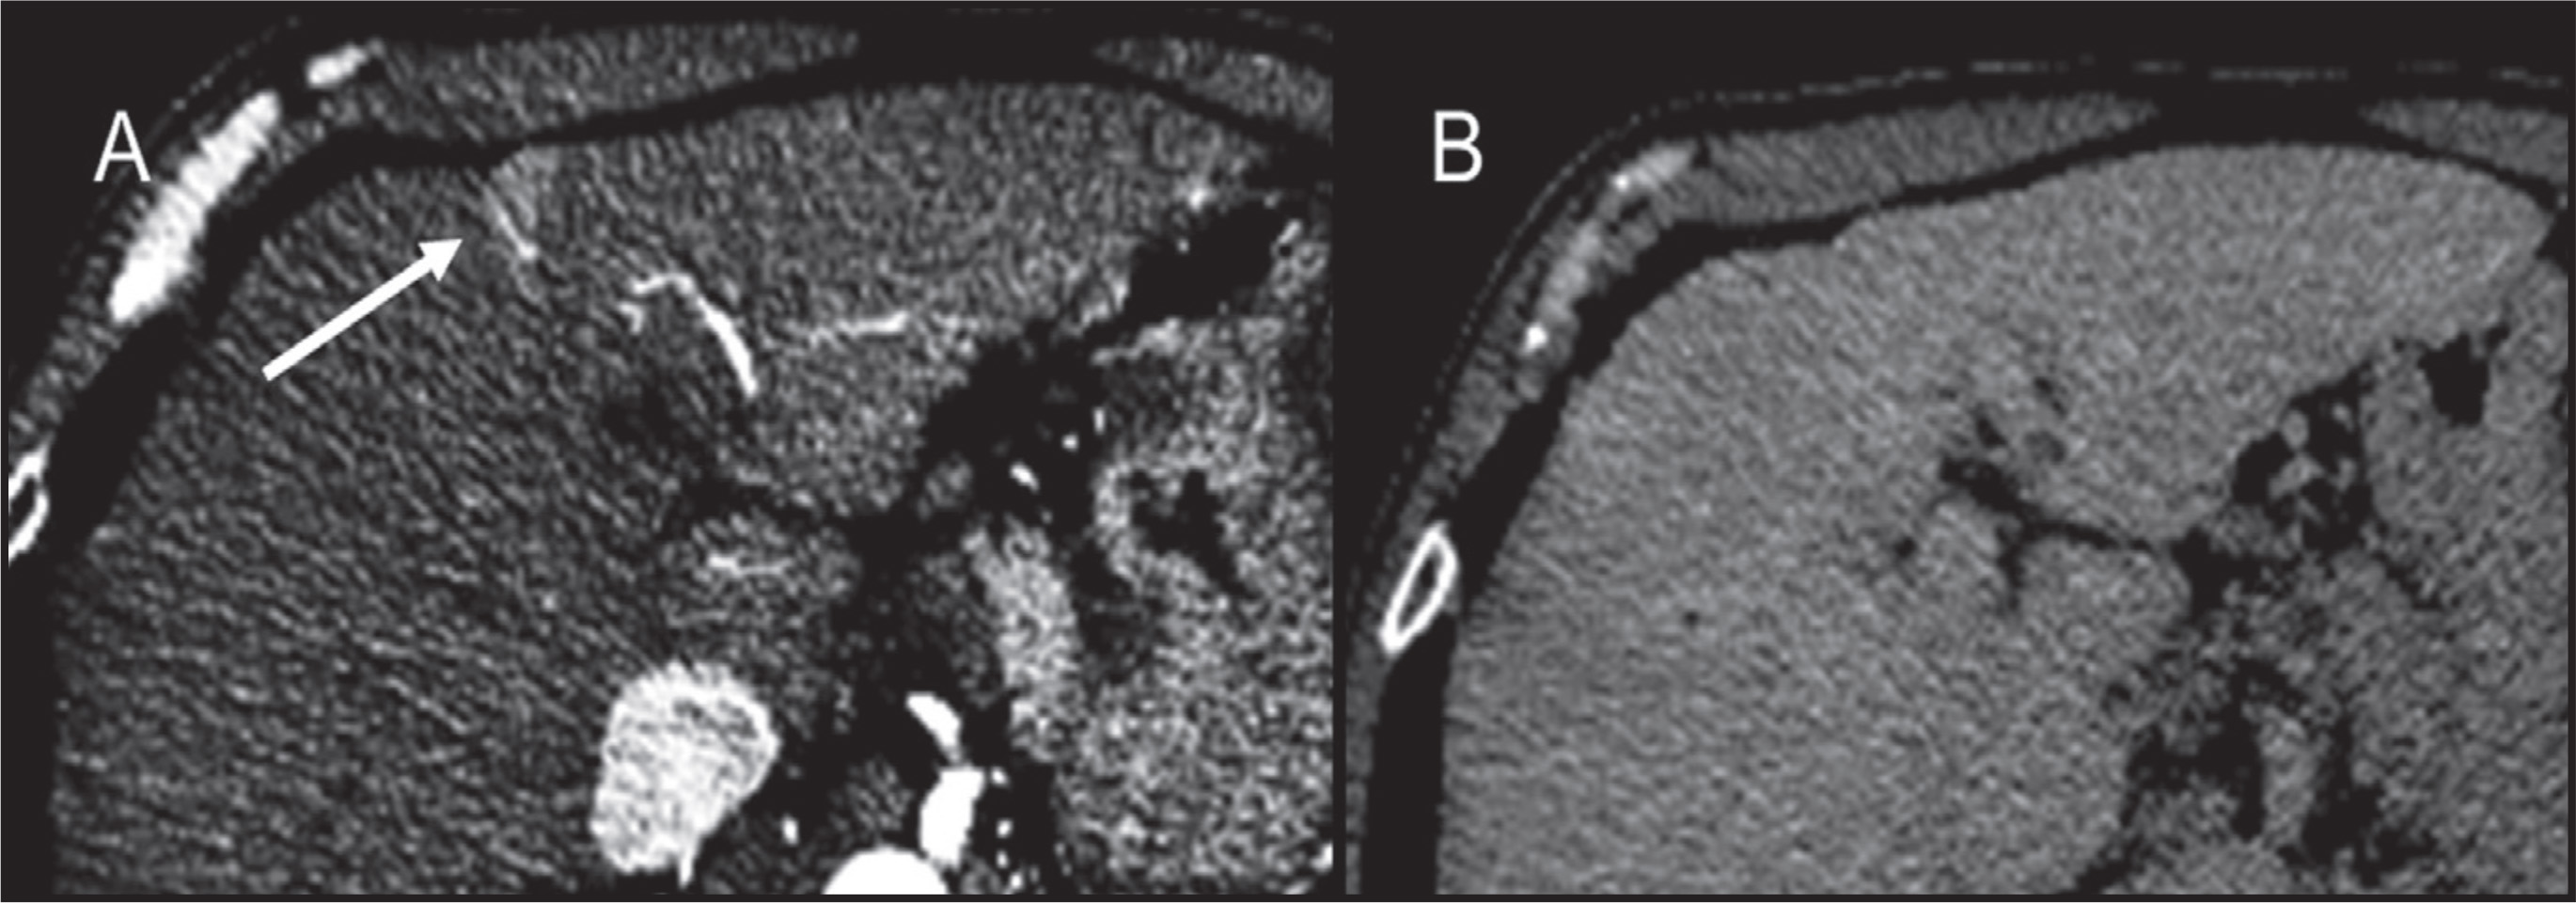
Unidentified bright objects (UBO) describe those lesions that show arterial phase enhancement on CT or MR imaging following IV contrast medium administration but do not fulfill the criteria to be characterized as HCC.27 These lesions measure under 20 mm in size, and are often irregularly shaped and peripherally located. On MRI, UBOs show no signal changes on T1- or T2-weighted images. UBOs are too small to be characterized by a single imaging study or to undergo targeted biopsy. These lesions are common and probably represent variants of regenerative nodules or arteriovenous shunts (Figures 10 and 11). They may resolve spontaneously and usually require serial imaging to monitor for potential progression.10,27
Treated HCC
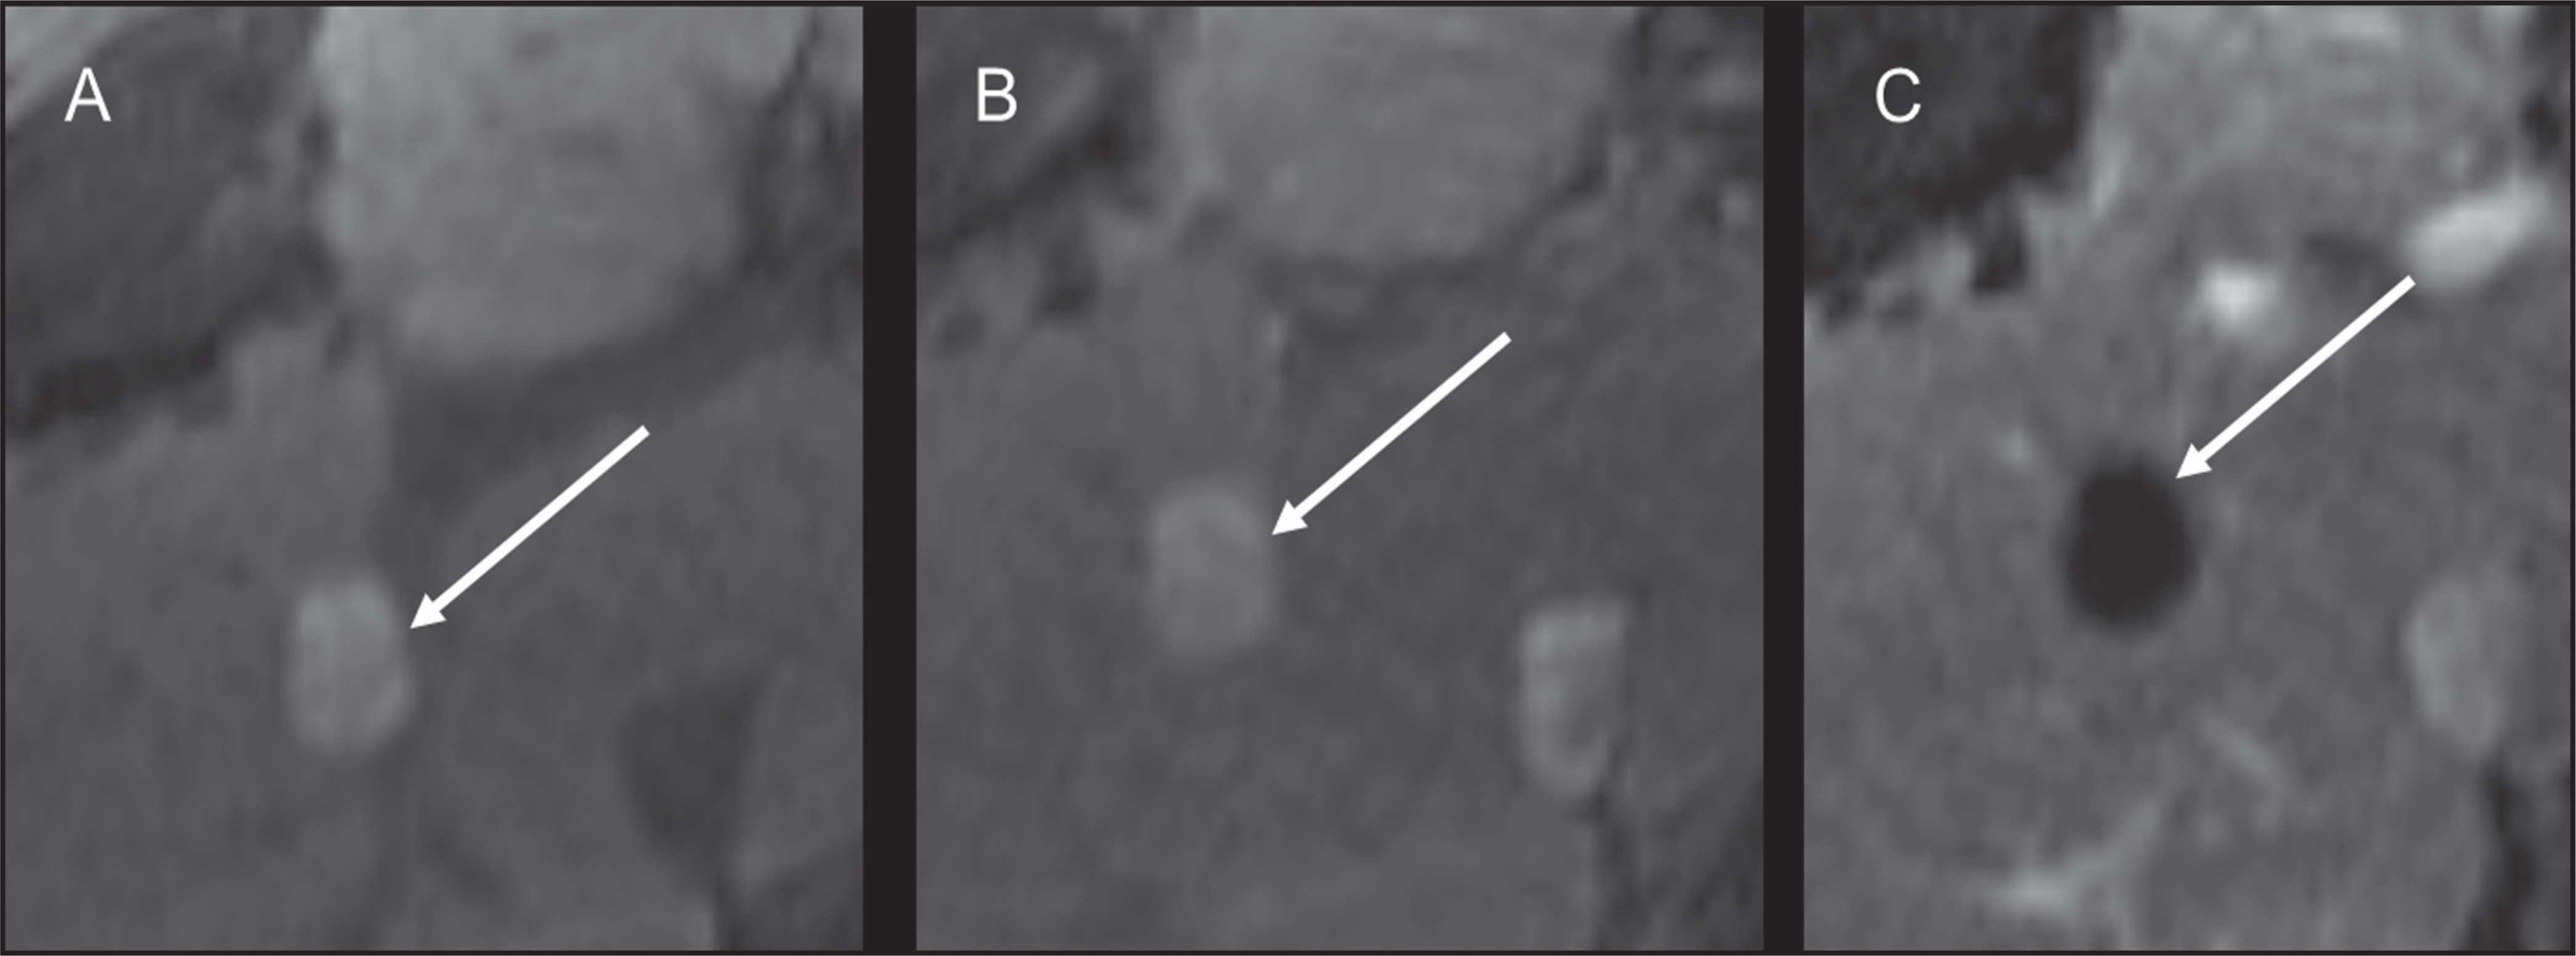
Liver resection and transplantation represent the only curative treatments for HCC. Forms of ablative treatments, which are not curative, include trans-arterial chemo-embolization (TACE), trans-arterial embolization (TAE), radiofrequency ablation (RFA), cryoablation, and Yttrium-90 radio-embolization. These ablative techniques induce tumor necrosis. 28,29 CT and MRI may be used to assess therapy success by discerning between viable and necrotic HCC. Because the treatment targets HCC vascularization, a successfully treated necrotic HCC will not enhance following IV contrast administration.28,29 At MRI, to assess the presence of post-contrast enhancement, subtraction images can be useful, given the possibility of increased signal in the lesion on precontrast T1W sequences related to the therapy (Figure 12). In addition, apparent diffusion coefficient (ADC) maps calculated from DWI, can be useful to quantify changes in HCCs following treatment.21,30 For instance, in one study, HCC that responded to chemo-embolization demonstrated an increase in ADC values following treatment.31 It is important to be aware of factors that can confound assessment for treatment response. Following ablation, especially within the first 30 days, an enhancing rim consisting of granulation tissue can surround an HCC that is in fact completely necrotic.28,29 In addition, benign reactive areas of abnormal arterial enhancement can be present in the treated lobe following treatment; such regions may be recognized by the lack of washout in the delayed phase. CT has also occupied a particular role following selective hepatic arterial injection using Lipiodol; this agent is usually cleared from normal liver parenchyma within 7 to 10 days, upon which CT may be performed to assess for any lesions retaining the agent, which would indicate areas of tumor. Finally, follow-up of HCC treated using pharmacological therapy with sorafenib is performed via size criteria.
Conclusion
MR, CT, and ultrasound imaging represent an essential tool in the detection and characterization of liver lesions in cirrhotic patients. Despite the different imaging modalities and novel contrast media making it possible to do a multiparametric evaluation of liver lesions, a confident characterization may still represent a challenge even for an expert liver imager and, in some cases, a biopsy is still required to reach a final diagnosis. Hybrid imaging with PET/CT and PET/MR may lead to new answers with the potential to determine liver lesion choline and glucose metabolism; but whether this will have a clinical impact on patient management is yet to be determined.
References
- Furlan A, Marin D, Agnello F. Hepatocellular carcinoma presenting at contrast-enhanced multi-detector-row computed tomography or gadolinium-enhanced magnetic resonance imaging as a small (J Comput Assist Tomogr. 2012;36:20-25.
- Addley H, Griffin N, Shaw A. Accuracy of hepatocellular carcinoma detection on multidetector CT in a transplant liver population with explant liver correlation. Clin Radiol. 2011;66:349-356.
- Anis M, Irshad A. Imaging of hepatocellular carcinoma: Practical guide to differential diagnosis. Clin Liver Dis. 2011;15:335-352.
- Matsui O. Imaging of multistep human hepatocarcinogenesis by CT during intra-arterial contrast injection. Intervirology. 2004;47:271-276.
- Choi B. Hepatocarcinogenesis in liver cirrhosis: Imaging diagnosis. J Korean Med Sci. 1998;13:103-116.
- Clinical Practice Guidelines: Management of hepatitis C virus infection. J Hepatol. 2011;55:245-264.
- Tan C, Low S, Thng C. APASL and AASLD Consensus guidelines on imaging diagnosis of hepatocellular carcinoma: A Review. Int J Hepatol. 2011.
- Ayuso C, Rimola J, Garcia-Criado A. Imaging of HCC. Abdom Imaging. 2012;37:215-30.
- Kim T, Lee K, Khalili K, Jang H. Hepatocellular nodules in liver cirrhosis: Contrast-enhanced ultrasound. Abdom Imaging. 2011;36:244-263.
- Khalili K, Kim T, Jang H. Indeterminate 1-2-cm nodules found on hepatocellular carcinoma surveillance: Biopsy for all, some, or none?. Hepatology. 2011;54:2054-2048.
- Serste T, Barrau V, Ozenne V. Accuracy and disagreement of CT and MRI for the diagnosis of small hepatocellular carcinoma and dysplastic nodules: Role of biopsy. Hepatology. 2012;55:800-806.
- Lomas D, Mannelli L, Hepatobiliary M, Harris R, Wasylishen R. Encyclopedia of magnetic resonance. 2011.
- Mannelli L, Godfrey E, Graves M. Magnetic resonance elastography: Feasibility of liver stiffness measurements in healthy volunteers at 3T. Clin Radiol. 2012;67:258-262.
- Rosenkrantz A, Mannelli L, Mossa D, Babb J, Breath-hold T. 2-weighted MRI of the liver at 3T using the BLADE technique: Impact upon image quality and lesion detection. Clin Radiol. 2011;66:426-433.
- Mannelli L, Godfrey E, Joubert I. MR elastography: Spleen stiffness measurements in healthy volunteers—preliminary experience. AJR Am J Roentgenol. 2010;195:387-392.
- Chung S, Breton E, Mannelli L, Axel L. Liver stiffness assessment by tagged MRI of cardiac-induced liver motion. Magn Reson Med. 2011;65:949-955.
- Rosenkrantz A, Mannelli L, Kim S, Babb J. Gadolinium-enhanced liver magnetic resonance imaging using a 2-point Dixon fat-water separation technique: Impact upon image quality and lesion detection. J Comput Assist Tomogr. 2011;35:96-101.
- Lee J, Choi B. Hepatocellular nodules in liver cirrhosis: MR evaluation. Abdom Imaging. 2011;36:282-289.
- Lee J. Imaging of hepatocellular carcinoma. Cancer Imaging. 2011;11.
- Lee J, Trevisani F, Vilgrain V, Wald C. Imaging diagnosis and staging of hepatocellular carcinoma. Liver Transpl. 2011;17(2):S34-S43.
- Kim S, Mannelli L, Hajdu C. Hepatocellular carcinoma: Assessment of response to transarterial chemoembolization with image subtraction. J Magn Reson Imaging. 2010;31:348-355.
- El-Serag H, Kramer J, Chen G. Effectiveness of AFP and ultrasound tests on hepatocellular carcinoma mortality in HCV-infected patients in the USA. Gut. 2011;60:997-992.
- Colagrande S, Belli G, Politi L. The influence of diffusion- and relaxation-related factors on signal intensity: An introductive guide to magnetic resonance diffusion-weighted imaging studies. J Comput Assist Tomogr. 2008;32:463-474.
- Mannelli L, Hoang M, Sabath A, Linnau K. An unusual oral mass. Gastroenterology. 2012;142.
- Hardie A, Naik M, Hecht E. Diagnosis of liver metastases: Value of diffusion-weighted MRI compared with gadolinium-enhanced MRI. Eur Radiol. 2010;20:1431-1441.
- Taouli B, Thakur R, Mannelli L. Renal lesions: Characterization with diffusion-weighted imaging versus contrast-enhanced MR imaging. Radiology. 2009;251:398-407.
- Willatt J, Hussain H, Adusumilli S, Marrero J. MR Imaging of hepatocellular carcinoma in the cirrhotic liver: Challenges and controversies. Radiology. 2008;247:311-330.
- Lencioni R, Crocetti L. Local-regional treatment of hepatocellular carcinoma. Radiology. 2012;262:43-58.
- Fleig W. Hepatocellular carcinoma: local-regional treatment. Dtsch Med Wochenschr. 2003;128(2):S102-103.
- Mannelli L, Patterson A, Zahra M. Evaluation of nonenhancing tumor fraction assessed by dynamic contrast-enhanced MRI subtraction as a predictor of decrease in tumor volumein response to chemoradiotherapy in advanced cervical cancer. AJR Am J Roentgenol. 2010;195:524-527.
- Mannelli L, Kim S, Hajdu C. Assessment of tumor necrosis of hepatocellular carcinoma after chemoembolization: Diffusion-weighted and contrast-enhanced MRI with histopathologic correlation of the explanted liver. AJR Am J Roentgenol. 2009;193:1044-1052.
Citation
. Focal lesions in the cirrhotic liver. Applied Radiology. 2013;42(10):17-23. doi:10.37549/AR2025.