From Signals to Signs: Diffusion Tensor Imaging and Fiber Tractography of Spine in Predicting Neurological Impairment in Spinal Tuberculosis
Applied Radiology — Vol. 55 , Issue 1
Published: December 29, 2025
1 Department of Radio-diagnosis, Maulana Azad Medical College, New Delhi, India
2 Department of Orthopedics, Maulana Azad Medical College, New Delhi, India
* Corresponding author: Meemansa Jindal (meemansa13@gmail.com)
Abstract
Purpose:: To evaluate the utility of diffusion tensor imaging (DTI) and fiber tractography (FT) in spinal tuberculosis (TB) by assessing its correlation with neurological status.
Materials and Methods:: This cross-sectional study comprised 30 patients (mean age: 33.7 ± 16.7 years) with clinically suspected spinal TB above L1 (adults) and L3 (children) vertebral levels, who underwent 3.0T MRI with DTI before initiation of treatment. Neurological status was assessed using the Japanese Orthopaedic Association (JOA) score. DTI parameters, including fractional anisotropy (FA), apparent diffusivity coefficient (ADC), and radial diffusivity (RD), were measured at the site of cord compression and one level above it. Parameters were assessed as mean values, absolute differences (Δ), and percent changes (Δ%), calculated as per Conventional MRI metrics, including T2 hyperintensities and spinal canal encroachment (SCE), were also recorded. FT was qualitatively graded into types I-IV (types I, III: no disruption of fibers; types II, IV: with disruption of fibers). Statistical analysis included paired t-tests, Spearman correlation, receiver-operating characteristic (ROC) curve analysis, and Fisher exact test.
Results:: A significant decrease in FA and increase in ADC and RD were seen at the site of compromise (P < .001). A SCE threshold of 74.4% predicted neurological deficit with 62% sensitivity and 83% specificity [area under the curve (AUC) = 0.74]. ROC analysis identified ΔFA% (≥13.6%) as the strongest predictor of neurological deficit (AUC = 0.77, sensitivity 100%, specificity 62%). ΔRD% (cutoff: ≥45.3%) showed 76% sensitivity and 56% specificity for both T2 hyperintensity (AUC = 0.60) and fiber disruption (AUC = 0.67). Fiber disruption, as seen in type II and IV FT patterns, was significantly associated with JOA < 13 (odds ratio 7.5, P = .0318) and correlated negatively with JOA scores (ρ = –0.621, P < .0013).
Conclusion:: DTI-derived metrics, particularly ΔFA% and ΔRD%, along with fiber tractography, demonstrate strong correlation with clinical impairment and may provide early indicators of neural damage.
Keywords
diffusion tensor imaging, spinal cord, tuberculosis, tractography, MRI
Categories
Introduction
Spinal tuberculosis (TB) constitutes approximately 2% of all TB cases and commonly arises as a complication of pulmonary or abdominal TB, spreading via arterial or venous routes. MRI is the modality of choice due to its superior soft-tissue contrast (sensitivity of 100% and specificity of 80%) and effectively identifies contiguous and skip lesions, paraspinal collections, and epidural extension.
Diffusion tensor imaging (DTI) evaluates the magnitude and direction of water diffusion, thereby providing insight into axonal and myelin integrity. It has demonstrated clinical utility in cervical spondylotic myelopathy and traumatic spinal cord injury, often detecting microstructural alterations before they are apparent on conventional MRI. However, the application of DTI in spinal TB remains underexplored, despite its potential to quantify subtle intramedullary changes resulting from infection or compression. Recognizing this gap, the study aims to bridge the limited understanding of diffusion behavior in spinal TB by correlating DTI-derived metrics with clinical and tractographic findings. This approach not only highlights the role of diffusion parameters in assessing functional impairment but also offers a new perspective on cord pathology in tuberculous myelopathy.
The objectives of this study were to:
-
Compare the DTI values “At” and “Above” the site of cord compromise to find out the changes in DTI parameters at the site of cord compromise.
-
Correlate these changes with the neurological status of patients.
-
Determine the cutoffs for various DTI parameters at which significant neurological deficits can be expected.
-
Describe the tractography findings in these patients.
Methodology
Study design
The study comprised 30 patients (15 males, 15 females; mean age: 33.7±16.7 years, range: 6‐71 years) with suspected spinal TB. All patients underwent MRI of the spine between July 2023 and October 2024 before initiation of treatment. Neurological impairment was assessed using the Japanese Orthopaedic Association (JOA) score (Keller et al modification 1993), which evaluates motor, sensory, and bladder function on a scale of 0‐17 (0 being most severe and 17 being normal). 1 Based on the JOA score, patients were categorized as
-
Normal (16-17)
-
Grade I (12-15)
-
Grade II (8-11)
-
Grade III (0‐7)
All patients included in the study had MRI findings consistent with spinal TB, with or without altered signal intensity changes in the spinal cord. Patients with spinal TB showing cord involvement, either due to epidural abscess or intraspinal tuberculoma, were included. Patients with cord compression due to nontuberculous causes (eg, degenerative disease, neoplasm, trauma) were excluded. Differentiation between “intrinsic” and “extrinsic” tuberculous cord involvement was not attempted, as imaging cannot reliably establish this distinction without histopathologic confirmation.
Since the spinal cord ends at the lower border of L1 vertebra in adults and at the upper border of L3 vertebra in children, patients having spinal TB with involvement below these levels were excluded. Other exclusion criteria included a history of spinal surgery, stroke, or any contraindications to MRI.
MRI and DTI Protocol
MRI was performed on a 3T scanner (MAGNETOM Skyra, Siemens Healthineers, Germany) using a phased array coil for spine imaging. Precontrast sequences included sagittal T1WI (TR/TE: 550/9.5 milliseconds), sagittal and axial T2WI (TR/TE: 4000/82 milliseconds), and coronal STIR sequence. All sequences were acquired with the field of view ranging from 22 to 32 cm, matrix size between 220 × 180 and 350 × 350, slice thickness between 2 and 4 mm, and a consistent flip angle of 160°.
DTI was acquired precontrast using axial single-shot spin-echo echo-planar imaging covering the lesion and one vertebral level above. Parameters: TR/TE: 5500/78 milliseconds, flip angle 120°, slice thickness 5 mm, 2 mm interslice gap, 25 slices, matrix 220 × 220, 10 noncollinear directions, b-values: 0 and 700 s/mm². The imaging plane was perpendicular to the spinal cord. Total acquisitions: 2 (one pretreatment and one after 6 months of treatment). The total scan time was 25-30 minutes for conventional MRI sequences, including pre- and postcontrast imaging, and an additional 5-8 minutes for DTI sequences.
Contrast-enhanced sequences included fat-suppressed T1 Dixon (TR/TE: 550/11 milliseconds) and 3D VIBE (TR/TE: 6.68/2.46 milliseconds), following intravenous administration of gadopentetate dimeglumine (0.1 mmol/kg) via 22G (adults) or 24‐26G (children) cannula.
Image Processing and Data Analysis
All the images were processed on a dedicated advanced workstation (Syngo.via, Siemens Medical Solutions). Conventional MRI images were analyzed to classify the level of the disease into cervical, cervicodorsal, upper dorsal (D1-D4), mid-dorsal (D5-D8), lower dorsal (D9-D12), and dorsolumbar (with involvement of L1 vertebra). Patterns of involvement were classified as either typical (paradiscal, anterior, posterior, central) or atypical (including isolated sacral involvement, craniovertebral junction involvement, posterior element involvement, skip lesions, intraspinal tuberculomas, solitary vertebral disease, and tubercular arachnoiditis), as described in literature. 2,3
The degree of spinal canal compromise was quantified by calculating the percentage of spinal canal encroachment (SCE) at the site of maximal narrowing using the following formula:
where
B: area of the canal (calculated by taking average of spinal canal areas one vertebral segment above and one below)
C: area occupied by the spinal cord
A: area occupied by CSF, A=B-C
A value of 100% represented a normal canal with complete CSF preservation, whereas 0% indicated complete CSF effacement and spinal canal stenosis.
Post-acquisition DTI processing included generation of fractional anisotropy (FA), mean diffusivity (MD), and radial diffusivity (RD) maps. Regions of interest (ROIs) were manually placed at the site of maximal spinal cord compression (“At”) and one level above (“Above”) using standardized circular ROIs (0.12‐0.20 mm²), encompassing both gray and white matter while excluding surrounding CSF. To minimize sampling bias, each measurement was repeated at least 3 times and averaged.
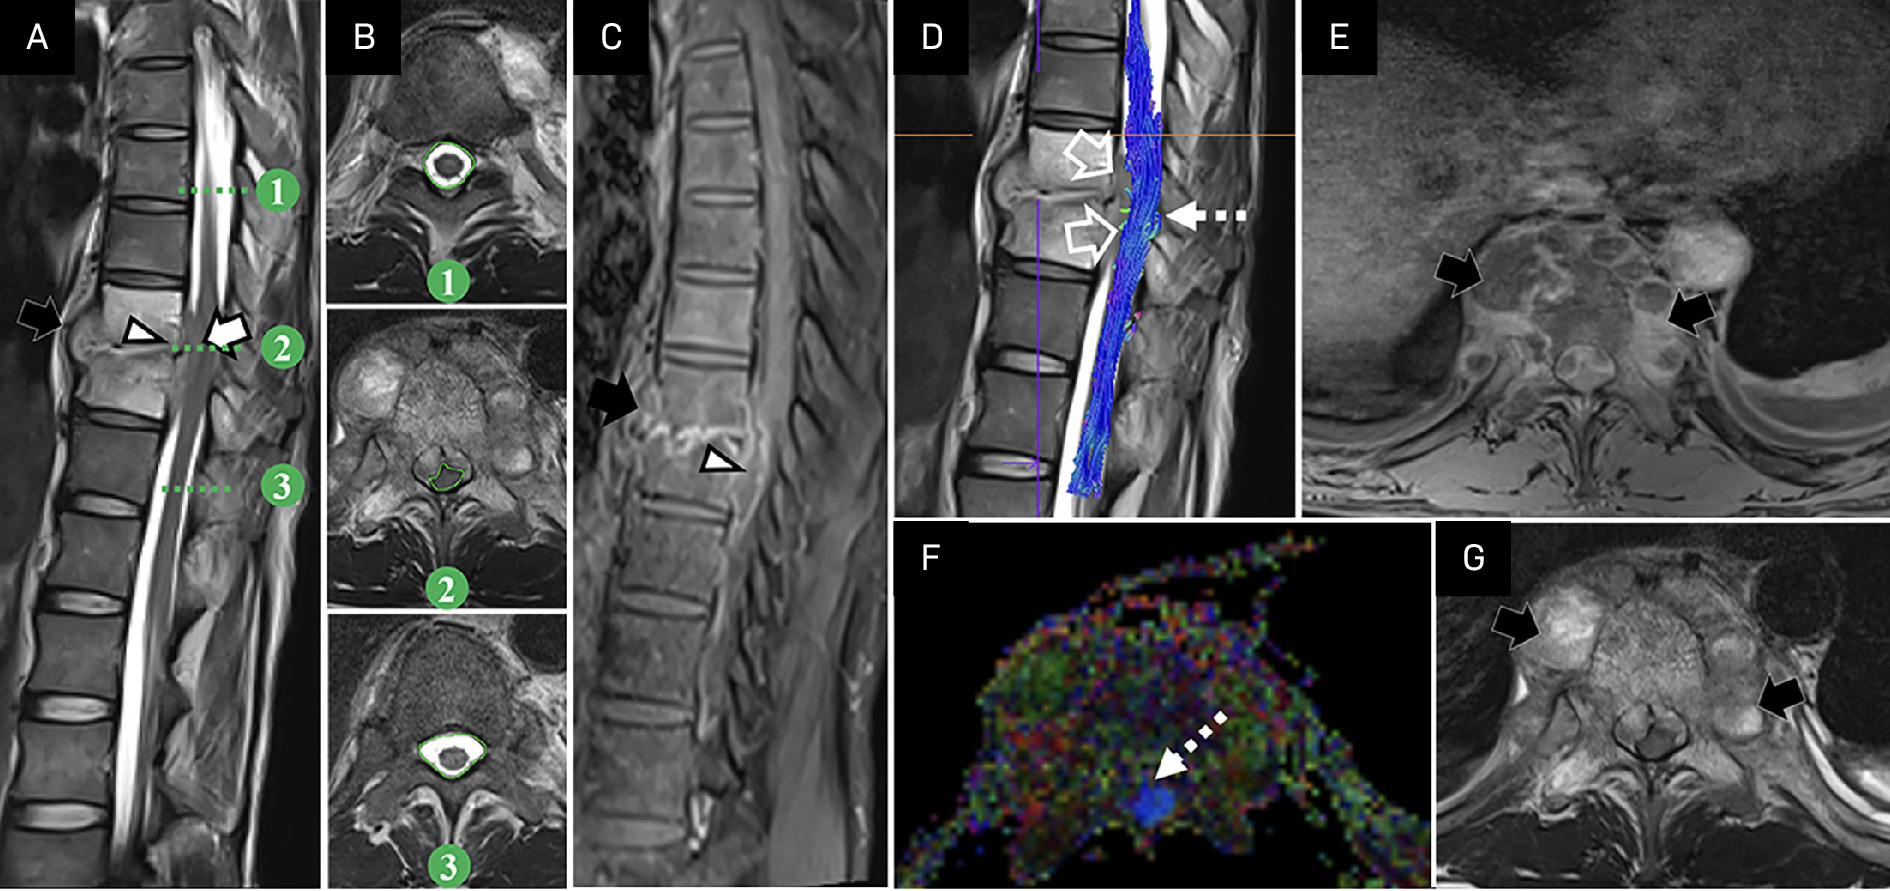
Tractography was performed to visualize directional diffusion, with tractography in different planes depicted by different colors: craniocaudal (blue), anteroposterior (red), and transverse (green). Tractography reconstructions were manually refined to exclude background noise and motion artifacts, including those from swallowing and respiration. Based on the classification by Abdelgawad et al, tractography patterns were categorized as follows: type I (no displacement or disruption), type II (disruption without displacement), type III (splaying without disruption), and type IV (splaying or displacement with disruption). 4
Statistical Analysis
All statistical analyses were performed using IBM SPSS Statistics software (version 25.0, IBM Corp., Armonk, New York) and Google Colab (Python 3.9 environment). Normality of continuous variables was assessed using the Shapiro-Wilk test, and nonparametric tests were applied for parameters that were not normally distributed.
DTI parameter mean values “Above” the site of cord compromise were taken as control, and those “At” the site of cord compromise were taken as case and were compared using paired t-test (normal distribution) or Wilcoxon signed-rank test (non-normal distribution). A significance threshold of P < .05 was used for these tests.
Differences between the values of DTI parameters “Above” and “At” were calculated according to Equations (2)-(4) and represented as ΔFA, ΔADC, and ΔRD, respectively.
(2)
(3)
(4)
Further, to normalize the differences in baseline DTI parameter values, ΔFA, ΔADC, and ΔRD values were divided by “Above” values to calculate the rate of change and percentage decrease in these parameters according to Equations (5)-(7), represented as ΔFA%, ΔADC%, and ΔRD%, respectively.
(5)
(6)
(7)
Receiver-operating characteristic (ROC) curve analysis was performed on percentage SCE as well as on mean, Δ, and %Δ values of DTI parameters to find out cutoffs/thresholds. The optimal threshold values were determined using the Youden index, with sensitivity, specificity, and area under the curve (AUC) reported. Bivariate Spearman correlation analysis [reported as correlation coefficients (ρ)] was used to assess the correlation of SCE, T2-hyperintensities, and DTI parameters with JOA scores.
Results
Following the clinical and neurological evaluation for the 30 patients with suspected spinal TB (cervical, dorsal, and dorsolumbar regions), baseline conventional MRI and DTI of the spine were performed. All patients had fever, anorexia, night sweats, and weight loss at presentation. A majority of the patients had localized complaints of lower back pain (73.4%), followed by upper back pain (23.3%) and neck pain (3.3%). Disseminated TB was seen in 50%, predominantly pulmonary (26.7%) and intracranial (20%). A history of exposure to TB was reported in 76.7%. Neurological deficits were present in 86.7%, most commonly JOA grade II (40%), followed by grade III (26.7%) and grade I (20%), with a mean JOA score of 10.04.
Conventional MRI Findings
Dorsal spine (83.3%) involvement, predominantly the lower dorsal segments (D8-D12), was most commonly seen, followed by cervical and cervicodorsal spine (16.7%), with 60% showing contiguous vertebral disease. Most patients (76.7%) showed typical involvement patterns, primarily paradiscal (70%). Among atypical forms, intraspinal tuberculomas (13.3%), skip lesions (6.7%), and CV junction involvement (3.3%) were observed. Pre-/paravertebral abscesses were seen in 86.7% of patients, with epidural extension in 73.3%. Severe (>75%) SCE was seen in 50% of patients, all of whom had cord T2 hyperintensity and significant deficits (mean JOA: 8.1). Overall, T2 hyperintensity was seen in 70% of patients, and moderate (>50%) canal compromise in 83.3% (Table 1).
| Canal Encroachment Range (%) | Total Number of Patients in the Category | Patients with T2 Hyperintensities | Patients with Significant Neurological Deficits (JOA Score < 13) | Mean JOA Score |
|---|---|---|---|---|
| 0-25 | 2 | 0 | 0 | 14.5 |
| 26-50 | 3 | 0 | 1 | 13 |
| 51-75 | 10 | 6 | 7 | 11.3 |
| 76-100 | 15 | 15 | 14 | 8.1 |
ROC curve analysis demonstrated that a canal stenosis threshold of 74.4% best predicted significant neurological deficit (JOA < 13), yielding a sensitivity of 62% and specificity of 83% (AUC = 0.74).
DTI Findings
Of the 30 patients, 4 showed discrete intramedullary tuberculomas, while the remaining had varying degrees of cord compression and edema secondary to epidural abscesses or vertebral collapse. As the mechanisms often overlapped and the diffusion abnormalities likely represented combined compressive, ischemic, and inflammatory changes, the entire cohort was analyzed together for DTI and tractography correlation with clinical findings. The mean FA, ADC, and RD values “Above” and “At” the site of cord compromise are summarized in Table 2. There was a significant decrease in FA and a significant increase in ADC and RD values “At” the site of cord compromise compared with “Above” (P value < .001 for all).
| DTI Parameters | Above | At | P Value |
|---|---|---|---|
| Mean FA | 0.67 | 0.51 | Paired t-test: P < .001 |
| Mean ADC (× 10-6 mm2/second) | 1123.52 | 1552.68 | Paired t-test: P < .001 |
| Mean RD (× 10-6 mm2/second) | 741.21 | 1318.56 | Wilcoxon signed-rank test: P < .001 |
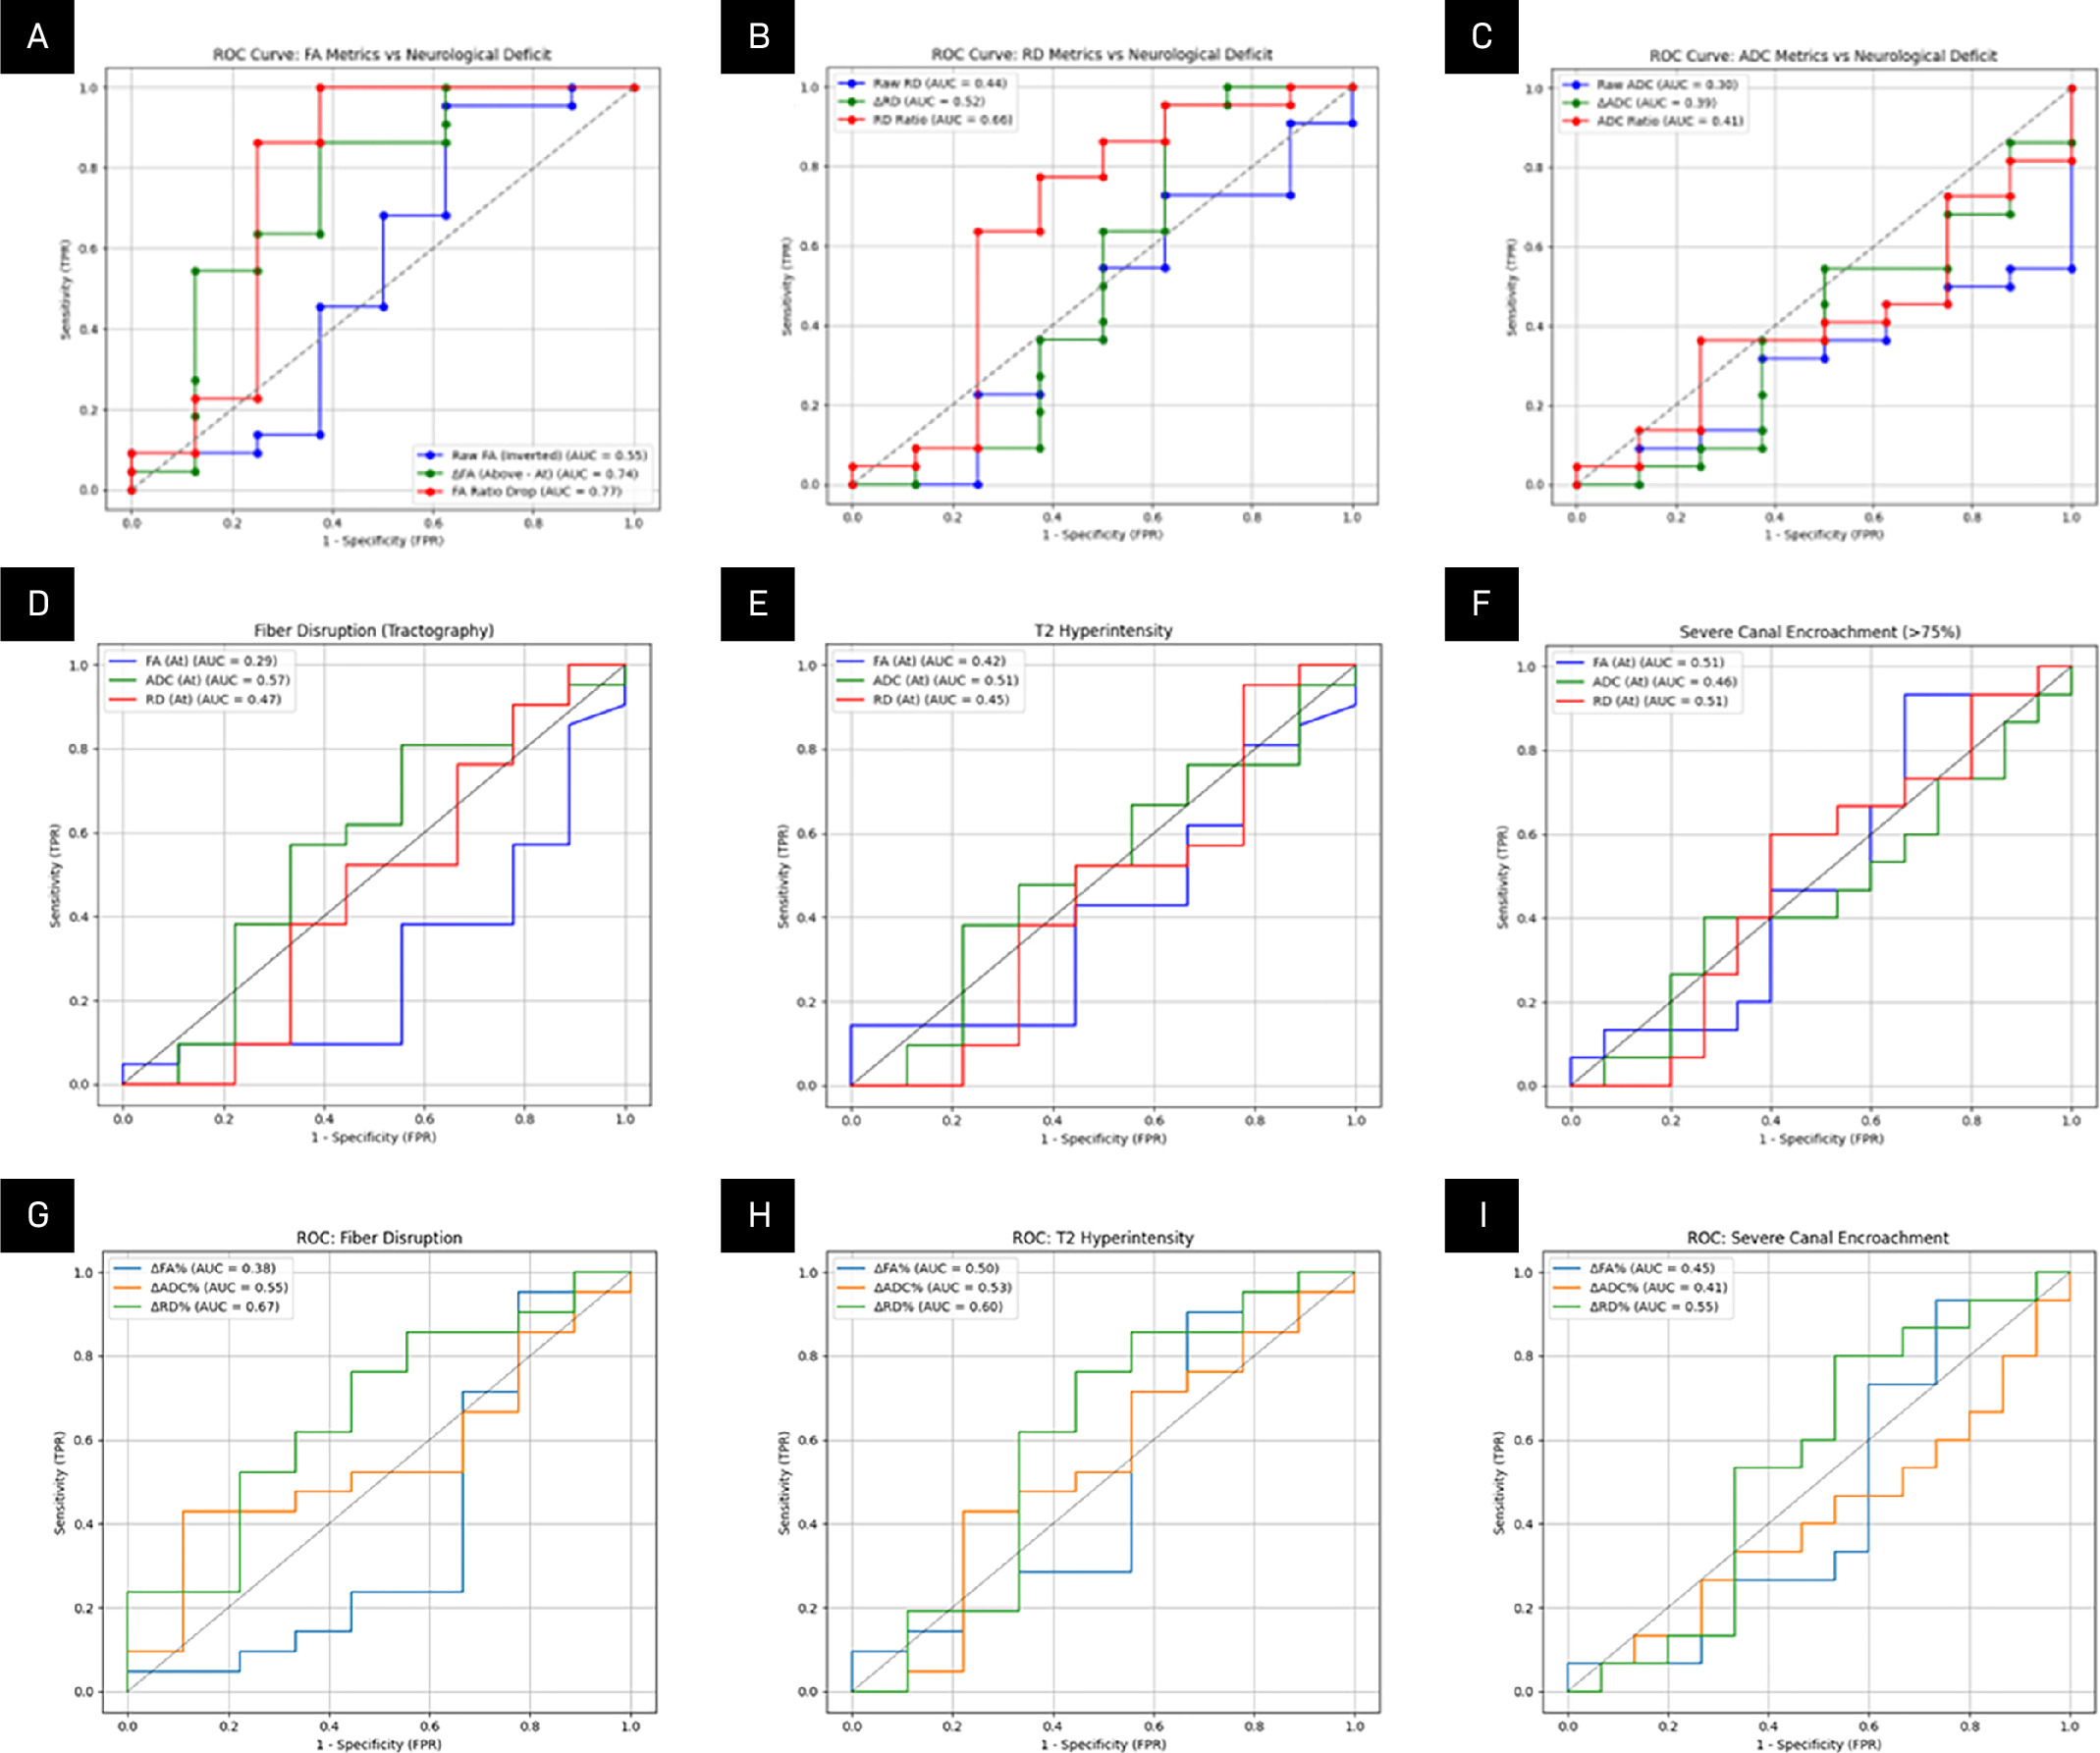
ROC/characteristic curve analysis of mean FA, ADC, and RD; ΔFA, ΔADC, ΔRD; and ΔFA%, ΔADC%, and ΔRD% values was performed to determine thresholds (T) and their respective sensitivity (SE), specificity (SP), and AUC for
-
Significant neurological deficits (JOA score < 13): Parameters showing good discriminatory power (AUC ~ 0.7) included ΔFA (AUC = 0.74) and ΔFA% (AUC = 0.77). ΔRD% also demonstrated moderately good performance (AUC = 0.66).
-
Presence of T2-hyperintense altered signal intensity in spinal cord: Only ΔRD% showed comparatively good discriminatory power (AUC = 0.60).
-
Disruption of fibers on tractography (seen in tractography patterns type II and IV): ΔRD% (AUC = 0.67) and ΔADC (AUC = 0.59) showed the best performance, followed by RD (At) and ΔRD (AUC = 0.58).
These are summarized in Table 3 and Figure 1.
| Parameter | Significant Neurological Deficit (JOA Score < 13) | T2 Hyperintensities in Cord | Disruption of Fibers on Tractography | |||||||||
|---|---|---|---|---|---|---|---|---|---|---|---|---|
| T | SE (%) | SP (%) | AUC | T | SE (%) | SP (%) | AUC | T | SE (%) | SP (%) | AUC | |
| FA (At) | ≤0.68 | 95 | 38 | 0.55 | ≤0.25 | 14 | 100 | 0.42 | ≤0.2 | 5 | 100 | 0.29 |
| ADC(At) (× 10-6 mm2/second) | ≥23,844 | 10 | 10 | 0.3 | ≥17,000 | 38 | 78 | 0.51 | ≥12,722 | 81 | 44 | 0.57 |
| RD (At) (× 10-6 mm2/second) | ≥930 | 73 | 38 | 0.44 | ≥708 | 95 | 22 | 0.45 | ≥738 | 67 | 67 | 0.58 |
| ΔFA | ≥0.12 | 86 | 62 | 0.74 a | ≥135 | 67 | 56 | 0.56 | ≥100 | 95 | 22 | 0.49 |
| ΔADC (× 10-6 mm2/second) | ≥380 | 55 | 50 | 0.39 | ≥365 | 62 | 56 | 0.52 | ≥377 | 62 | 67 | 0.59 |
| ΔRD (× 10-6 mm2/second) | 220 | 95 | 38 | 0.52 | ≥152 | 10 | 22 | 0.5 | ≥393 | 67 | 67 | 0.58 |
| ΔFA% | ≥13.6 | 10 | 62 | 0.77 a | ≥13.6 | 90 | 33 | 0.5 | ≥12.2 | 95 | 22 | 0.38 |
| ΔADC% | ≥62.5 | 36 | 75 | 0.41 | ≥33.2 | 43 | 78 | 0.53 | ≥62.5 | 43 | 89 | 0.55 |
| ΔRD% | ≥45.3 | 77 | 62 | 0.66 a | ≥45.3 | 76 | 56 | 0.6 | ≥45.3 | 76 | 56 | 0.67 a |
Tractography Findings
The most common tractography pattern in the study was type IV (67%), followed by type I (16.7%), type III (13.4%) and type II (3.3%). Of patients who had type IV tractography pattern, 85% had significant neurological deficit (JOA score < 13) (Table 4).
| Tractography Pattern | Total Number of Patients | No Significant Deficit (JOA ≥ 13) | Significant Deficit (JOA < 13) |
|---|---|---|---|
| Type I (no displacement or disruption) | 5 | 3 (60%) | 2 (40%) |
| Type II (disruption without displacement) | 1 | 0 | 1(100%) |
| Type III (splaying without disruption) | 4 | 2 (50%) | 2 (50%) |
| Type IV (splaying/displacement with disruption) | 20 | 3 (15%) | 17 (85%) |
There was a significant association between tract disruption, seen in patterns II (3.3%) and IV (67% patients), and the presence of neurological deficit (JOA < 13), with an odds ratio of 7.5 (P = .0318, Fisher exact test).
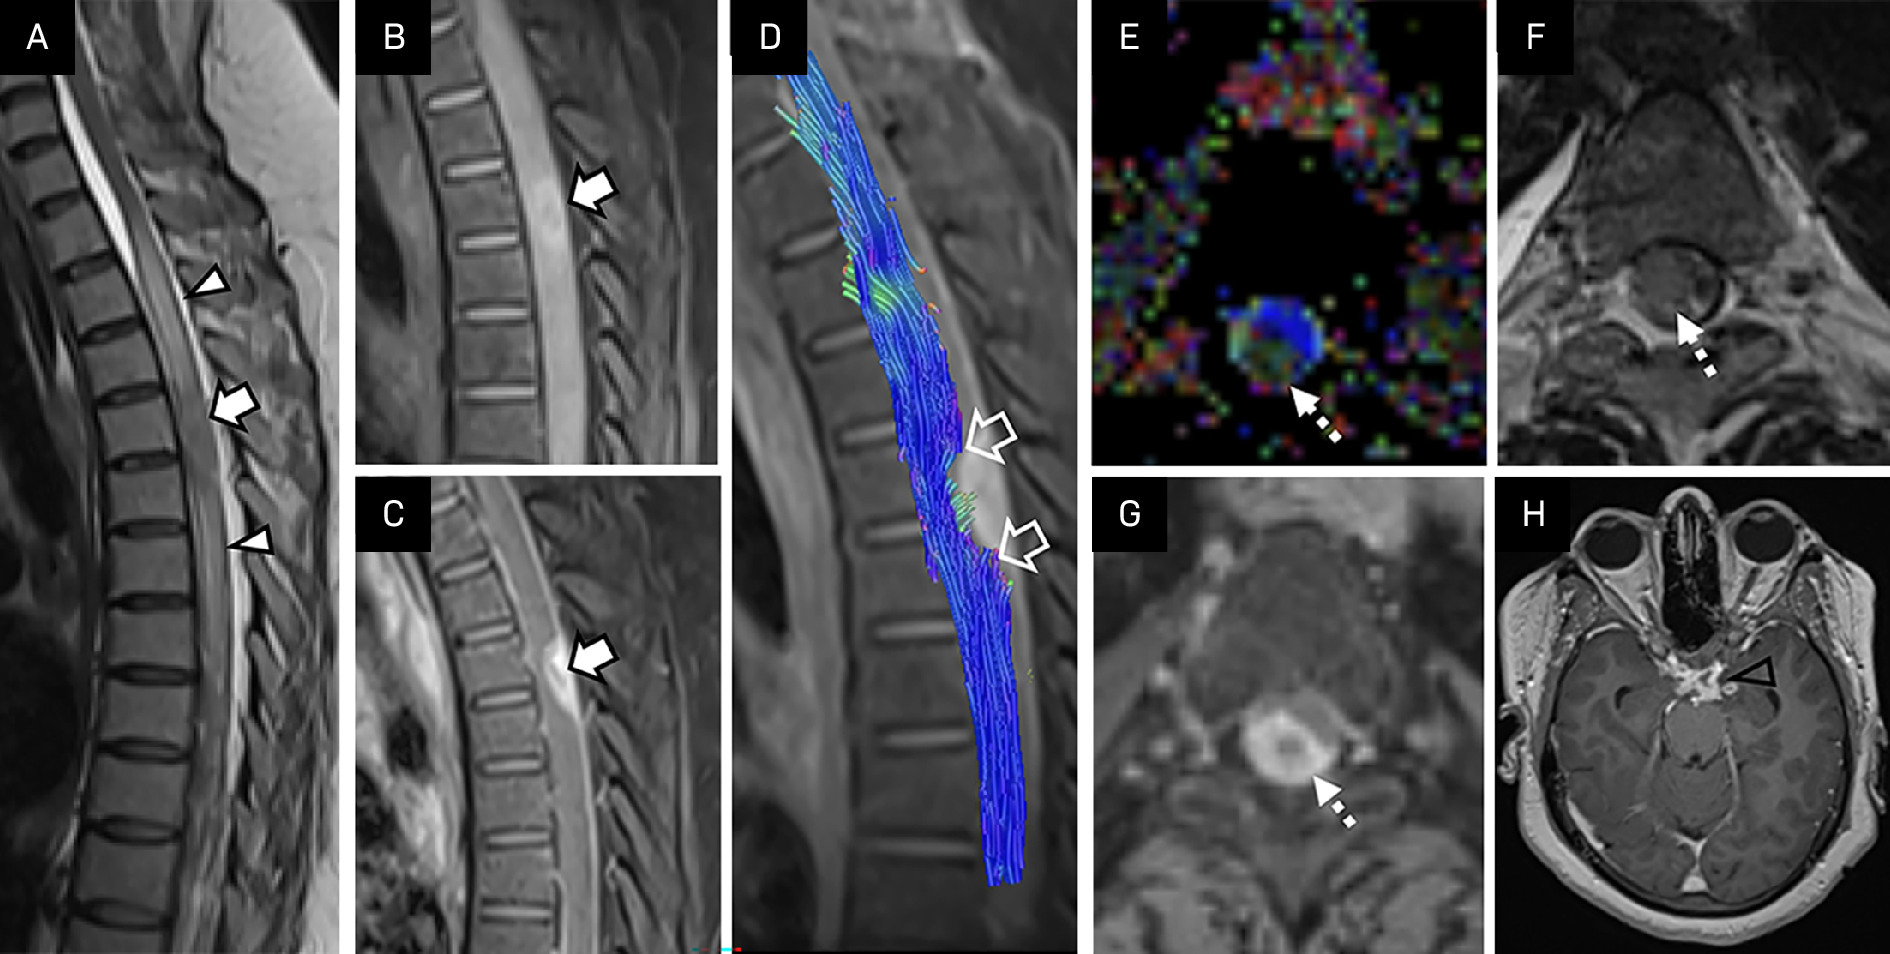
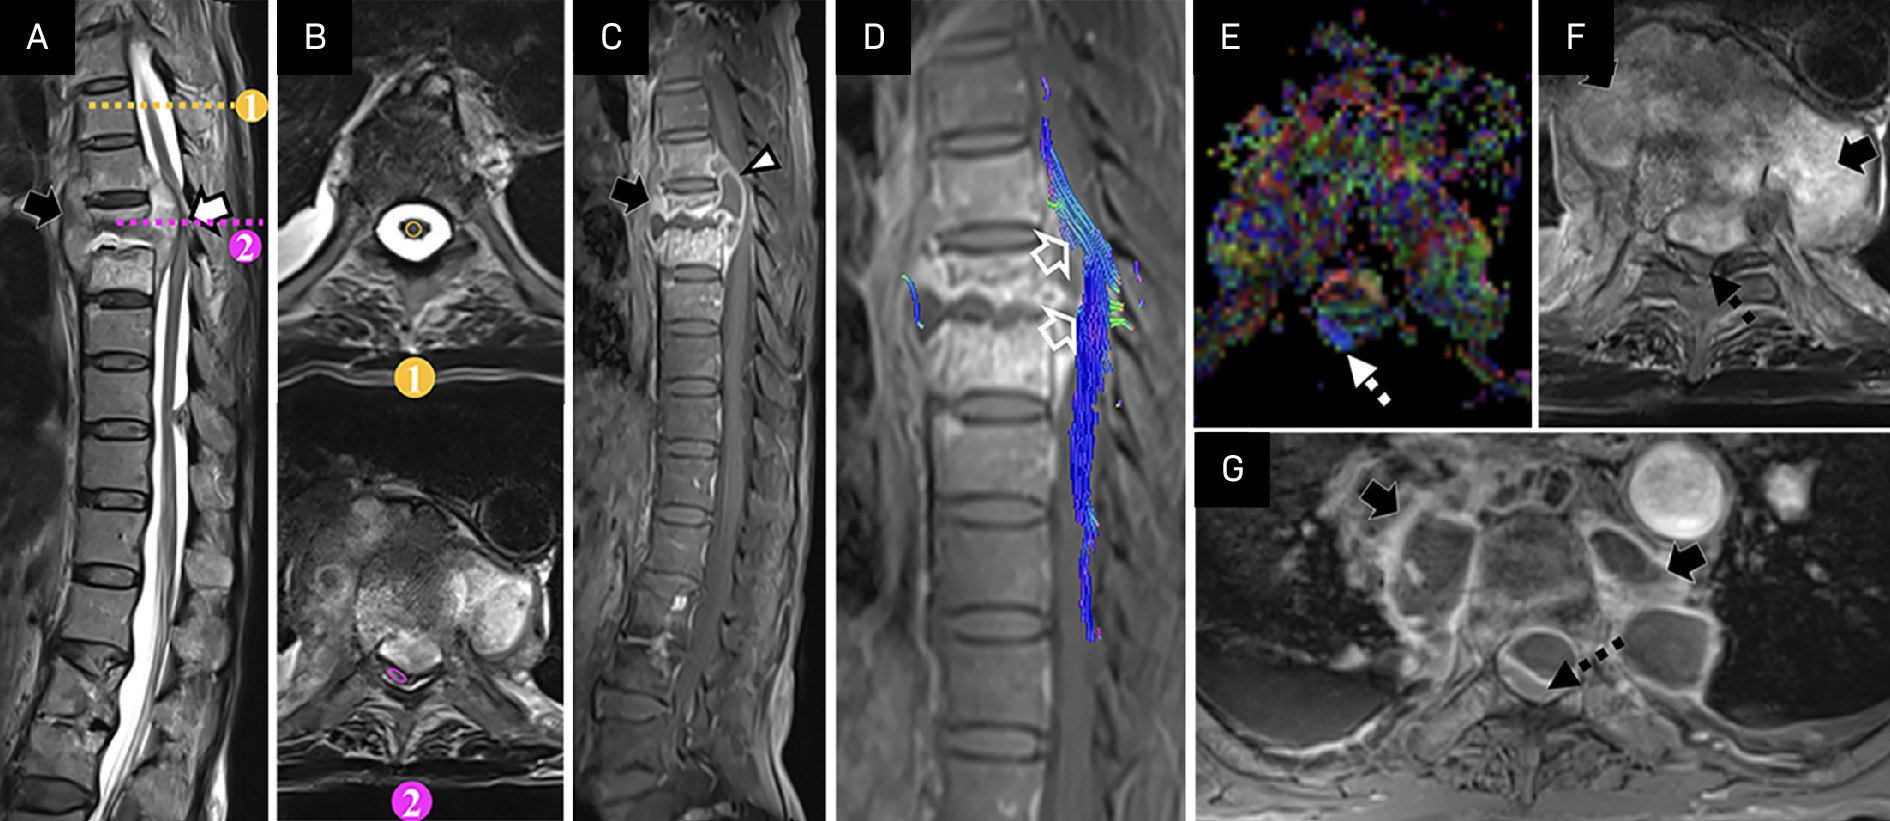
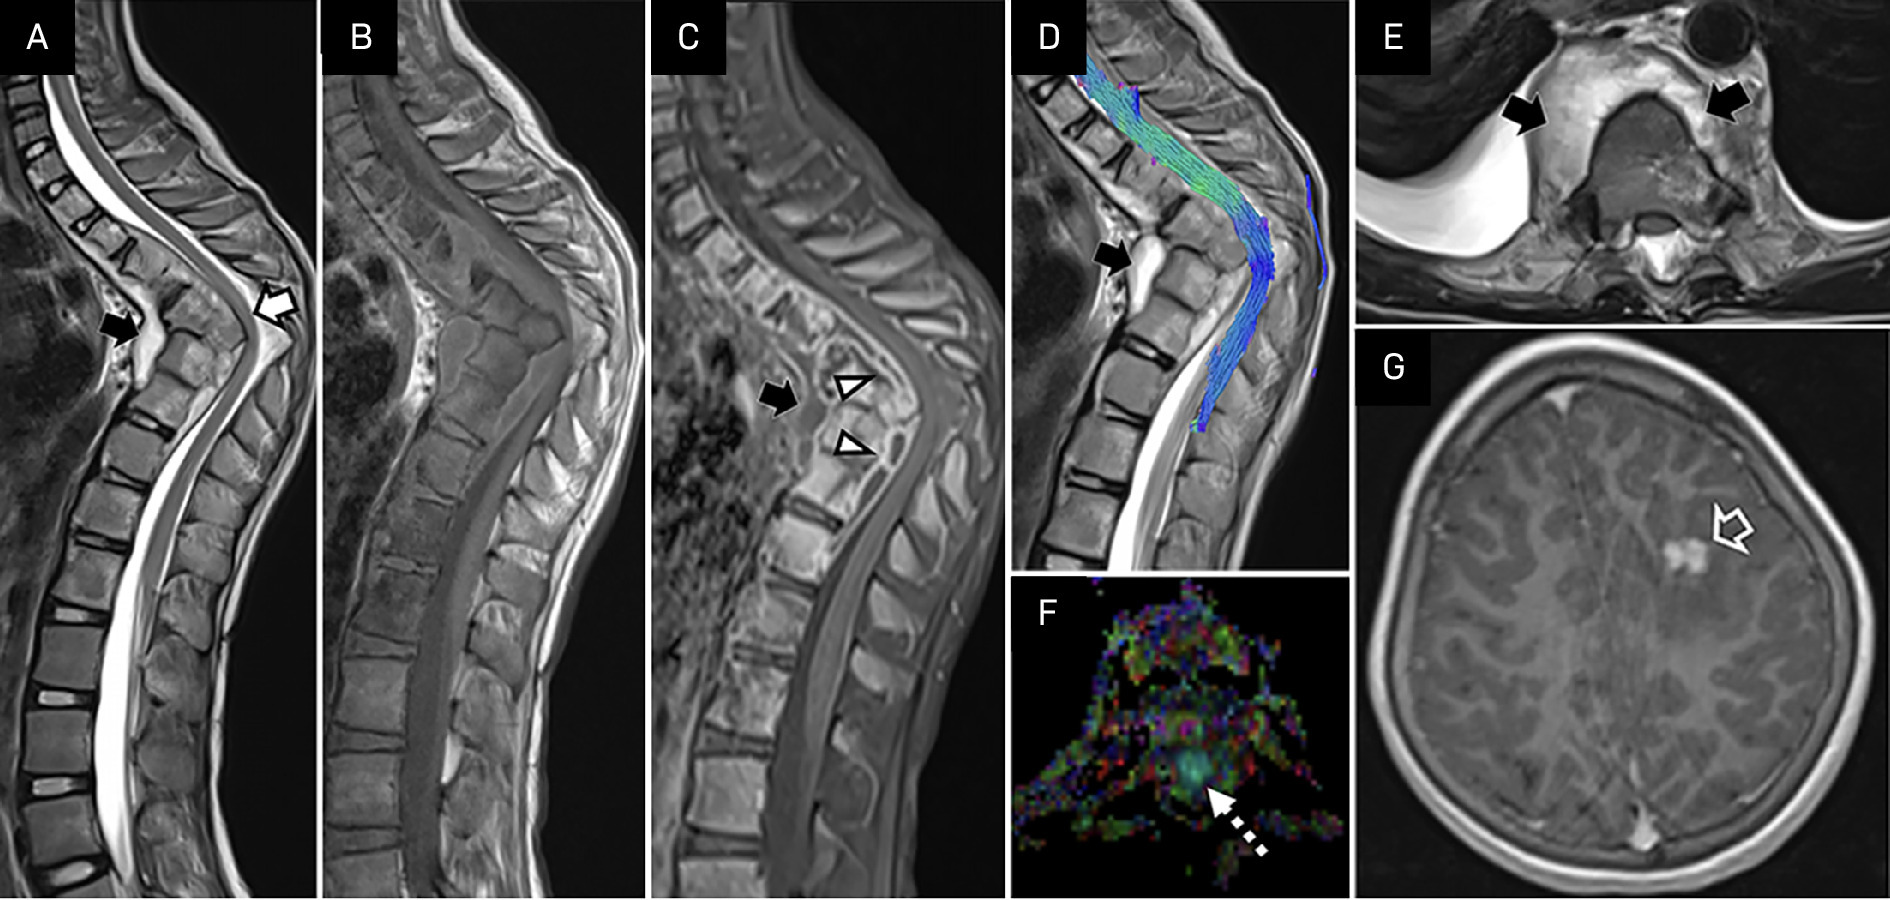
Figures 2-5 depict the conventional MRI, DTI, and tractography findings in a few cases of spinal TB.
Correlation Analysis
There was a significant negative correlation between JOA scores and both percentage canal encroachment (ρ = –0.59, P = .0005) and the presence of T2-hyperintensity in the spinal cord (ρ = –0.49, P = .0065). Correlation analysis between DTI parameters and JOA score using Pearson and Spearman correlations was performed. Higher FA values correlated with higher JOA scores (ρ = 0.13, P = .50), while RD values negatively correlated with JOA scores (ρ = –0.11, P = .55). Both ΔFA and ΔRD showed negative correlation with JOA scores (ρ = –0.336, P = .07 and ρ= –0.16, P = .41, respectively). Only ΔFA% showed statistically significant negative correlation with JOA score (ρ = –0.374, P = .04). Mean ADC, ΔADC, ΔADC%, and ΔRD% showed minimal correlations with JOA scores. There was a significant negative correlation between fiber disruption on tractography (seen in type II and IV patterns) and JOA scores (ρ = –0.621, P = .0003), indicating that disrupted fibers were associated with worse neurological status.
Discussion
In the evaluation of 30 patients with spinal TB, this study highlights the importance of conventional MRI findings such as pre- and paravertebral abscesses with epidural extension, SCE, altered cord signal intensity, and DTI parameters, by drawing statistically significant correlations and diagnostic cutoffs.
A SCE threshold of 74.4% optimally predicted significant neurological deficit, with an AUC of 0.74, sensitivity of 62%, and specificity of 83%. There was a significant negative correlation between JOA scores and both canal encroachment (ρ = –0.59, P = .0005) and T2 hyperintensity (ρ = –0.49, P = .0065), supporting the combined role of mechanical and intrinsic cord pathology in determining neurological status. Spinal TB can cause cord compromise by 2 processes: external compression by epidural abscesses or intrinsic compromise due to intraspinal tuberculomas and myelitis. More often than not, in clinical and imaging practice, these processes often coexist along a pathophysiologic continuum, and the actual results are a mixture of the 2. The altered diffusion and signal characteristics within the spinal cord due to compression by epidural abscesses externally can be a result of direct dissemination of bacteria into the cord, inflammatory or ischemic cord changes, and not just a mere consequence of canal compromise and impingement. Since the true differentiation can be made only via biopsy, a strict distinction between “intrinsic” and “extrinsic” cord involvement would have been misleading and therefore was not the goal of this study. The present work instead focuses on assessing how diffusion tensor metrics and tractography reflect the overall degree of cord compromise and functional impairment in spinal TB, irrespective of the exact mechanism of cord involvement.
Compression of the spinal cord leads to altered membrane permeability, extracellular edema, and ischemic injury, resulting in increased ADC and RD and reduced FA. RD is particularly sensitive to myelin integrity, with higher values reflecting demyelination. 5-8
In our patients, we observed significant changes “At” the site of cord compromise compared to “Above.” FA decreased from 0.67 to 0.51, while ADC and RD increased from 1123.522 to 1552.68 × 10⁻⁶ mm²/second and 741.21 to 1318.56 × 10⁻⁶ mm²/second, respectively (P < .001 for all). These reflect reduced anisotropy and increased extracellular diffusion due to microstructural damage. Few studies have reported similar decreased FA and increased MD at and below the level of cord compromise in their patients with spinal TB, although MD changes were not significant between groups with and without neurological deficits, highlighting FA’s superior sensitivity. 9
Among all evaluated DTI parameters, ΔFA% demonstrated the best diagnostic performance for identifying significant neurological deficit (JOA < 13), with AUC 0.77, sensitivity 100%, and specificity 62%. ΔFA performed similarly (AUC 0.74), followed by ΔRD% (AUC 0.66, sensitivity 77%, specificity 62%). ROC analysis for predicting T2 hyperintensity and fiber disruption showed ΔRD% had the best combined sensitivity and specificity (76% and 56%, AUC = 0.60‐0.67), suggesting its potential as a surrogate marker for myelin damage.
To our knowledge, there is limited literature on sensitivity and specificity of DTI parameters in spinal TB. Prior studies have reported FA and MD cutoffs differentiating pyogenic and tuberculous spondylitis, but these were measured within vertebral bodies and not the cord. 10 Our findings extend DTI analysis to cord-level pathology and define thresholds with functional correlation.
Similar results have been reported in other compressive pathologies. Lee et al identified FA, MD, RD, and AD cutoffs in cervical spondylotic myelopathy (FA: 0.475; RD: 0.749 × 10⁻³ mm²/second) and showed that FA combined with RD or AD is superior to FA or MD alone. Likewise, prior studies have shown FA’s superior specificity and sensitivity (100% and 73.3%) over ADC and T2WI in detecting neurological impairment due to various causes of cord compression. Nischal et al demonstrated that FA (87.5%) outperformed ADC (75%) and T2 hyperintensity (25%) for early myelopathy detection . 11 These findings reinforce FA’s role in identifying early microstructural injury, while RD indicates myelin disruption. 12
Among DTI metrics, only ΔFA% demonstrated a statistically significant negative correlation with JOA score (ρ = –0.374, P = .04). While ΔFA showed a moderate negative trend (ρ = –0.336, P = .07), other parameters, including mean FA, ADC, RD, and their respective Δ and %Δ values, showed weak and nonsignificant correlations. Few studies have highlighted that preoperative motor scores in patients with spinal TB correlated positively with FA (P < .001) and negatively with canal compromise and ADC (P ≤ .05), suggesting that FA is a better marker for preserved motor function. In contrast, sensory scores correlated weakly with canal compromise and moderately with ADC, possibly explaining why JOA score (which encompasses both motor and sensory components) showed a diluted association with ADC in our analysis. 13
There is evidence suggesting that in patients with spondylotic myelopathy, FA showed strong negative correlation and ADC showed moderate positive correlation with Nurick clinical scores at the stenotic level. 7 In patients with mild to moderate cervical spondylotic myelopathy, FA and RD were significantly correlated with severity of stenosis and mJOA scores, with RD indicating myelin disruption. 8
In this study, tractography findings showed that 67% of patients had type IV pattern (disruption with splaying/displacement), among whom 85% had significant neurological deficits (JOA < 13). There were significant associations (odds ratio of 7.5, P = .0318, Fisher exact test) and significant negative correlations (ρ = –0.621, P = .0003) of fiber disruption (seen in patterns II and IV) with neurological impairment, indicating its association with lower JOA scores and worse neurological status. Quantitative analysis of fiber tractography in a few studies of compressive spondylotic myelopathy has shown that there is a decrease in the length of fibers, track, and voxel counts with loss of long fiber tracks compared with normal healthy spinal cord. 14 A few studies have shown that while disruption of fibers may not have a direct bearing on the clinical severity of myelopathy, it is associated with poor neurological recovery. 9,15,16
Limitations
This study had certain limitations. The sample size was modest (n = 30), limiting statistical generalizability and precluding subgroup analysis by spinal level. Its cross-sectional design did not allow longitudinal evaluation of DTI metrics or functional recovery. Manual ROI placement in the narrow spinal cord may have introduced operator bias, and susceptibility or motion artifacts could have affected quantitative accuracy, particularly in markedly compressed segments. Tractography interpretation was occasionally limited by cord distortion or signal dropout. Finally, although we included patients with cervical, dorsal, and cervicodorsal involvement, region-specific analysis of DTI metrics could not be performed due to small numbers in the various subgroups.
Conclusion
This study demonstrates the utility of DTI as a valuable adjunct to conventional MRI in the evaluation of spinal TB. We observed that parameters such as ΔFA, ΔFA%, and ΔRD% showed strong correlation with neurological deficits and tract disruption, with ΔFA% emerging as the most robust predictor of neurological impairment. ROC curve analysis further highlighted the diagnostic potential of DTI-derived metrics, particularly in identifying significant cord compromise and altered signal intensity. Tractography patterns also showed significant association with neurological outcomes, emphasizing the importance of assessing fiber integrity in addition to morphologic changes. While our findings support the role of DTI in assessing the severity and functional impact of spinal TB, larger studies with longitudinal follow-up are warranted to validate its prognostic value and establish standardized thresholds for clinical use.
References
- Keller A, von Ammon K, Klaiber R, Waespe W. Spondylogenic cervical myelopathy: conservative and surgical therapy. Schweiz Med Wochenschr. 1993;123(36):1682-1691.
- Avantsa D. MR imaging features of tuberculosis of the spine. J Med Sci Clin Res. 2017;5(7):24824-24830. doi:10.18535/jmscr/v5i7.87.
- Nath Gupta P, Kumar D, Srivastav A. Atypical features in potts spine on MR imaging. IJMRP. 2016;2(6):252-255. doi:10.21276/ijmrp.2016.2.6.050.
- Abdelgawad M, Reda M, El-Maaboud N. Diffusion tensor MR fiber tractography in assessment of inflammatory processes and neoplasms of the cervical cord. EJRNM. 2017;48(2):431-437. doi:10.1016/j.ejrnm.2017.03.007.
- Desai S. Early diagnosis of spinal tuberculosis by MRI. J Bone Joint Surg Br. 1994;76(6):863-869. doi:10.1302/0301-620X.76B6.7983108.
- Jain A, Aggarwal A, Mehrotra G. Correlation of canal encroachment with neurological deficit in tuberculosis of the spine. Int Orthop. 1999;23(2):85-86. doi:10.1007/s002640050313.
- Budde M, Xie M, Cross A, Song S. Axial diffusivity is the primary correlate of axonal injury in the experimental autoimmune encephalomyelitis spinal cord: a quantitative pixelwise analysis. J Neurosci. 2009;29(9):2805-2813. doi:10.1523/JNEUROSCI.4605-08.2009.
- Wheeler‐Kingshott C, Cercignani M. About “axial” and “radial” diffusivities. Magn Reson Med. 2009;61(5):1255-1260. doi:10.1002/mrm.21965.
- Tanaviriyachai T, Choovongkomol K, Pornsopanakorn P. Factors affecting neurological deficits in thoracic tuberculous spondylodiscitis. Int J Spine Surg. 2023;17(5):645-651. doi:10.14444/8522.
- Mittal S, Yadav G, Ahuja K. Predicting neurological deficit in patients with spinal tuberculosis - a single-center retrospective case-control study. SICOT J. 2021;7. doi:10.1051/sicotj/2021002.
- Nischal N, Tripathi S, Singh J. Quantitative evaluation of the diffusion tensor imaging matrix parameters and the subsequent correlation with the clinical assessment of disease severity in cervical spondylotic myelopathy. Asian Spine J. 2021;15(6):808-816. doi:10.31616/asj.2020.0223.
- Rathod T, Sathe A, Marathe N. It’s never too late: neurological outcome of delayed decompression in tuberculosis of spine. Global Spine J. 2021;11(5):716-721. doi:10.1177/2192568220922209.
- Li X, Yang Y, Lin C, Xie F, Liang W. Assessment of the diagnostic value of diffusion tensor imaging in patients with spinal cord compression: a meta-analysis. Braz J Med Biol Res. 2016;49(1). doi:10.1590/1414-431X20154769.
- Abbas S, Jain A, Saini N. Diffusion tensor imaging observation in Pott’s spine with or without neurological deficit. Indian J Orthop. 2015;49(3):289-299. doi:10.4103/0019-5413.156195.
- Abdel Razek A, Mohamed Sherif F. Assessment of diffusion tensor imaging in differentiation between pyogenic and tuberculous spondylitis. Eur J Radiol. 2021;139:109695. doi:10.1016/j.ejrad.2021.109695.
- Lee S, Lee Y, Chung T. Accuracy of diffusion tensor imaging for diagnosing cervical spondylotic myelopathy in patients showing spinal cord compression. Korean J Radiol. 2015;16(6):1303-1312. doi:10.3348/kjr.2015.16.6.1303.
Disclosures
The authors have no conflicts of interest to disclose. None of the authors received outside funding for the production of this original manuscript and no part of this article has been previously published elsewhere.
Acknowledgments
Written informed consent/assent was obtained from all participants or their parents/guardians, as applicable.
Citation
. From Signals to Signs: Diffusion Tensor Imaging and Fiber Tractography of Spine in Predicting Neurological Impairment in Spinal Tuberculosis. Applied Radiology. 2025;55(1). doi:10.37549/AR-D-25-0145.