Helical CT pulmonary angiography for acute pulmonary embolism
Applied Radiology — Vol. 31 , Issue 4 , pp. 21 -30
DOI: 10.37549/AR1078
Published: April 1, 2002
Categories
Helical CT pulmonary angiography (HCTPA) is increasingly used for the evaluation of patients suspected of having acute pulmonary embolism (PE). This technique offers many advantages over other modalities traditionally used to examine such patients. Helical CT pulmonary angiography is widely available and is performed rapidly. In cases interpreted as negative, HCTPA frequently provides alternative diagnoses for symptoms suggestive of acute PE.1,2
To use this modality effectively, radiologists must be familiar with proper HCTPA protocols for imaging suspected pulmonary embolism, HCTPA findings of acute PE, and commonly encountered diagnostic pitfalls. In addition, it is becoming increasingly important to have an understanding of the controversies and limitations of HCTPA.
HCTPA technique for acute PE
Helical CT pulmonary angiography protocols require attention to several technical parameters to optimize study quality. These parameters include: beam collimation, pitch, volume of coverage, scanning direction, field of view, tube amperage (mA), and contrast injection timing and rate.
Single-detector helical CT systems
Collimation—Thin collimation, typically 2 or 3 mm, should be used for PE imaging on single-detector helical CT (SDCT) systems.3 Narrow collimation provides improved spatial resolution, and allows the necessary volume of tissue to be covered in a period of 15 to 20 seconds, and provides improved visualization of smaller pulmonary arteries compared with thicker collimation studies.2
Pitch—The pitch should be increased as needed to scan the required volume of tissue in an expedient manner. A pitch of 2 on SDCT is usually adequate, and the pitch may be increased further to provide more coverage. Increasing the pitch from 1 to 2 increases effective slice thickness by about 30%. In general, it is preferable to increase pitch, rather than collimation, to provide more volume of coverage.4
Volume of coverage—The volume of coverage should range from the superior aspect of the aortic arch to approximately 3 to 4 cm below the level of the inferior pulmonary veins. To minimize scan degradation due to respiratory motion (which will be maximal in the lung bases), scanning should proceed in the caudal to cranial direction.
Field of view—The field of view (FOV) should encompass the width of the chest at the widest part of the thorax. The FOV should not be collimated tightly, because this will reduce photon flux and contribute to increased image noise. Additionally, excessively tight collimation may obscure potential alternative diagnoses in the peripheral lung, pleural space, or chest wall.
Tube amperage (mA)—While every effort should be made to reduce tube current, and thereby limit the radiation dose to the patient, PE studies require high-contrast resolution, and dose reduction should be thus be undertaken cautiously.
Contrast injection rate and timing—HCTPA technique requires injection rates of 3 mL/sec or more. While a standard contrast injection delay of 20 seconds may suffice in most patients, such a standard delay may not be appropriate for patients with congestive heart failure or venous stenoses. When possible, the use of bolus timing software will provide properly timed, high-quality studies routinely.4 Automated bolus timing may be performed with a cursor placed on the main pulmonary artery.
Multidetector row helical CT systems
Multidetector row helical CT (MDCT) systems have additional detectors that allow for rapid scanning of the pulmonary vascular bed using very narrow collimation during a reasonable scan time. This technology allows for narrow collimation (1.25 mm collimation on GE LightSpeed scanners, GE Medical Systems, Milwaukee, WI) to be utilized, providing increased spatial resolution. The improvement in spatial resolution may translate to improved visualization of small (subsegmental) pulmonary arteries.5 A reconstruction increment may be utilized (0.6 to 0.7 mm), which probably adds little to the scan quality but may improve the quality of reformations and renderings, although at the cost of increased data storage requirements.
A high pitch (table transport speed) should be used for MDCT pulmonary angiography (a pitch of 6, or “high speed” mode on GE LightSpeed scanners).
Because MDCT scanners (4-ring systems) acquire data at least 3 times faster than SDCT systems, the entire chest may be scanned, rather than limiting the volume of coverage as is required with SDCT scanners. Similar to SDCT protocols, scanning should proceed from caudal to cranial, and high injection rates and bolus timing software should be used.
HCTPA findings of acute PE
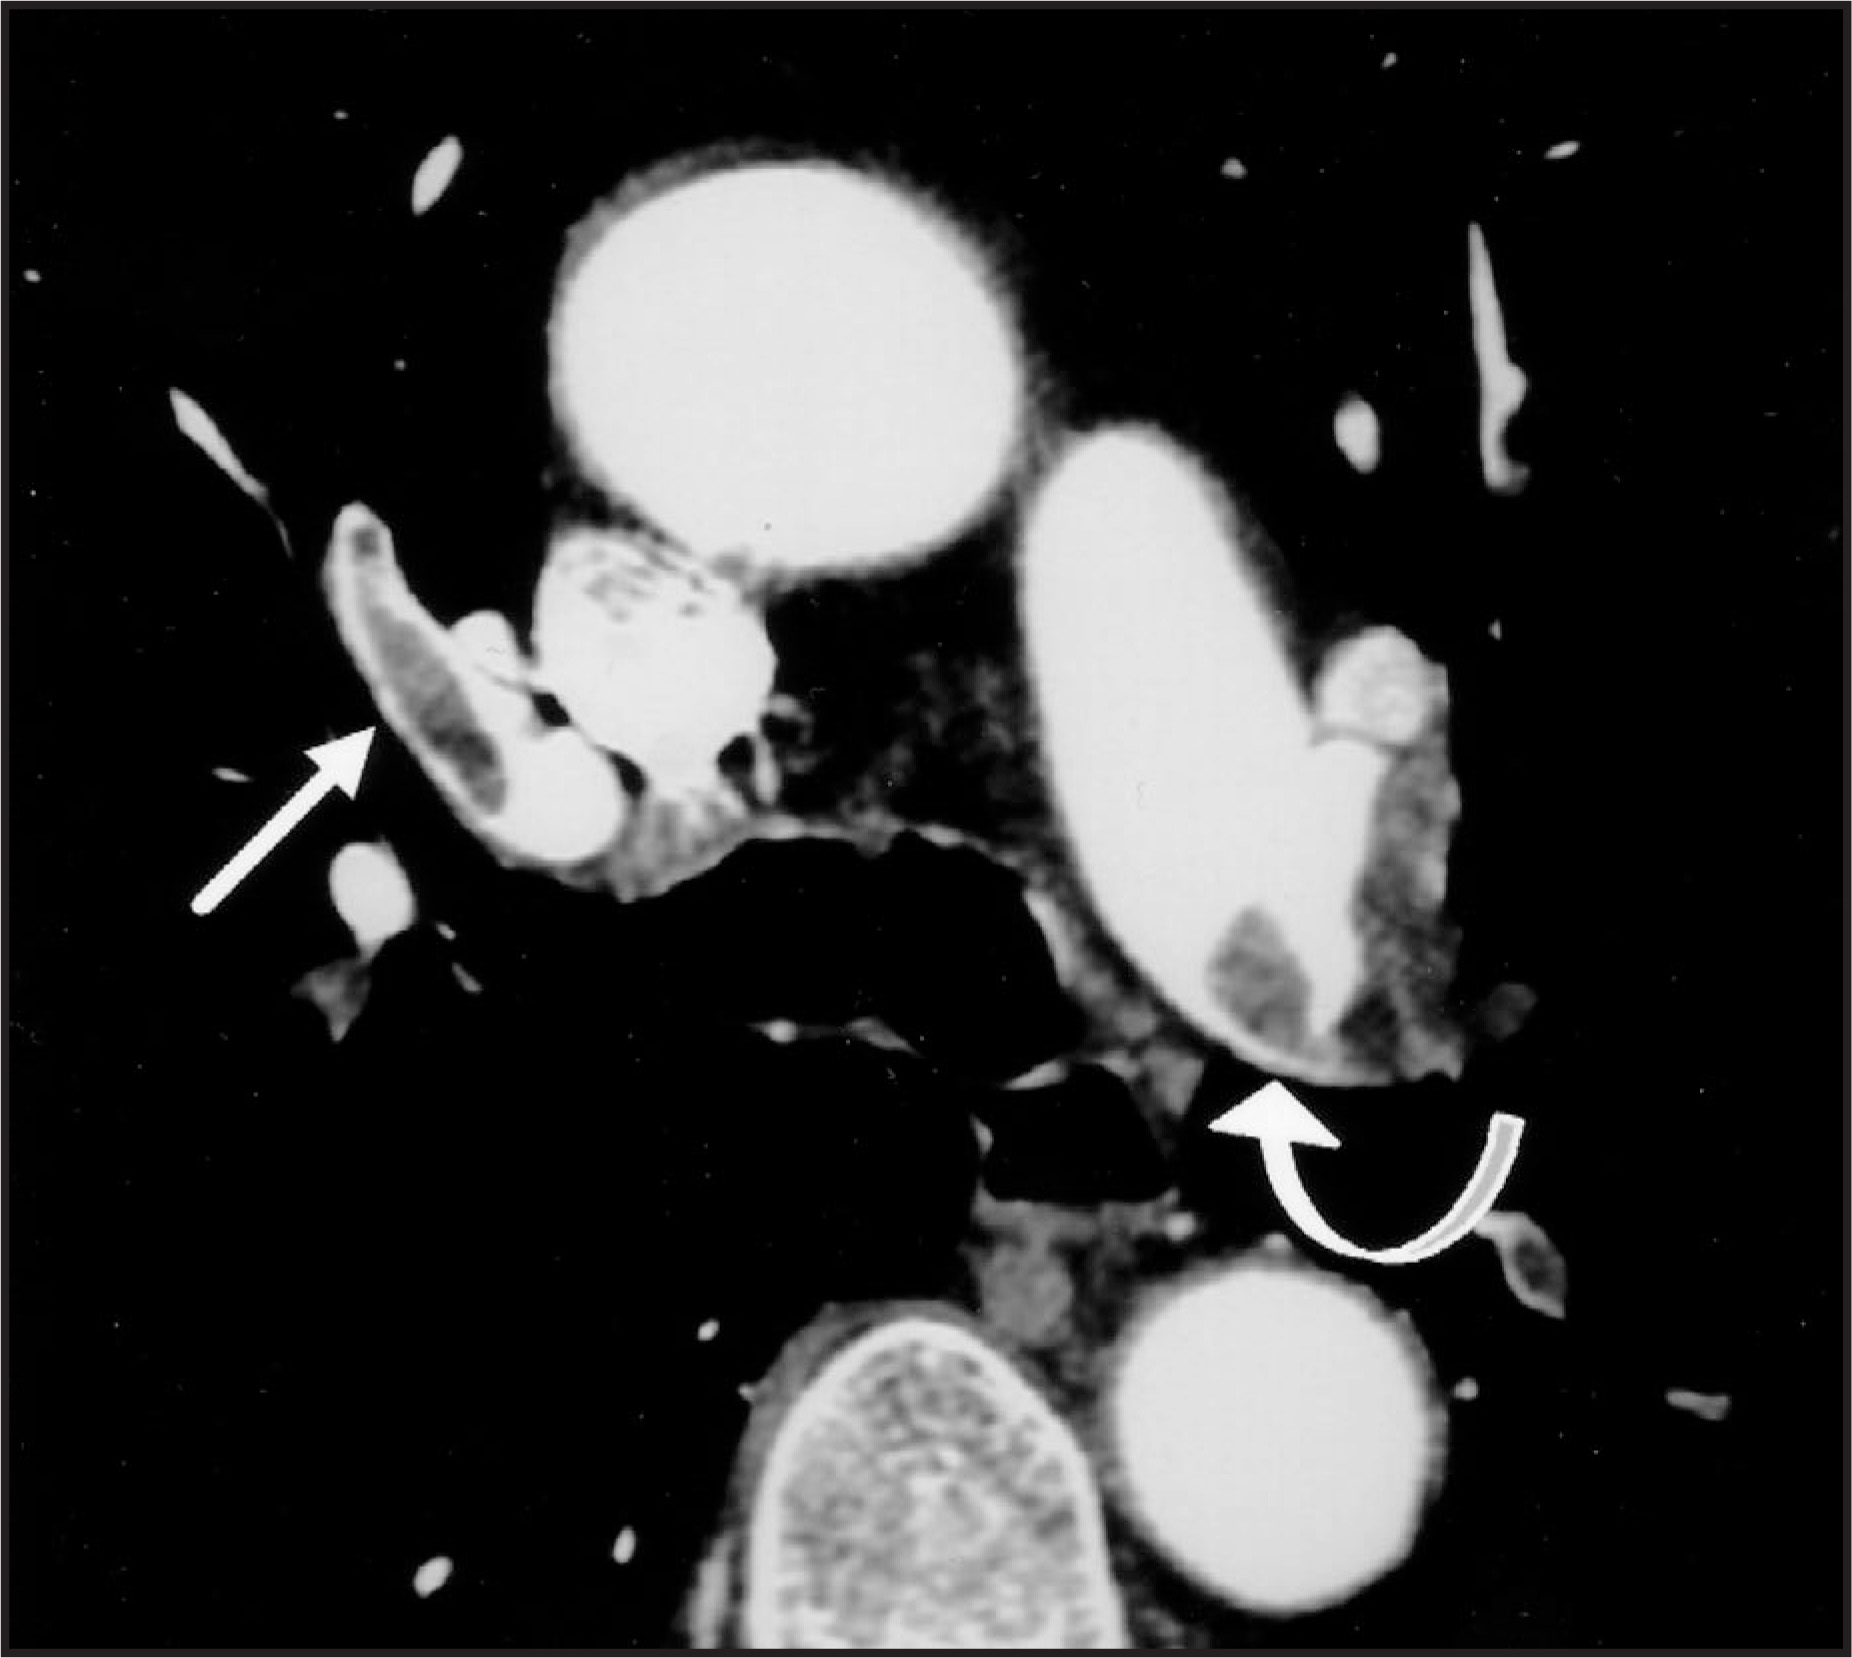
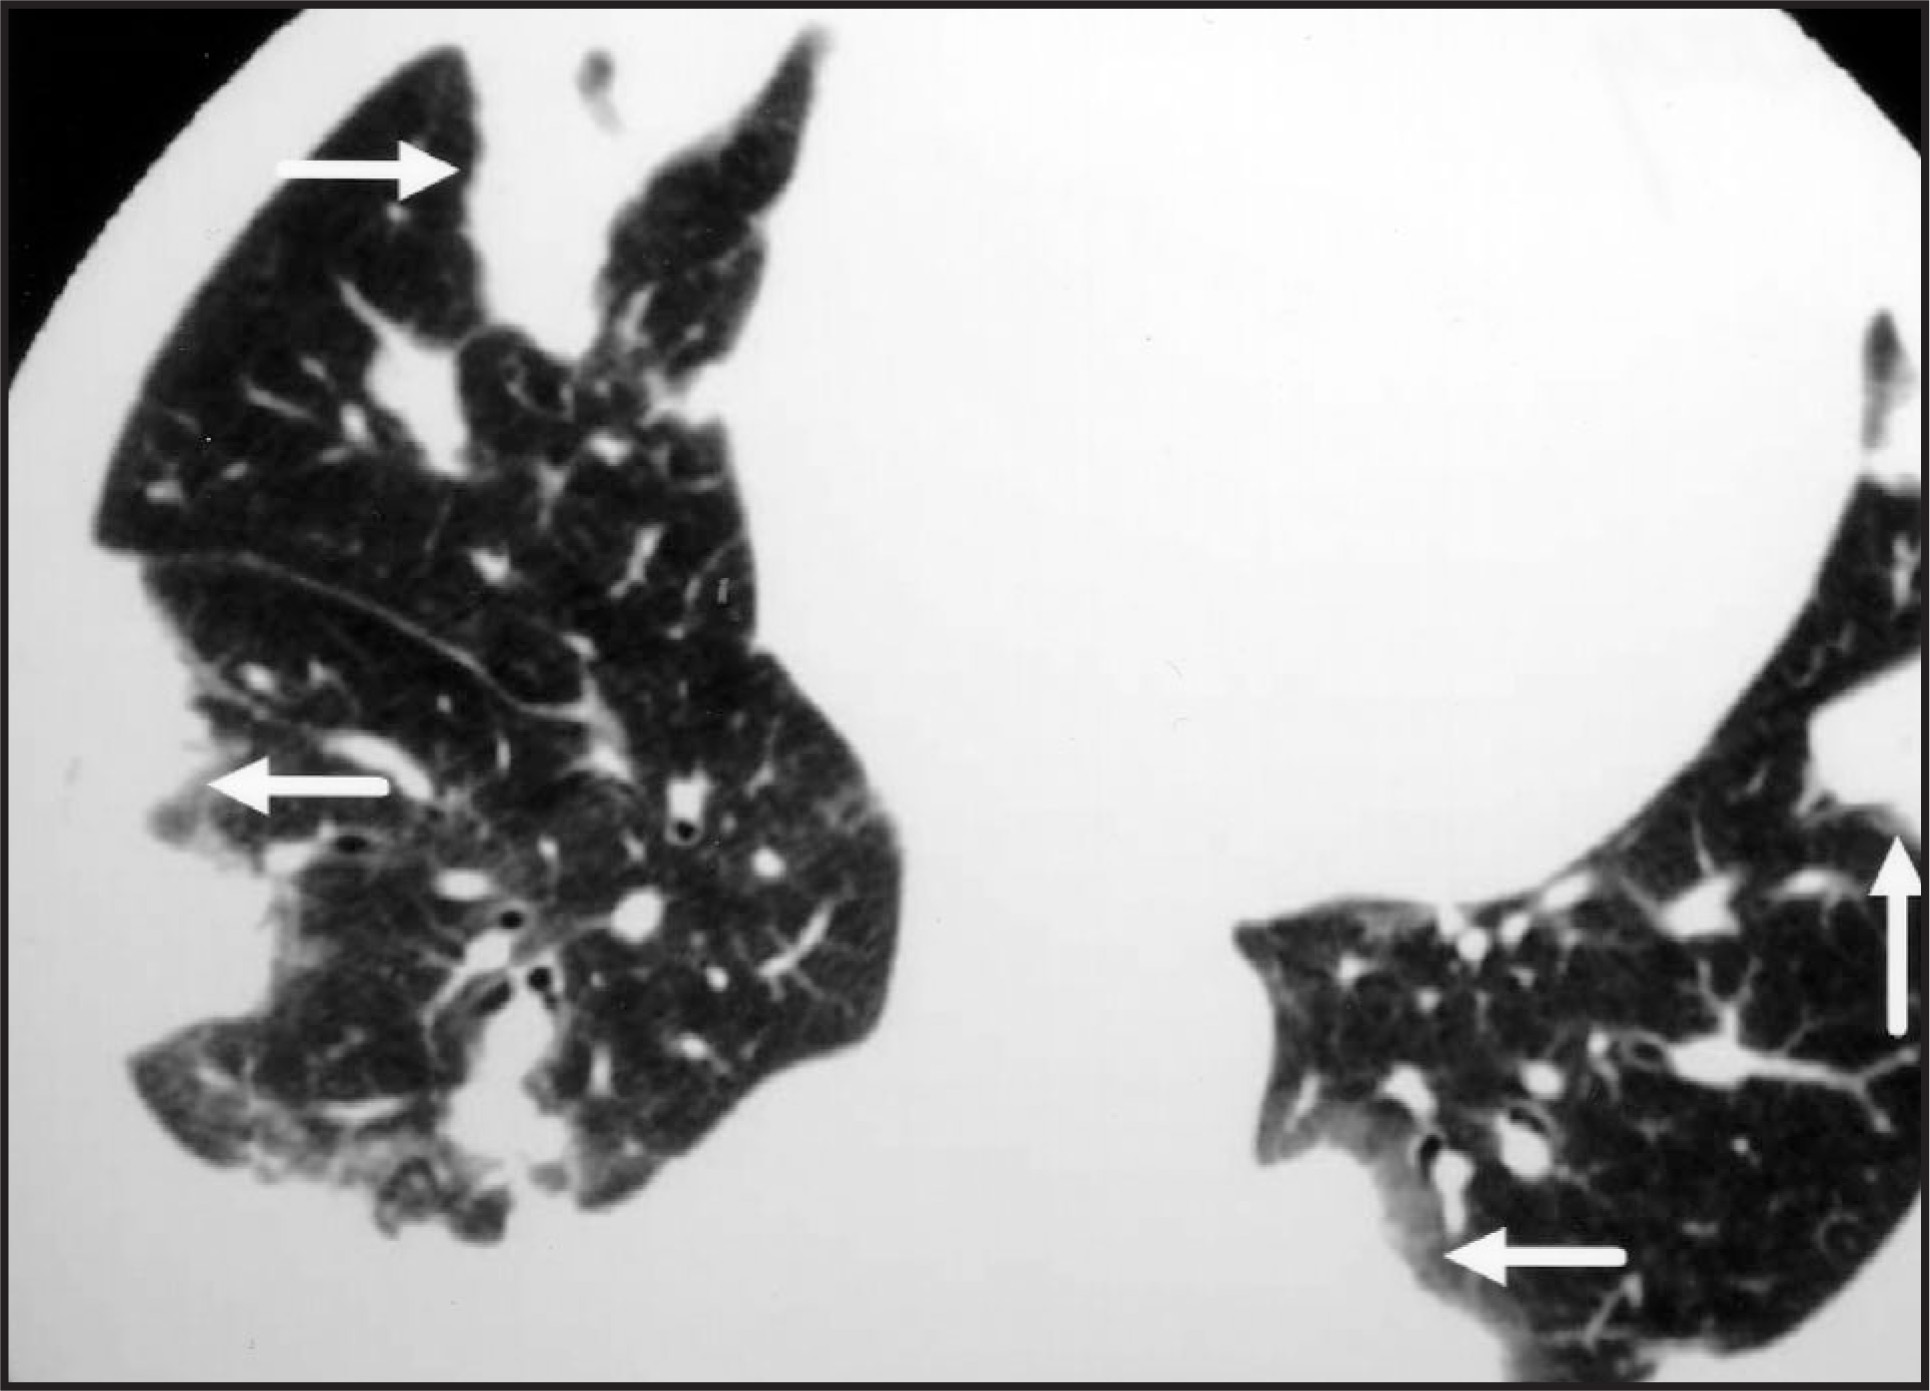
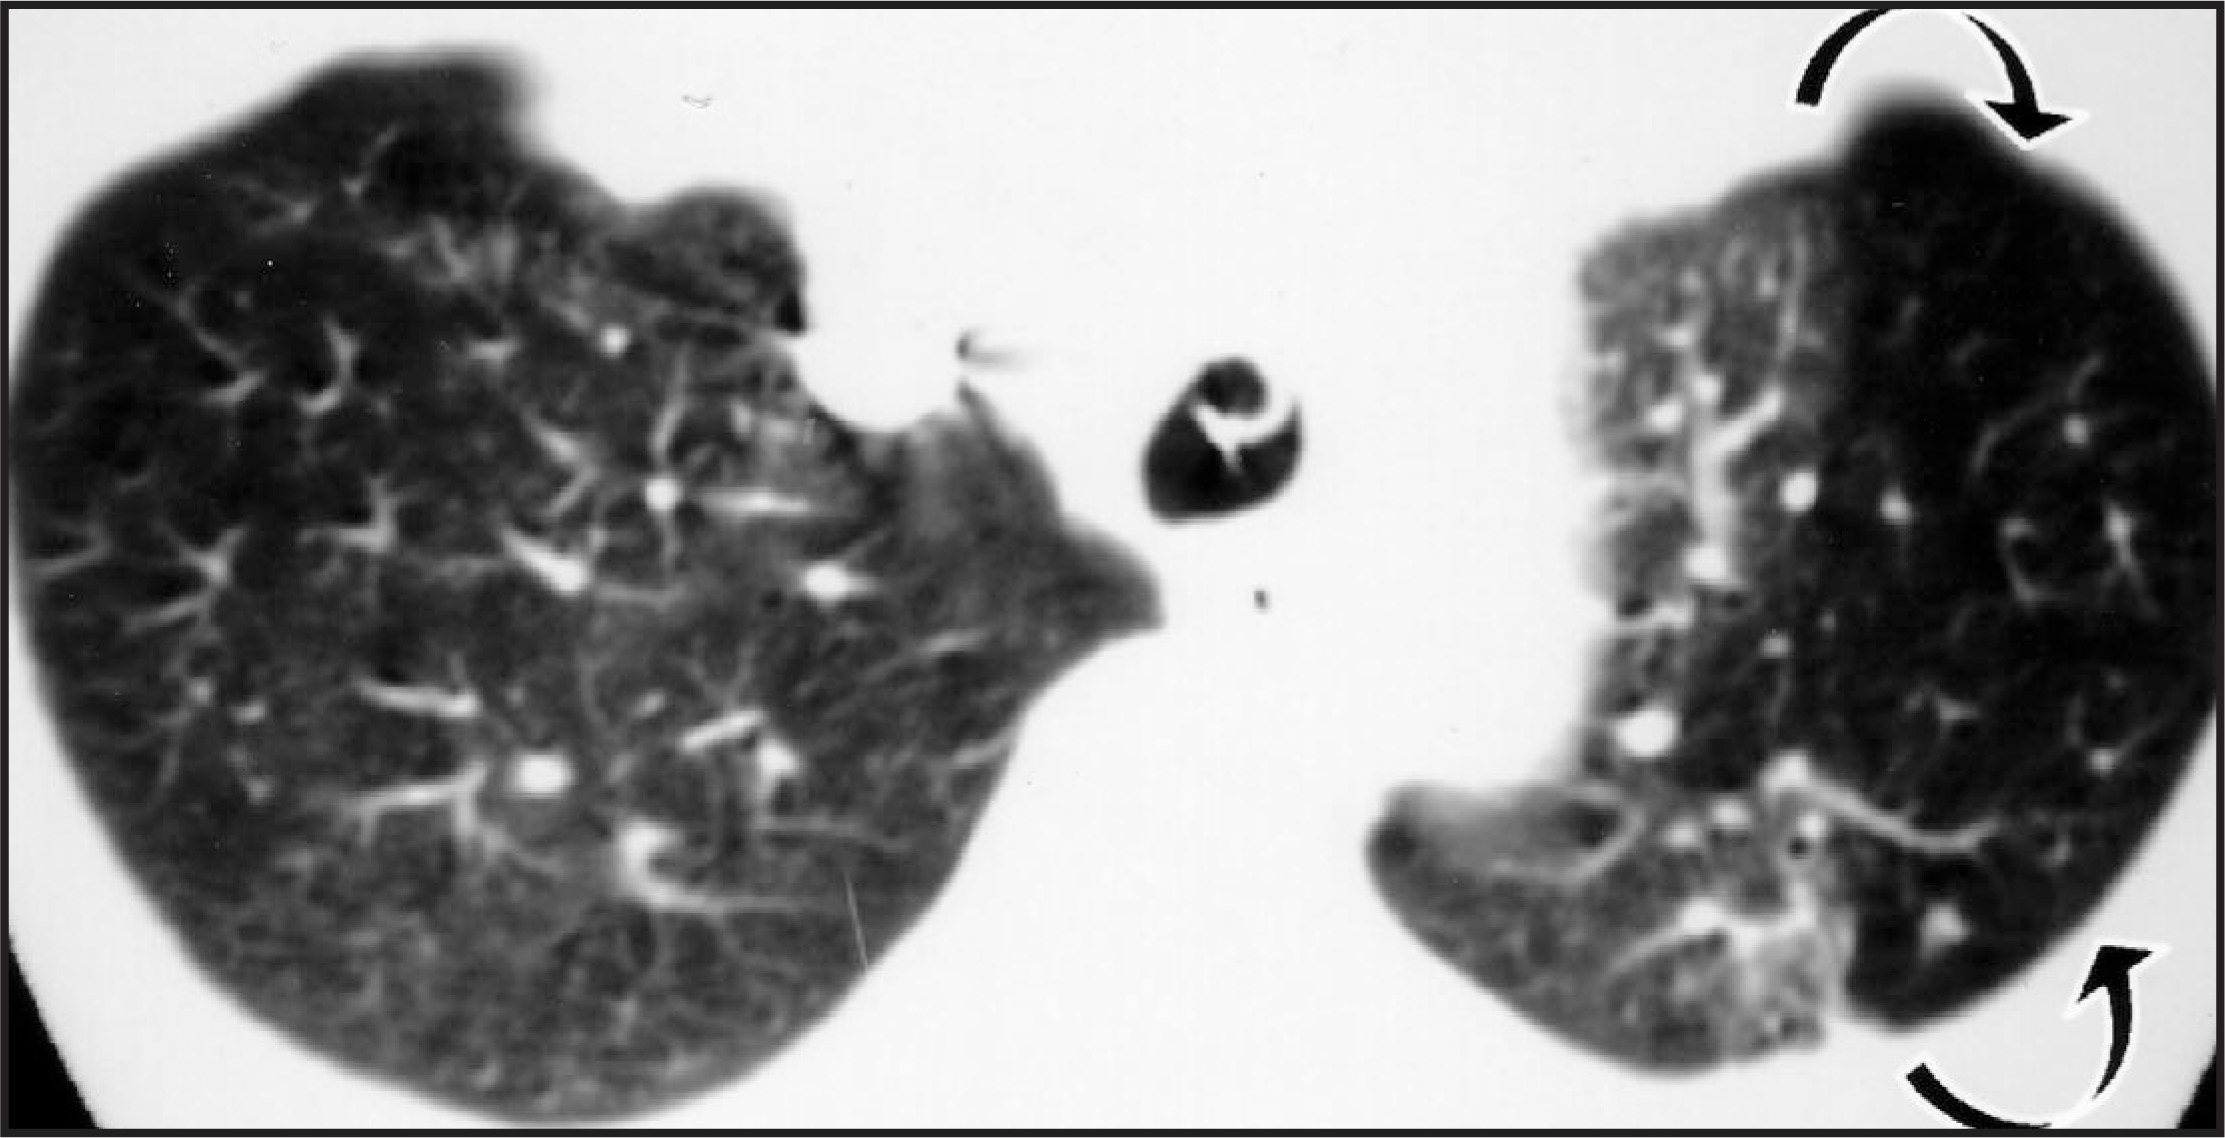
The single most important finding of acute PE on HCTPA studies is an intraluminal filling defect surrounded by contrast (figures 1 and 2).4 Ancillary findings suggestive of acute PE include an expanded, unopacified vessel (figure 3); eccentric filling defects (figure 4); peripheral, wedge-shaped consolidations (figure 5); oligemia (figure 6); and pleural effusion.4,6 However, ancillary findings are not as specific for acute PE as are intraluminal filling defects surrounded by contrast because some ancillary findings may also be seen with chronic PE (eccentric filling defects; peripheral, wedge-shaped consolidations; and oligemia), or are not specific for PE (peripheral, wedge-shaped consolidation; oligemia; and pleural effusion).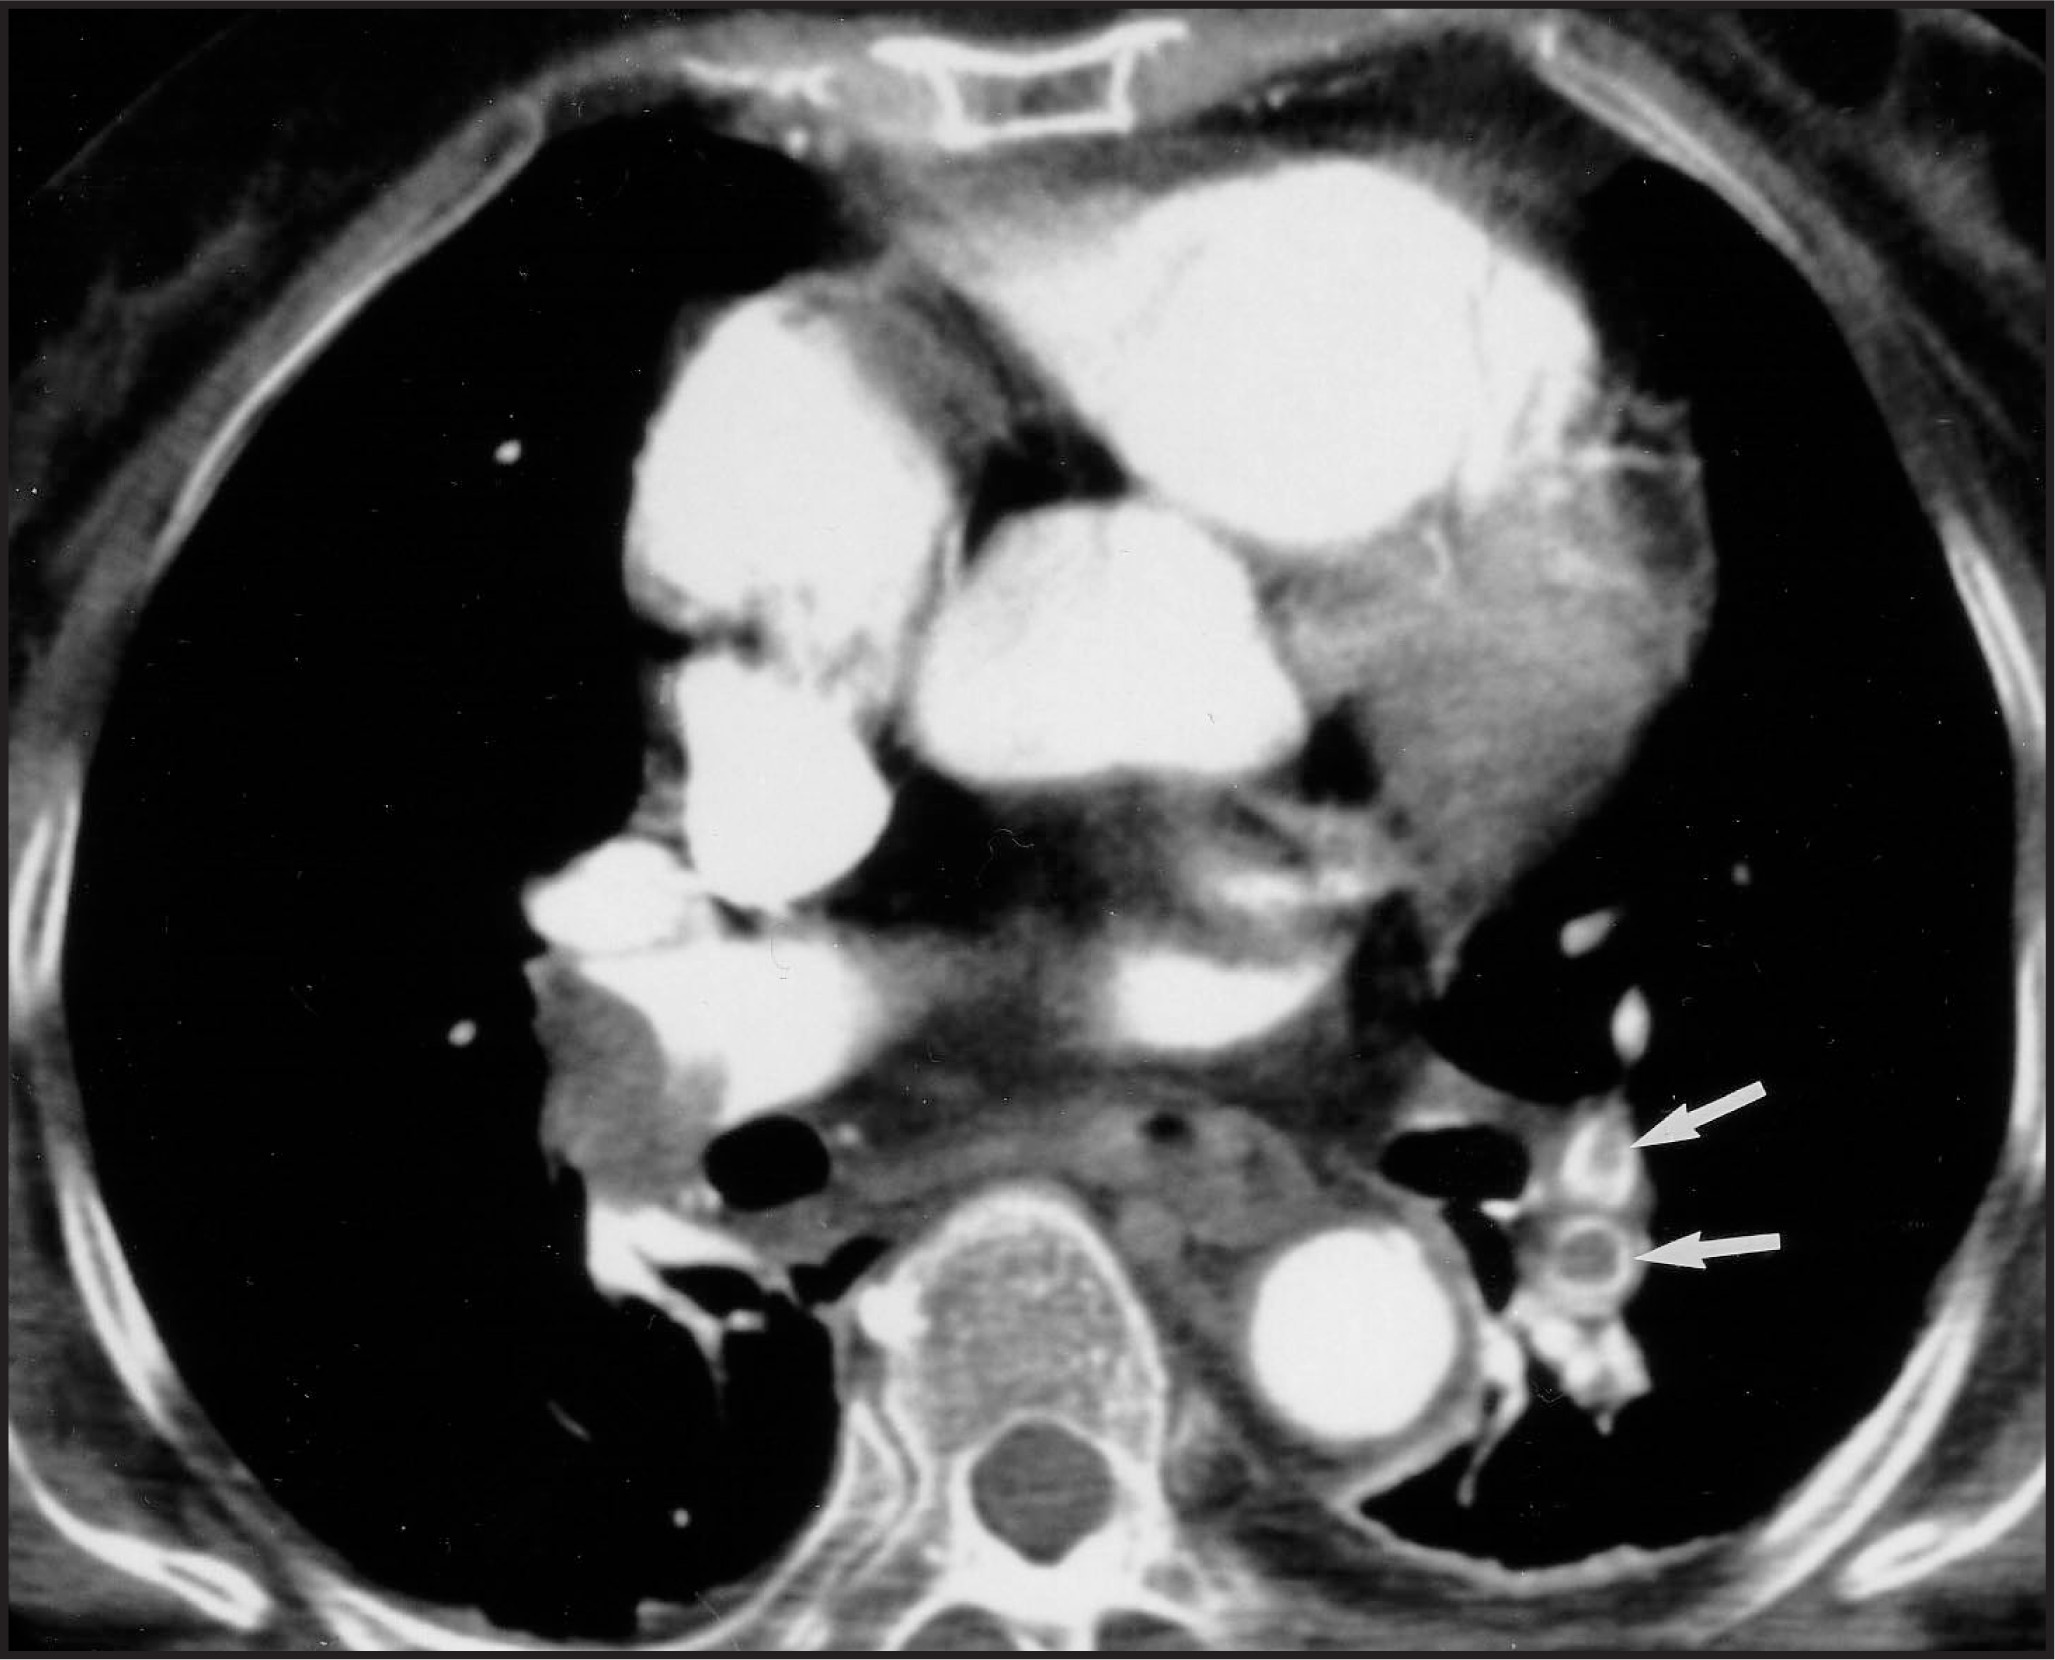
Pitfalls in the HCTPA diagnosis of acute PE
There are several anatomic findings or technical difficulties that may either simulate or obscure the diagnosis of acute PE on HCTPA studies.7-9 Anatomic pitfalls in the HCTPA diagnosis of acute PE include lymph nodes, impacted bronchi, pulmonary veins, pulmonary arterial catheters, and pulmonary artery sarcomas. Technical causes of pitfalls in the diagnosis of acute PE are usually related to respiratory or cardiac motion, poor bolus timing, quantum mottle, and edge-enhancing reconstruction algorithms.
Anatomic pitfalls in the HCTPA diagnosis of acute PE
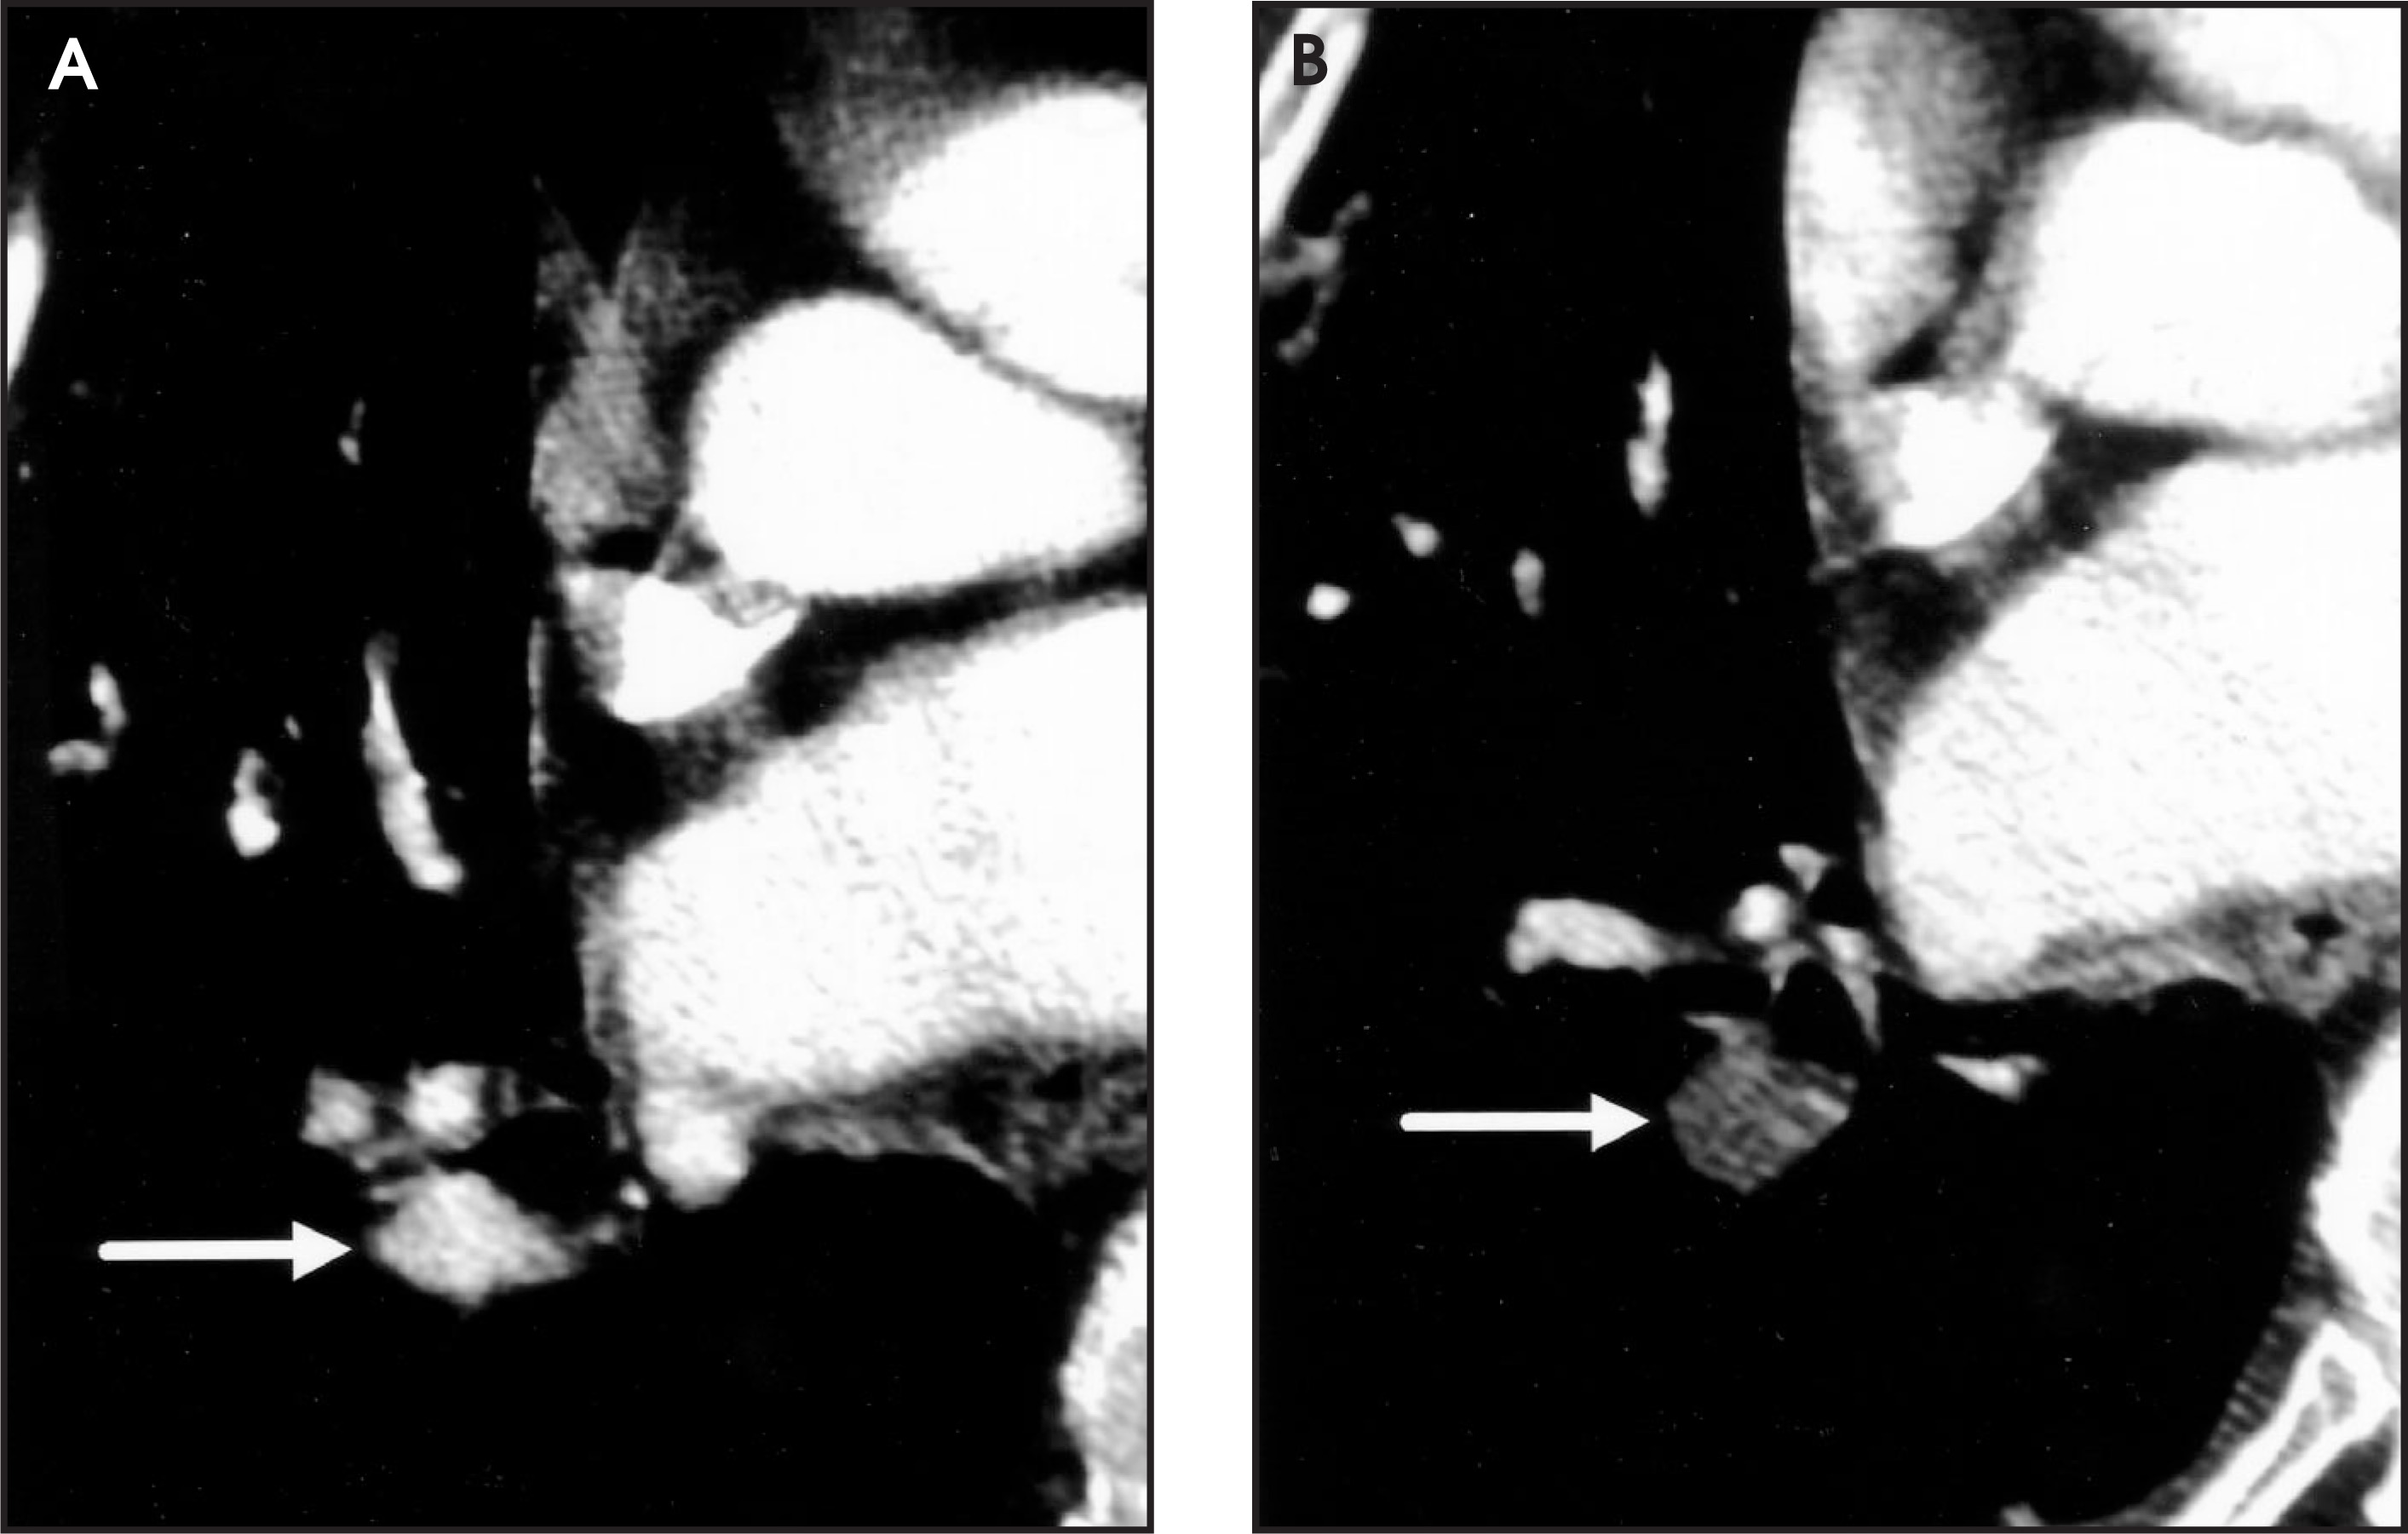
Lymph nodes—Lymph nodes are among the most commonly encountered findings on HCTPA studies that may be mistaken for acute PE. Lymph nodes are extraluminal and tend to form obtuse angles with the adjacent opacified pulmonary arteries. True intraluminal filling defects, such as acute PE, will form acute angles with the opacified arterial blood pool8 (figure 7). Knowledge of the normal locations of intrathoracic lymph nodes is essential for avoiding this pitfall. Lymph nodes typically reside lateral to the adjacent pulmonary arteries in the upper lobes, whereas they are usually medial to the adjacent pulmonary arteries in the lower lobes.10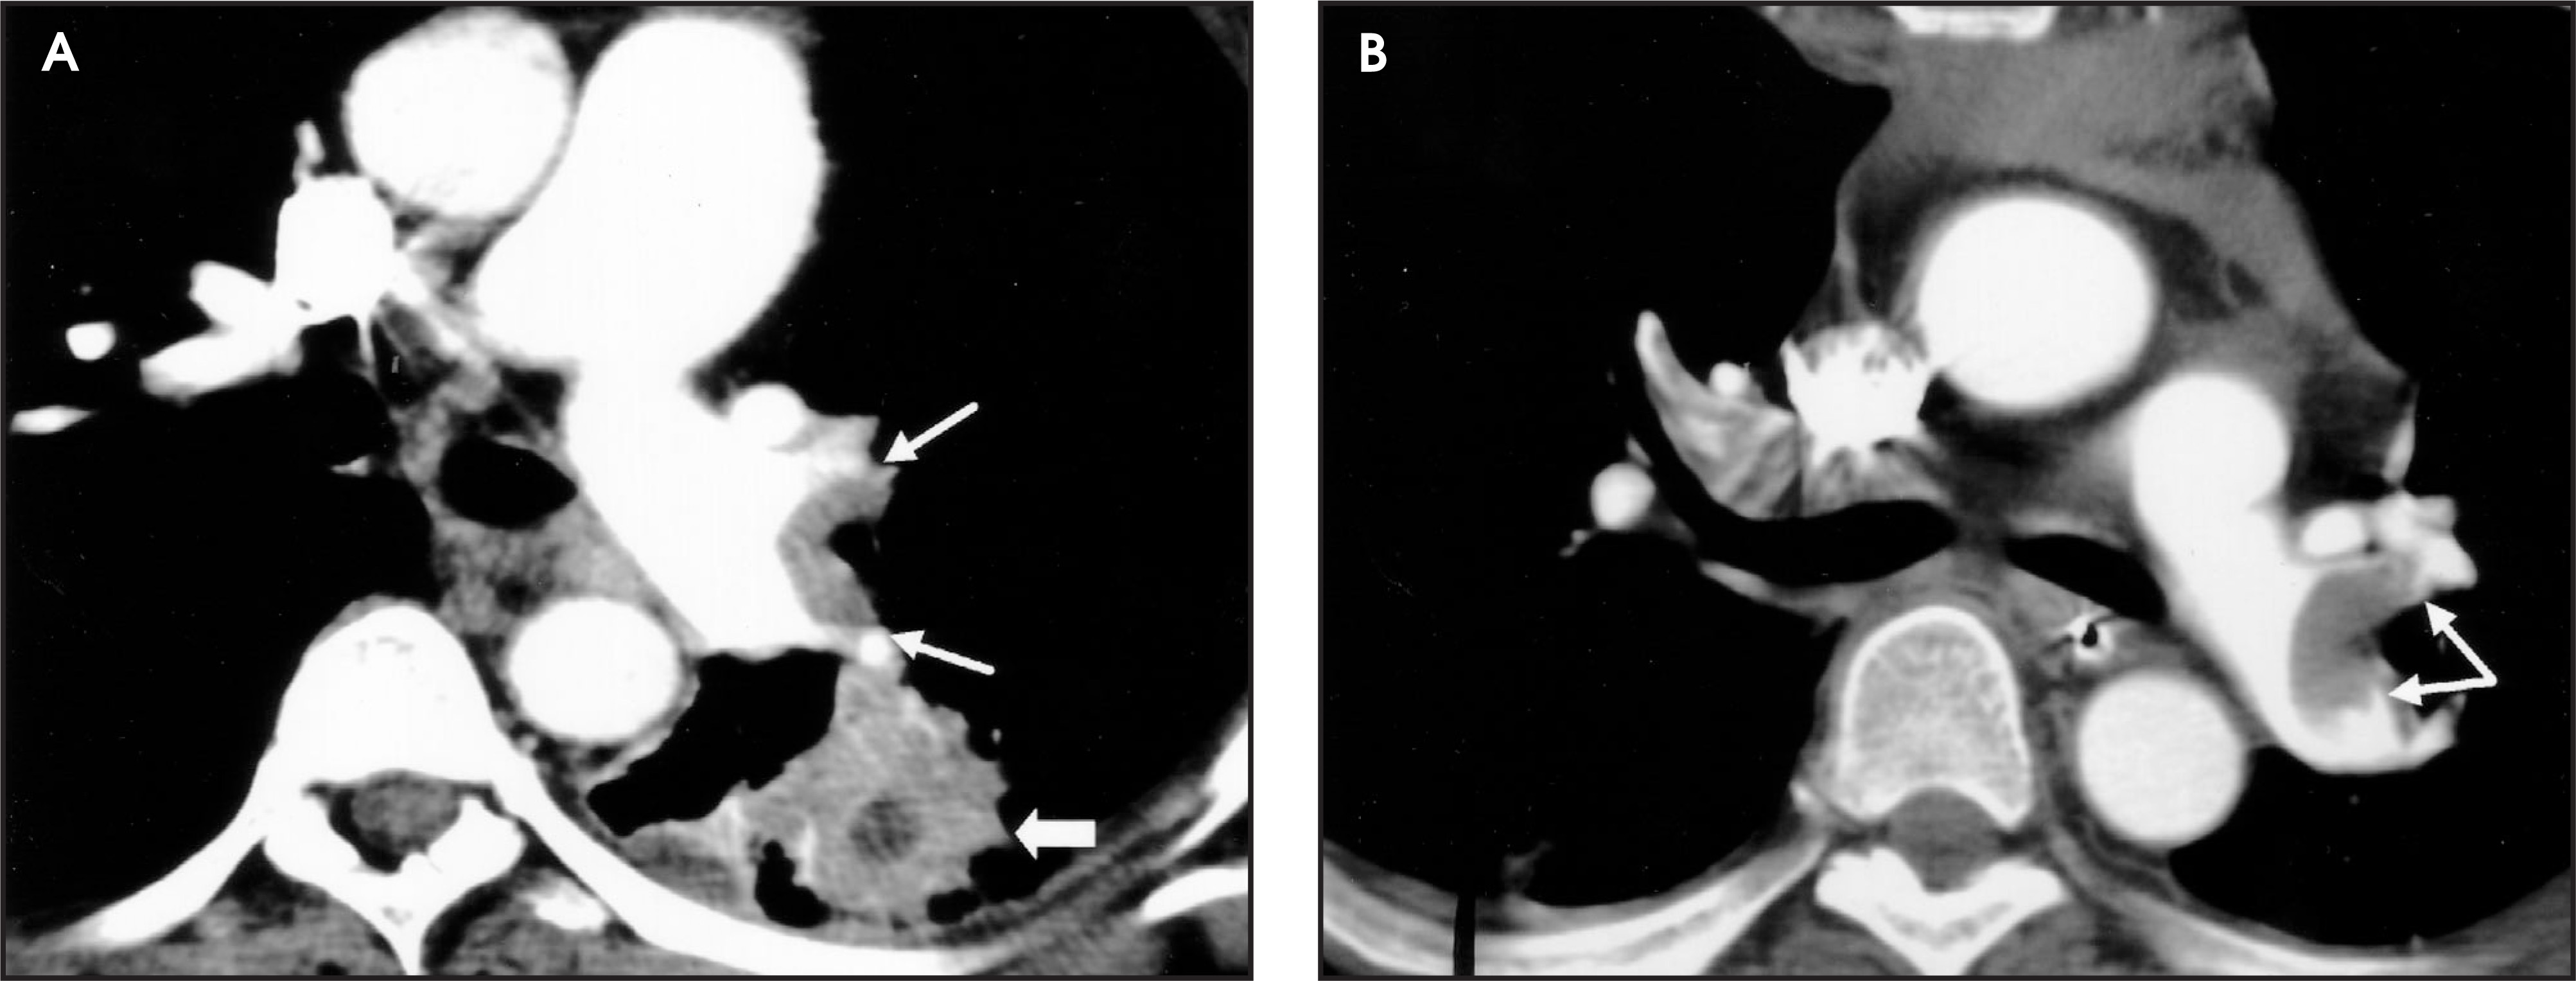
Impacted bronchi—Mucous impacted within bronchi may create the appearance of intraluminal filling defects, particularly when the bronchial walls are calcified. The absence of air-filled bronchi when the images are reviewed in lung windows assists in demonstrating the true nature of the abnormality (figure 8).8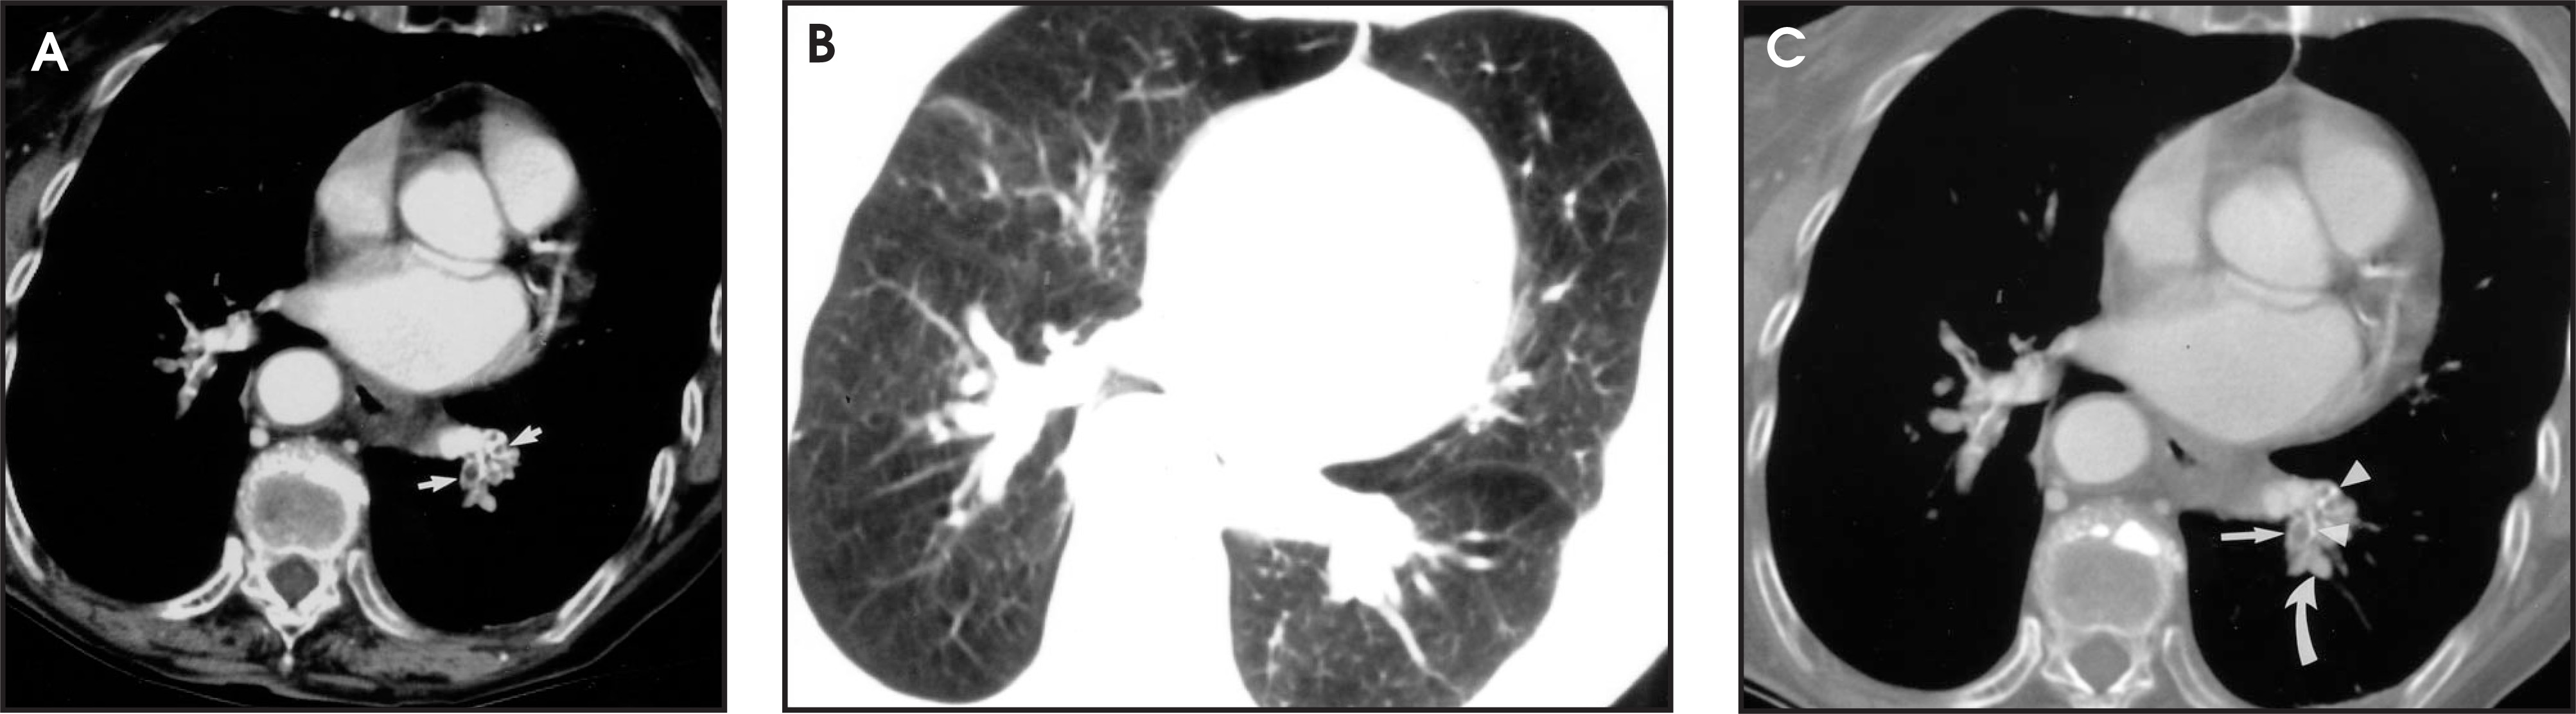
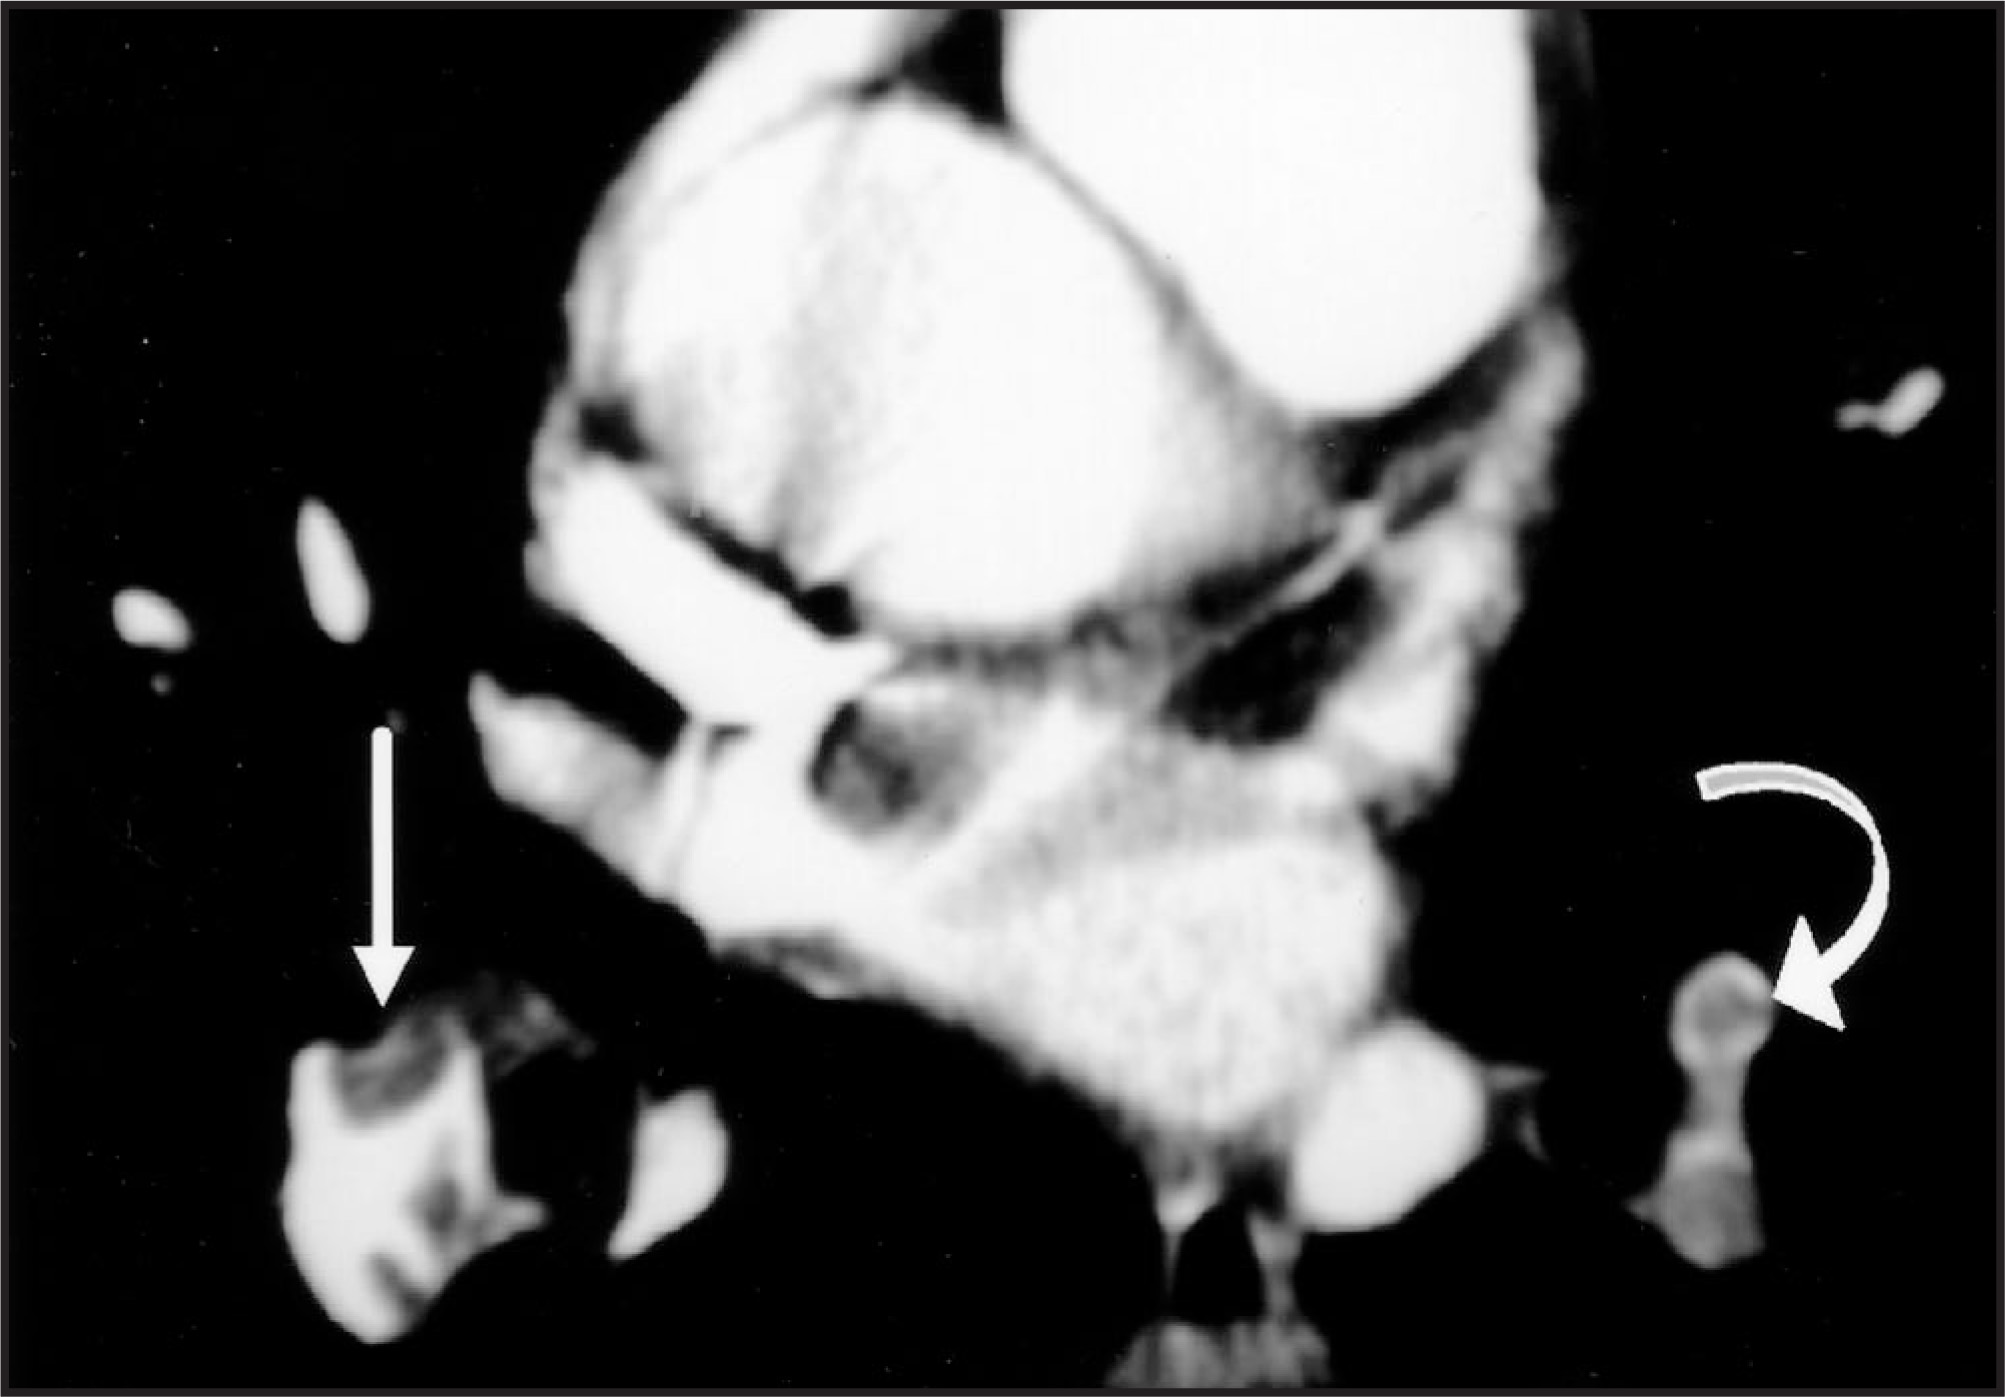
Pulmonary veins—Apparent filling defects within pulmonary veins can simulate the presence of acute PE. One may simply follow the vessel in question into the left atrium to identify the true nature of the abnormality. For more peripherally located apparent filling defects, it is helpful to remember that pulmonary arteries and bronchi course together, whereas veins run independently. If the vessel in question is unaccompanied by a bronchus when the images are reviewed in lung windows, it is a pulmonary vein rather than an artery (figure 9).8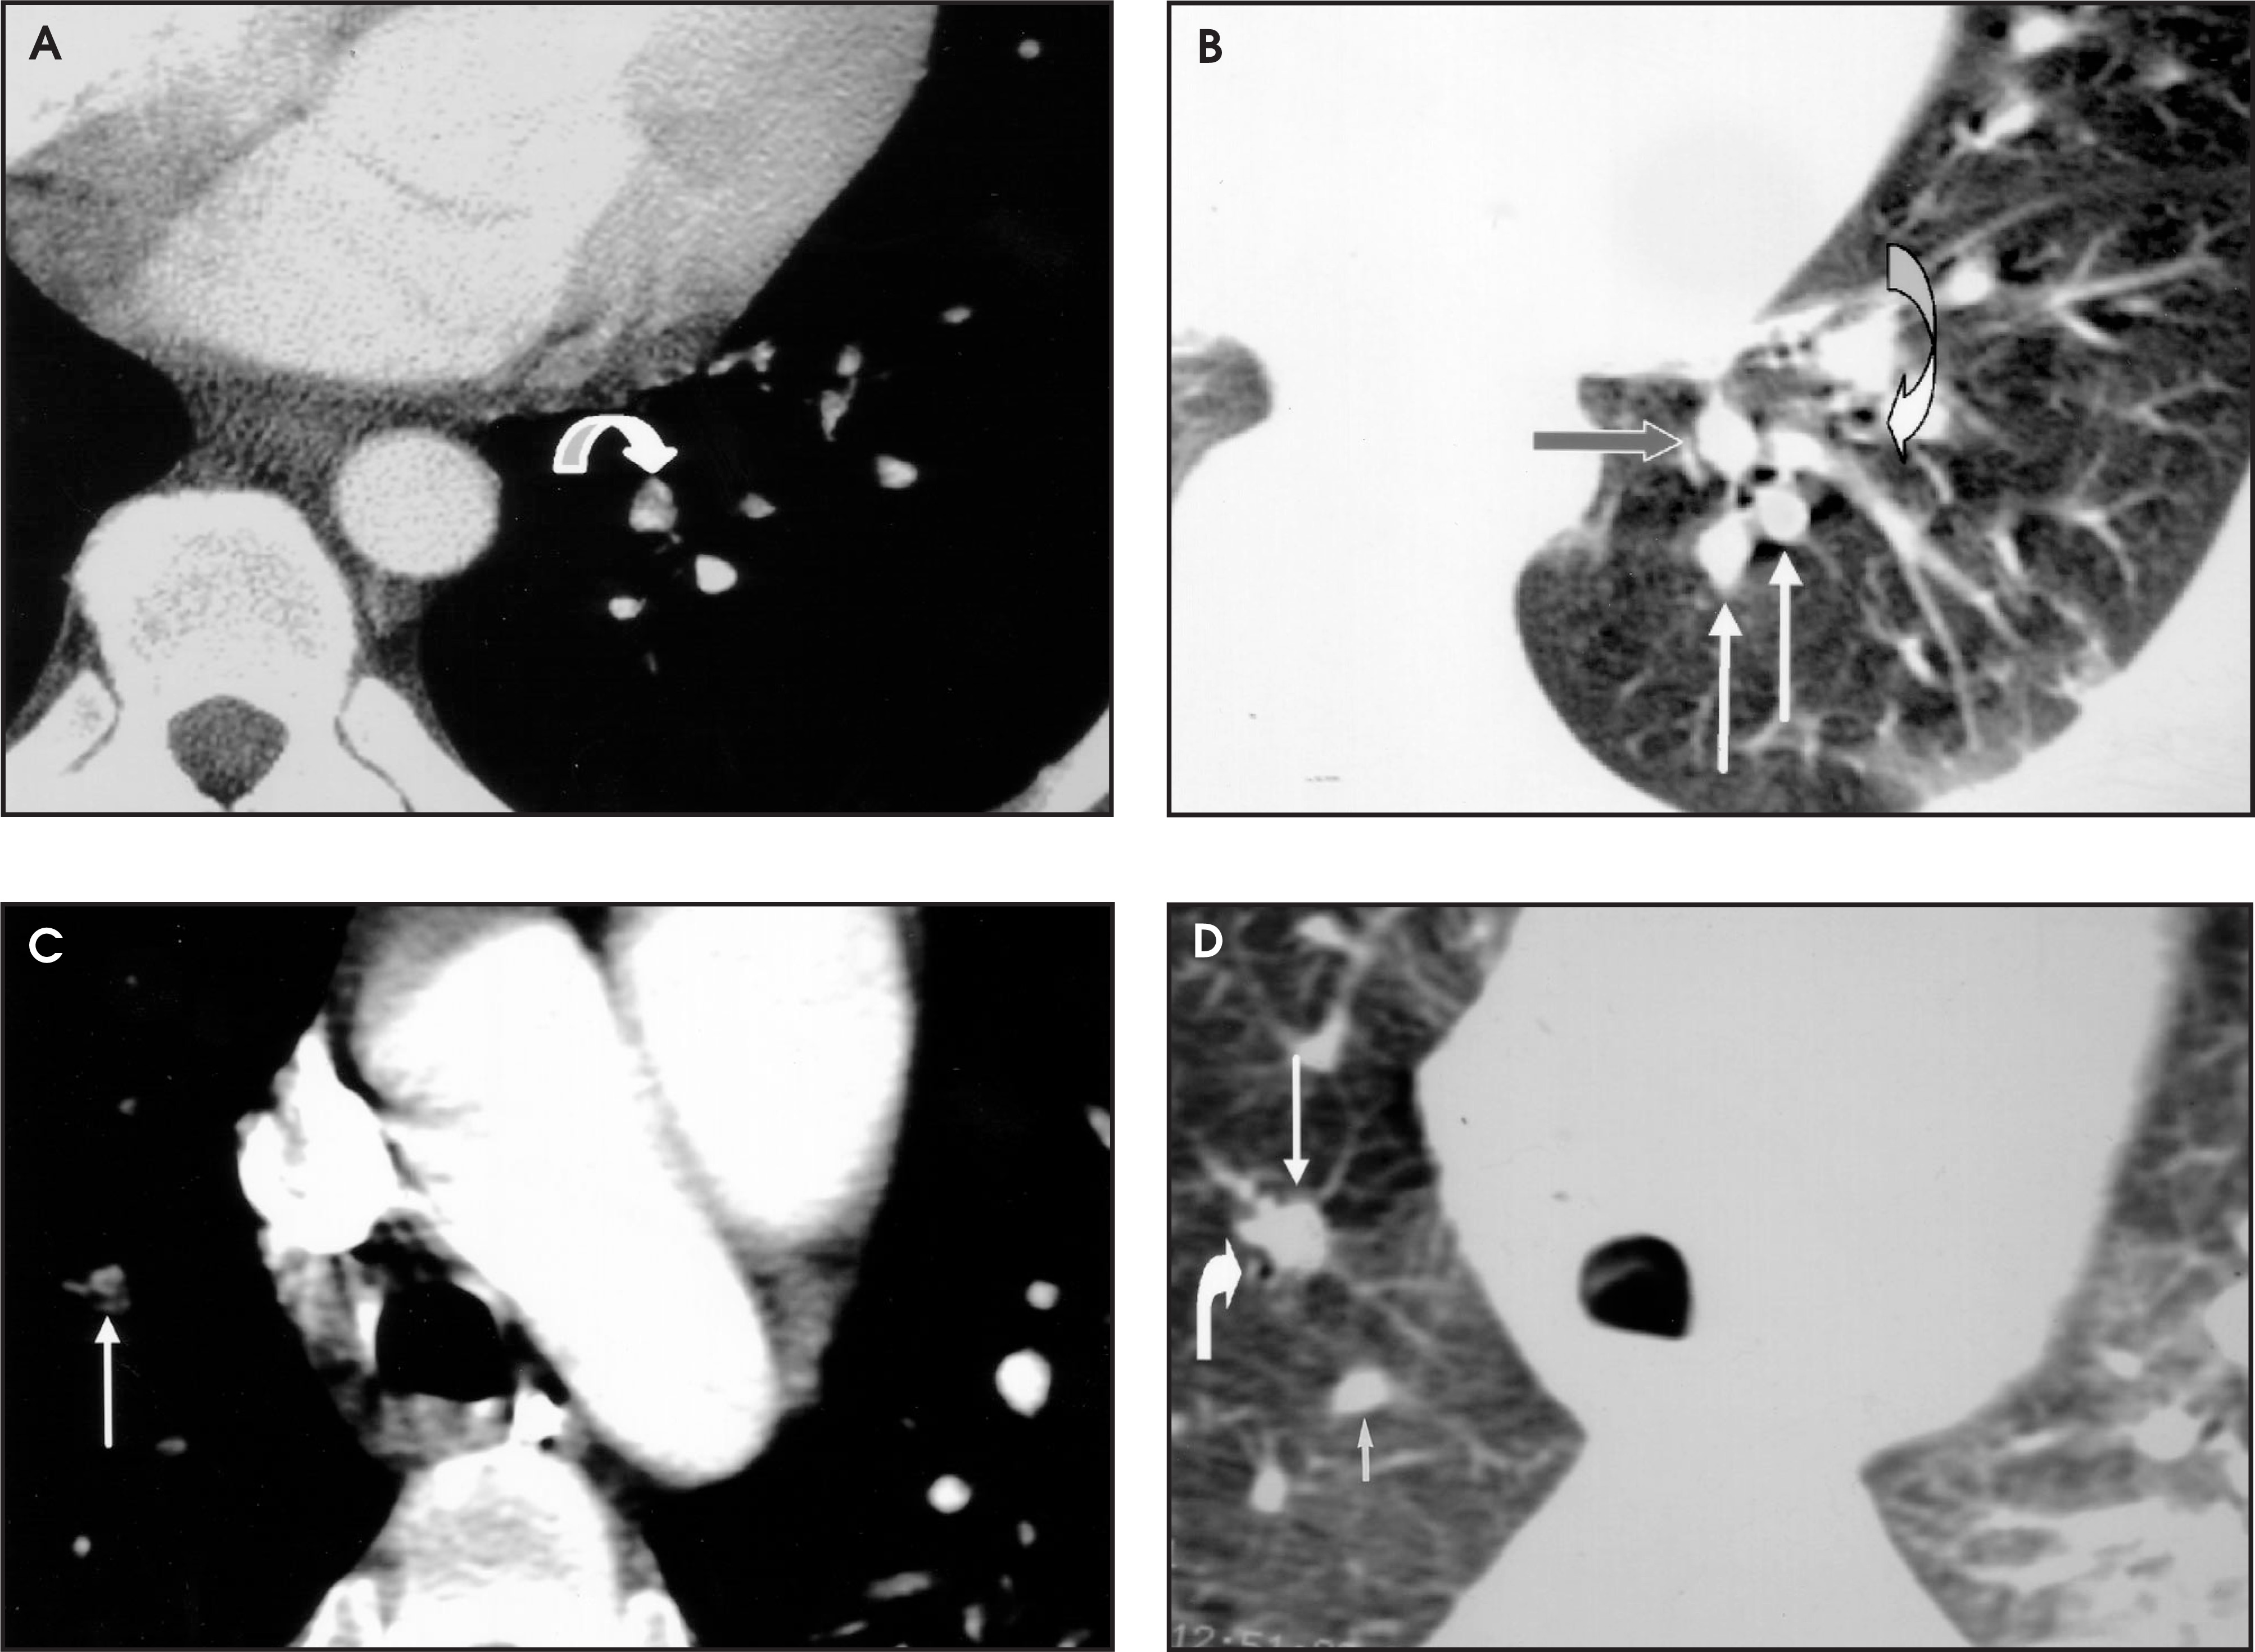
Pulmonary artery catheters—Pulmonary arterial catheter tips may create small filling defects within the arteries simulating PE. Usually the relationship of the catheter to the filling defect is obvious, although the catheter itself may not be seen if the contrast bolus is bright. Examination of the patient, consultation with the referring physician, or a review of the scout image should clarify the situation.8
Pulmonary artery sarcoma —Pulmonary artery sarcomas are rare primary neoplasms that may closely simulate PE.8 Subtle enhancement of the filling defect itself and ipsilateral lung nodules may be a clue to the correct diagnosis, although often the true nature of the abnormality is not discovered until surgery (figure 10).11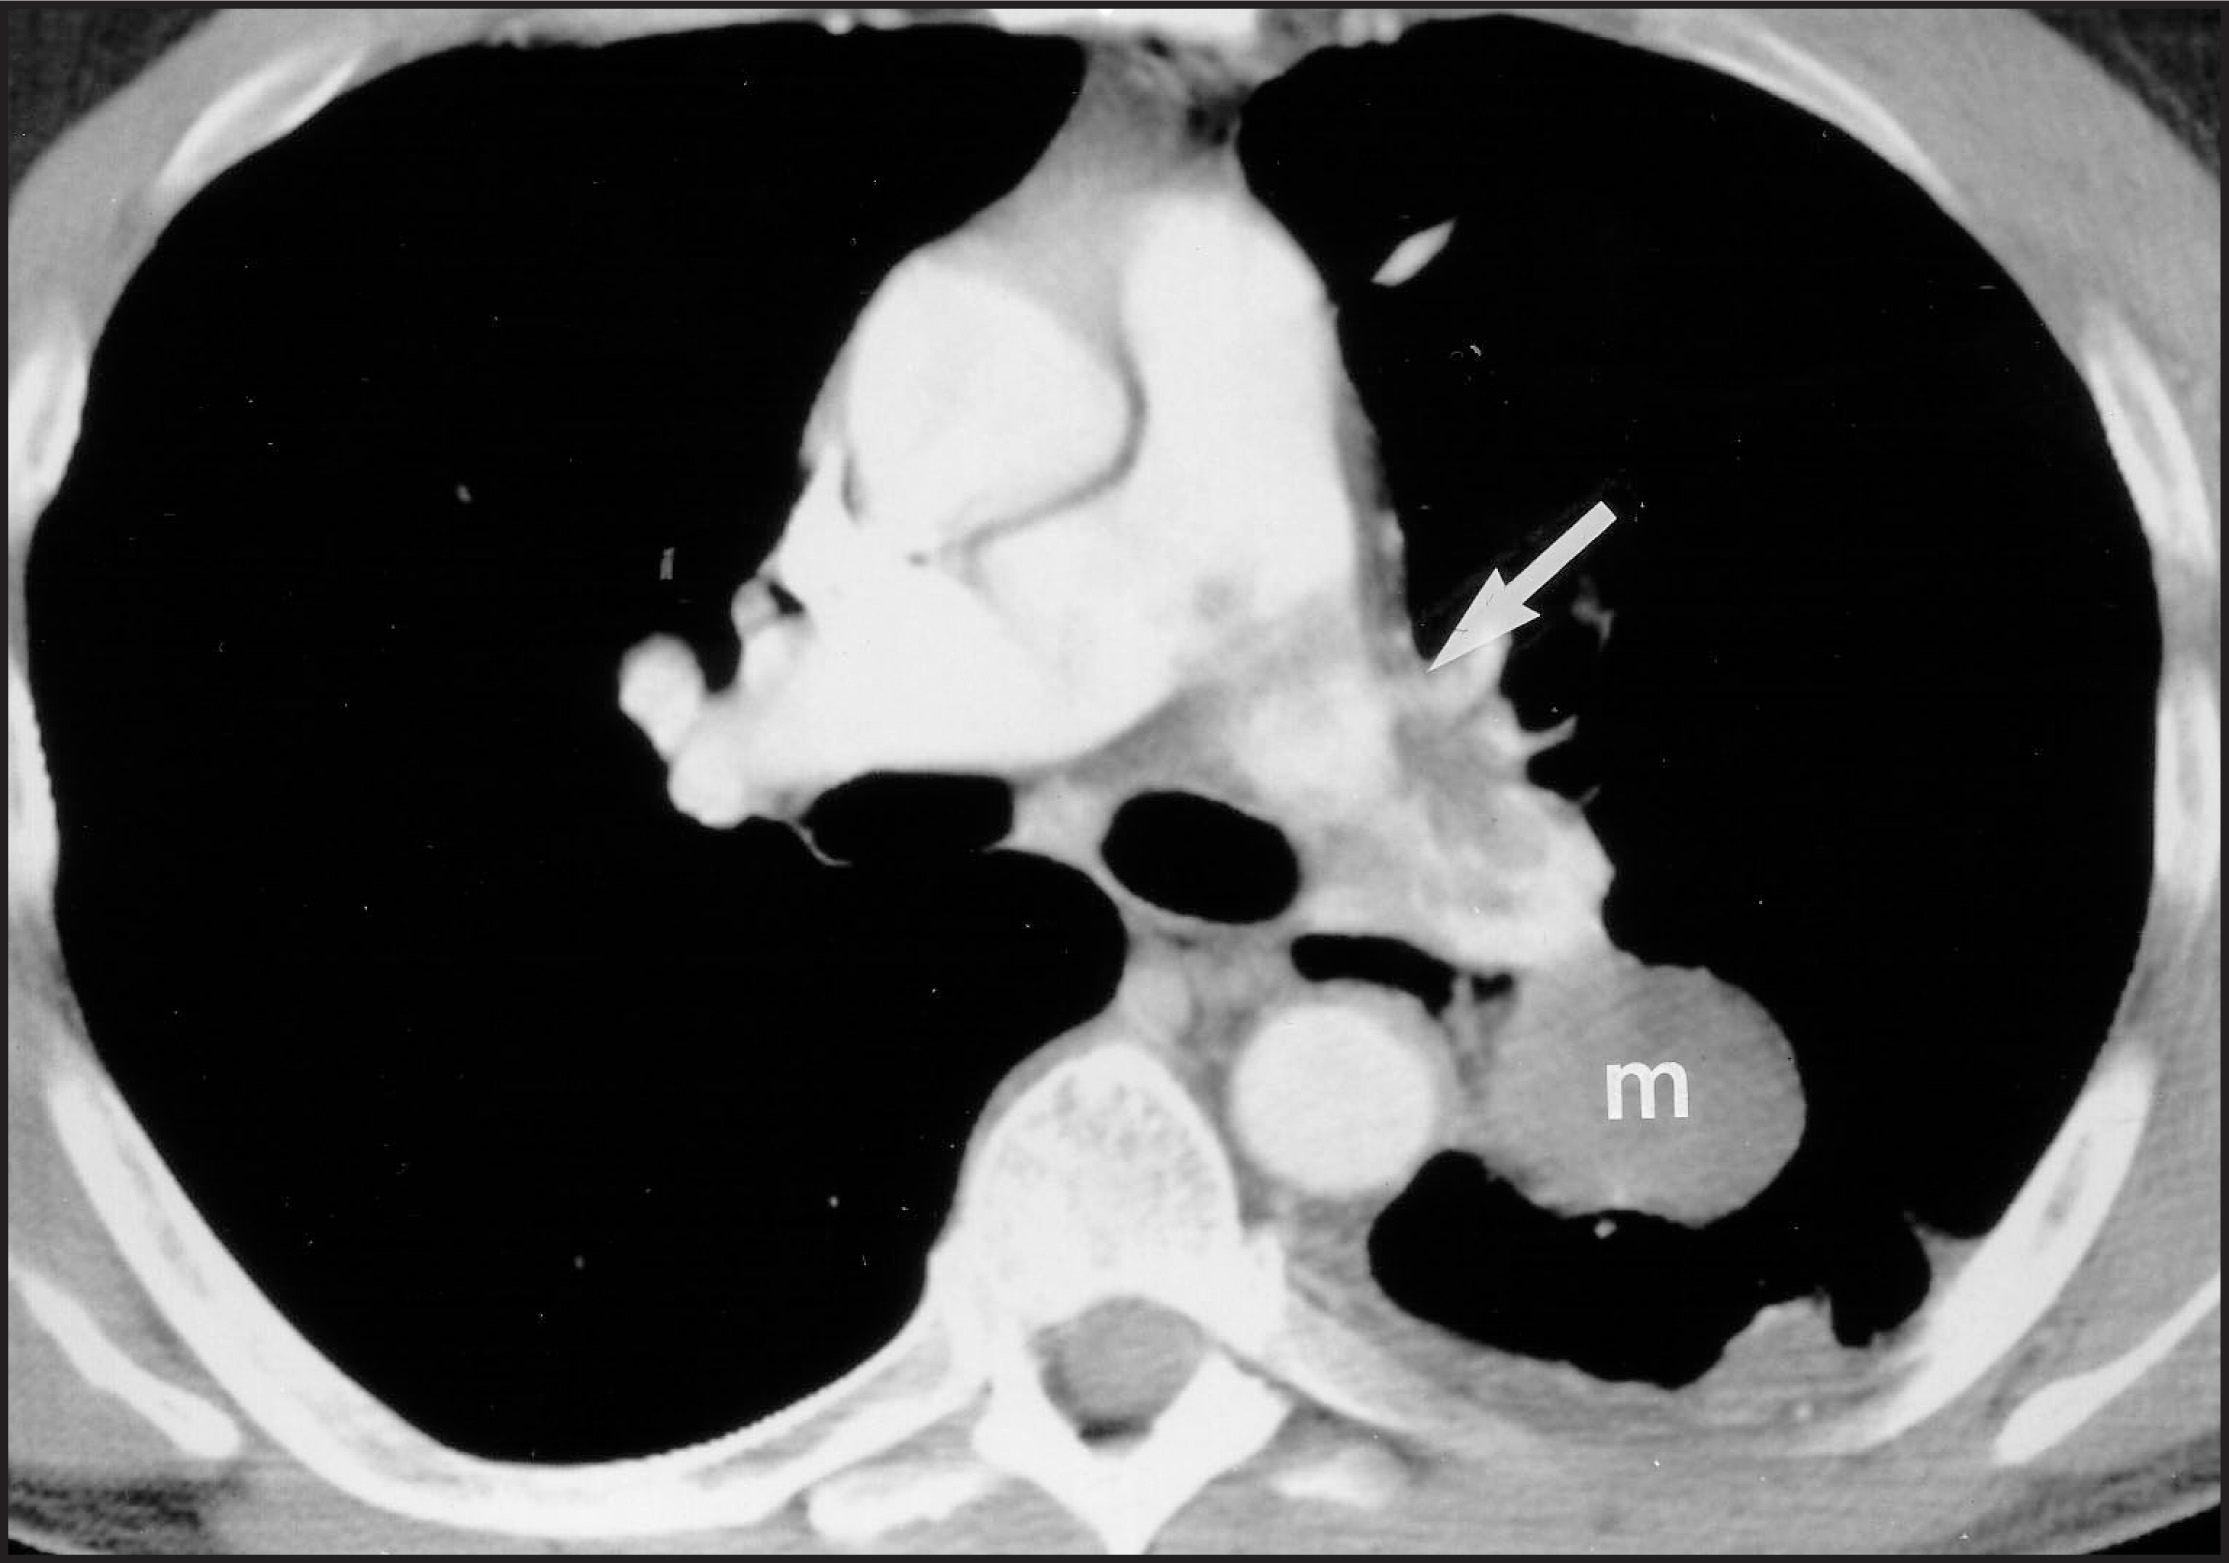
Technical pitfalls in the HCTPA diagnosis of acute PE
Respiratory motion—Respiratory motion is the most problematic technical difficulty encountered with HCTPA imaging. Respiratory motion may obscure an embolism (figure 11), and may also cause an apparent decrease in arterial opacification, simulating the presence of acute PE. Although shallow breathing during the scan is not usually problematic, every effort should be made to suspend respiration completely to optimize study quality.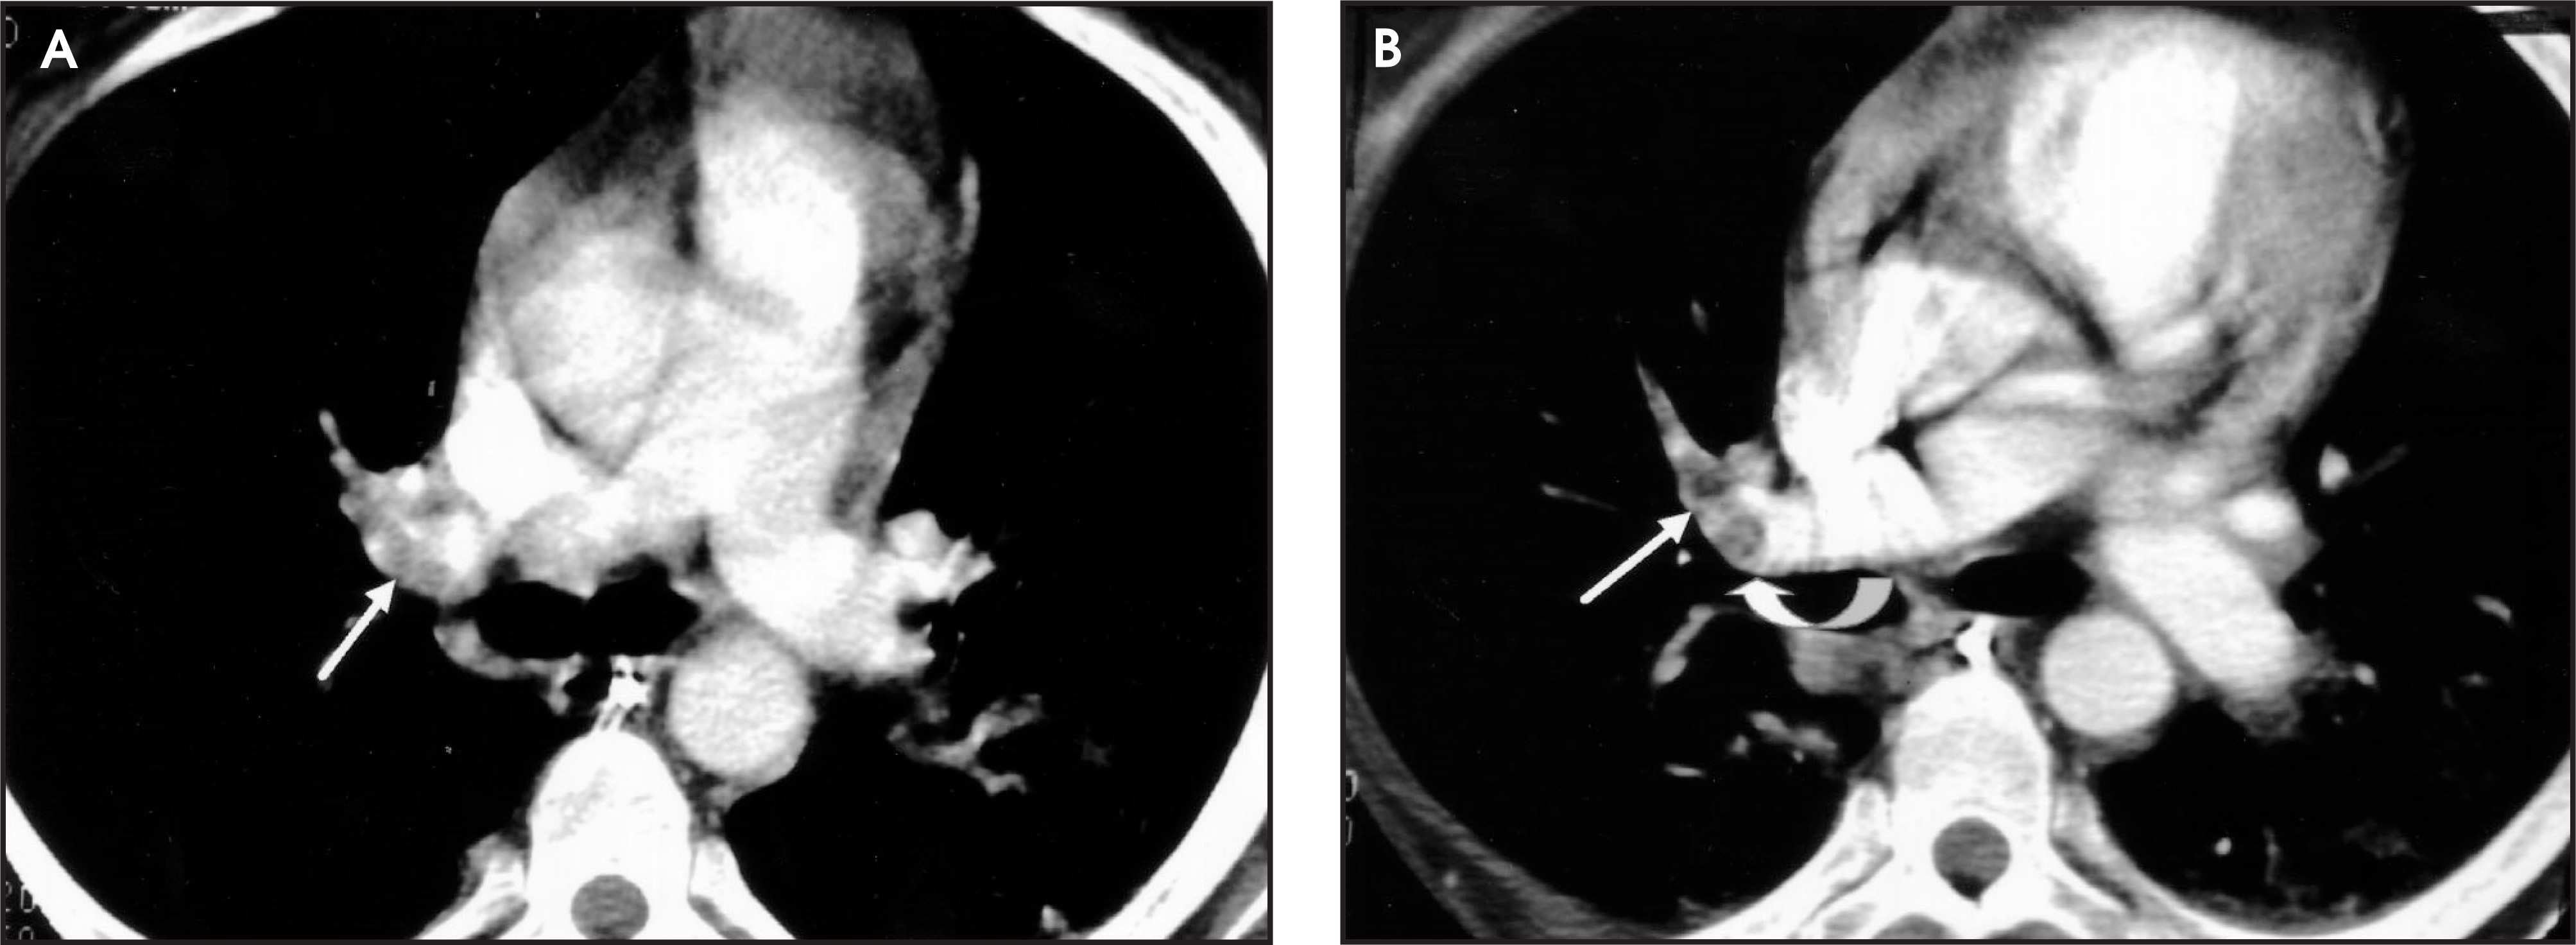
Cardiac motion—Cardiac motion is usually less of a problem than respiratory motion. Cardiac motion may result in a ghosting artifact, which is usually readily recognizable.
Improper bolus timing—The use of bolus-timing software usually results in a properly timed study. If the contrast bolus arrives too early or too late, an embolus may not be seen easily. If the bolus timing is improper, a diligent search for the cause of the suboptimal timing should be undertaken and the study may be repeated after the difficulties are corrected (figure 12).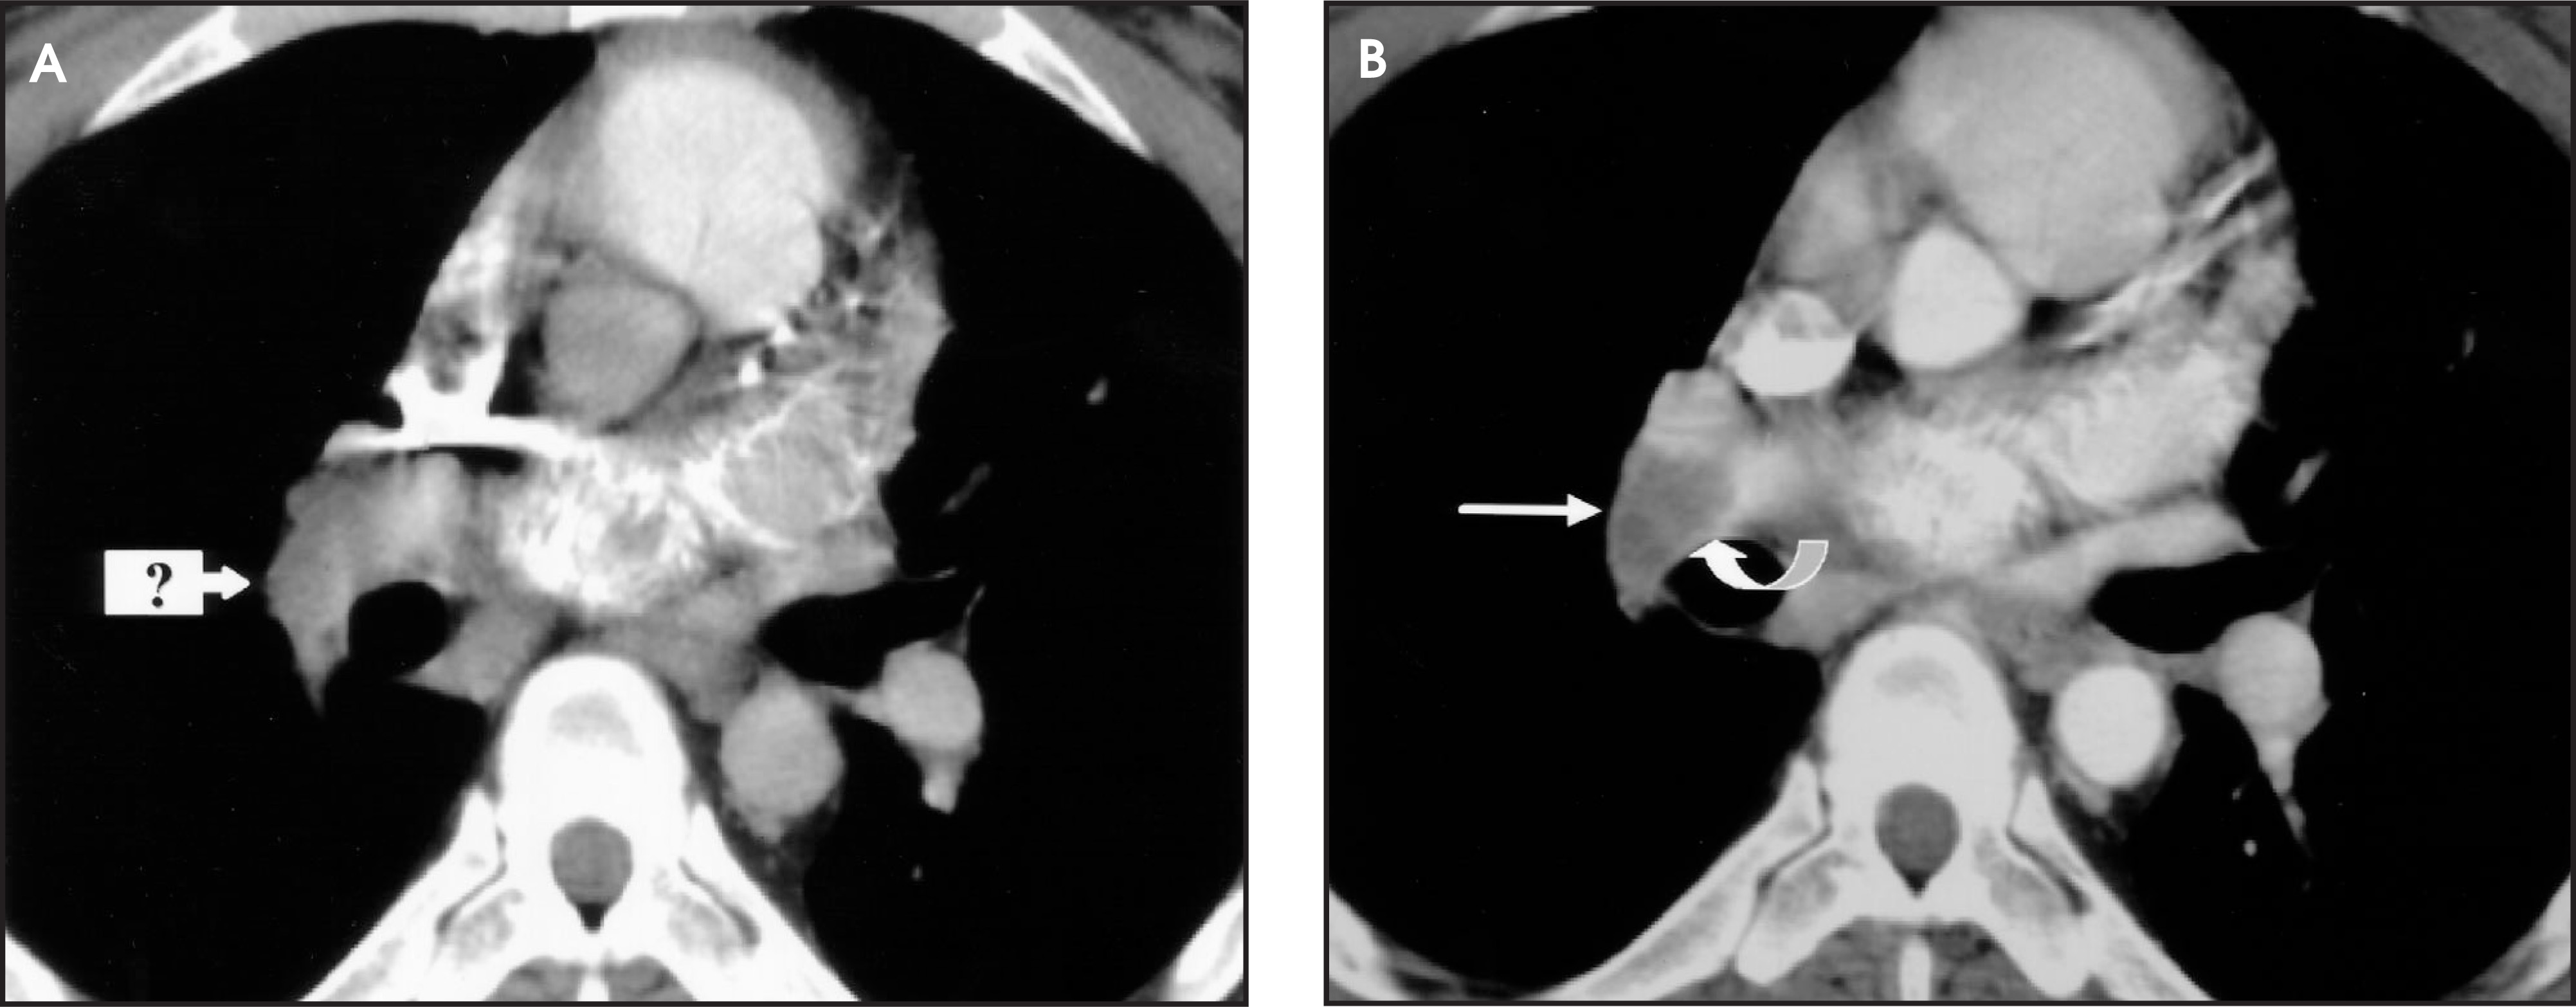
Quantum mottle—Quantum mottle, or image noise, may result in unsatisfactory study quality. Mottle is more likely to be encountered if the FOV is small and if the collimation is very thin (as with MDCT). To reduce mottle, the FOV should be set properly, and the mA must be increased appropriately, although these maneuvers obviously come at the expense of increased radiation dose (figure 13).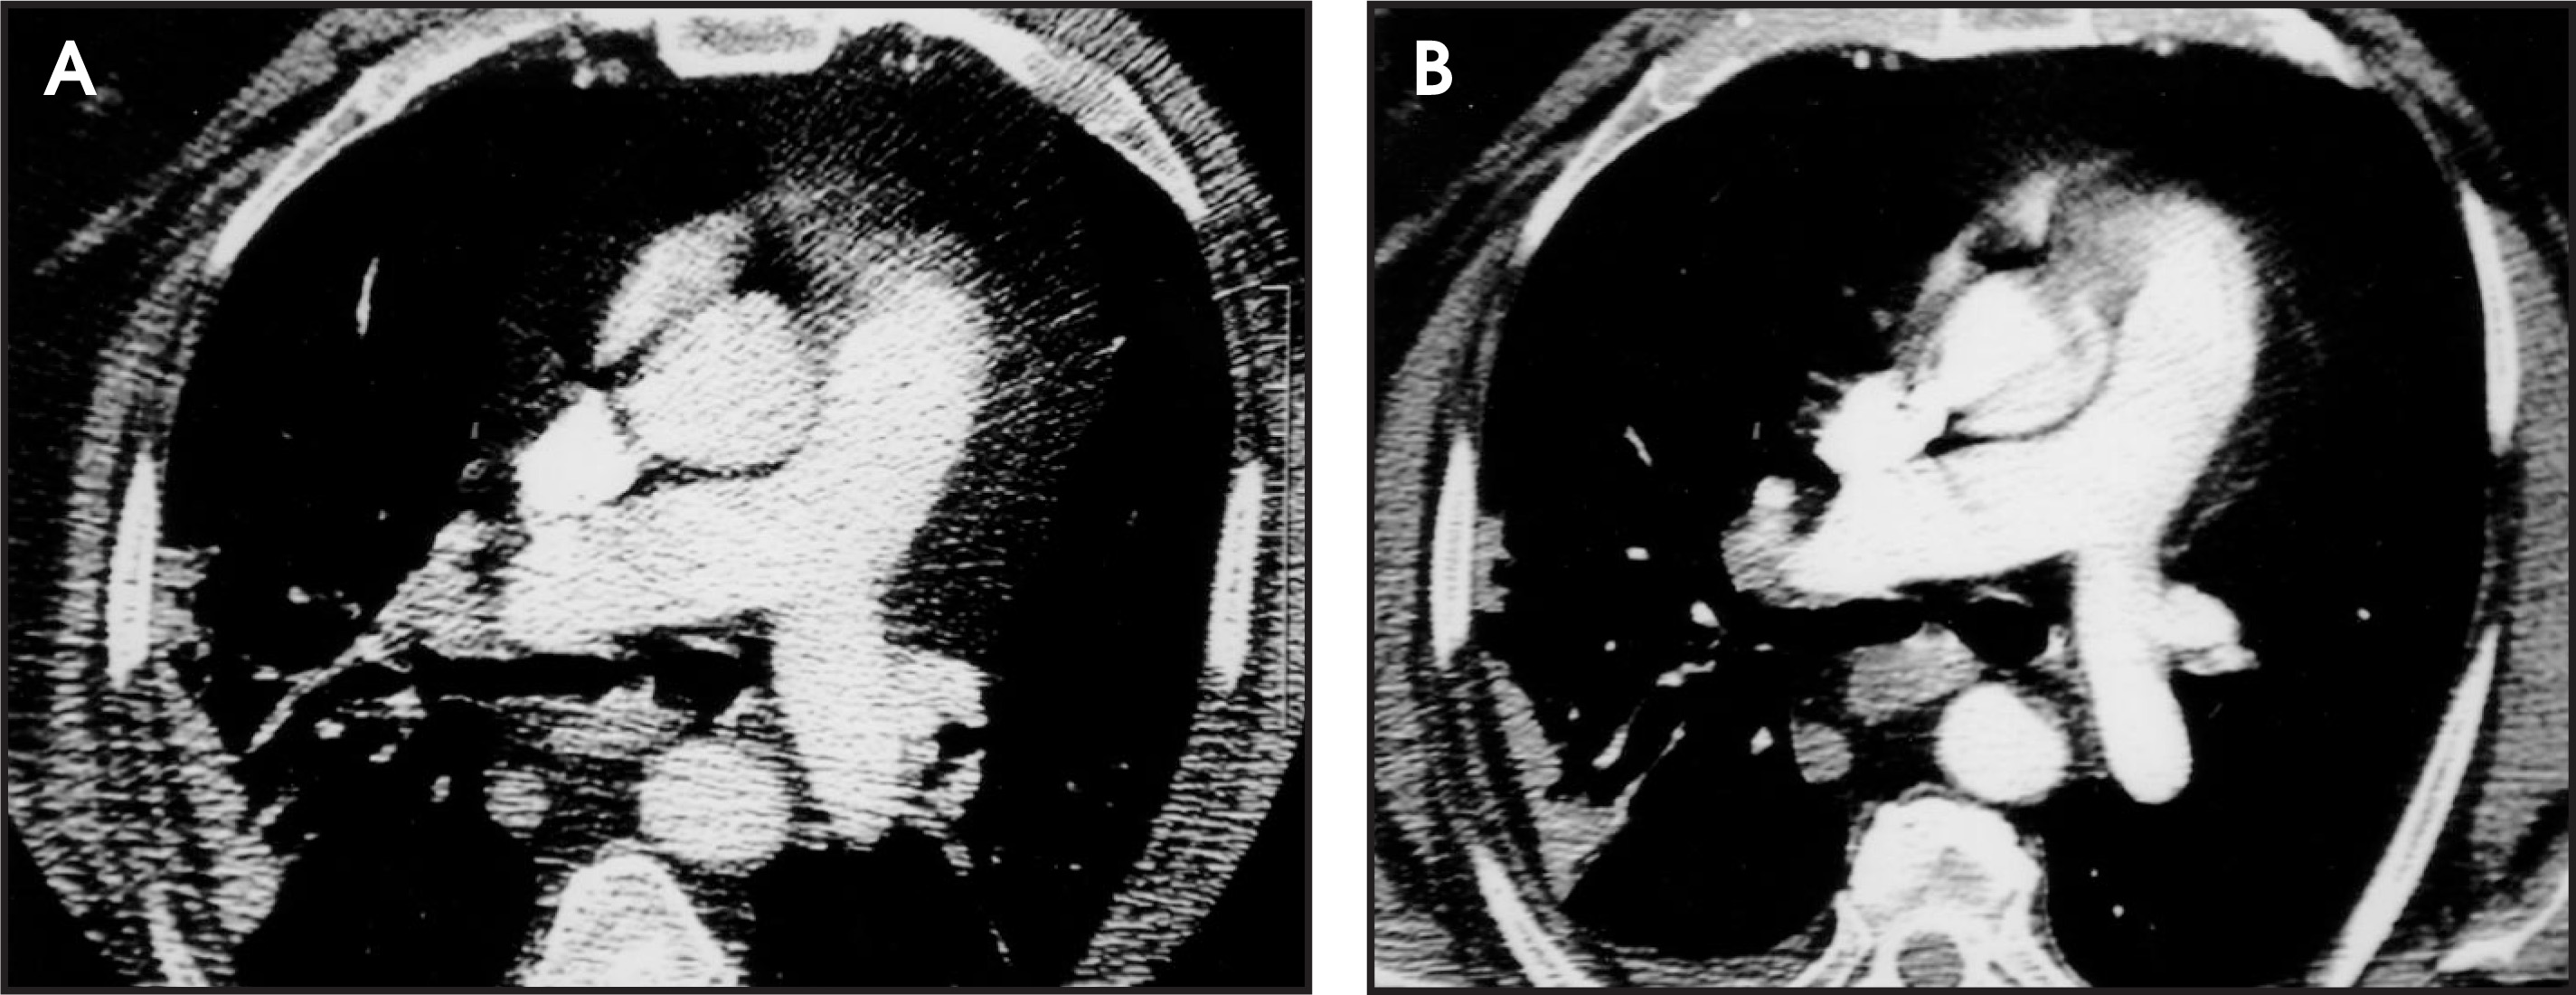
Edge-enhancing reconstruction algorithms—Edge-enhancing reconstruction algorithms can create the false-positive appearance of acute PE. While edge-enhancing algorithms are appropriate for review of images in lung windows, smoothing algorithms are more appropriate for review of the images in soft-tissue windows.
Accuracy of HCTPA for diagnosing acute PE
Adequately performed HCTPA studies are essentially 100% sensitive and specific for large central emboli.12 Numerous studies evaluating the accuracy of HCTPA have been performed,1,12-19 each with somewhat different techniques and study design. The results of these studies suggest an overall sensitivity of HCTPA for acute PE of approximately 90% when HCTPA is compared with pulmonary angiography directly.4 The major controversy surrounding the use of HCTPA revolves around its accuracy for smaller clots, particularly subsegmental emboli. In general, studies showing a lower sensitivity for HCTPA have involved the use of HCTPA after nondiagnostic scintigraphy, a situation that may tend to pre-select patients who are more likely to have smaller emboli.18 When evaluating the use of HCTPA for the diagnosis of small pulmonary emboli, four issues must be addressed: 1) What is the frequency of isolated subsegmental emboli? 2) How accurate is pulmonary angiography for the diagnosis of small clots? 3) Are small clots clinically significant? and 4) Can patients be managed safely on the basis of negative HCTPA results alone?
What is the frequency of isolated subsegmental emboli?
The reported frequency of isolated subsegmental emboli is 6% to 30%.20-22 In the Prospective Investigation of Pulmonary Embolism Diagnosis study (PIOPED),21 approximately 6% of all patients were diagnosed with isolated subsegmental clot only.20 However, in other studies in which angiography was performed after nondiagnostic scintigraphy, the frequency of isolated subsegmental emboli ranges as high as 30%.22 The latter finding tends to support the idea that strategies directing patients to HCTPA after nondiagnostic scintigraphy tend to select patients that are more likely to have smaller clots. In unselected patients, the frequency of isolated small clots is low.
How accurate is pulmonary angiography for the diagnosis of small clots?
Pulmonary angiography has played a major role in evaluating the accuracy of HCTPA in several studies.12-15,18,19 However, the accuracy of pulmonary angiography for the identification of small clots is questionable. In one study addressing this issue, consensus readings of pulmonary angiograms changed initial interpretations in 30% on a per-patient basis and 37% on a per-embolus basis.23 Recently, pulmonary angiography was compared to 1-mm and 3-mm HCTPA studies in pigs, after the pigs were injected with methylmethacrylate beads ranging in size from 3.8 to 4.4 mm to simulate the presence of small clots.24 The investigators found no statistically significant difference in sensitivity and positive predictive value between pulmonary angiography and 1-mm and 3-mm HCTPA. Such data should be kept in mind when reviewing studies that used pulmonary angiography as the reference standard for evaluating HCTPA.23
Are small clots clinically significant?
The clinical significance of small emboli is unclear. In one large study of 627 patients suspected of acute PE who had nondiagnostic scintigraphy and negative lower extremity venous examinations (a protocol that tends to select patients with small clots), and who were not treated, only 1.9% had evidence of acute PE on long-term follow-up.25 Such data implies that small, untreated clots may not be associated with poor outcome. In the PIOPED series, 20 patients with acute PE were not treated; 84% had segmental or smaller clots. Among these patients, 1 died and 1 suffered nonfatal PE. However, there was no difference in patient outcome when patients were grouped according to the size of the vessel involved.26 Although small clots may be reasonably well tolerated, patients with impaired cardiopulmonary reserve may not fare so well. Such patients have been noted to have a mortality approaching 7.8% when small clots are untreated.27
Can patients be managed safely on the basis of negative HCTPA results alone?
Because of the controversies outlined above, the ultimate answer to the question of the utility of HCTPA for the diagnosis of acute PE is whether or not patients can be managed safely on the basis of negative HCTPA results. Larger scale studies are currently under way. The results of several smaller investigations have found that the negative predictive value of HCTPA is ≥ 97%.2,28-32
Alternative diagnoses
A major advantage of HCTPA over other studies traditionally used to investigate patients suspected of acute PE is the ability of HCTPA to make alternative diagnoses in cases interpreted as negative. Alternative findings for symptoms simulating acute PE were visible on HCTPA studies in at least 66% of cases interpreted as negative for acute PE.1,2
Helical CT venography
CT venography (CTV) offers the benefit of evaluating patients for suspected venous thromboembolism, as opposed to limiting the evaluation to only thoracic manifestations of this disease. Because at least 90% of clinically significant acute PEs originate from the femoropopliteal system,4 a technique that has the ability to evaluate patients for PE and deep venous thrombosis (DVT) simultaneously, using a single-contrast bolus, offers obvious advantages.33
CT venography technique
CT venography protocols differ among institutions. Some investigators use 5-mm collimation helical imaging with a high pitch,34-37 beginning the scan from either the level of the diaphragm or the iliac crest and extending to the level of the tibial plateaus. Other investigators have used 5- to 10-mm axial imaging every 2 cm instead of helical imaging.38,39 A scan delay of 2.5 to 3 minutes is adequate.
Findings of DVT on CT venography
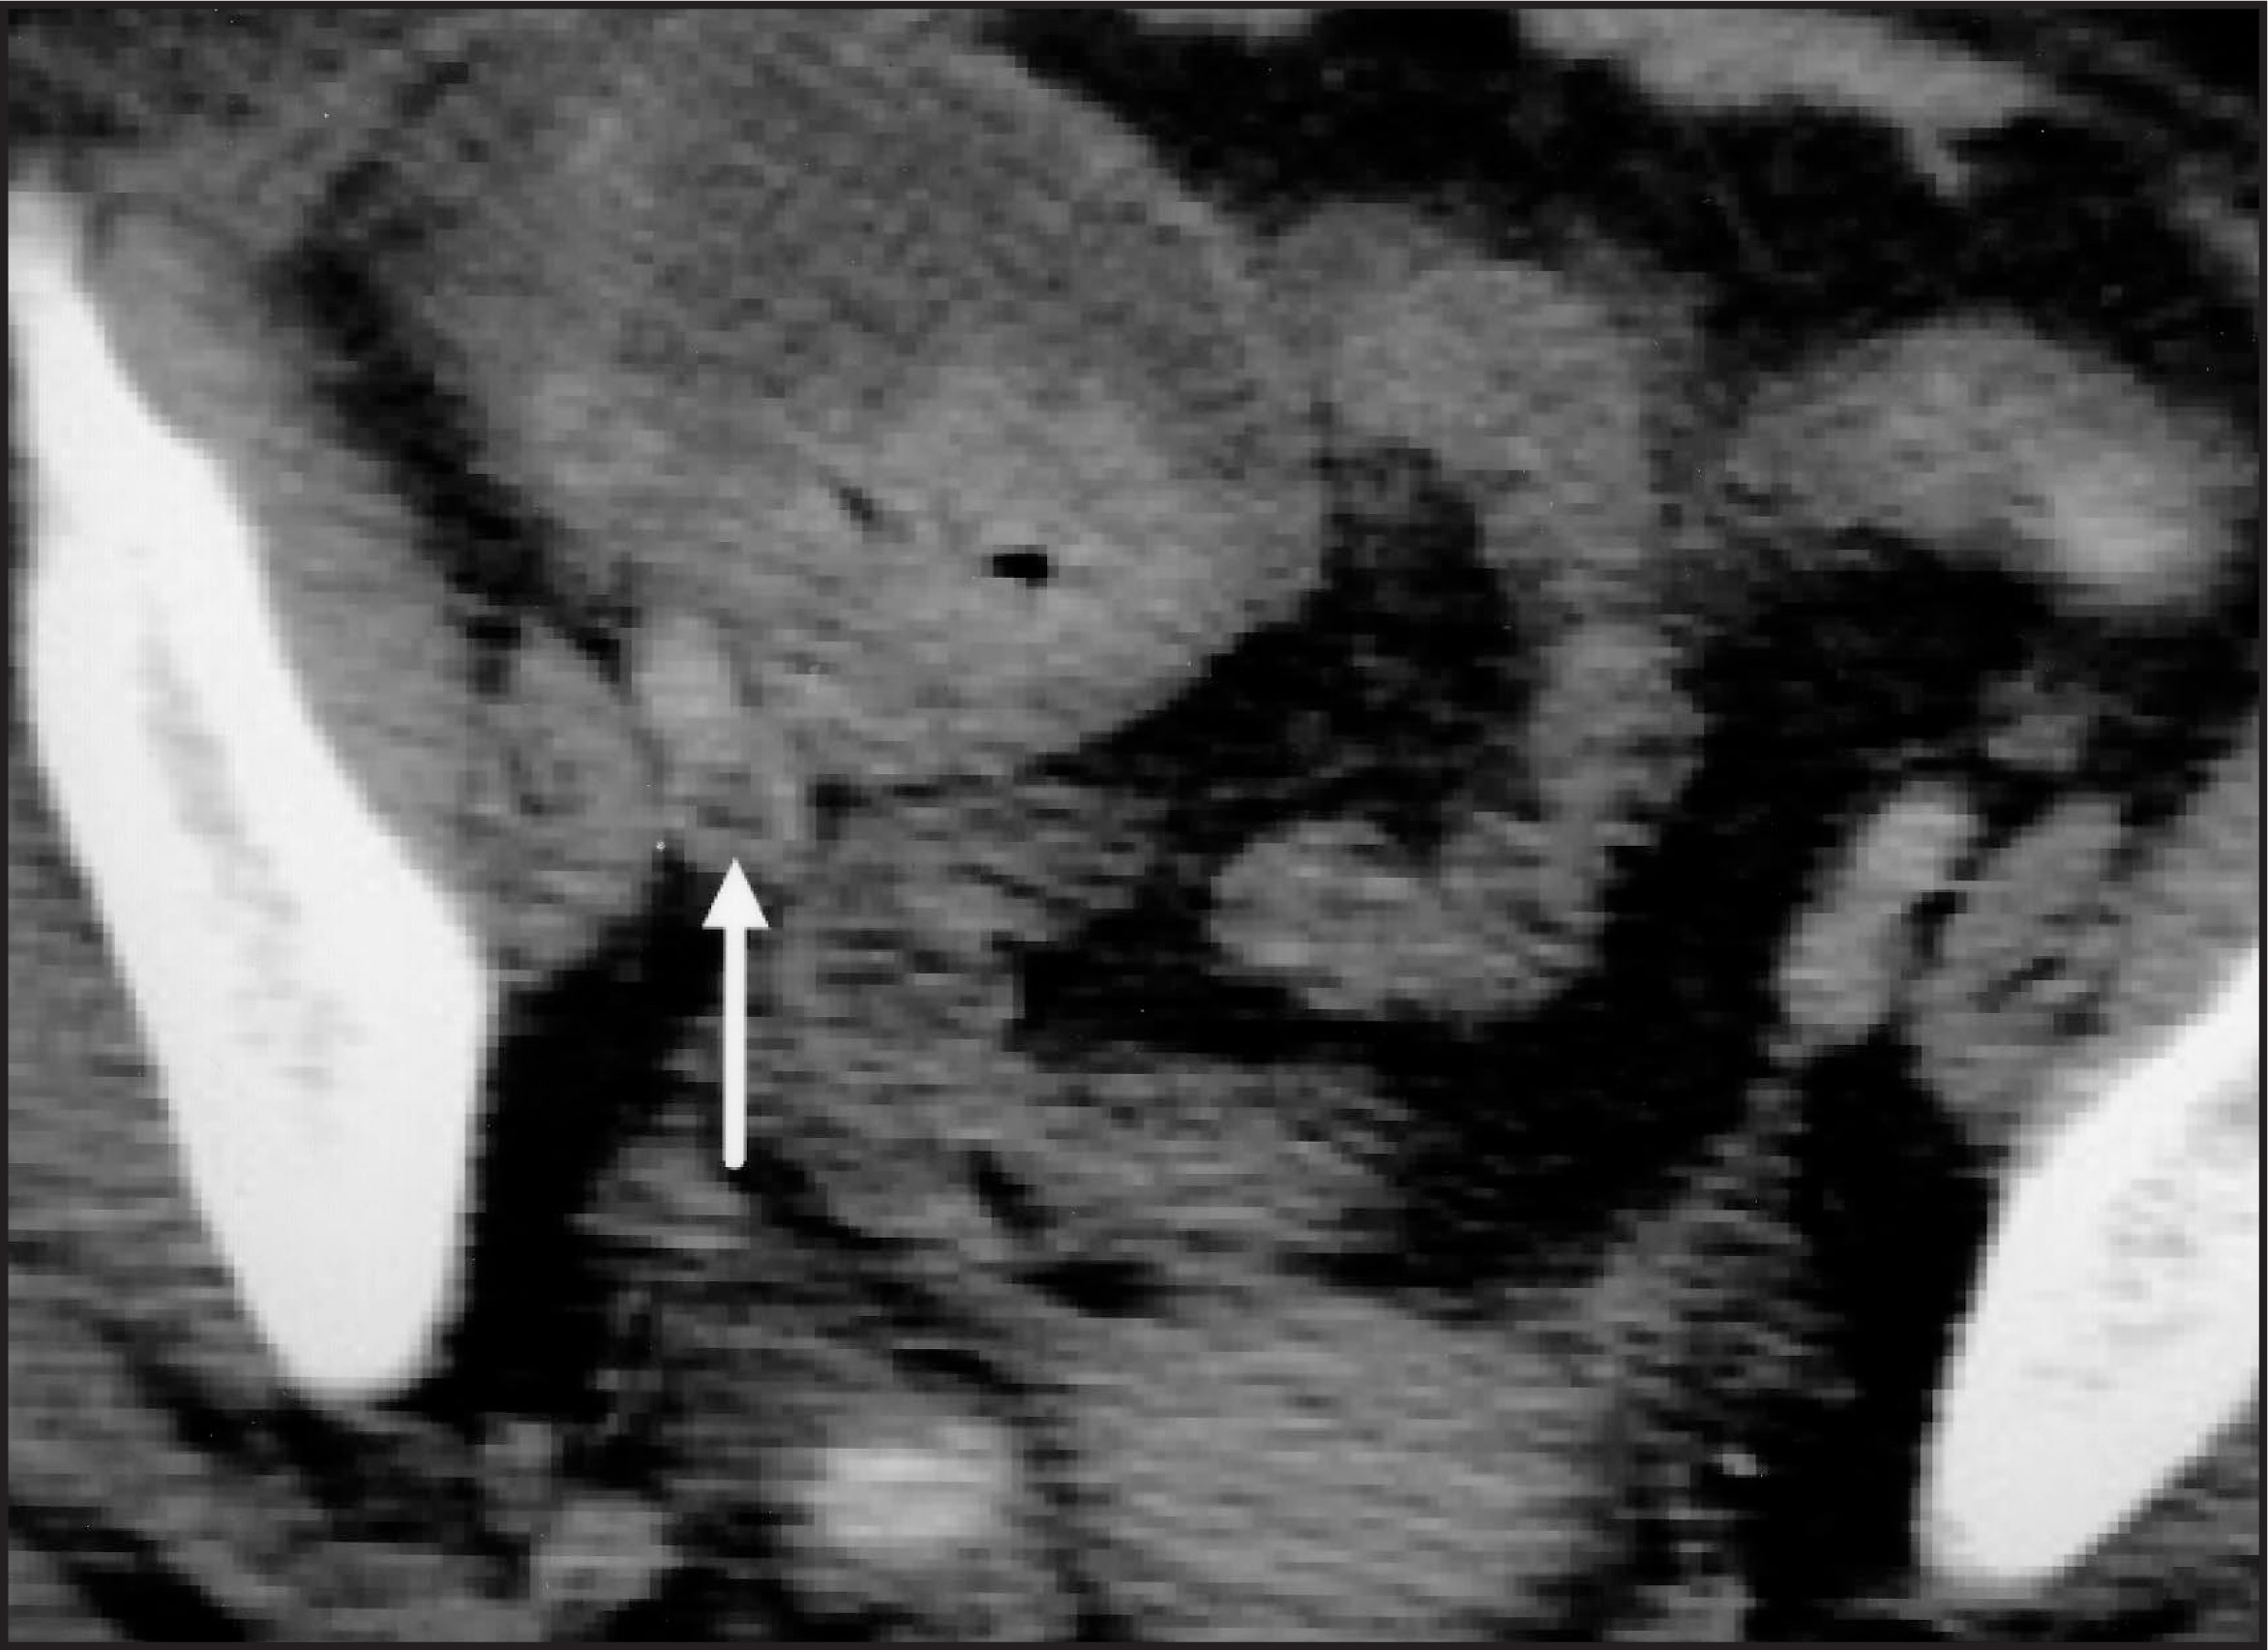
As with acute PE, the single most reliable finding of acute DVT on CTV studies is an intraluminal filling defect surrounded by contrast (figures 14 and 15). Ancillary findings include non-opacified venous segments, acute venous distension, enhancement of the venous walls, prolonged arterial enhancement, and perivenous fat stranding.34-38,40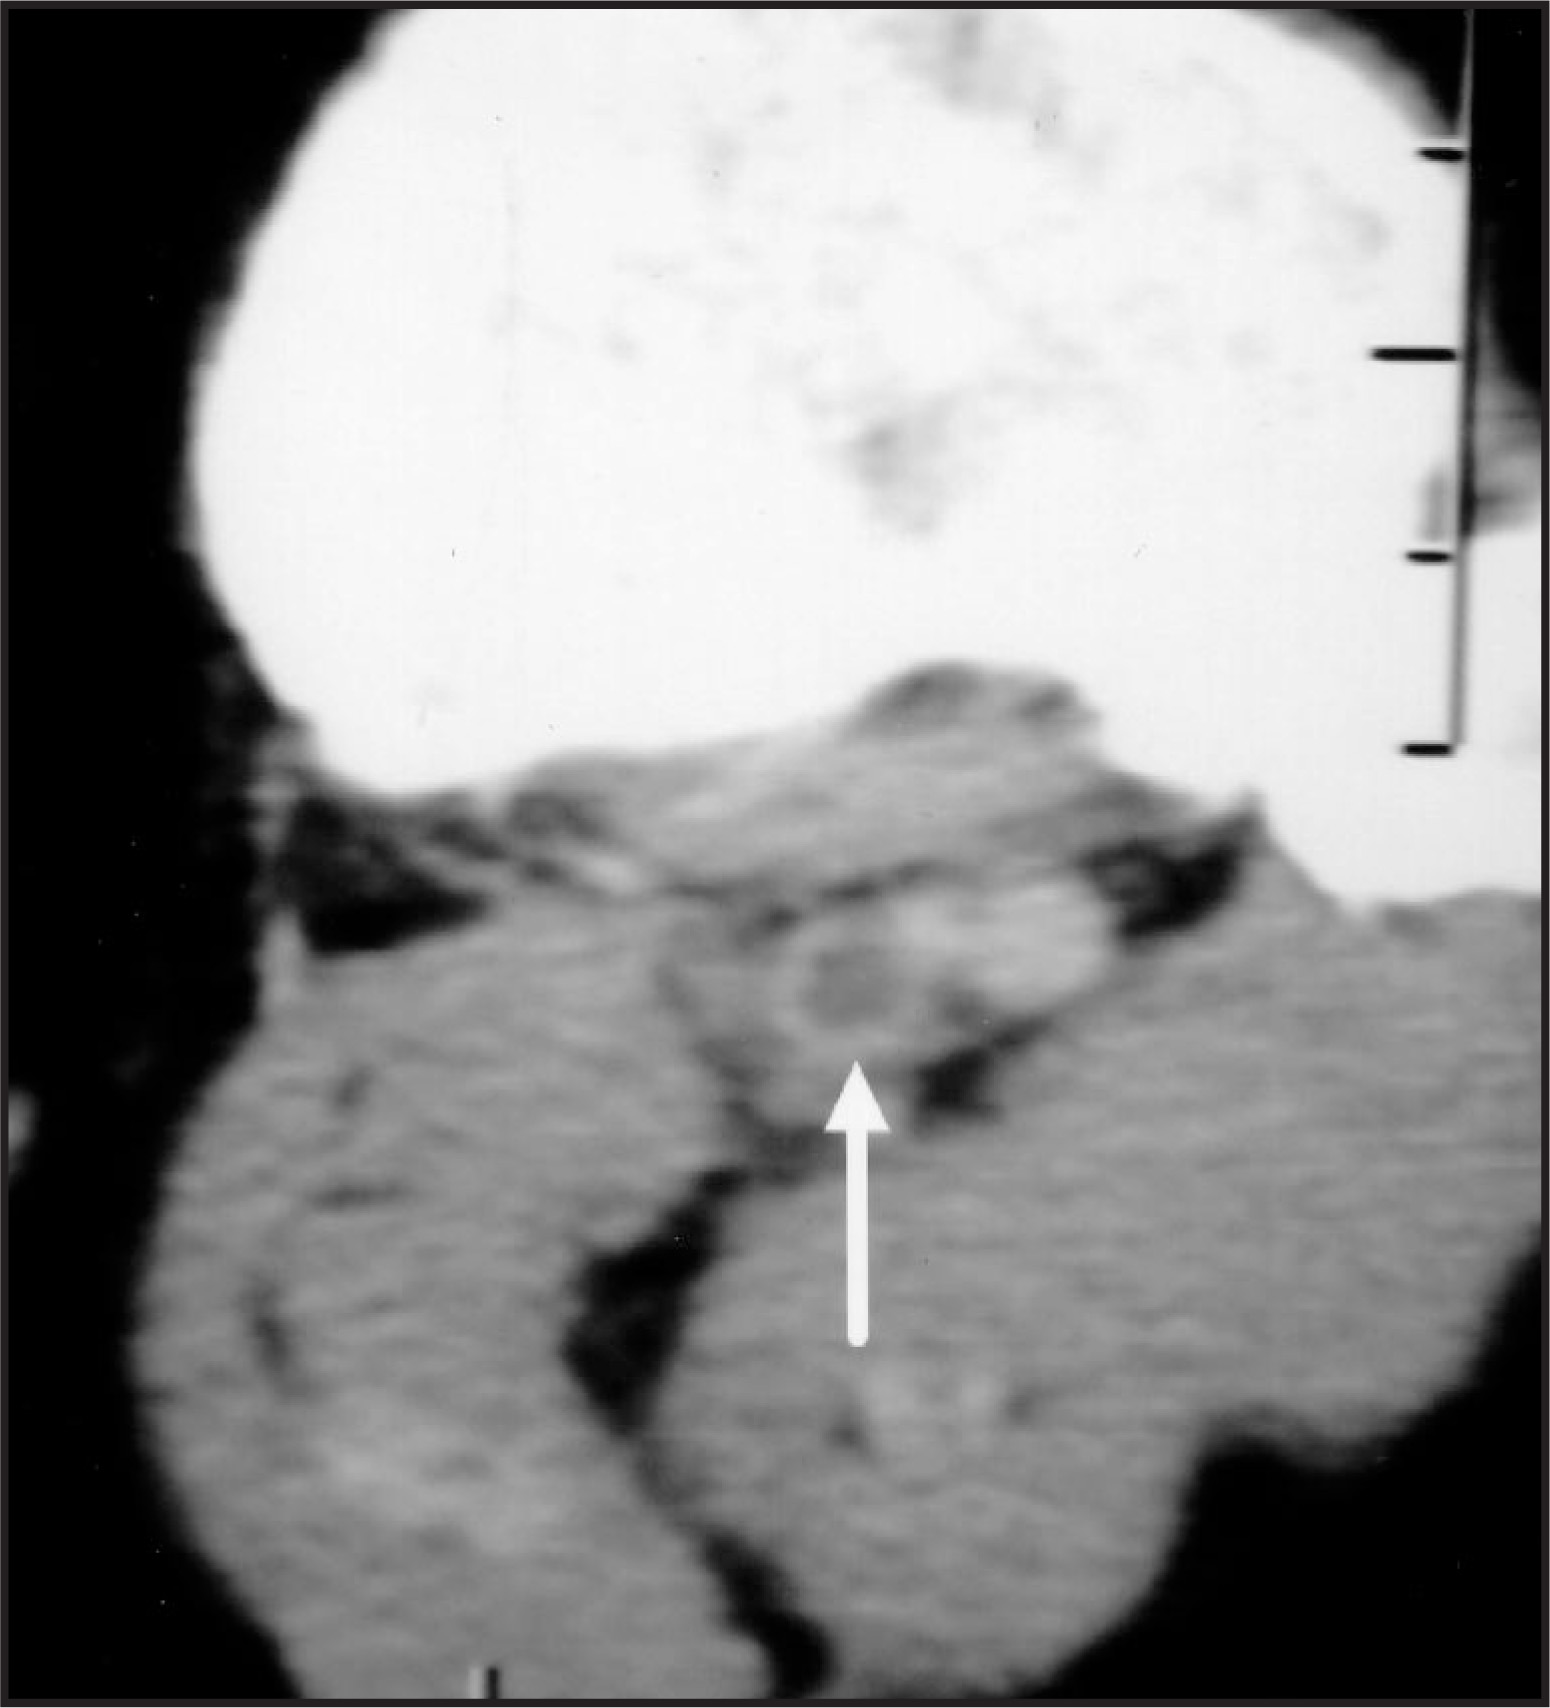
Pitfalls in the CT diagnosis of acute DVT
Findings that may simulate the appearance of acute DVT on CTV studies include venous valves, volume averaging of obliquely oriented pelvic veins, and arterial thrombi mistaken for DVT. Situations that may obscure the diagnosis of acute DVT include arterial insufficiency resulting in poor venous enhancement, streak artifacts from orthopedic hardware obscuring the venous system, bilateral extensive DVT, and the presence of indwelling venous catheters.40
Accuracy of CT venography
Clinical utility of CTV techniques
A good test of the utility of CTV is how often the addition of CTV results to HCTPA studies changes clinical management. In one study addressing this issue, the addition of CTV to HCTPA protocols increased the yield for the diagnosis of venous thromboembolism from 69% to 90%.41 Another investigation found that the addition of CTV to HCTPA examinations increased the yield for the diagnosis of venous thromboembolism by 18%.42 Recently, Loud and colleagues36 reported their experience in 650 patients. These investigators found that CTV techniques increased the yield over HCTPA techniques alone by 36%.36 Among the cases of DVT, these investigators reported 17% of cases were limited to the abdominal or pelvic veins (figure 15), and thus would likely not have been detected by ultrasound.36 Such data highlights the fact that CTV techniques have the added benefit of evaluating patients for non–lower-extremity sources of DVT (pelvic and renal veins and inferior vena cava).
Conclusion
HCTPA, particularly with the addition of CTV, is a powerful tool in the investigation of suspected venous thromboembolism. In unselected patients, the sensitivity of HCTPA is approximately 90%, and this figure will likely improve with the addition of CTV protocols and the widespread introduction of MDCT. The negative predictive value of HCTPA is high, and HCTPA studies often provide alternative diagnoses accounting for clinical presentations simulating acute PE for examinations that are interpreted as negative. Attention to numerous technical parameters as well as familiarity with a host of pitfalls will ensure high-quality examinations and accurate diagnosis. AR
References
- Kim K, Muller N, Mayo J. Clinically suspected pulmonary embolism: Utility of spiral CT. Radiology. 1999;210:693-697.
- Remy-Jardin M, Remy J, Baghaie F. Clinical value of thin collimation in the diagnostic workup of pulmonary embolism. AJR Am J Roentgenol. 2000;175:407-411.
- Remy-Jardin M, Remy J. Spiral CT angiography of the pulmonary circulation. Radiology. 1999;212:615-636.
- Gotway M, Edinburgh K, Feldstein V. Imaging evaluation of suspected pulmonary embolism. Curr Probl Diagn Radiol. 1999;28:129-184.
- Ghaye B, Szapiro D, Mastora I. Peripheral pulmonary arteries: How far in the lung does multi-detector row spiral CT allow analysis?. Radiology. 2001;219:629-636.
- Coche E, Muller N, Kim K. Acute pulmonary embolism: Ancillary findings at spiral CT. Radiology. 1998;207:753-758.
- Beigelman C, Chartrand-Lefebvre C, Howarth N, Grenier P. Pitfalls in diagnosis of pulmonary embolism with helical CT angiography. AJR Am J Roentgenol. 1998;171:579-585.
- Gotway M, Patel R, Webb W. Helical CT for the evaluation of suspected acute pulmonary embolism: Diagnostic pitfalls. J Comput Assist Tomogr. 2000;24:267-273.
- Remy-Jardin M, Remy J, Artaud D. Spiral CT of pulmonary embolism: Technical considerations and interpretive pitfalls. J Thorac Imaging. 1997;12:103-117.
- Remy-Jardin M, Duyck P, Remy J. Hilar lymph nodes: Identification with spiral CT and histologic correlation. Radiology. 1995;196:387-394.
- Kauczor H, Schwickert H, Mayer E. Pulmonary artery sarcoma mimicking chronic thromboembolic disease: Computed tomography and magnetic resonance imaging findings. Cardiovasc Intervent Radiol. 1994;17:185-189.
- Remy-Jardin M, Remy J, Wattinne L, Giraud F. Central pulmonary thromboembolism: diagnosis with spiral volumetric CT with the single-breath-hold technique—Comparison with pulmonary angiography. Radiology. 1992;185:381-387.
- Remy-Jardin M, Remy J, Deschildre F. Diagnosis of pulmonary embolism with spiral CT: Comparison with pulmonary angiography and scintigraphy. Radiology. 1996;200:699-706.
- van Rossum A, Pattynama P, Ton E. Pulmonary embolism: Validation of spiral CT angiography in 149 patients. Radiology. 1996;201:467-470.
- Drucker E, Rivitz S, Shepard J. Acute pulmonary embolism: Assessment of helical CT for diagnosis. Radiology. 1998;209:235-241.
- Ferretti G, Bosson J, Buffaz P. Acute pulmonary embolism: Role of helical CT in 164 patients with intermediate probability at ventilation-perfusion scintigraphy and normal results at duplex US of the legs. Radiology. 1997;205:453-458.
- Garg K, Welsh C, Feyerabend A. Pulmonary embolism: Diagnosis with spiral CT and ventilation-perfusion scanning—correlation with pulmonary angiographic results or clinical outcome. Radiology. 1998;208:201-208.
- Goodman L, Curtin J, Mewissen M. Detection of pulmonary embolism in patients with unresolved clinical and scintigraphic diagnosis: Helical CT versus angiography. AJR Am J Roentgenol. 1995;164:1369-1374.
- Mayo J, Remy-Jardin M, Muller N. Pulmonary embolism: Prospective comparison of spiral CT with ventilation-perfusion scintigraphy. Radiology. 1997;205:447-452.
- Stein P, Henry J. Prevalence of acute pulmonary embolism in central and subsegmental pulmonary arteries and relation to probability interpretation of ventilation/perfusion lung scans. Chest. 1997;111:1246-1248.
- Value of the ventilation/perfusion scan in acute pulmonary embolism. Results of the prospective investigation of pulmonary embolism diagnosis (PIOPED). JAMA. 1990;263:2753-2759.
- Oser R, Zuckerman D, Gutierrez F, Brink J. Anatomic distribution of pulmonary emboli at pulmonary angiography: Implications for cross-sectional imaging. Radiology. 1996;199:31-35.
- Diffin D, Leyendecker J, Johnson S. Effect of anatomic distribution of pulmonary emboli on interobserver agreement in the interpretation of pulmonary angiography. AJR Am J Roentgenol. 1998;171:1085-1089.
- Baile E, King G, Muller N. Spiral computed tomography is comparable to angiography for the diagnosis of pulmonary embolism. Am J Respir Crit Care Med. 2000;161:1010-1015.
- Hull R, Raskob G, Ginsberg J. A noninvasive strategy for the treatment of patients with suspected pulmonary embolism. Arch Intern Med. 1994;154:289-297.
- Stein P, Henry J, Relyea B. Untreated patients with pulmonary embolism. Outcome, clinical, and laboratory assessment. Chest. 1995;107:931-935.
- Hull R, Raskob G, Pineo G, Brant R. The low-probability lung scan. A need for change in nomenclature. Arch Intern Med. 1995;155:1845-1851.
- Garg K, Sieler H, Welsh C. Clinical validity of helical CT being interpreted as negative for pulmonary embolism: Implications for patient treatment. AJR Am J Roentgenol. 1999;172:1627-1631.
- Goodman L, Lipchik R, Kuzo R. Subsequent pulmonary embolism: Risk after a negative helical CT pulmonary angiogram—Prospective comparison with scintigraphy. Radiology. 2000;215:535-542.
- Lomis N, Yoon H, Moran A, Miller F. Clinical outcomes of patients after a negative spiral CT pulmonary arteriogram in the evaluation of acute pulmonary embolism. J Vasc Interv Radiol. 1999;10:707-712.
- Ost D, Rozenshtein A, Saffran L, Snider A. The negative predictive value of spiral computed tomography for the diagnosis of pulmonary embolism in patients with nondiagnostic ventilation-perfusion scans. Am J Med. 2001;110:16-21.
- Gottsater A, Berg A, Centergard J. Clinically suspected pulmonary embolism: Is it safe to withhold anticoagulation after a negative spiral CT?. Eur Radiol. 2001;11:65-72.
- Garg K, Kemp J, Wojcik D. Thromboembolic disease: Comparison of combined CT pulmonary angiography and venography with bilateral leg sonography in 70 patients. AJR Am J Roentgenol. 2000;175:997-1001.
- Loud P, Grossman Z, Klippenstein D, Ray C. Combined CT venography and pulmonary angiography: A new diagnostic technique for suspected thromboembolic disease. AJR Am J Roentgenol. 1998;170:951-954.
- Loud P, Katz D, Klippenstein D. Combined CT venography and pulmonary angiography in suspected thromboembolic disease: Diagnostic accuracy for deep venous evaluation. AJR Am J Roentgenol. 2000;174:61-65.
- Loud P, Katz D, Bruce D. Deep venous thrombosis with suspected pulmonary embolism: Detection with combined CT venography and pulmonary angiography. Radiology. 2001;219:498-502.
- Coche E, Hamoir X, Hammer F. Using dual-detector helical CT angiography to detect deep venous thrombosis in patients with suspicion of pulmonary embolism: Diagnostic value and additional findings. AJR Am J Roentgenol. 2001;176:1035-1039.
- Garg K, Kemp J, Russ P, Baron A. Thromboembolic disease: Variability of interobserver agreement in the interpretation of CT venography with CT pulmonary angiography. AJR Am J Roentgenol. 2001;176:1043-1047.
- Bruce D, Loud P, Klippenstein D. Combined CT venography and pulmonary angiography: How much venous enhancement is routinely obtained?. AJR Am J Roentgenol. 2001;176:1281-1285.
- Duwe K, Shiau M, Budorick N. Evaluation of the lower extremity veins in patients with suspected pulmonary embolism: A retrospective comparison of helical CT venography and sonography. 2000 ARRS Executive Council Award I. American Roentgen Ray Society. AJR Am J Roentgenol. 2000;175:1525-1531.
- Censullo M, Ernst R, Kawashima A. CT venography as an adjunct to CT pulmonary angiography for the detection of pulmonary thromboembolic disease. Radiology. 1999;213(P):558.
- Cham M, Yankelevitz D, Shaham D. Deep venous thrombosis: Detection by using indirect CT venography. Radiology. 2000;216:744-751.
Citation
. Helical CT pulmonary angiography for acute pulmonary embolism. Applied Radiology. 2002;31(4):21-30. doi:10.37549/AR1078.