Hybrid imaging of esophageal cancer
Applied Radiology — Vol. 33 , Issue 6 , pp. 9 -20
DOI: 10.37549/AR1257
Published: June 1, 2004
Categories
Fluorine-18 fiuorodeoxyglucose (FDG) positron emission tomography (PET) scanning has a well-established role in the diagnosis, initial staging, and restaging of esophageal carcinoma. In this overview, the authors will discuss this role and illustrate the additional value of hybrid PET/computed tomography (CT) imaging as applied to these indications.
Esophageal cancer invades locally, spreads to local lymph nodes, and then metastasizes throughout the body. More than 90% of esophageal cancers are either squamous-cell carcinomas or adenocarcinomas; these histologies have approximately equal occurrences. On rare occasions, other carcinomas, melanomas, leiomyosarcomas, carcinoids, and lymphomas may also occur.1
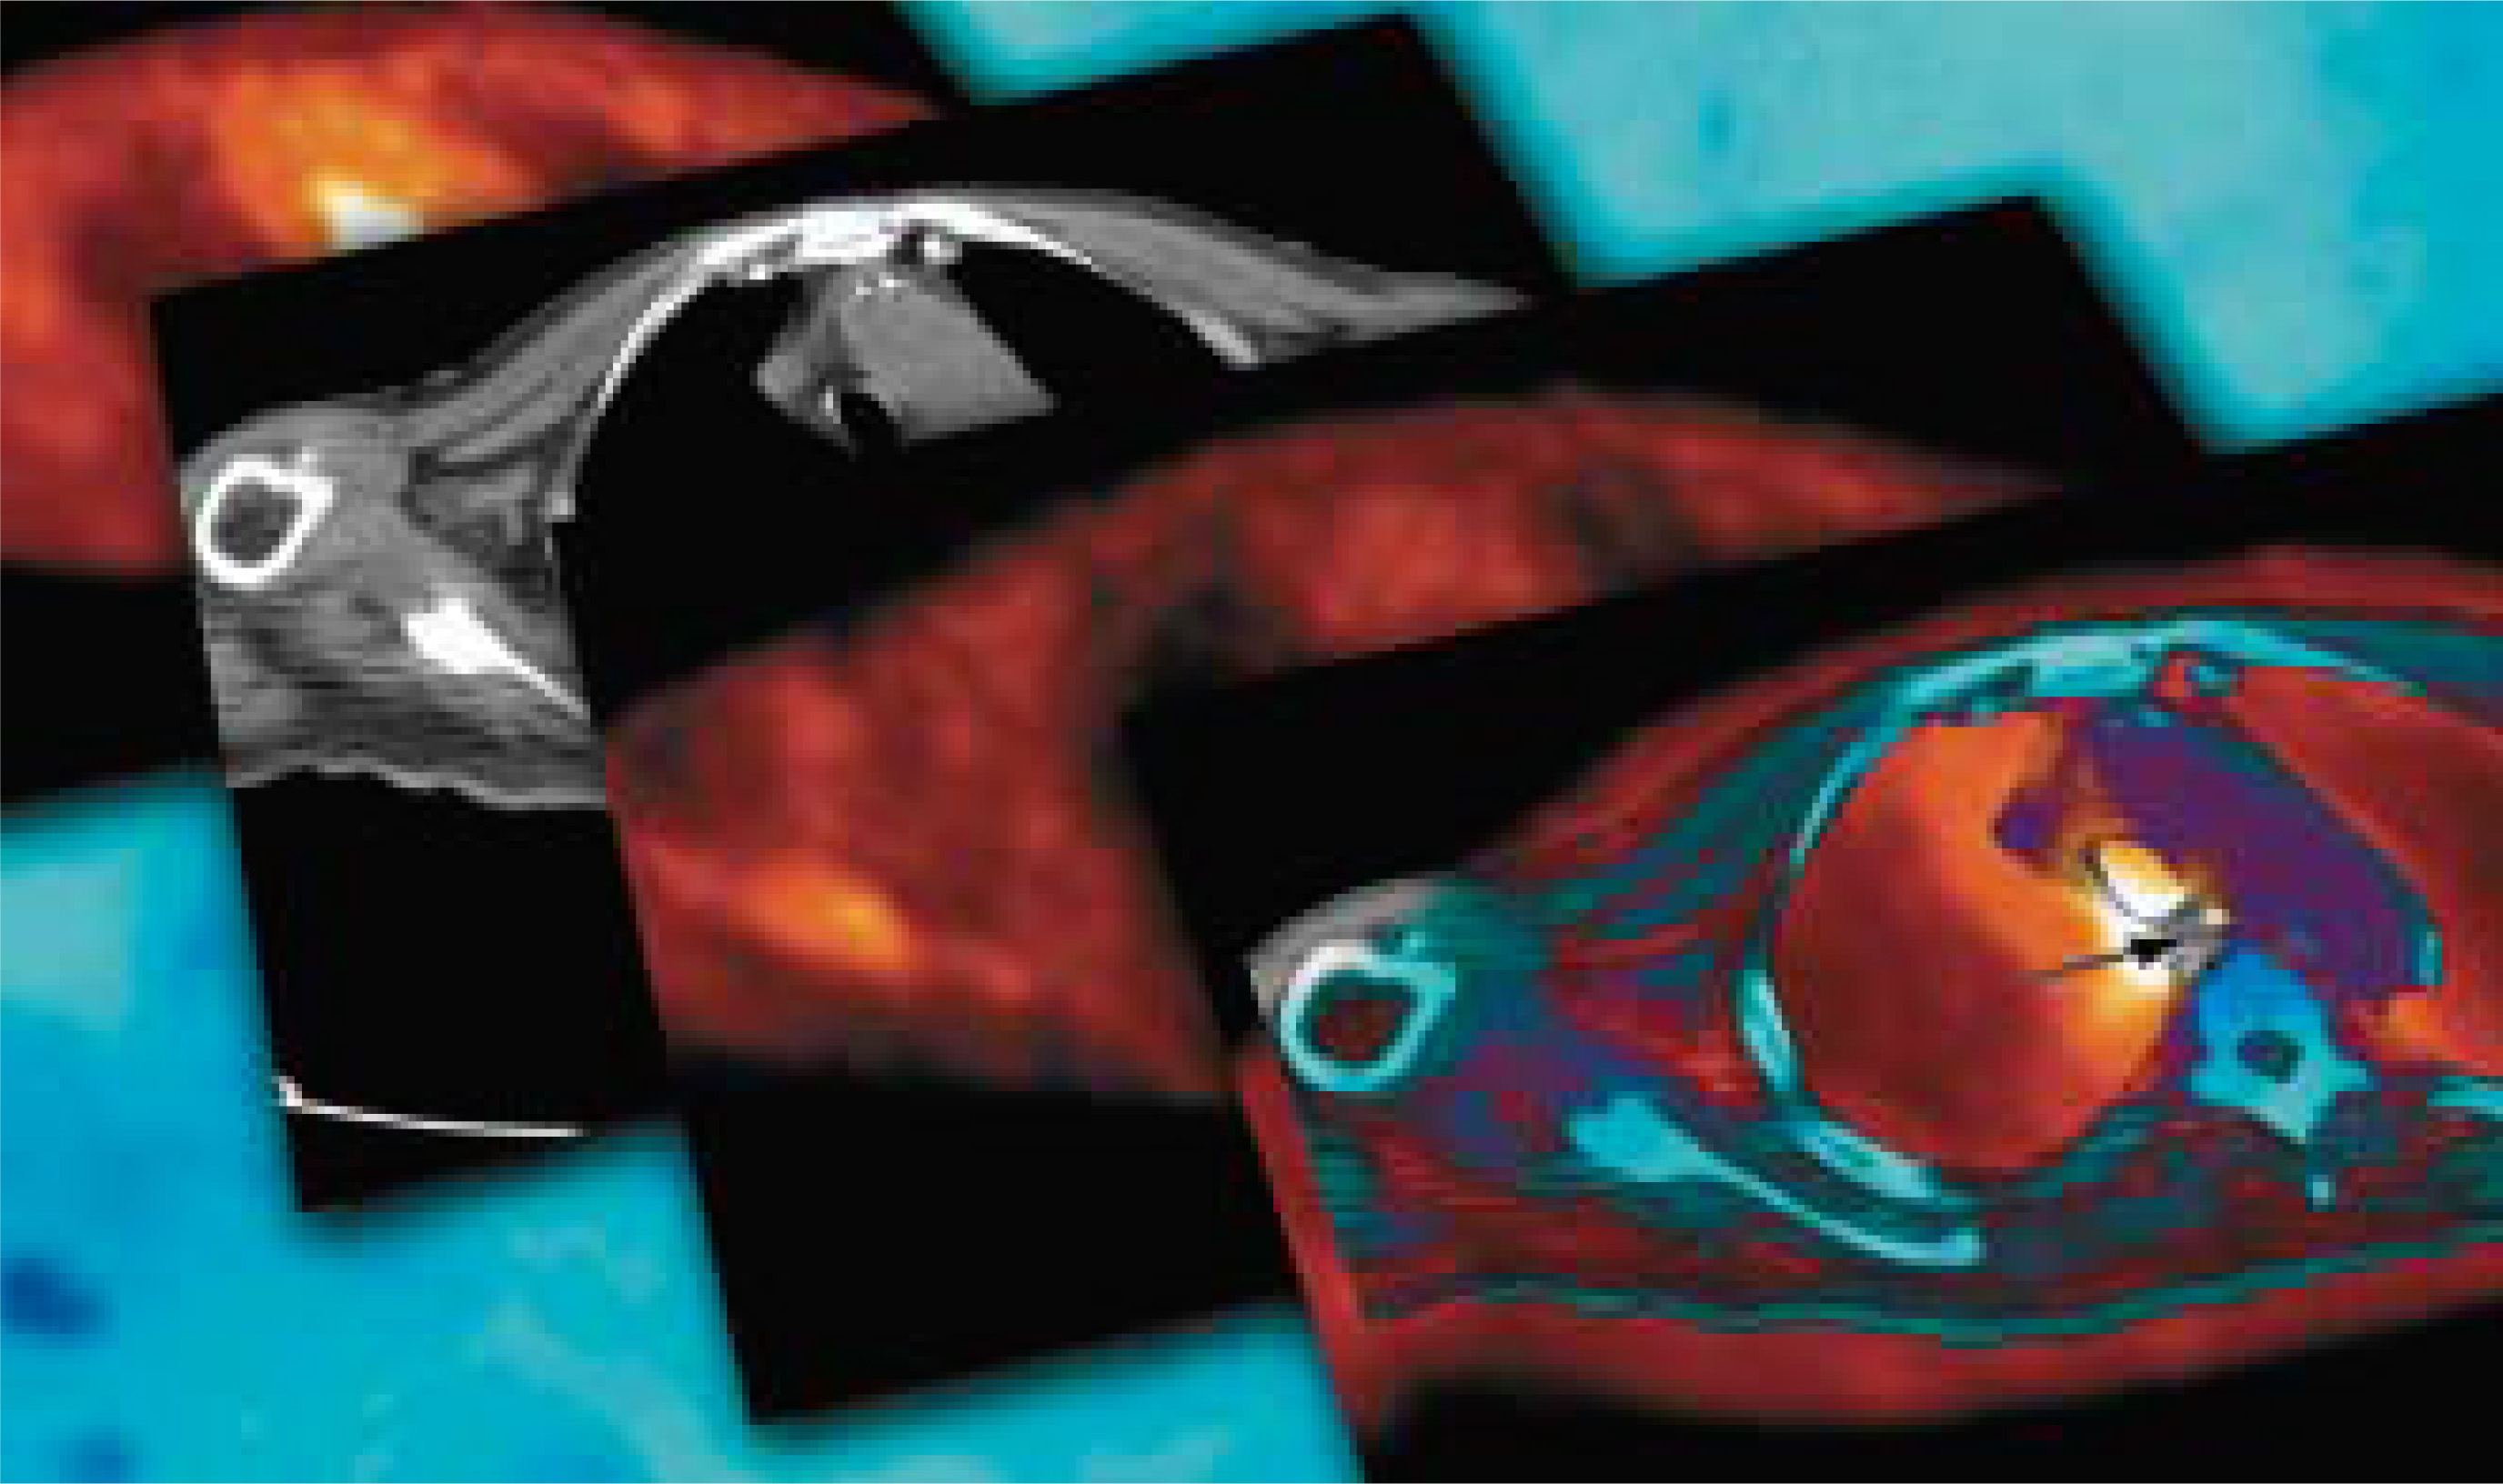
The esophagus is divided into four regions: cervical, upper thoracic, midthoracic, and lower thoracic. The cervical esophagus begins at the cricopharyngeus muscle at the level of the cricoid cartilage and extends 6 cm to the thoracic inlet. The intrathoracic esophagus extends for another 20 to 25 cm to the gastroesoph-ageal junction. Approximately three quarters of all adenocarcinomas are found in the distal esophagus (Figure 1), whereas squamous cell carcinomas are more evenly distributed between the middle and lower third.1,2
The pathogenesis of esophageal cancer remains unclear. Tobacco and alcohol abuse have a synergistic effect and are very strong risk factors for squamous-cell carcinoma and moderate risk factors for adenocarcinoma.3 Gastroesophageal refiux disease, which is often associated with obesity, promotes the formation of Barrett’s esophagus, which has an annual rate of transformation to esophageal adenocarcinoma of approximately 0.5%.4-6 Radiotherapy to the mediastinum also predisposes patients to both histologic types of esophageal cancer that typically develop ≥10 years after exposure.7
Once cancer develops, it may spread rapidly. Adenocarcinoma often spreads via transverse esophageal penetration, whereas squamous-cell carcinoma tends to spread linearly in a submucosal fashion.8 Lymph node metastasis occurs in 14% to 21% of submucosal cancers (T1 lesions) and 38% to 60% of cancers that invade muscle (T2 lesions).9 Prognosis is best with tumors <5 cm in size, with tumors involving the upper third of the esophagus, and in females younger than 65 years.10 Conversely, weight loss, low Karnofsky performance status, deep ulceration of tumor, sinus tract formation, and fistula formation have all been found to be poor prognostic factors.10
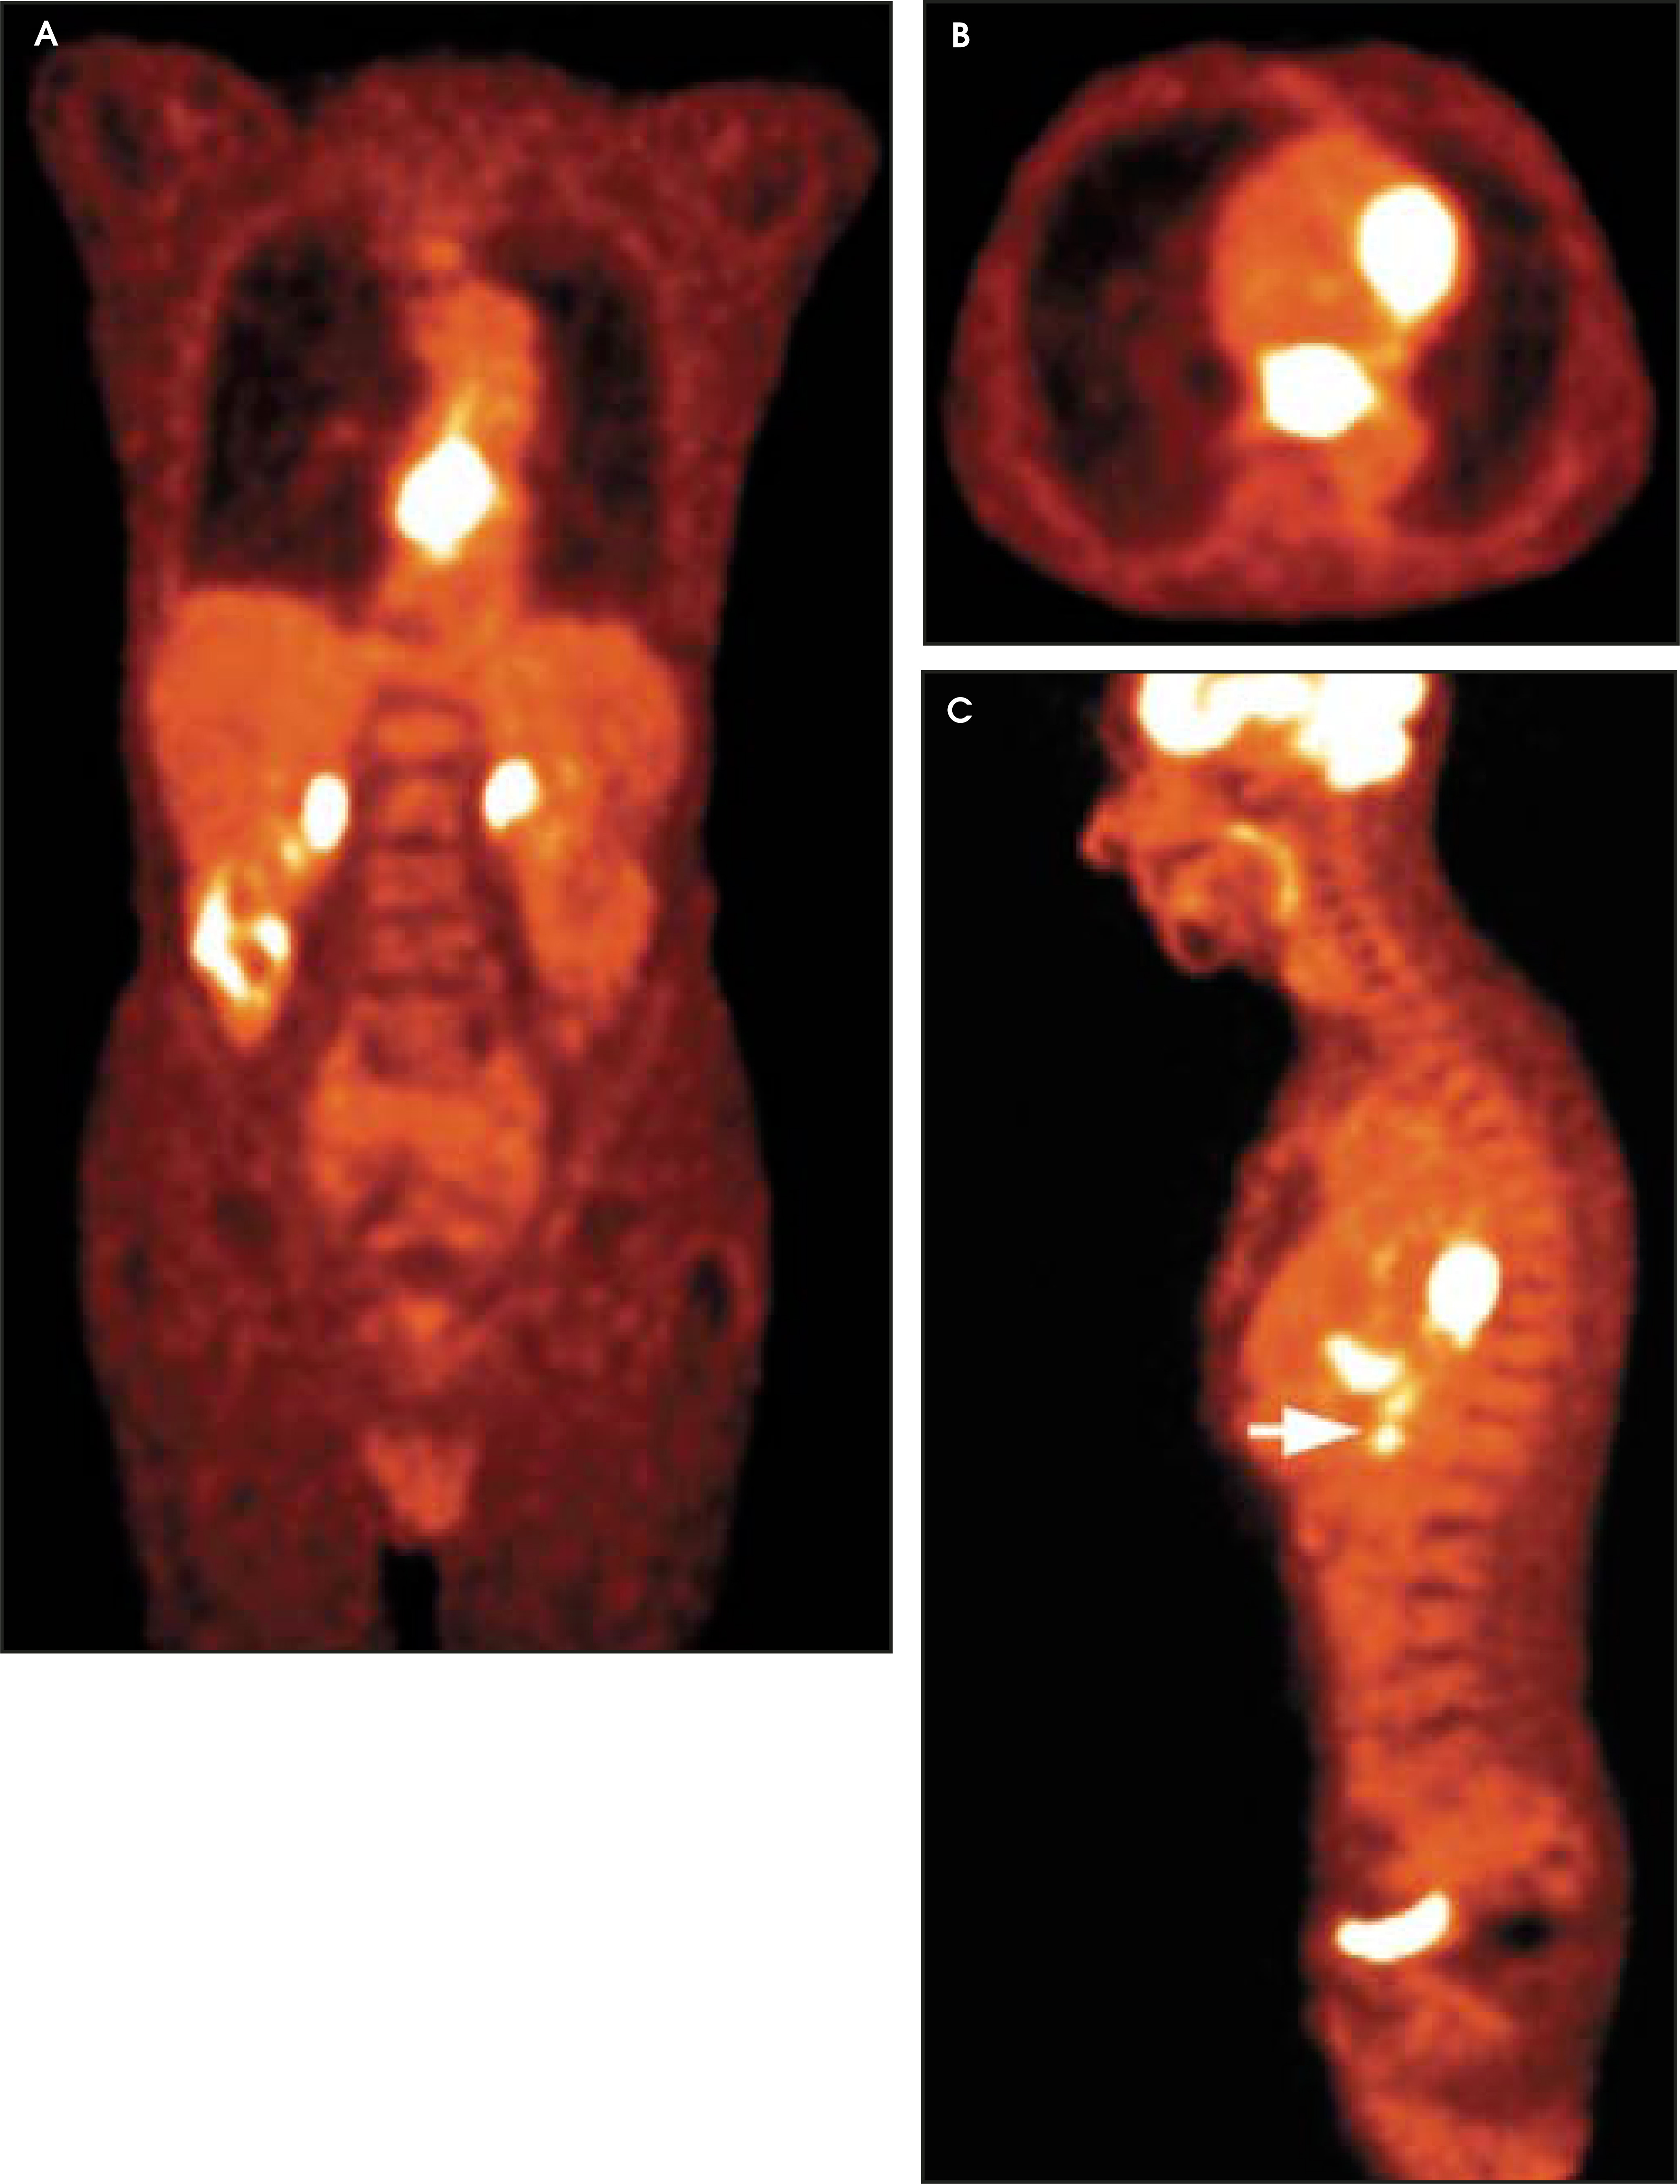
The most common presenting symptoms of esophageal cancer are dysphagia and weight loss. Less common symptoms include odynophagia, cachexia, melena, retrosternal pain, and hoarseness.11 Cancers of the esophagus must involve at least 75% of the circumference before the sensation of food “sticking” or blockage is experienced. At the time of the diagnosis of esophageal cancer, >50% of patients have either unresectable tumors or radiographically visible metastases.9 Because of the poor prognosis for patients with esophageal cancer (Figure 2) and the risks associated with surgical intervention, accurate staging is essential for optimal treatment planning.12
Staging of esophageal cancer
Clinical staging takes into account the amount of disease that is present before treatment and is based on history, physical examination, biopsy, laboratory studies, endoscopic examination, and imaging, such as endoscopic ultrasound (EUS), CT, and PET.
The stage of the disease (Table 1) is defined in terms of the primary tumor invasion into the esophageal and surrounding tissues (T status), the involvement of regional nodes (N status) and the presence of distant metastasis (M status). Because the extent of wall penetration and lymph node metastases are the most important prognosticators of survival, only the depth of penetration is taken into account for the T staging, not the length of the tumor, extent of involved circumference, or degree of lumen narrowing.
Given the importance of mural invasion, EUS has been a primary means to diagnose and stage esophageal cancer. Using the radial echoendoscope, 360˚ visualization of the layers of esophageal wall is possible, and tumor involvement of adjacent structures, such as the aorta and the trachea, can be assessed.13-15 Further, EUS allows fine-needle aspiration and histologic verification of identified lymph nodes.16,17 A meta-analysis of 27 studies and a review of the literature supports an overall accuracy for EUS of approximately 85% for T staging and 75% for N staging.18,19 Due to limited EUS depth-of-view, however, it would be expected that the utility of EUS in detecting distant metastases other than celiac metastases is low.
In contrast to EUS, CT scanning is excellent for identifying distant metastases in the chest and abdomen. However, CT cannot differentiate the depth of the esophageal wall invasion (T status) or accurately assess regional lymph node disease (N status).20 Hence, CT accurately predicts the T stage in only 70% of cases and N stage in about 50% to 70% of cases.21-23
Positron emission tomography provides a molecular view of the glucose metabolism of esophageal cancer. Both primary squamous-cell carcinoma and adenocarcinoma of the esophagus demonstrate avid FDG uptake, which has been shown to correlate with tumor growth rate.24 Mildly elevated uptake is occasionally seen in the normal esophagus, possibly due to swallowed saliva or smooth muscle contraction. Significant FDG uptake can be seen in the gastric mucosa, which may lower accuracy in detecting tumors of the gastroesophageal junction.25
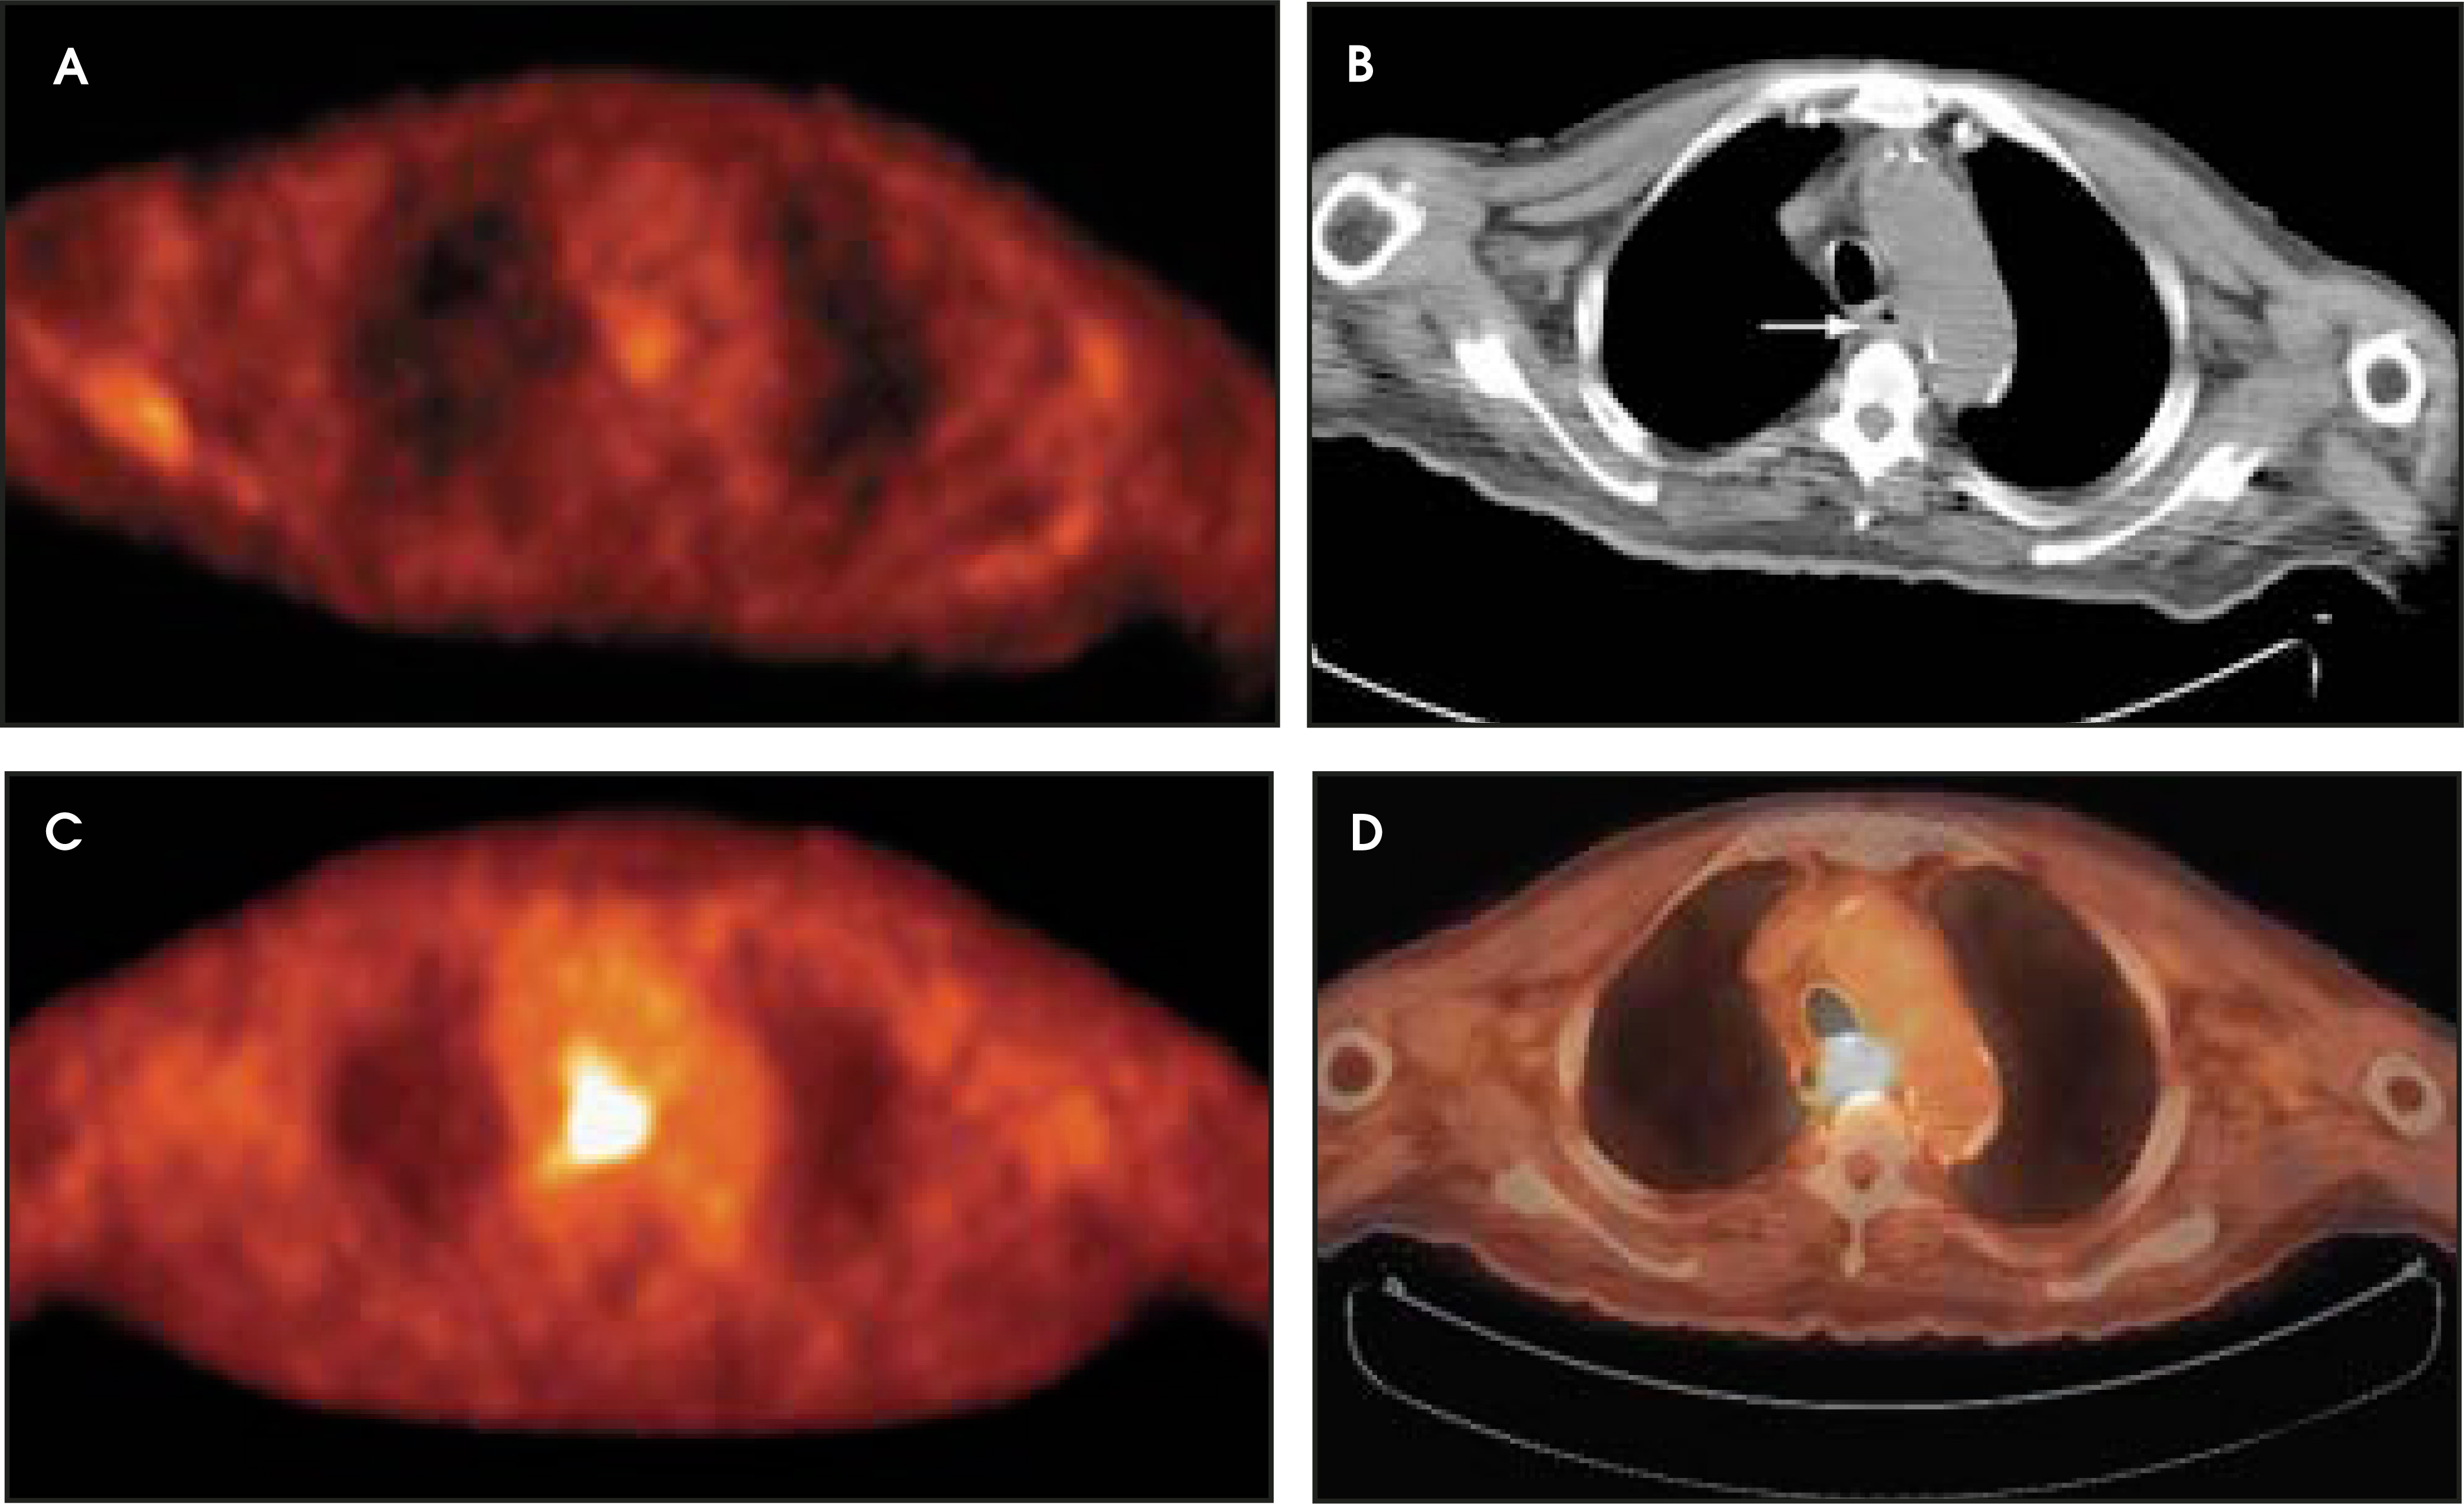
The principal limitation of FDG-PET is its relatively poor resolution (Figure 3) and reduced sensitivity (24% to 72%) to esophageal wall invasion and local nodal metastases adjacent to the primary tumor.26-28 The accuracy of FDG-PET in the staging of locoregional nodal metastatic disease varies from 24% to 90%, whereas the accuracy of CT in these same patients ranges from 40% to 73%.26-29
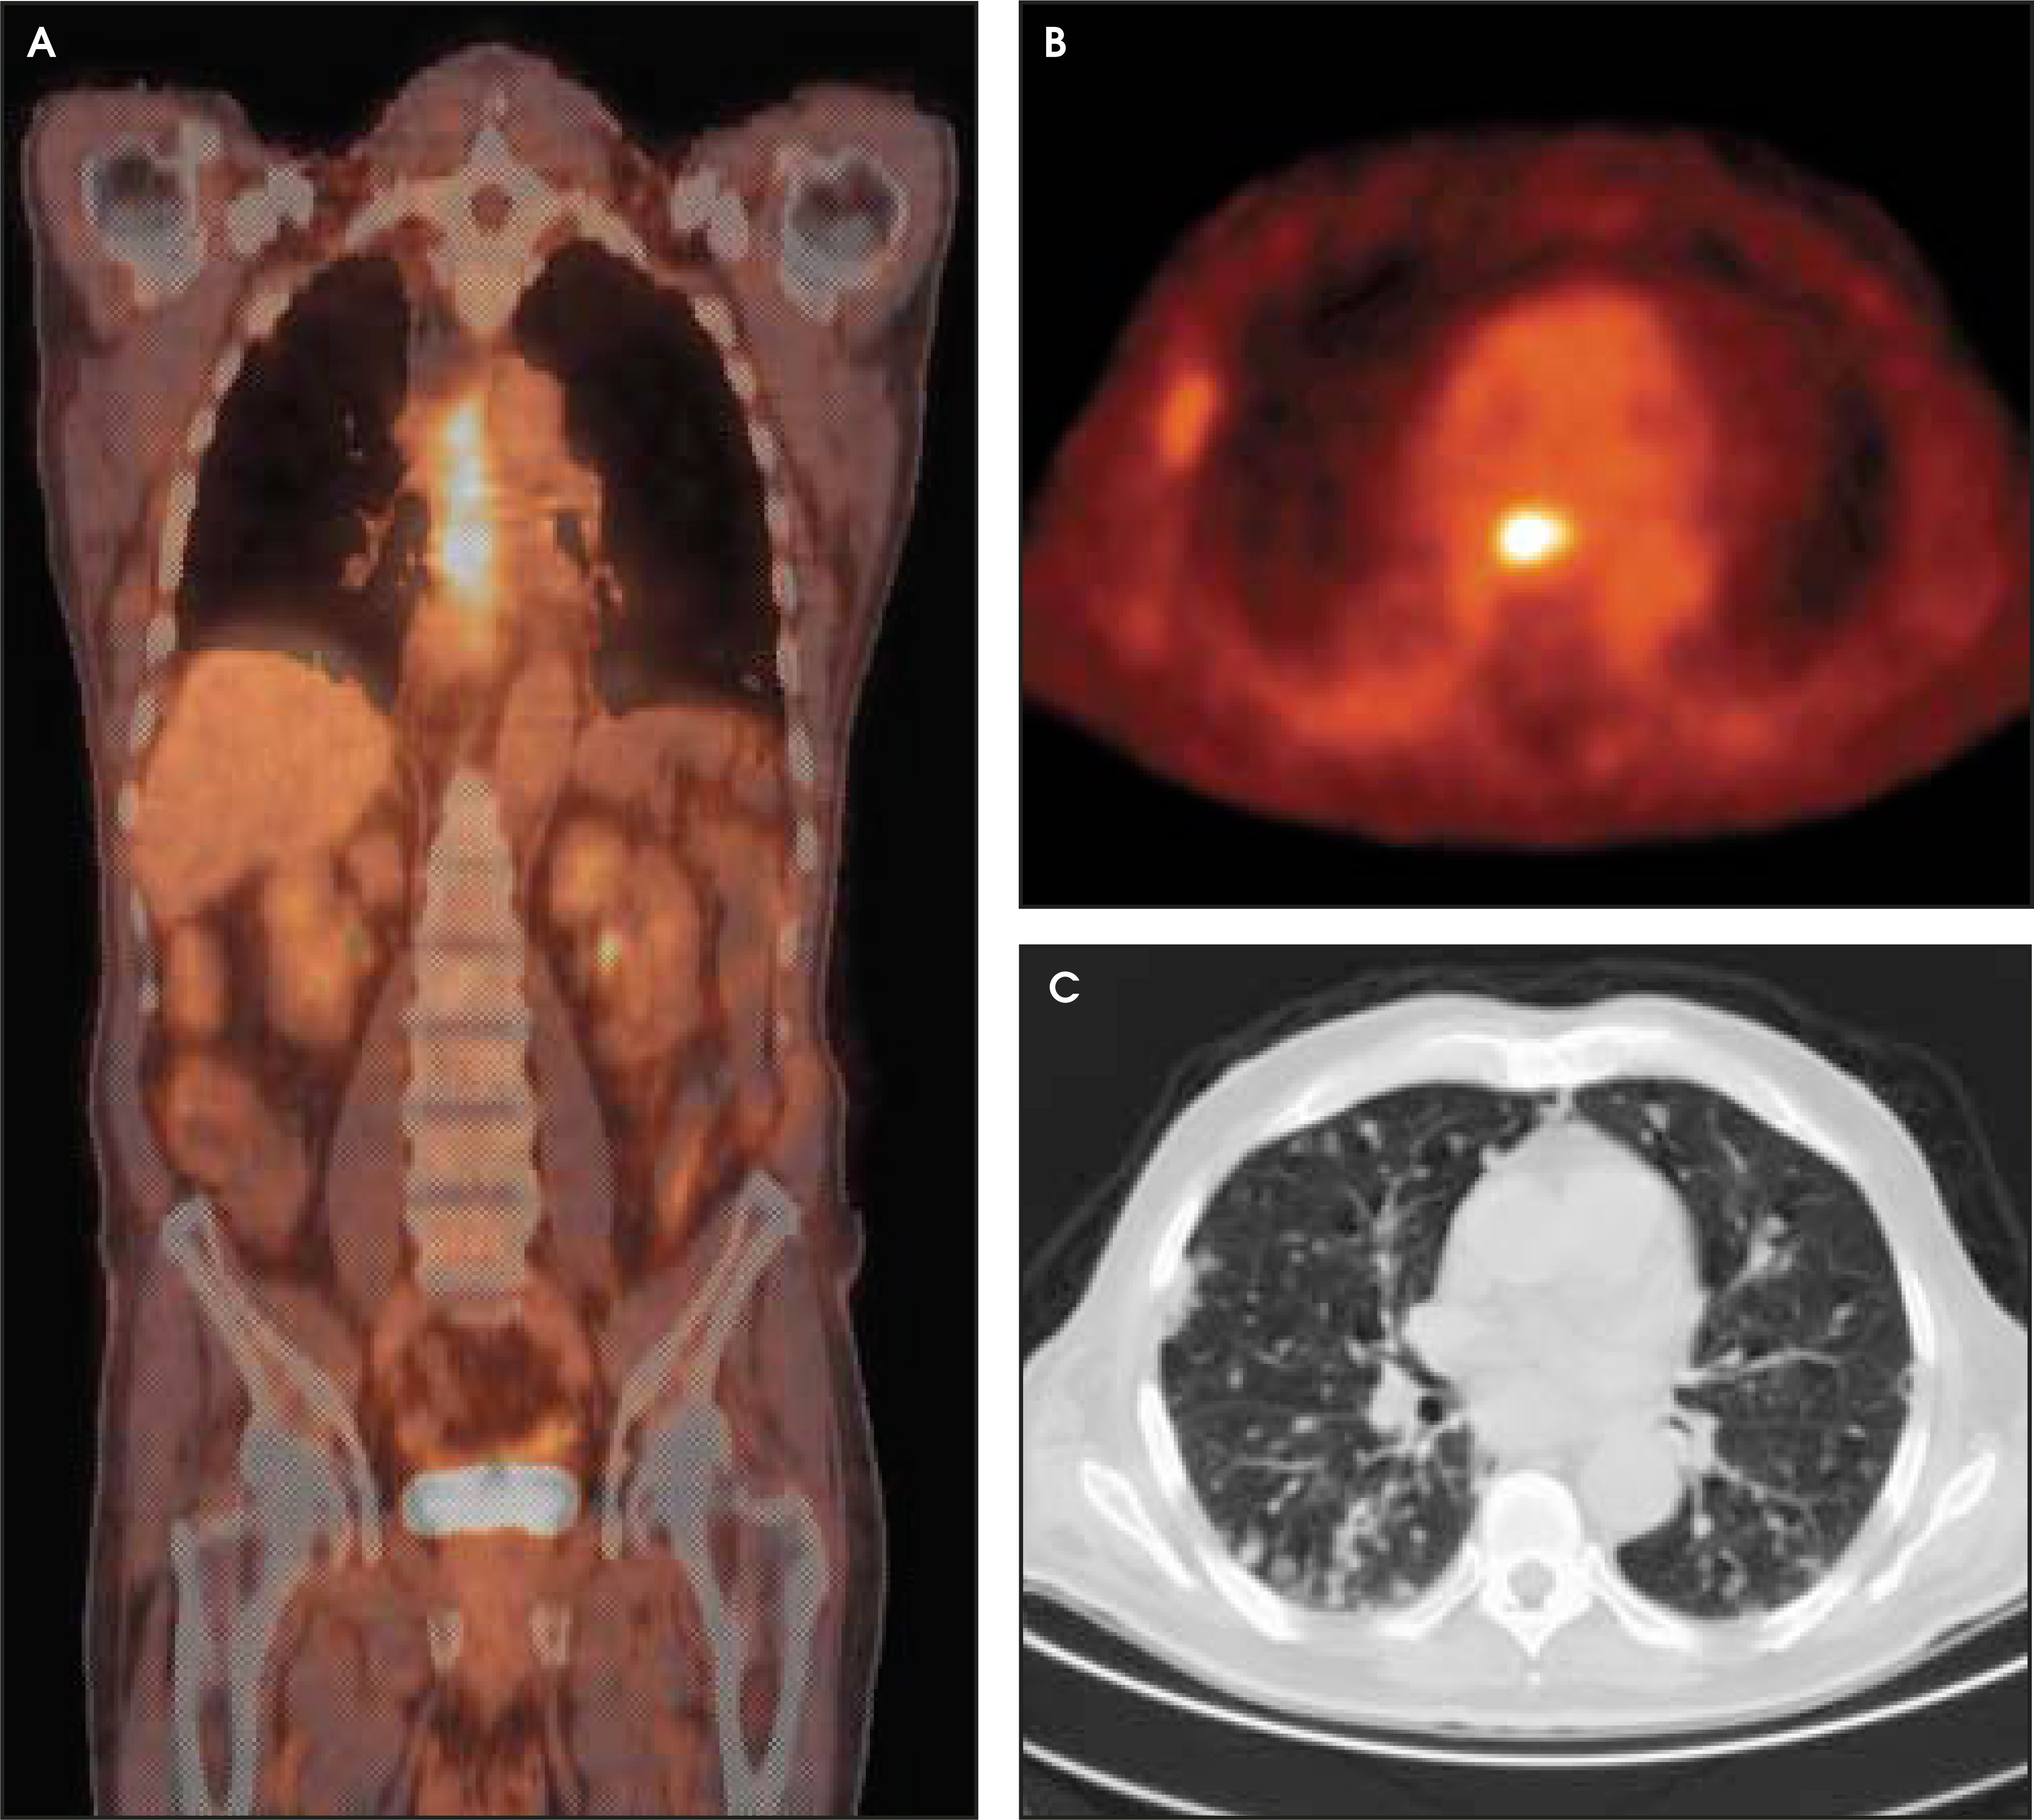
The major advantage of FDG-PET over anatomic imaging modalities is the ability to detect distant metastases (Figure 4).6-9 Distant metastatic disease has a significant impact on patient management because these patients are no longer suitable for surgical resection. In three studies with a total population of 97 patients with esophageal cancer, PET revealed distant metastatic disease that was not seen at conventional imaging in 21 patients (21.6%).26-28 For the evaluation of distant metastases, FDG-PET has a sensitivity of 69% to 100%, a specificity of 84% to 90%, and an accuracy of 84% to 91%.12
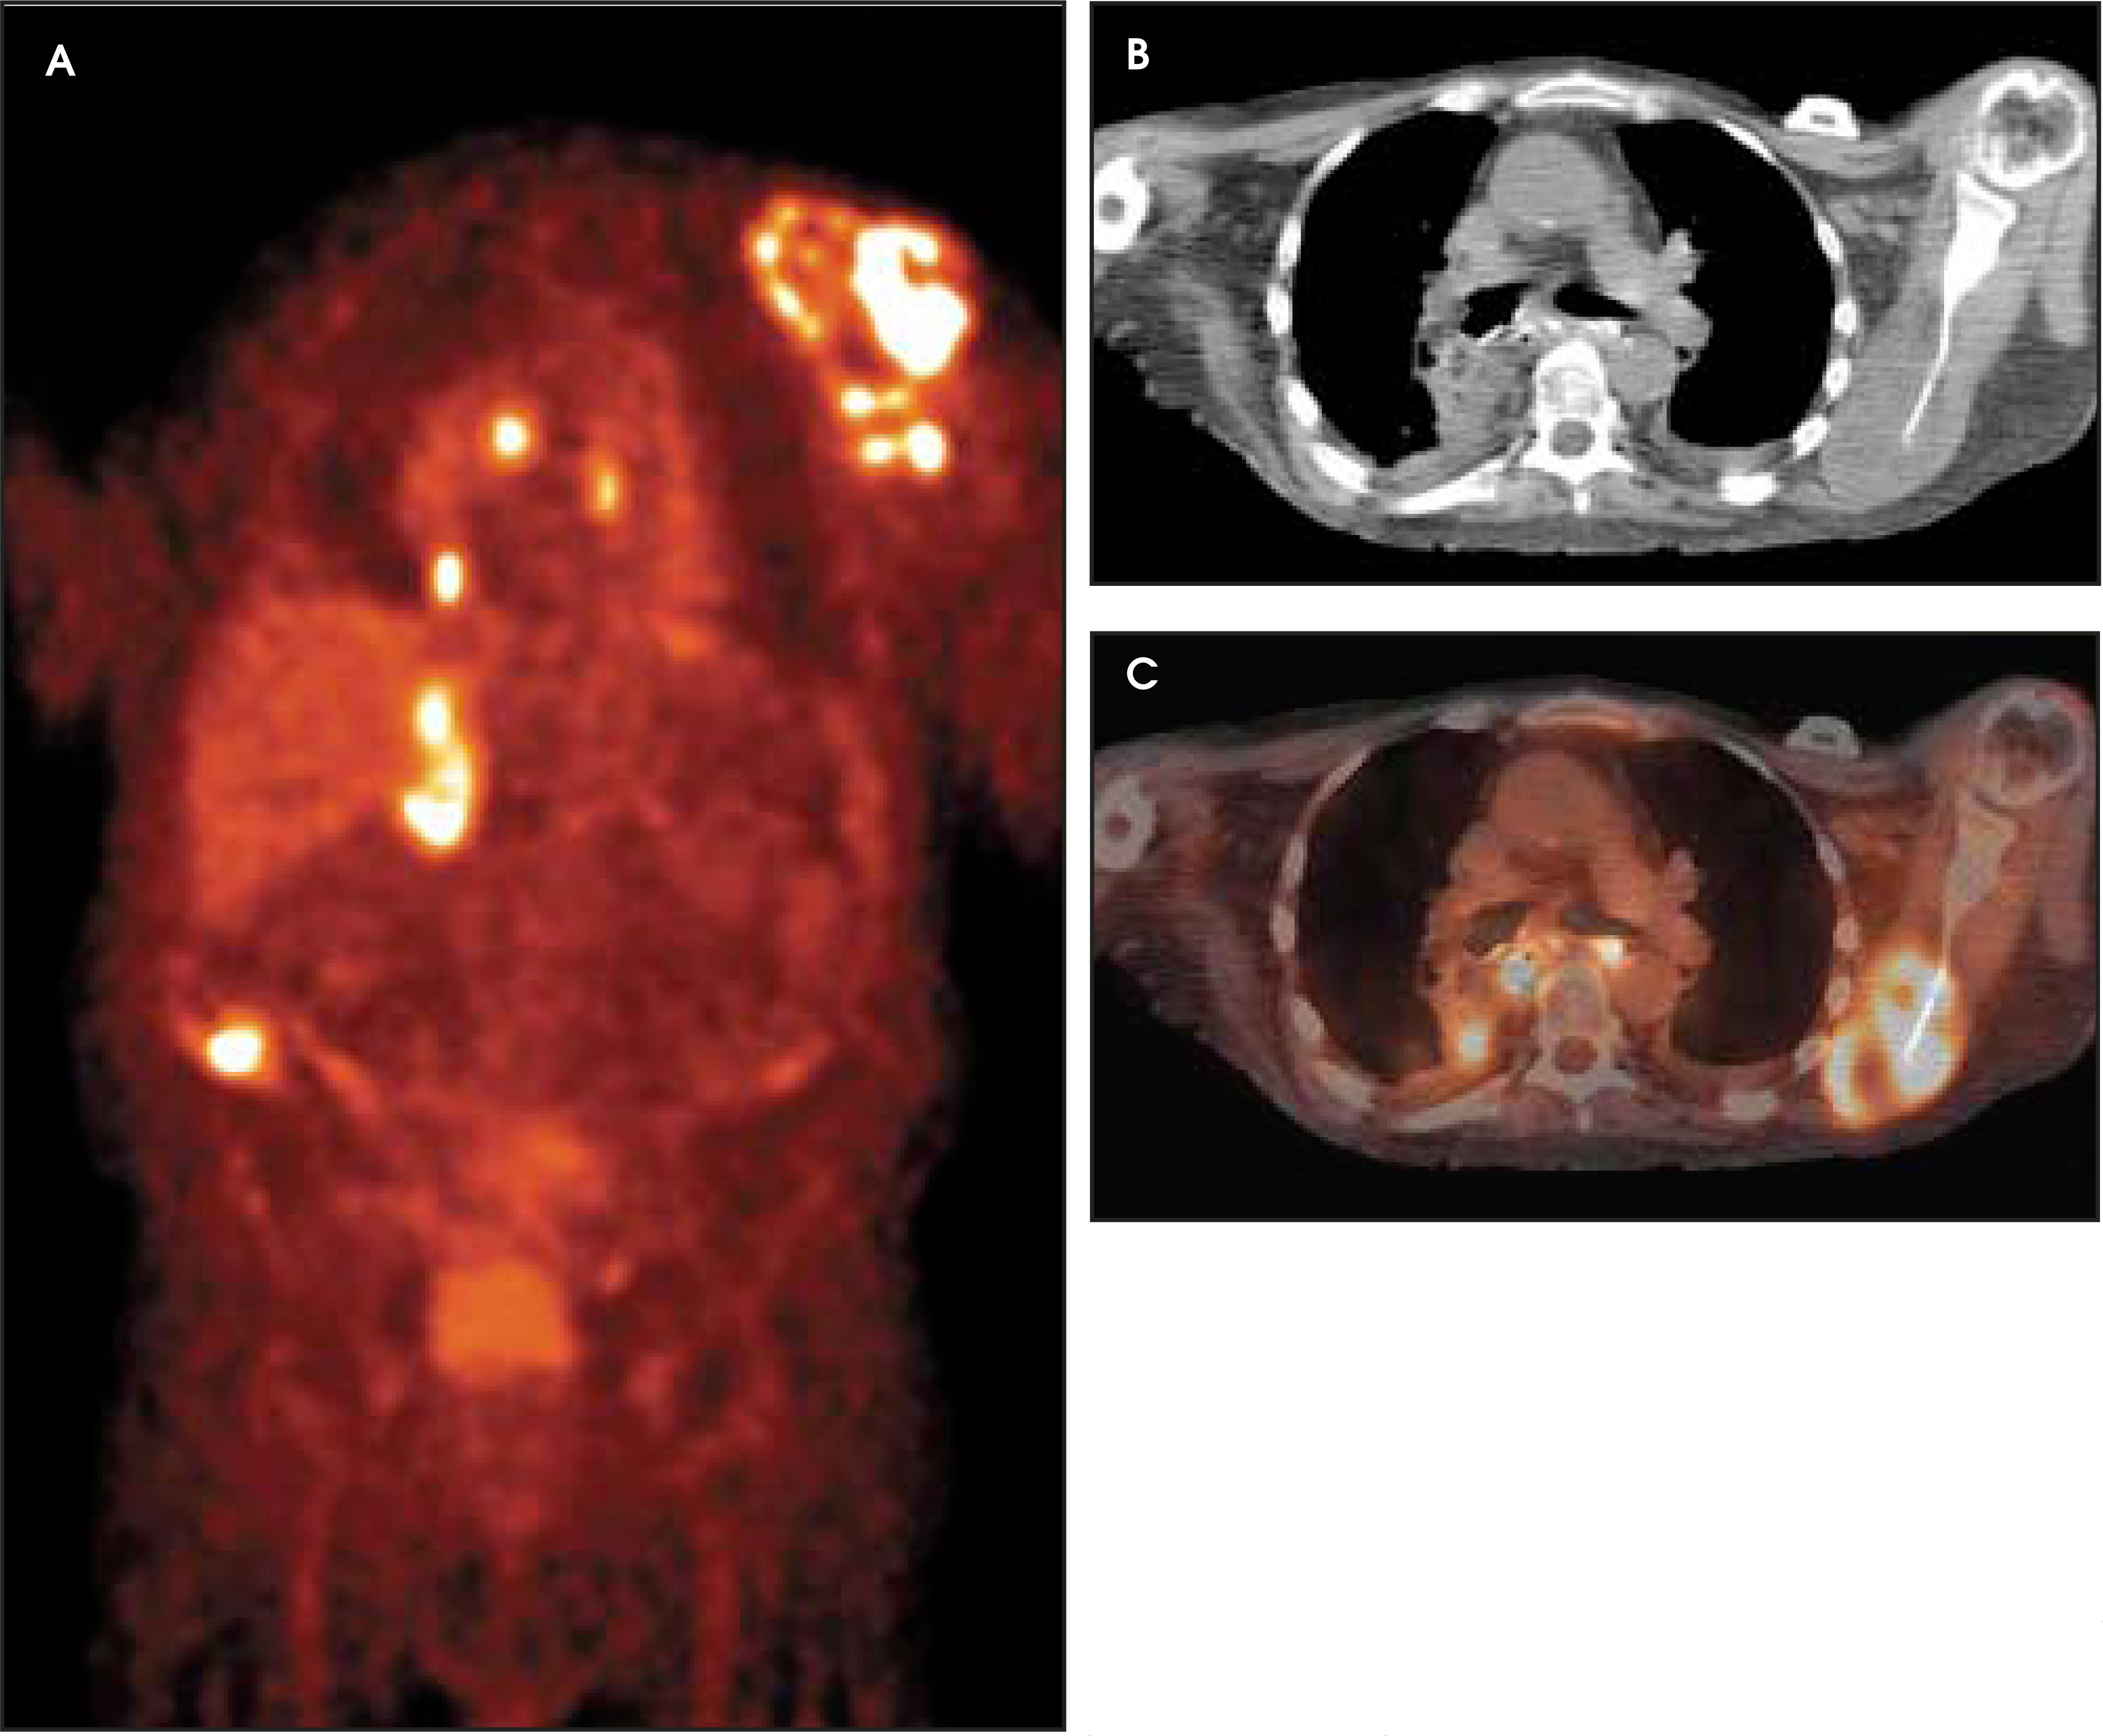
FDG-PET has proved valuable in determining the resectability of esopha-geal cancer. Kole et al22 prospectively evaluated 26 patients and found the diagnostic accuracies in determining resectability to be 65% for CT, 88% for PET, and 92% for CT and PET together. After esophagectomy, a photopenic defect or region of moderate activity may be noted to the right of the mediastinum that results from the gastric pull-up procedure (Figure 4). Surgery performed 4 weeks before scanning may result in false-positive FDG uptake in areas of active infiammation, hence it is best to evaluate postsurgical patients at least 6 weeks after surgery.
Hybrid PET/CT imaging
Dual-modality PET/CT, or hybrid imaging systems (Figures 2 through figure 9), permit the combined acquisition of functional and morphologic datasets within a single examination. Based on accurate image fusion, FDG-PET/CT further increases staging accuracies for many malignancies when compared with either PET alone, or with PET and CT viewed side by side. Bar-Shalom et al30 found PET/CT to be of additional value over CT alone and PET alone in 49% of patients with different oncologic diseases. In this study, patient management was altered by PET/CT in 14% of patients who had been previously studied with PET and CT alone.30
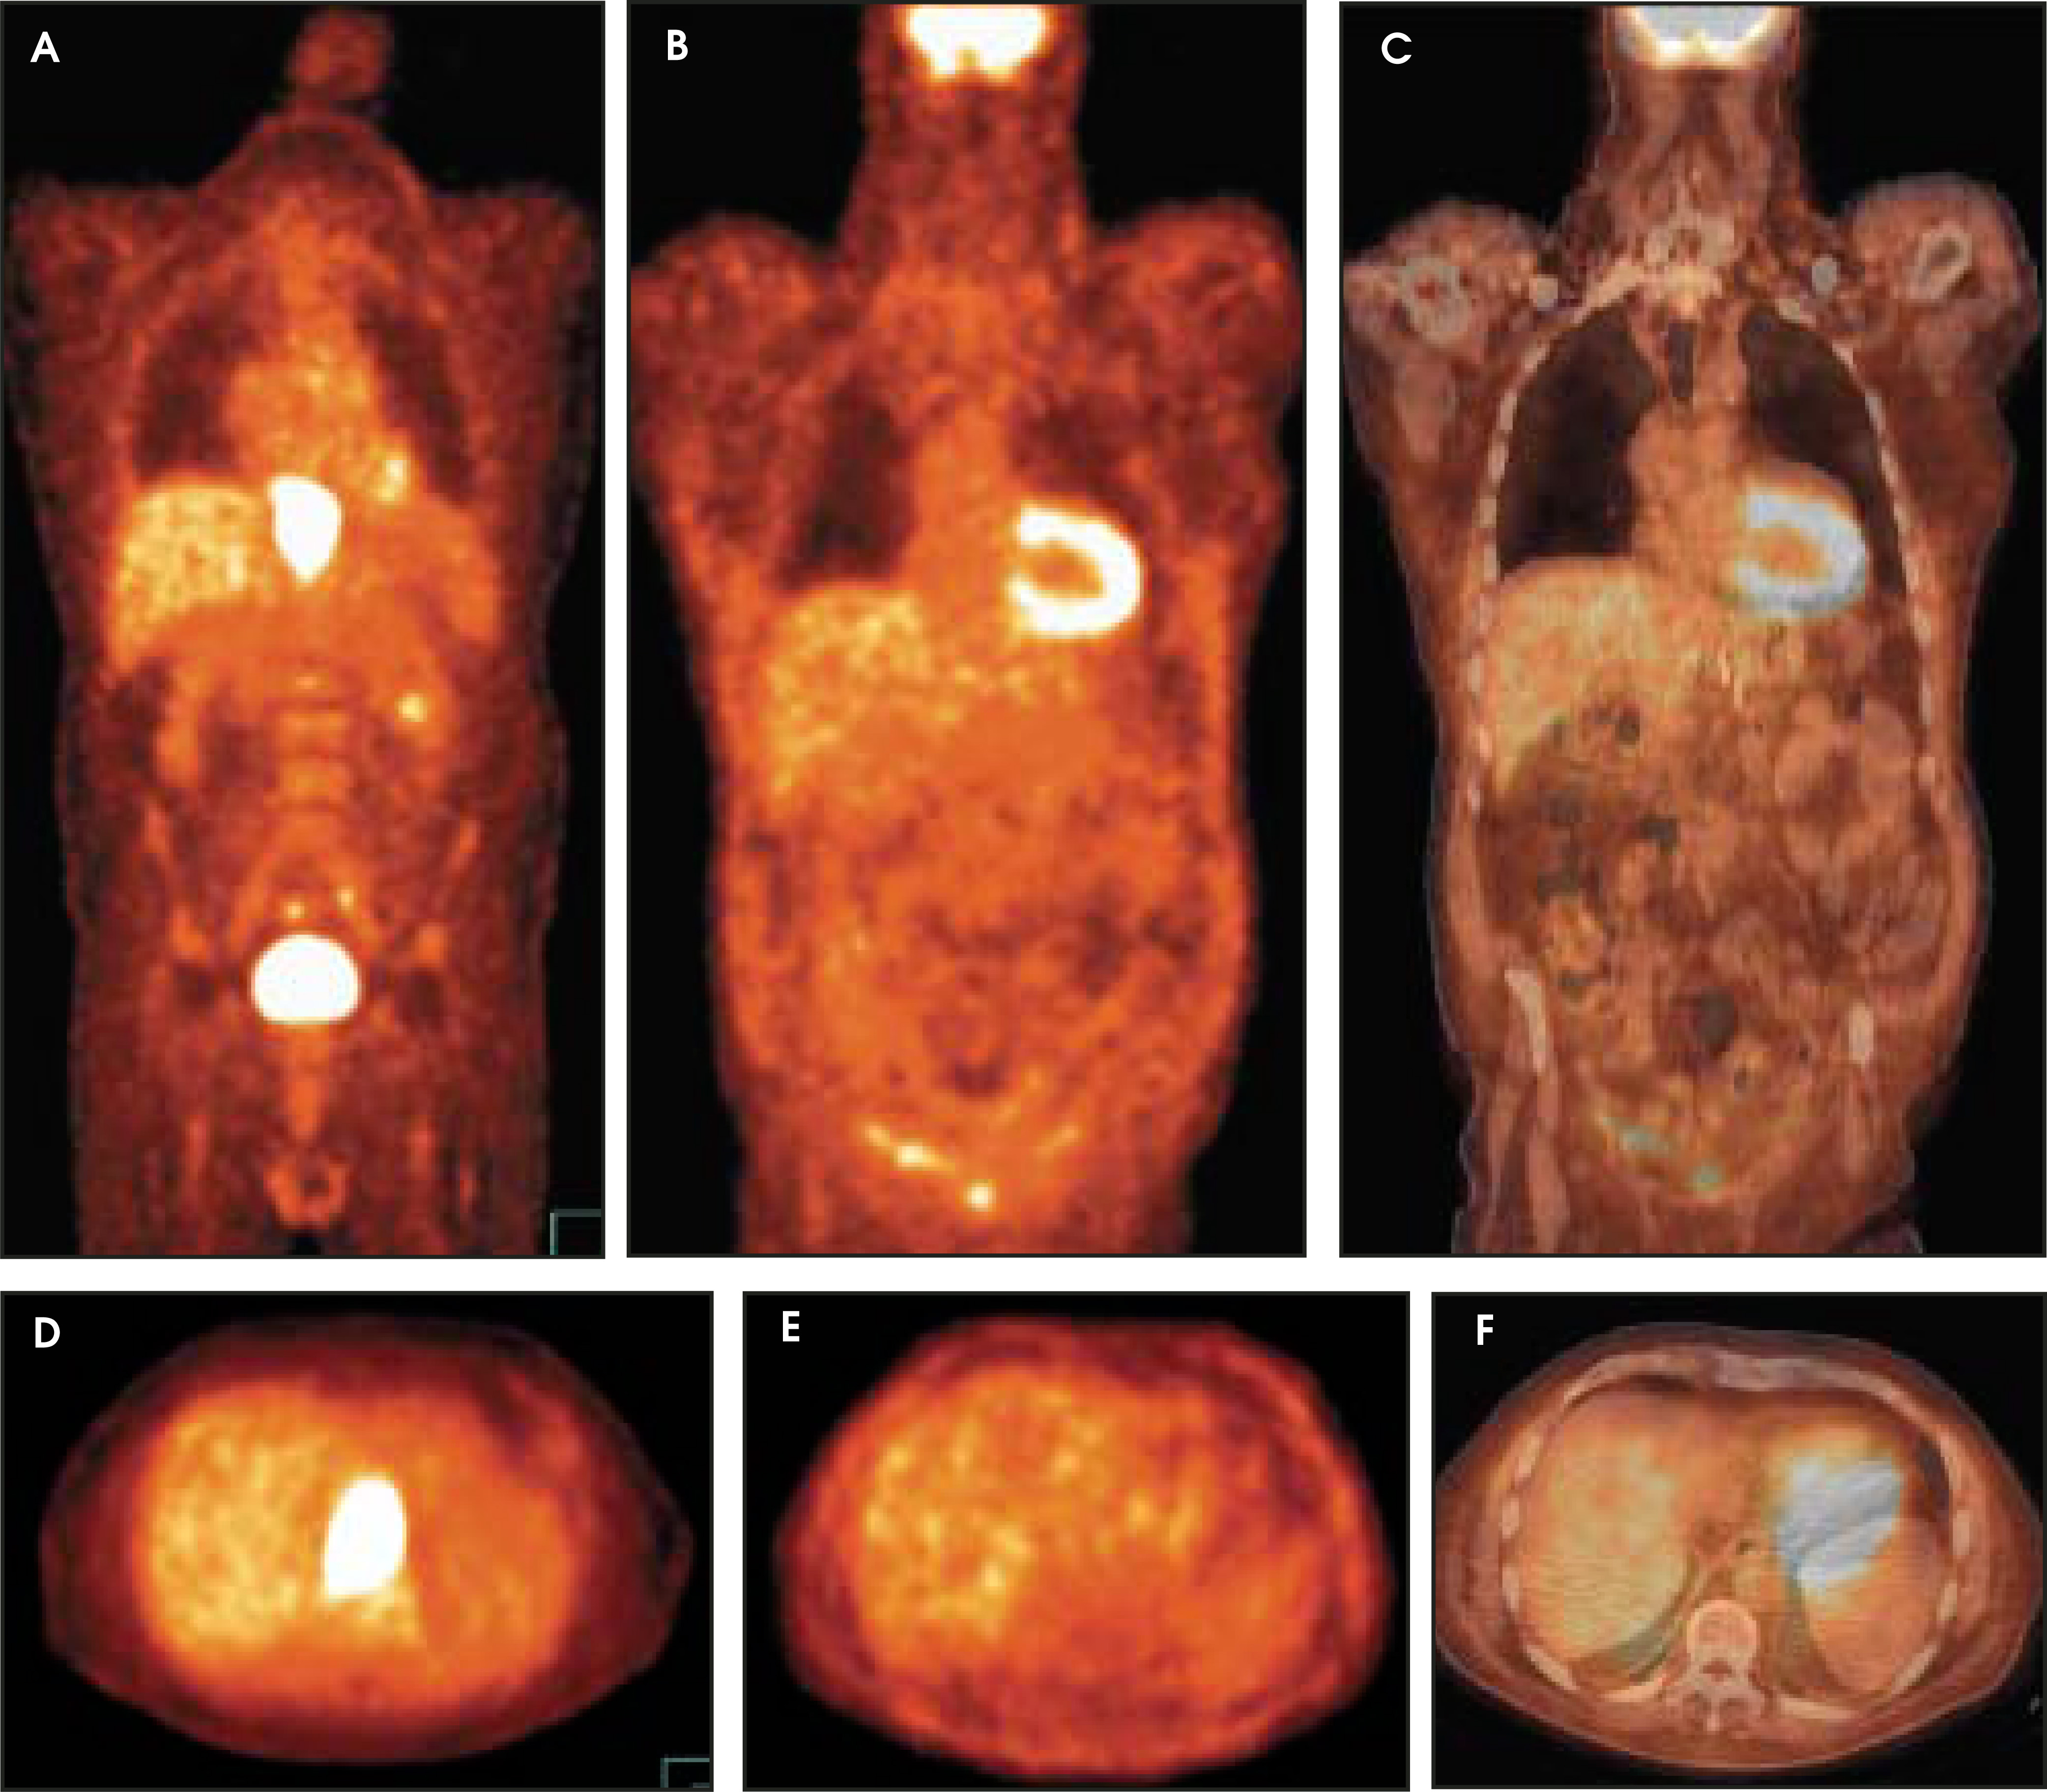
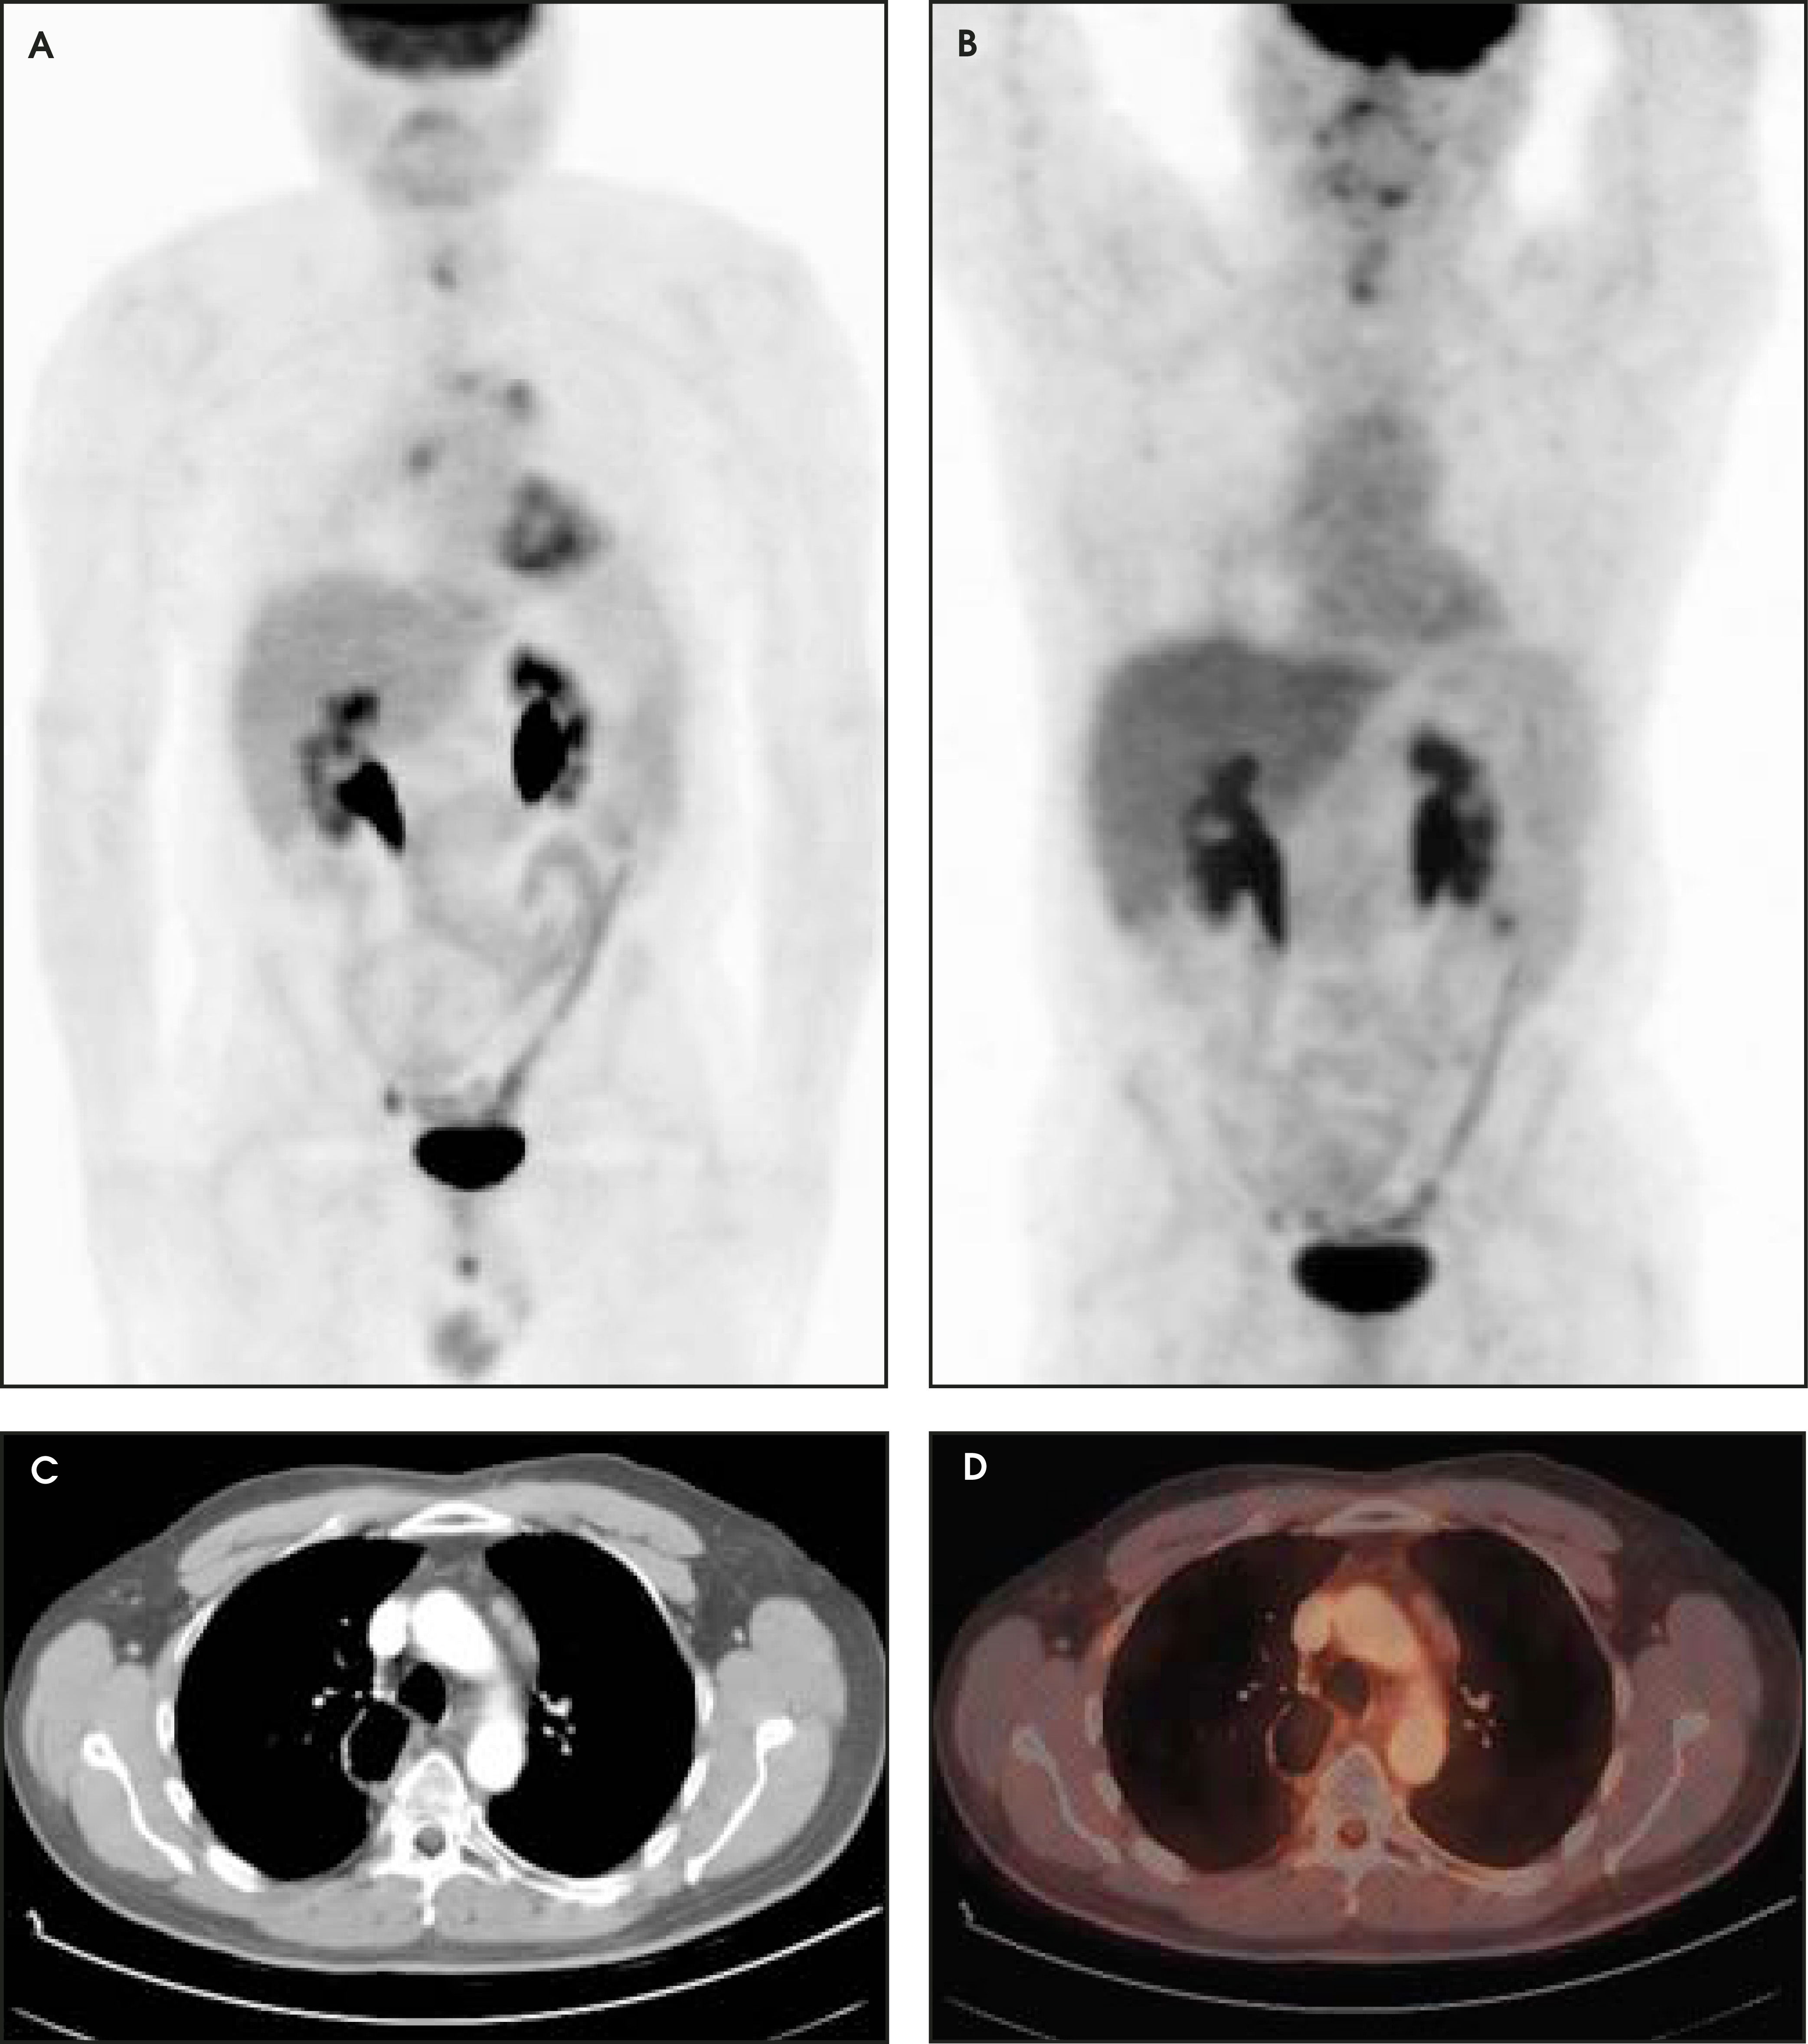
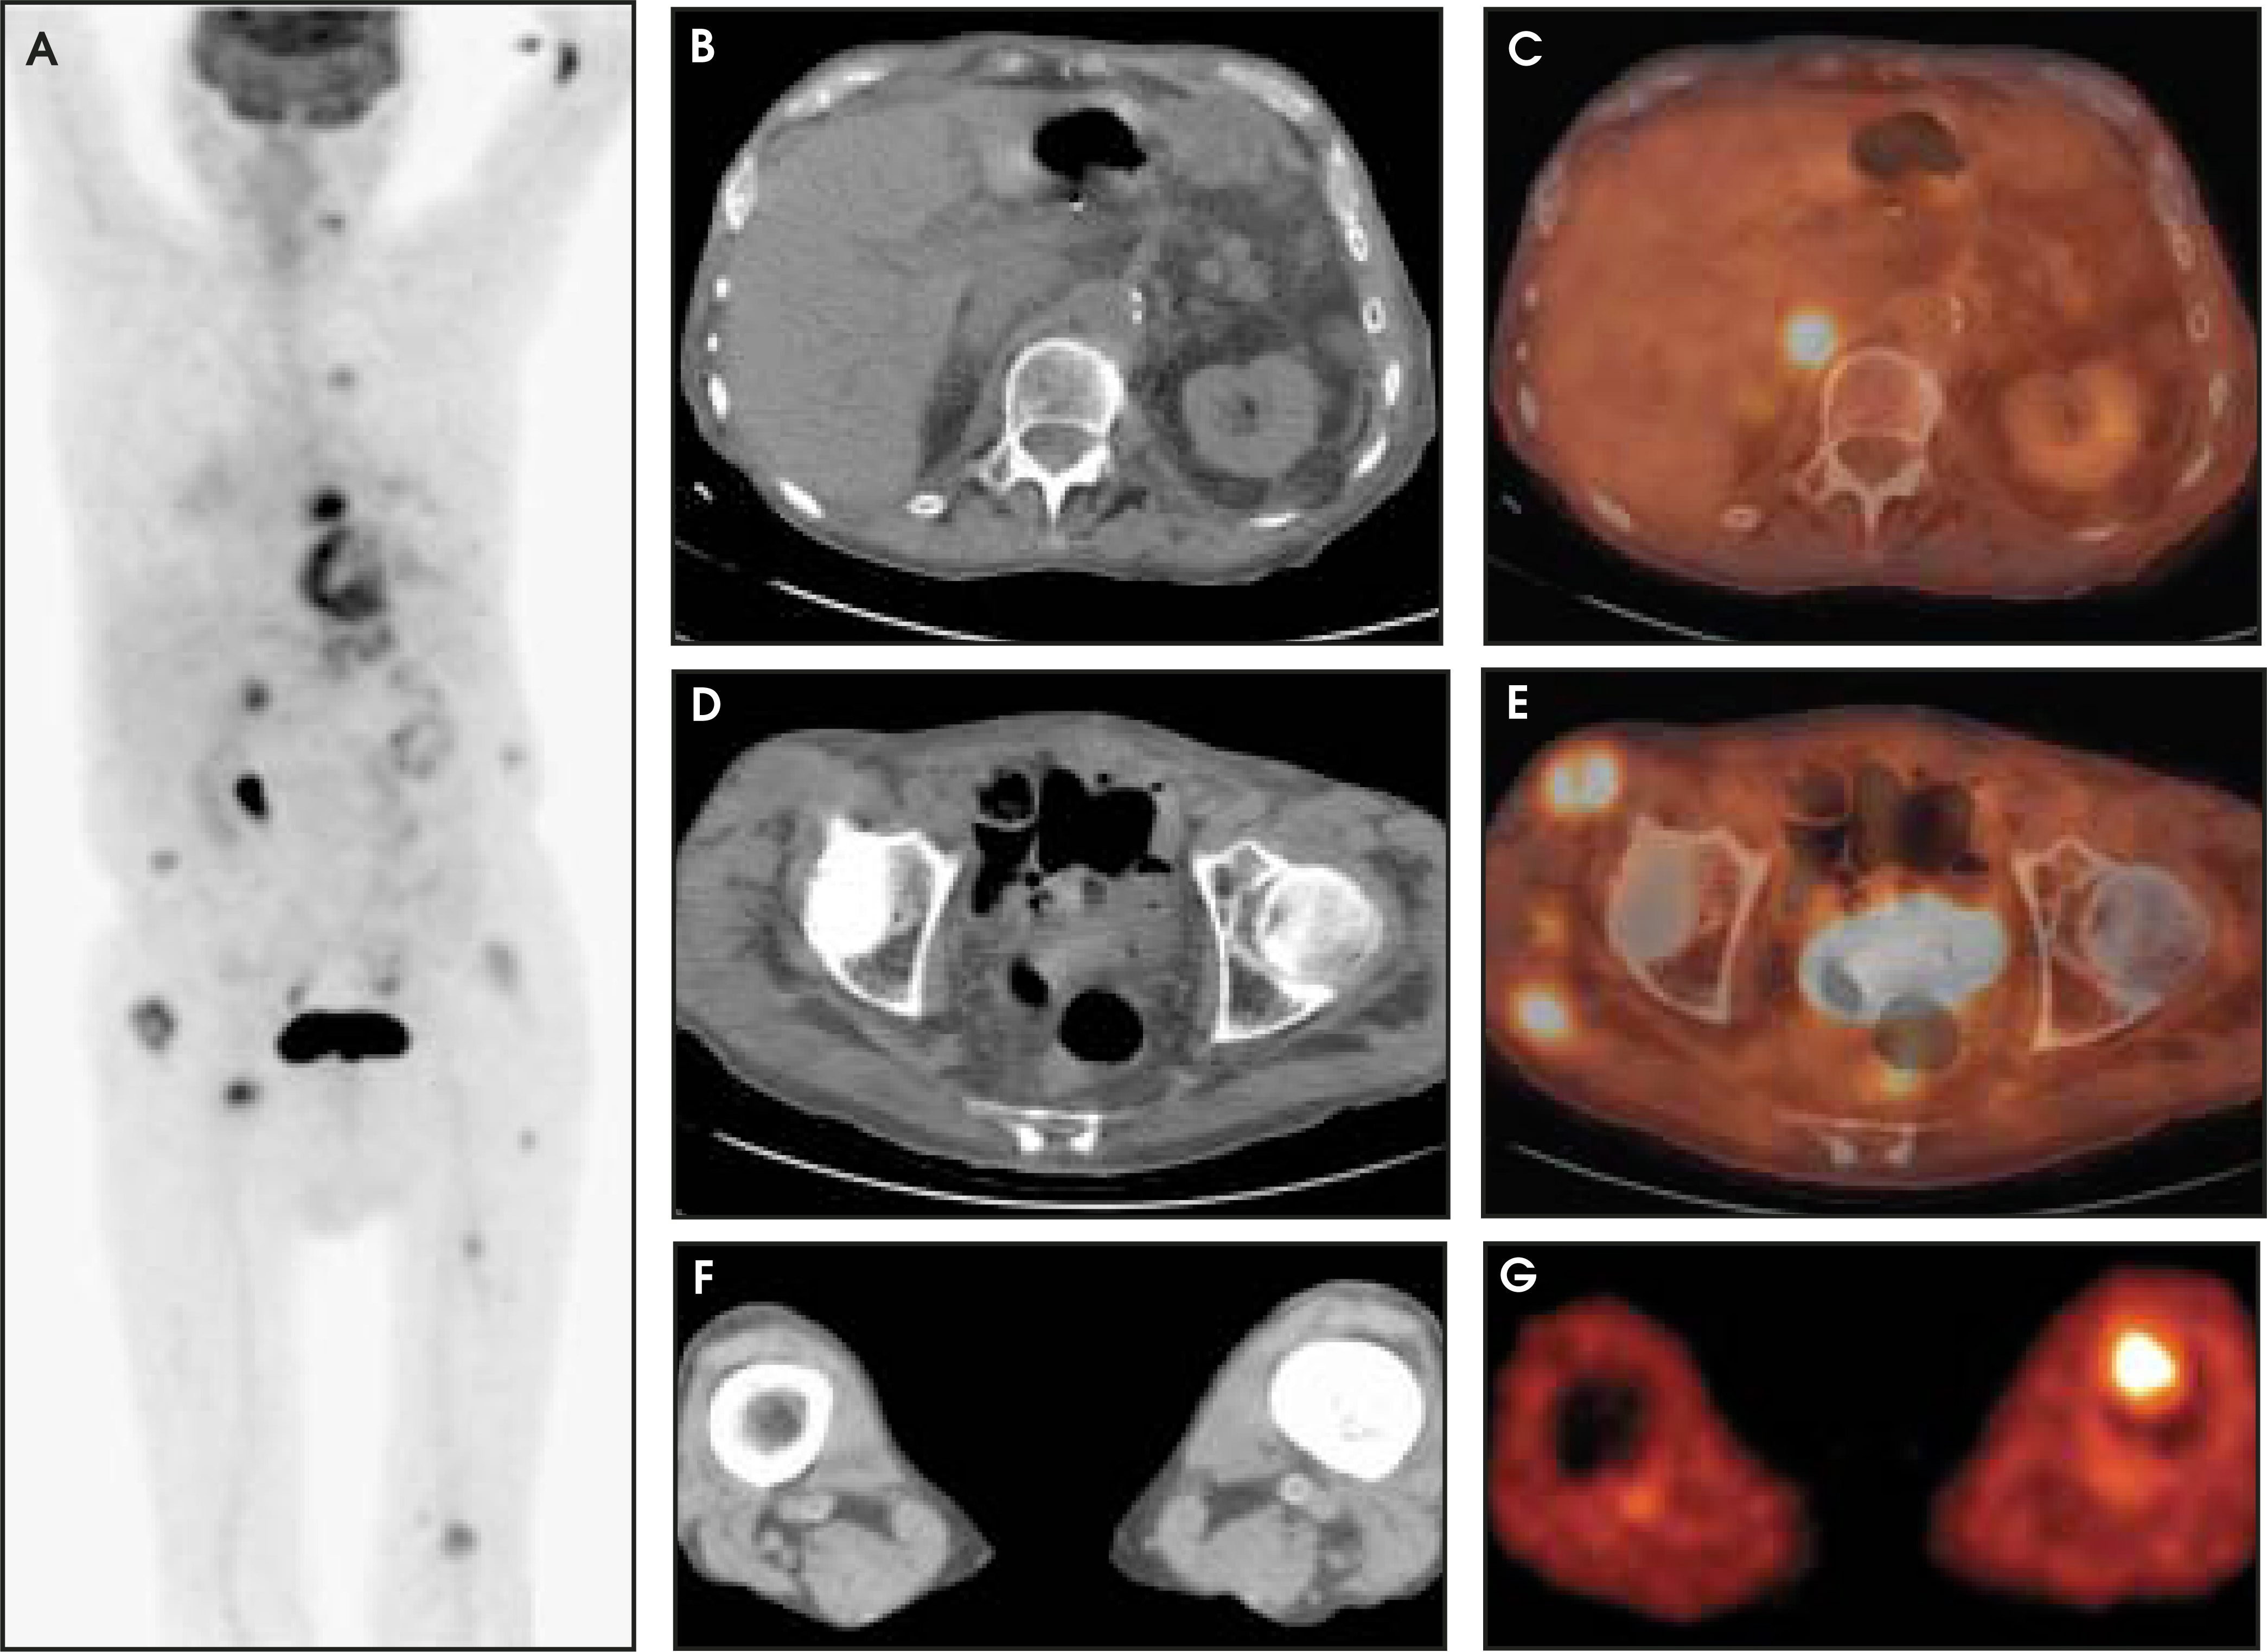
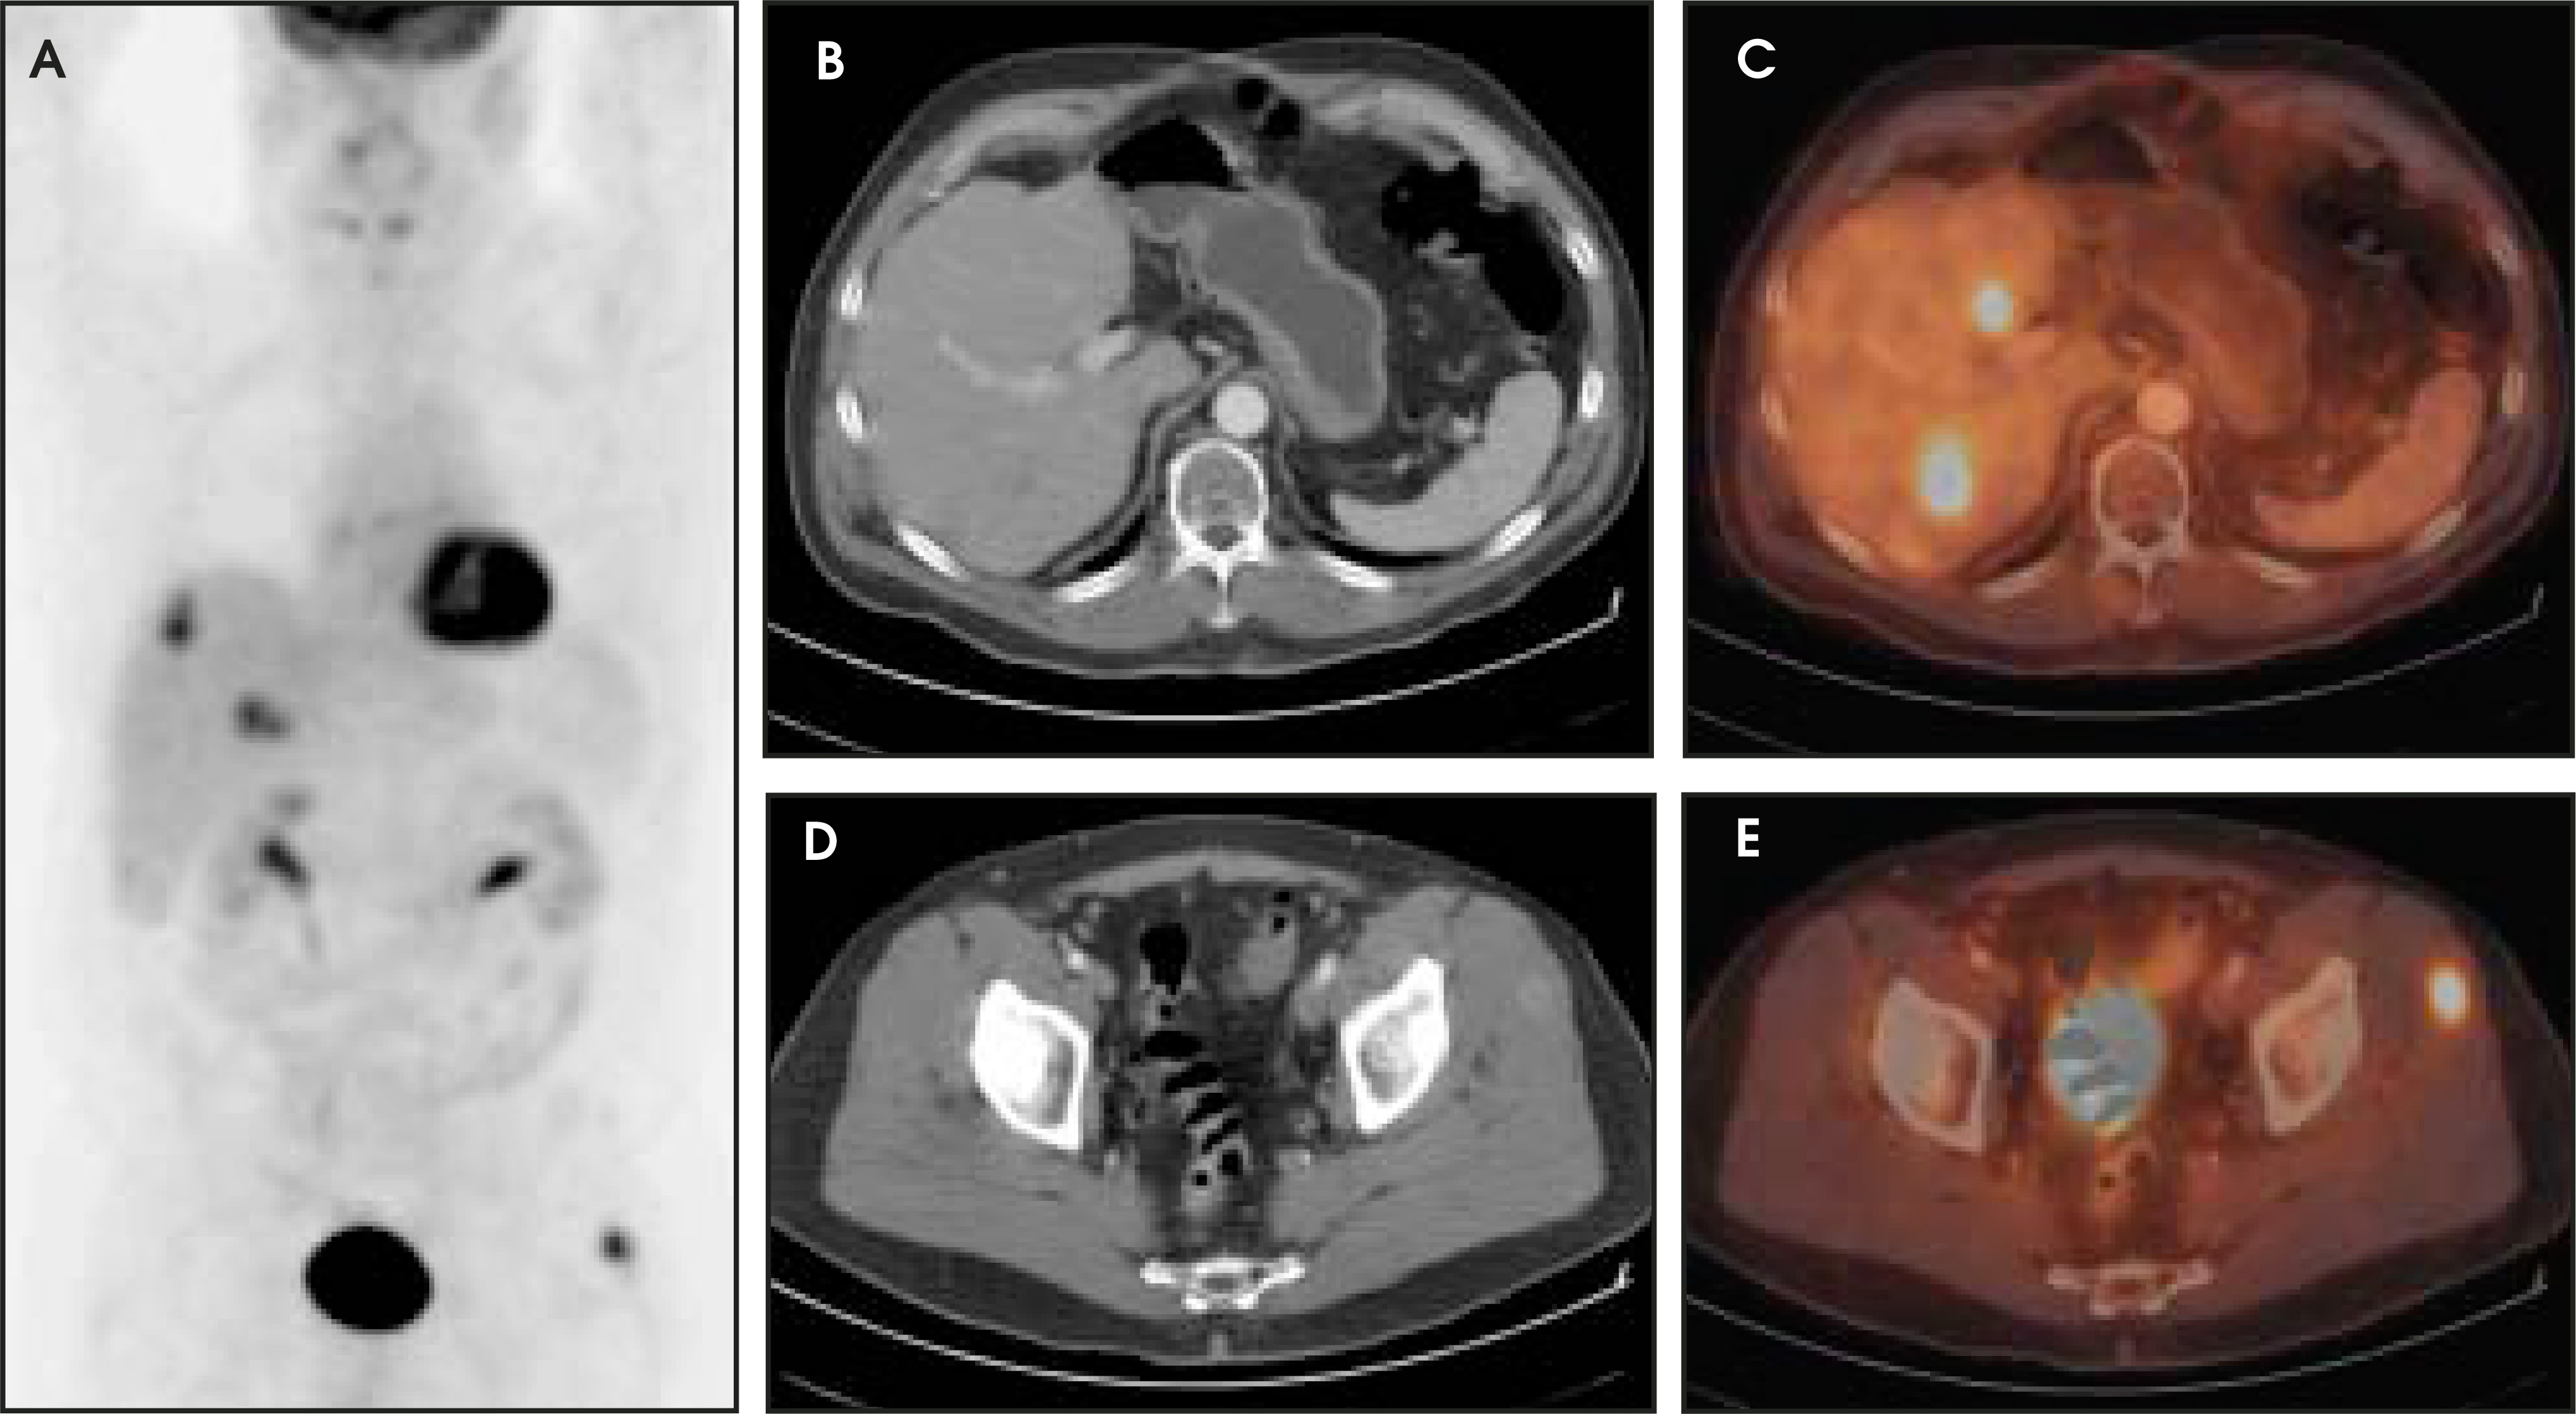
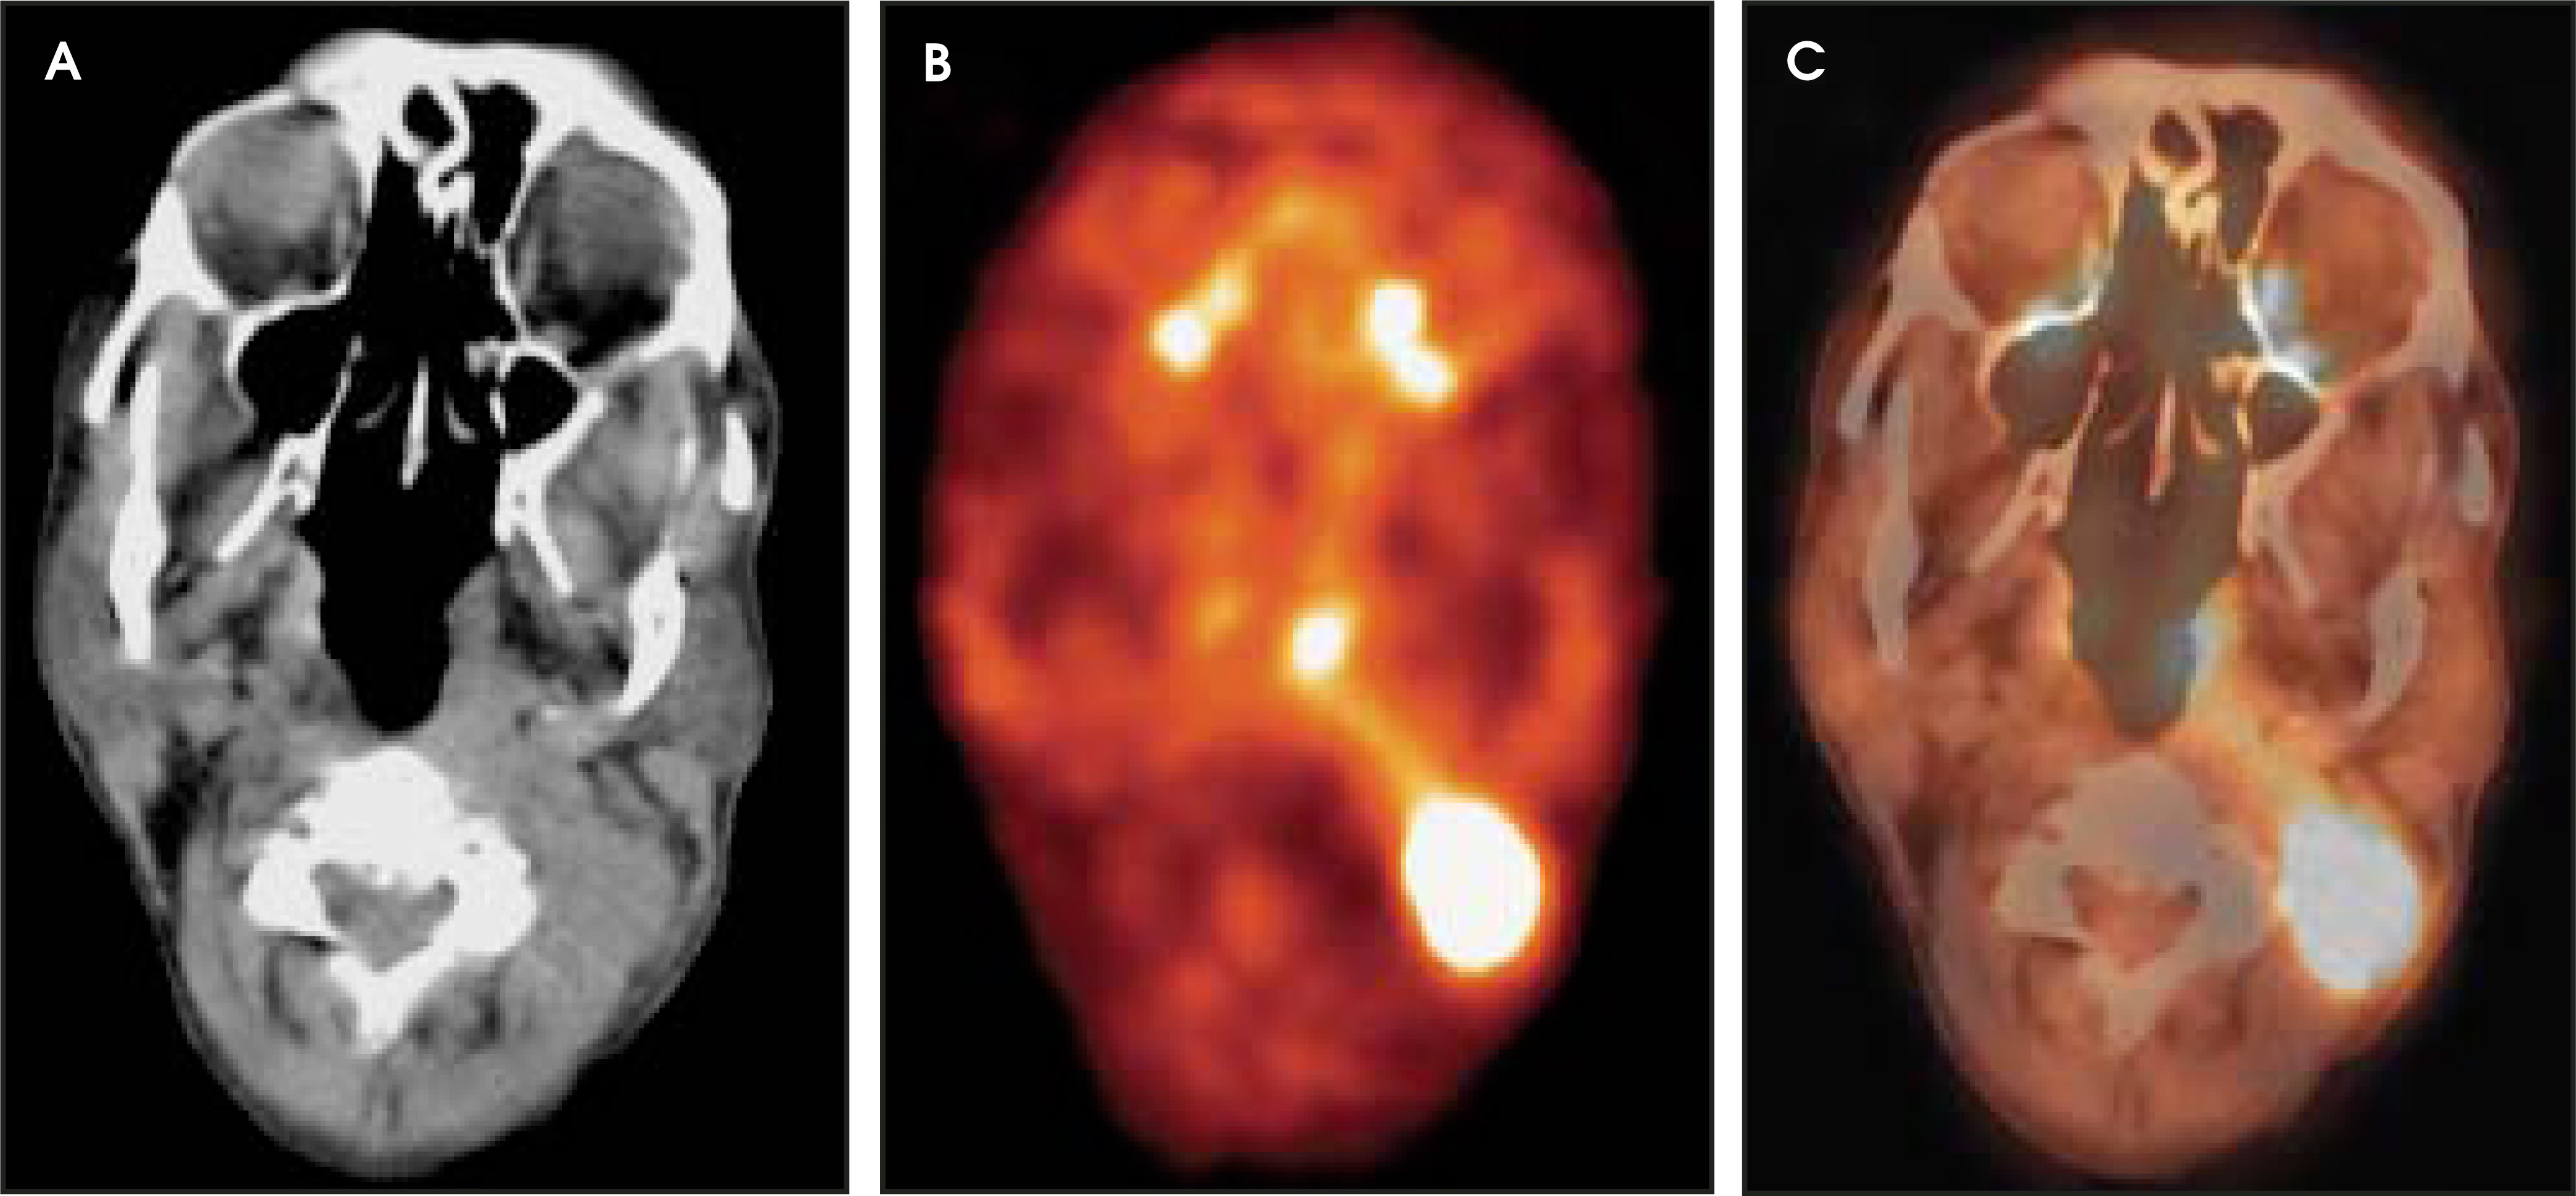
Differentiation of physiologic FDG uptake from pathologic localization may be very difficult, especially in the abdomen and pelvis. Even a small degree of misregistration may lead to a misinterpretation of physiologic uptake. Several advantages are associated with combined PET/CT imaging compared with retrospective or prospective software-based approaches to align complementary image data. Most importantly, the patient undergoing a combined PET/CT examination is not moved between CT and PET acquisition, thus limiting misalignment from repositioning. Dual-modality PET/ CT systems thus provide intrinsic alignment of PET and CT datasets.
A diagnostic, contrast-enhanced PET/ CT scan can increase the value of the CT study beyond anatomic correlation and attenuation correction for PET. The availability of contrast-enhanced CT data improves confidence to accurately localize a PET-positive lesion in approximately 25% of patients.31,32 CT contrast agents and FDG, therefore, do not compete, but rather complement each other in combined PET/CT imaging.
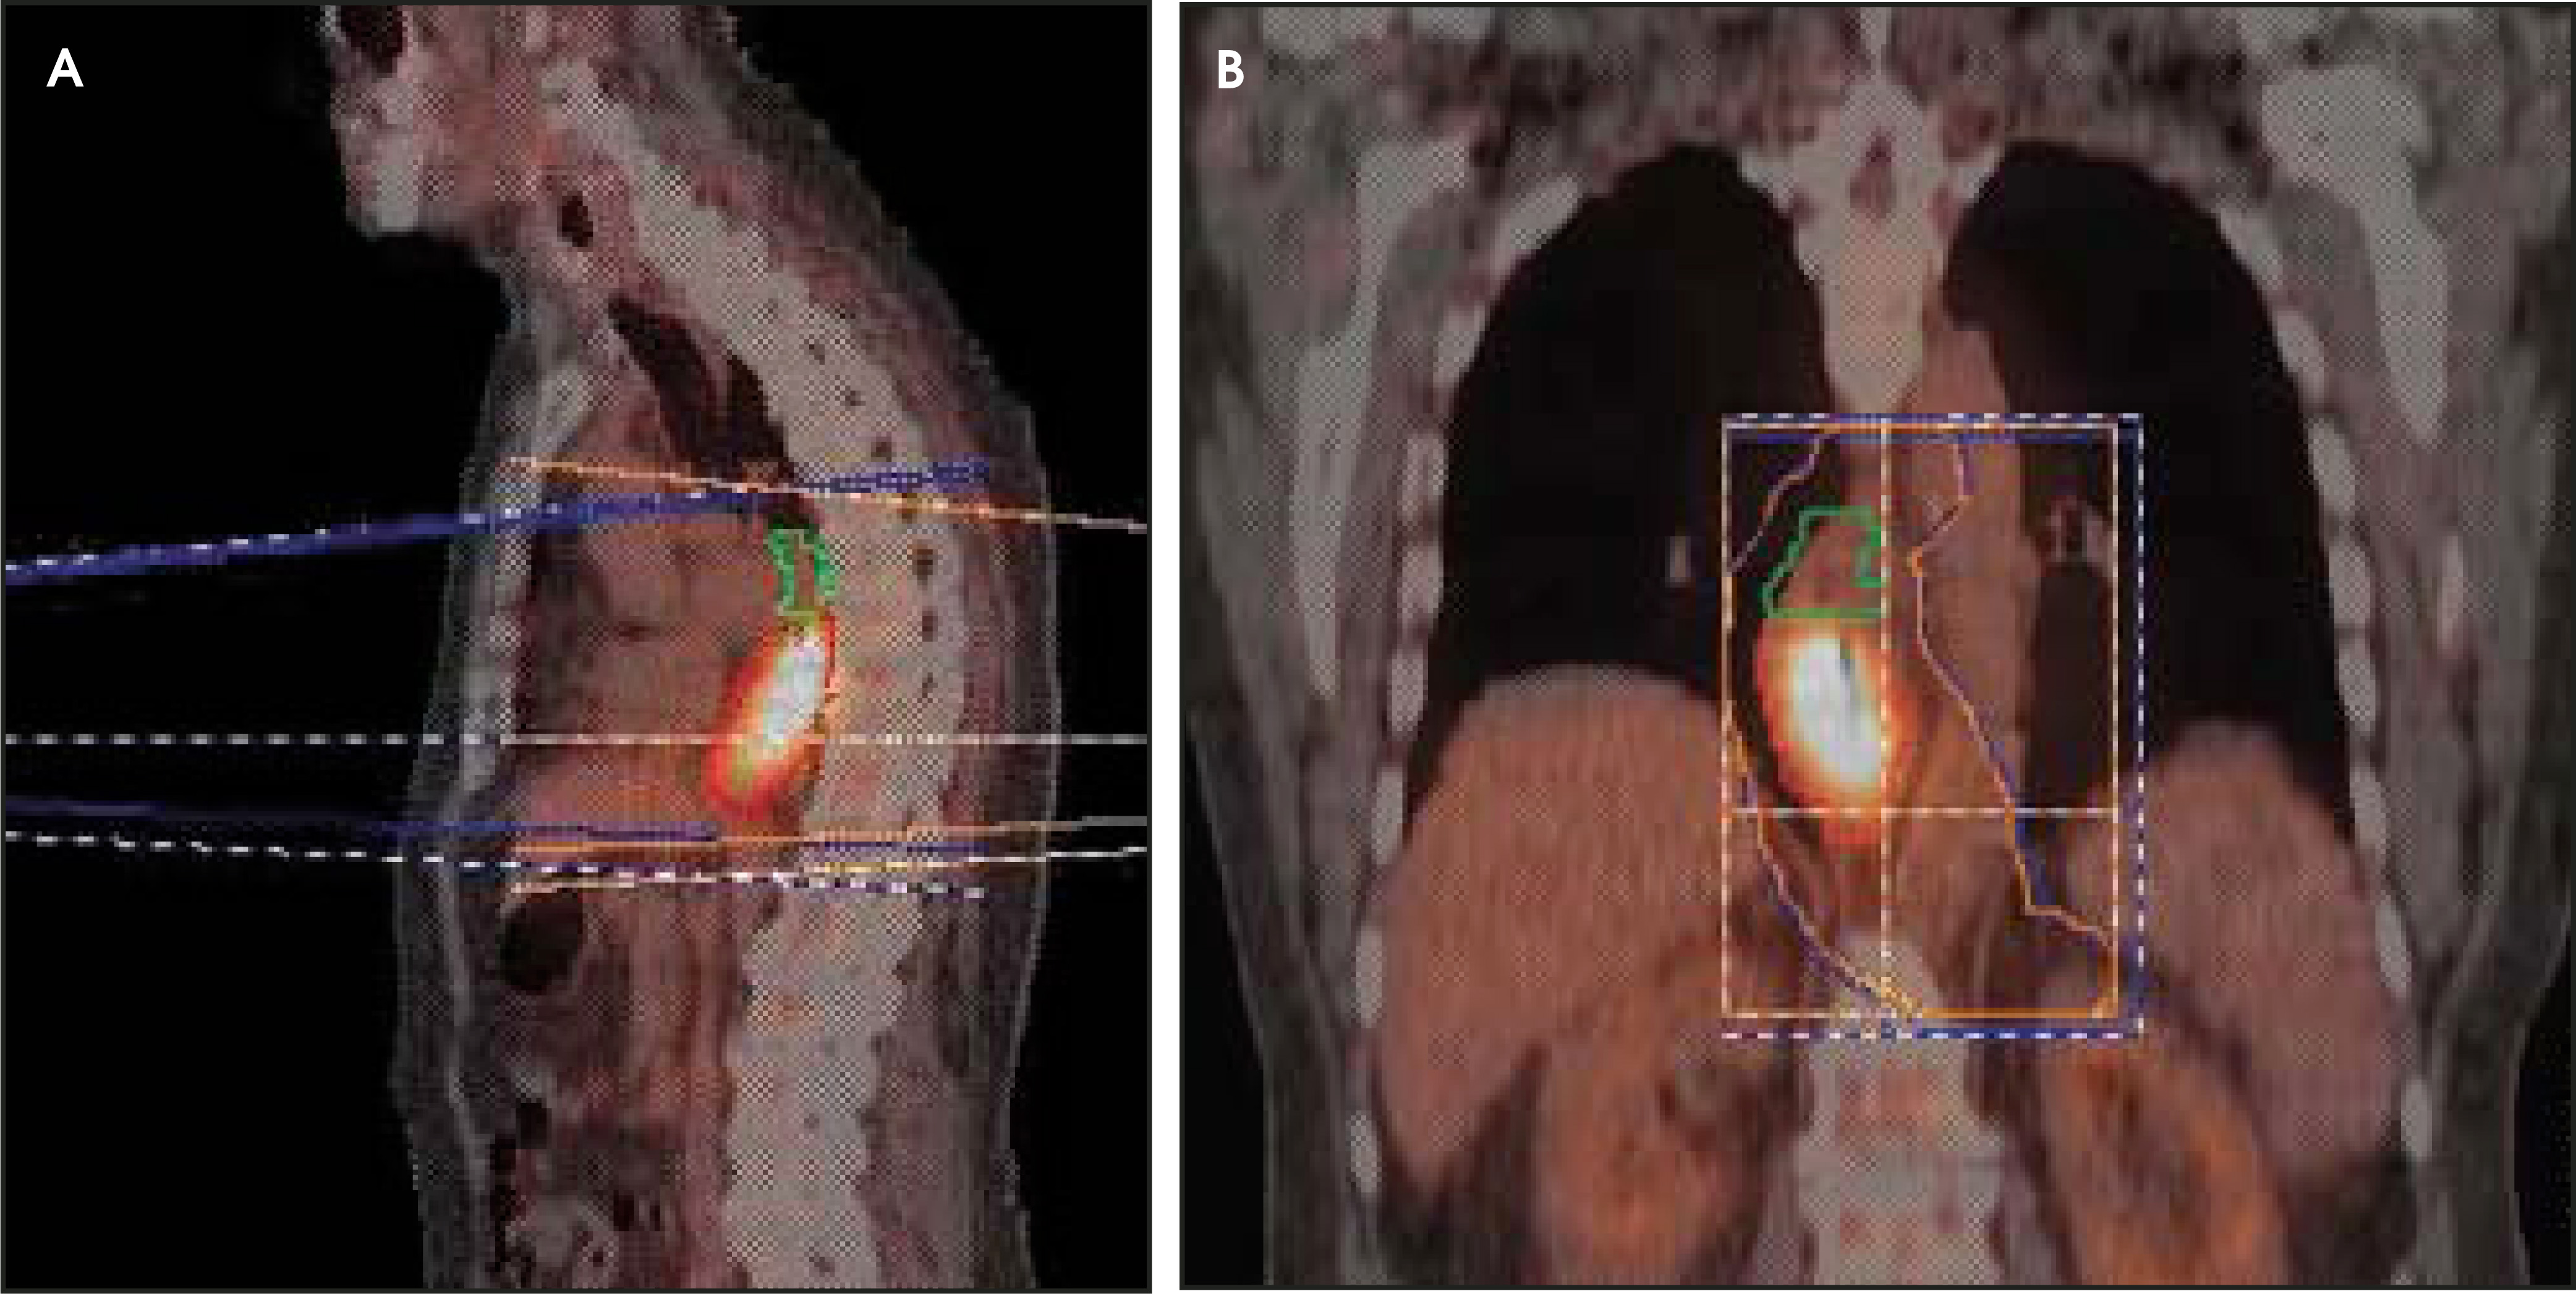
PET/CT can improve the accuracy of PET imaging in distinguishing recur-rent disease from benign posttherapy changes, delineating the anatomic location of metastatic disease, and monitoring therapy response by solving a myriad of problems inherent in the posttherapy assessment of cancer.33 With the use of the pattern of enhanced metabolic activity to facilitate field definition (Figure 10), PET/CT also promises to improve the accuracy of radiation treatment planning.
Evaluation of response to therapy
Metabolic imaging allows the detection of biochemical changes within tumor cells as a means to differentiate between responders and non-responders early in the course of therapy follow-up (Figures 2, and figure 5 through figure 9). This aspect is important, because approximately 50% of patients do not respond to currently available chemotherapy regimens. Early determination of nonresponders is of prime importance, given that modifications in therapy regimens may improve patient outcome and reduce unnecessary therapy toxicity.34
In contrast to histopathologic techniques, PET allows noninvasive quantitative assessment of the entire tumor mass. Furthermore, changes in biologic parameters during therapy can be determined easily by serial PET studies. The use of FDG for monitoring cytotoxic therapy is supported by experimental and patient data that show rapid reduction of metabolic activity during chemotherapy.35-38
There is now evidence that FDG-PET is a sensitive and specific method for determining therapy response and for providing important prognostic information for esophageal cancer. In patients with squamous-cell carcinoma of the esophagus, Nakamura et al39 showed a significant difference in FDG median uptake values between patients who failed to respond and those who had a complete response to radiation therapy. The quantitative decrease in FDG uptake seen after neoadjuvant therapy has been correlated with histopathologic assessment of viable tumor cells, time to disease progression, and overall survival.40-42 Weber et al42 reported that metabolic measurements with 18F-FDG–PET allow early differentiation of responders from nonresponders during preoperative chemotherapy. Clinical response was evaluated after 3 months of therapy with endoscopy and anatomic imaging modalities. The reduction of tumor FDG uptake after 14 days of therapy for responding tumors was significantly different from that for nonresponding tumors. FDG-PET predicted therapy response with a sensitivity and a specificity of 93% and 95%, respectively. The mean survival of responders was not reached during the 2-year period, whereas the mean survival for nonresponders was 13 months.42
The metabolic response measured by changes in posttherapy FDG uptake ratios was found to be a stronger prognostic factor for overall survival than was the extent of lymph node involvement determined by pretherapy FDG-PET.43 After neoadjuvant radiotherapy, the decline in FDG uptake can characterize tumor response; however, differentiating partial responders from complete responders can be difficult during or immediately after radiation therapy because of infiammatory changes. In patients who have under- gone recent radiotherapy, 8 to 12 weeks should elapse before an FDG-PET study is done to avoid false-positive findings of radiation-induced esophagitis.44
The accurate spatial localization offered by PET/CT provides an even better assessment of the response to treatment and changes clinical management in up to 30% of cancer patients.45 After therapy, subtle PET findings falsely attributed to physiologic uptake may be correctly identified as residual disease after correlation with simultaneously acquired morphologic data. Alternatively, equivocal CT findings of either recurrent tumor or posttherapy fibrosclerosis now can be distinguished with the help of the additional information provided by FDG-PET data.33
Conclusion
Positron emission tomographic scanning has a well-established role in the diagnosis, initial staging, and restaging of esophageal carcinoma. FDG-PET provides an excellent means to detect distant metastases and has had significant impact on patient management. Hybrid PET/CT can improve the accuracy of PET imaging in distinguishing recurrent disease from benign posttherapy changes, delineating the anatomic location of metastatic disease, and monitoring therapy response. Contrast-enhanced PET/CT can provide fully diagnostic morphologic and functional data in a single session, rendering additional diagnostic CT unnecessary. CT contrast agents and FDG complement each other in combined PET/CT imaging. Finally, there is strong evidence that FDG-PET can determine esophageal cancer therapy response and provide important prognostic information. As the technology of hybrid imaging advances with new positron emitting radiopharmaceuticals and multidetector CT systems, the impact on the diagnosis and management of esophageal cancer will continue to grow.
References
- Daly J, Fry W, Little A. Esophageal cancer: Results of an American college of surgeons patient care evaluation study. J Am Coll Surg. 2000;190:562-572.
- Siewert J, Stein H, Feith M. Histologic tumor type is an independent prognostic parameter in esophageal cancer: Lessons from more than 1,000 consecutive resections at a single center in the Western world. Ann Surg. 2001;234:360-367.
- Terry P, Lagergren J, Ye W. Antioxidants and cancers of the esophagus and gastric cardia. Int J Cancer. 2000;87:750-754.
- Chow W, Finkle W, McLaughlin J. The relation of gastroesophageal reflux disease and its treatment to adenocarcinomas of the esophagus and gastric cardia. JAMA. 1995;274:474-477.
- Day J, Richter J. Medical and surgical conditions predisposing to gastroesophageal reflux disease. Gastroenterol Clin North Am. 1990;19:587-607.
- Shaheen N, Ransohoff D. Gastroesophageal reflux, Barrett esophagus, and esophageal cancer: Clinical applications. JAMA. 2002;287:1982-1986.
- Ahsan H, Neugut A. Radiation therapy for breast cancer and increased risk for esophageal carcinoma. Ann Intern Med. 1998;128:114-117.
- Danoff B, Cooper J, Klein M. Primary adenocarcinoma of the upper oesophagus. Clin Radiol. 1978;29:519-522.
- Enzinger P, Mayer R. Esophageal cancer. N Engl J Med. 2003;349:2241-2252.
- Pearson J. The present status and future potential of radiotherapy in the management of esophageal cancer. Cancer. 1977;39(2 suppl):882-890.
- Ojala K, Sorri M, Jokinen K, Kairaluoma M. Symptoms of carcinoma of the oesophagus. Med J Aust. 1982;1:384-385.
- Skehan S, Brown A, Thompson M. Imaging features of primary and recurrent esophageal cancer at FDG PET. RadioGraphics. 2000;20:713-723.
- Botet J, Lightdale C, Zauber A. Preoperative staging of gastric cancer: Comparison of endoscopic US and dynamic CT. Radiology. 1991;181:426-432.
- Tio T, Coene P, Schouwink M, Tytgat G. Esophagogastric carcinoma: Preoperative TNM classification with endosonography. Radiology. 1989;173:411-417.
- Ziegler K, Sanft C, Zeitz M. Evaluation of endosonography in TN staging of oesophageal cancer. Gut. 1991;32:16-20.
- Krasna M, Flowers J, Attar S, McLaughlin J. Combined thoracoscopic/laparoscopic staging of esophageal cancer. J Thorac Cardiovasc Surg. 1996;111:800-806.
- Luketich J, Schauer P, Urso K. Minimally invasive surgical biopsy confirms PET findings in esophageal cancer. Surg Endosc. 1997;11:1213-1215.
- Heidemann J, Schilling M, Schmassmann A. Accuracy of endoscopic ultrasonography in preoperative staging of esophageal carcinoma. Dig Surg. 2000;17:219-224.
- Kelly S, Harris K, Berry E. A systematic review of the staging performance of endoscopic ultrasound in gastro-oesophageal carcinoma. Gut. 2001;49:534-539.
- Rice T, Zuccaro G, Adelstein D. Esophageal carcinoma: Depth of tumor invasion is predictive of regional lymph node status. Ann Thorac Surg. 1998;65:787-792.
- Griffith J, Chan A, Chow L. Assessing chemotherapy response of squamous cell oesophageal carcinoma with spiral CT. Br J Radiol. 1999;72:678-684.
- Kole A, Plukker J, Nieweg O, Vaalburg W. Positron emission tomography for staging of oesophageal and gastroesophageal malignancy. Br J Cancer. 1998;78:521-527.
- Rankin S, Taylor H, Cook G, Mason R. Computed tomography and positron emission tomography in the pre-operative staging of oesophageal carcinoma. Clin Radiol. 1998;53:659-665.
- Duhaylongsod F, Lowe V, Patz E. Lung tumor growth correlates with glucose metabolism measured by fluoride-18 fluorodeoxyglucose positron emission tomography. Ann Thorac Surg. 1995;60:1348-1352.
- Shreve P, Anzai Y, Wahl R. Pitfalls in oncologic diagnosis with FDG PET imaging: Physiologic and benign variants. RadioGraphics. 1999;19:61-77.
- Flanagan F, Dehdashti F, Siegel B. Staging of esophageal cancer with 18F-fluorodeoxyglucose positron emission tomography. AJR Am J Roentgenol. 1997;168:417-424.
- Luketich J, Schauer P, Meltzer C. Role of positron emission tomography in staging esophageal cancer. Ann Thorac Surg. 1997;64:765-769.
- Rankin S, Taylor H, Cook G, Mason R. Computed tomography and positron emission tomography in the pre-operative staging of oesophageal carcinoma. Clin Radiol. 1998;53:659-665.
- Kole A, Plukker J, Nieweg O, Vaalburg W. Positron emission tomography for staging of oesophageal and gastroesophageal malignancy. Br J Cancer. 1998;78:521-527.
- Bar-Shalom R, Yefremov N, Guralnik L. Clinical performance of PET/CT in evaluation of cancer: Additional value for diagnostic imaging and patient management. J Nucl Med. 2003;44:1200-1209.
- Antoch G, Freudenberg L, Beyer T. To enhance or not to enhance? 18F-FDG and CT contrast agents in dual-modality 18F-FDG PET/CT. J Nucl Med. 2004;45(suppl 1):56S-65S.
- Beyer T, Antoch G, Muller S. Acquisition protocol considerations for combined PET/CT imaging. J Nucl Med. 2004;45(suppl 1):25S-35S.
- Koshy M, Esiashvilli N, Landry J. Multiple management modalities in esophageal cancer: Epidemiology, presentation and progression, work-up, and surgical approaches. Oncologist. 2004;9:137-146.
- Law S, Fok M, Chow S. Preoperative chemotherapy versus surgical therapy alone for squamous cell carcinoma of the esophagus: A prospective randomized trial. J Thorac Cardiovasc Surg. 1997;114:210-217.
- Findlay M, Young H, Cunningham D. Noninvasive monitoring of tumor metabolism using fluorodeoxyglucose and positron emission tomography in colorectal cancer liver metastases: Correlation with tumor response to fluorouracil. J Clin Oncol. 1996;14:700-708.
- Romer W, Hanauske A, Ziegler S. Positron emission tomography in non-Hodgkin's lymphoma: Assessment of chemotherapy with fluorodeoxyglucose. Blood. 1998;91:4464-4471.
- Schelling M, Avril N, Nahrig J. Positron emission tomography using [(18)F]Fluorodeoxyglucose for monitoring primary chemotherapy in breast cancer. J Clin Oncol. 2000;18:1689-1695.
- Yoshioka T, Takahashi H, Oikawa H. Influence of chemotherapy on FDG uptake by human cancer xenografts in nude mice. J Nucl Med. 1997;38:714-717.
- Nakamura R, Obara T, Katsuragawa S. Failure in presumption of residual disease by quantification of FDG uptake in esophageal squamous cell carcinoma immediately after radiotherapy. Radiat Med. 2002;20:181-186.
- Brucher B, Weber W, Bauer M. Neoadjuvant therapy of esophageal squamous cell carcinoma: Response evaluation by positron emission tomography. Ann Surg. 2001;233:300-309.
- Kato H, Kuwano H, Nakajima M. Usefulness of positron emission tomography for assessing the response of neoadjuvant chemoradiotherapy in patients with esophageal cancer. Am J Surg. 2002;184:279-283.
- Weber W, Ott K, Becker K. Prediction of response to preoperative chemotherapy in adenocarcinomas of the esophagogastric junction by metabolic imaging. J Clin Oncol. 2001;19:3058-3065.
- Flamen P, Van C, Lerut A. Positron emission tomography for assessment of the response to induction radiochemotherapy in locally advanced oesophageal cancer. Ann Oncol. 2002;13:361-368.
- Kole A, Plukker J, Nieweg O, Vaalburg W. Positron emission tomography for staging of oesophageal and gastroesophageal malignancy. Br J Cancer. 1998;78:521-527.
- Reed C, Eloubeidi M. New techniques for staging esophageal cancer. Surg Clin North Am. 2002;82:697-710.
Citation
. Hybrid imaging of esophageal cancer. Applied Radiology. 2004;33(6):9-20. doi:10.37549/AR1257.