Imaging of acute stroke
Applied Radiology — Vol. 34 , Issue 2 , pp. 10 -19
DOI: 10.37549/AR1319
Published: February 1, 2005
Categories
Symptomatic cerebral infarction (“stroke”) affects more than 750,000 Americans each year and has a mortality of 22%.1 It is the third leading cause of death in the United States and the annual costs are estimated to be $45 billion.1 Until the mid 1990s, management of stroke patients usually involved supportive care in the acute period, followed by a diagnostic workup in an attempt to define a cause of the patient’s symptoms for which treatment might be instituted with the goal of preventing future events. For example, computed tomography (CT) was performed to rule out other pathologic processes that can present with stroke-like symptoms, such as neoplasms, acute extra-axial fluid collections (epidural hematomas, subdural hematomas), infections, or any cause of a seizure (masses, vascular malformation). CT was also performed to rule out hemorrhage associated with an area of cerebral infarction that would contraindicate anticoagulation therapy. Later, diagnostic workup including cerebral angiography was often performed to identify arterial abnormalities that might be amenable to surgical (eg, endarterectomy) or medical (eg, anti-platelet, anticoagulation) therapy.
In 1995, the National Institute of Neurologic Disorders Study (NINDS) Group2 reported that the use of intravenous (IV) recombinant tissue plasminogen activator (t-PA), if administered to patients with ischemic stroke within 3 hours of symptom onset, resulted in an absolute improved outcome (end point: little or no disability 3 months after the event). This work has been confirmed by subsequent studies. The U.S. Food and Drug Administration (FDA) approved the use of IV t-PA for this purpose in 1996. The use of thrombolytic therapy for intra-arterial treatment of anterior circulation thrombi has been shown to be efficacious up to 6 hours after symptom onset3,4; but as of the end of 2004, the FDA had not yet approved its use for this purpose.
Early imaging has become crucial in the management of these patients. Specifically, acute intracranial hemorrhage and nonvascular causes of stroke symptoms need to be ruled out within 3 hours of symptom onset so that the use of IV t-PA can be considered. As t-PA is not a benign drug (it is associated with a 10-fold increased risk of causing an intracranial hemorrhage), imaging has become an important tool for identifying which patients may benefit from thrombolytic therapy and which patients may not and, therefore, should not be exposed to the risks of such treatment. Imaging also provides information that could potentially identify subgroups of patients who might benefit most from aggressive therapy beyond the accepted “therapeutic window” of 3 hours. Therefore, it is important for interpreters of imaging studies to be aware of specifically what to search for and report upon on emergent scans.
Computed tomography
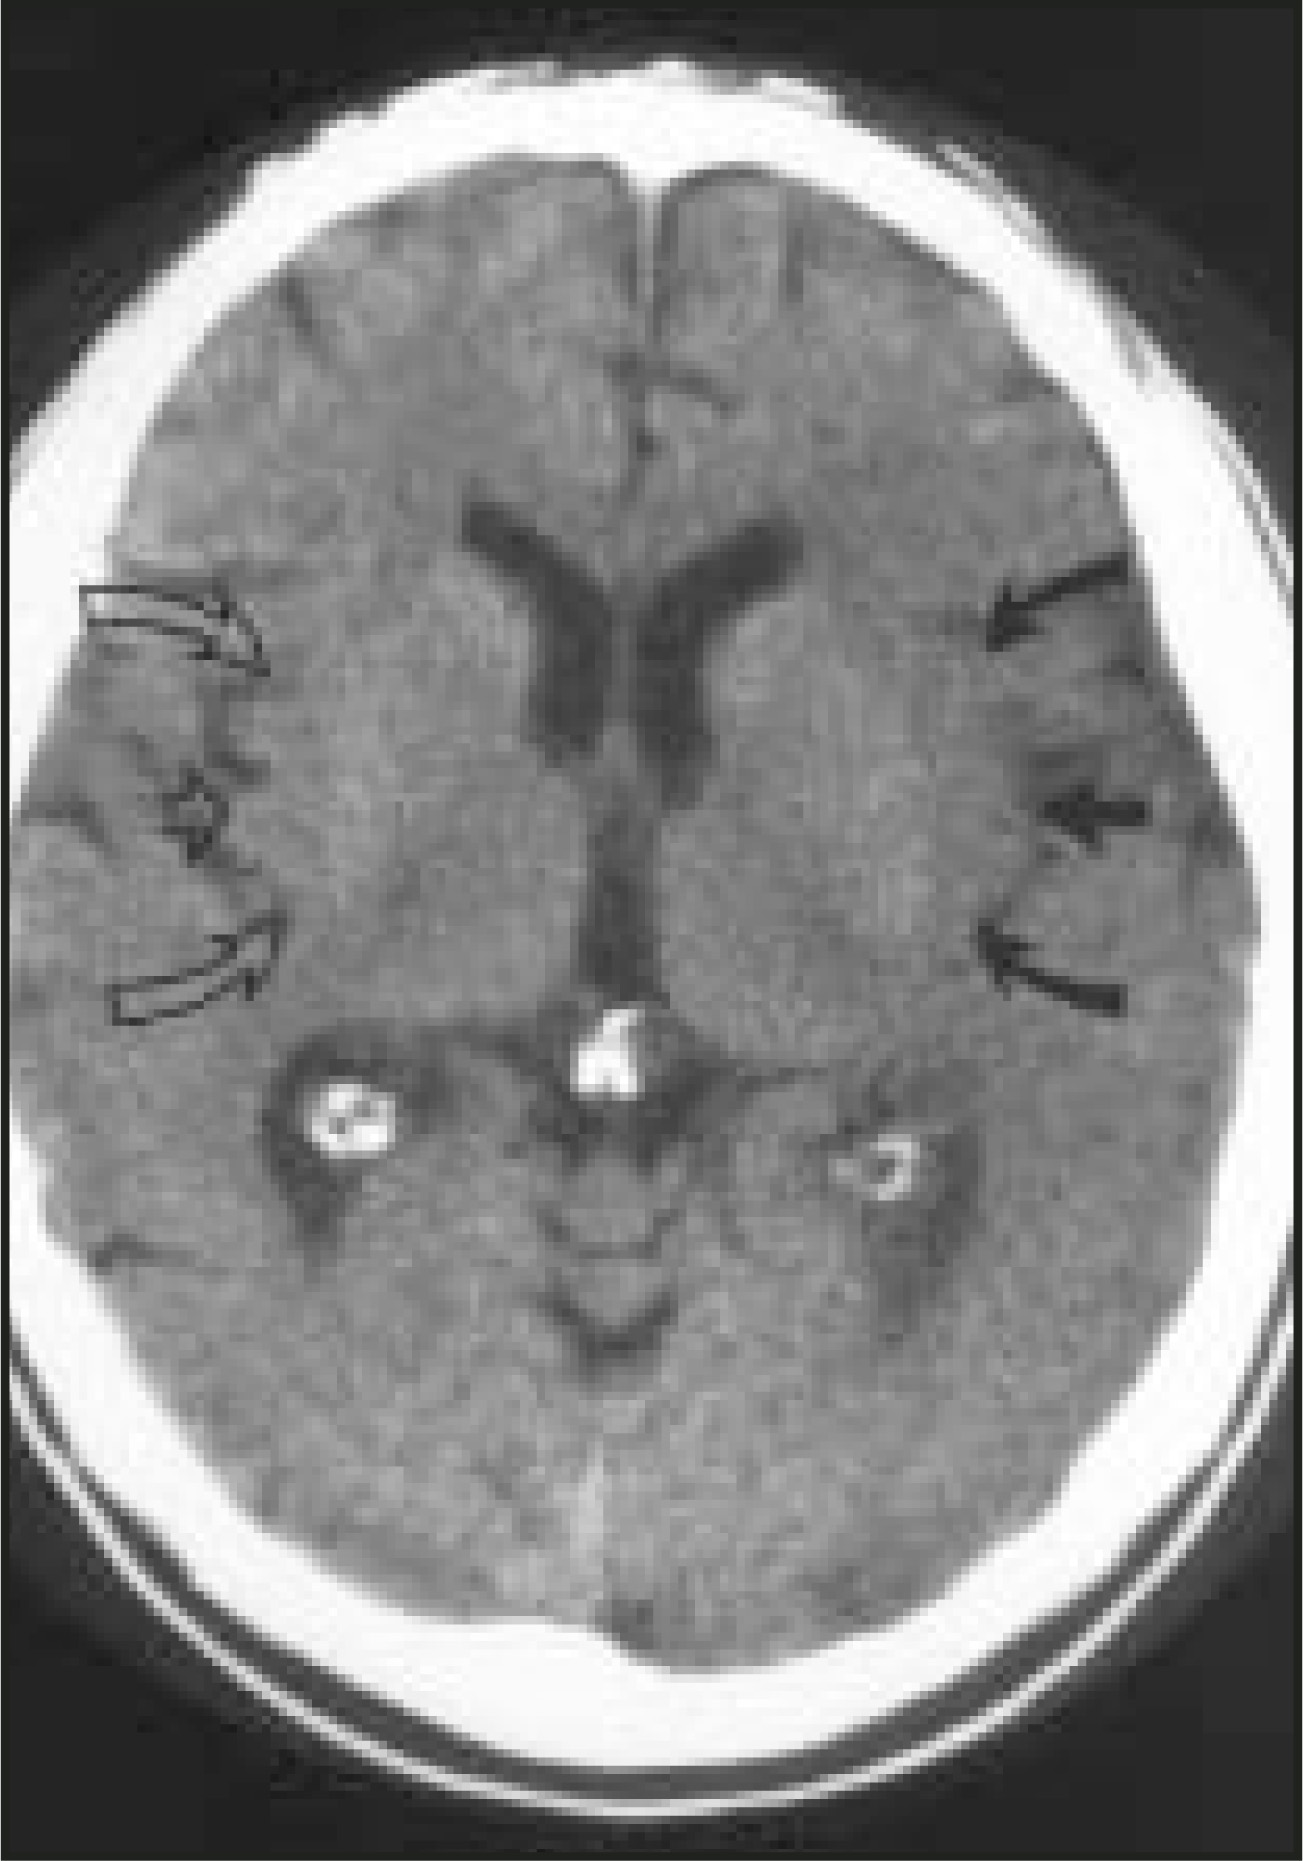
CT remains the predominant imaging modality for initial evaluation of patients with suspected stroke. Lesions that clinically can mimic ischemic stroke, such as hemorrhages, tumors, infections, vascular malformations, etc., can be excluded. Most CT scans are negative with respect to early signs of an acute ischemic process in the first 6 hours after symptom onset (which, as mentioned above, is the current “therapeutic window” during which pharmacologic intervention can affect patient outcome). However, several subtle parenchymal findings reflecting underlying cytotoxic edema (an early pathophysiologic finding in ischemia) can sometimes be seen and should be searched for. Such signs include “blurring” of the gray matter-white matter junction due to decreased attenuation of the gray matter as manifested by the “insular ribbon” sign (loss of the usual slightly increased attenuation of the insular cortex just superficial to the external/extreme capsules [Figure 1]) or “obscuration” of the lentiform nucleus (loss of the normal attenuation difference of the globus pallidus and/or putamen with respect to contiguous white matter structures [Figure 2]). In patients with middle cerebral artery (MCA) territory ischemia, local mass effect in the form of effacement of sulci or narrowing of the sylvian fissure may also be identified. These parenchymal changes, when seen in the first 3 hours after onset of stroke symptoms, appear to correlate with stroke severity.5
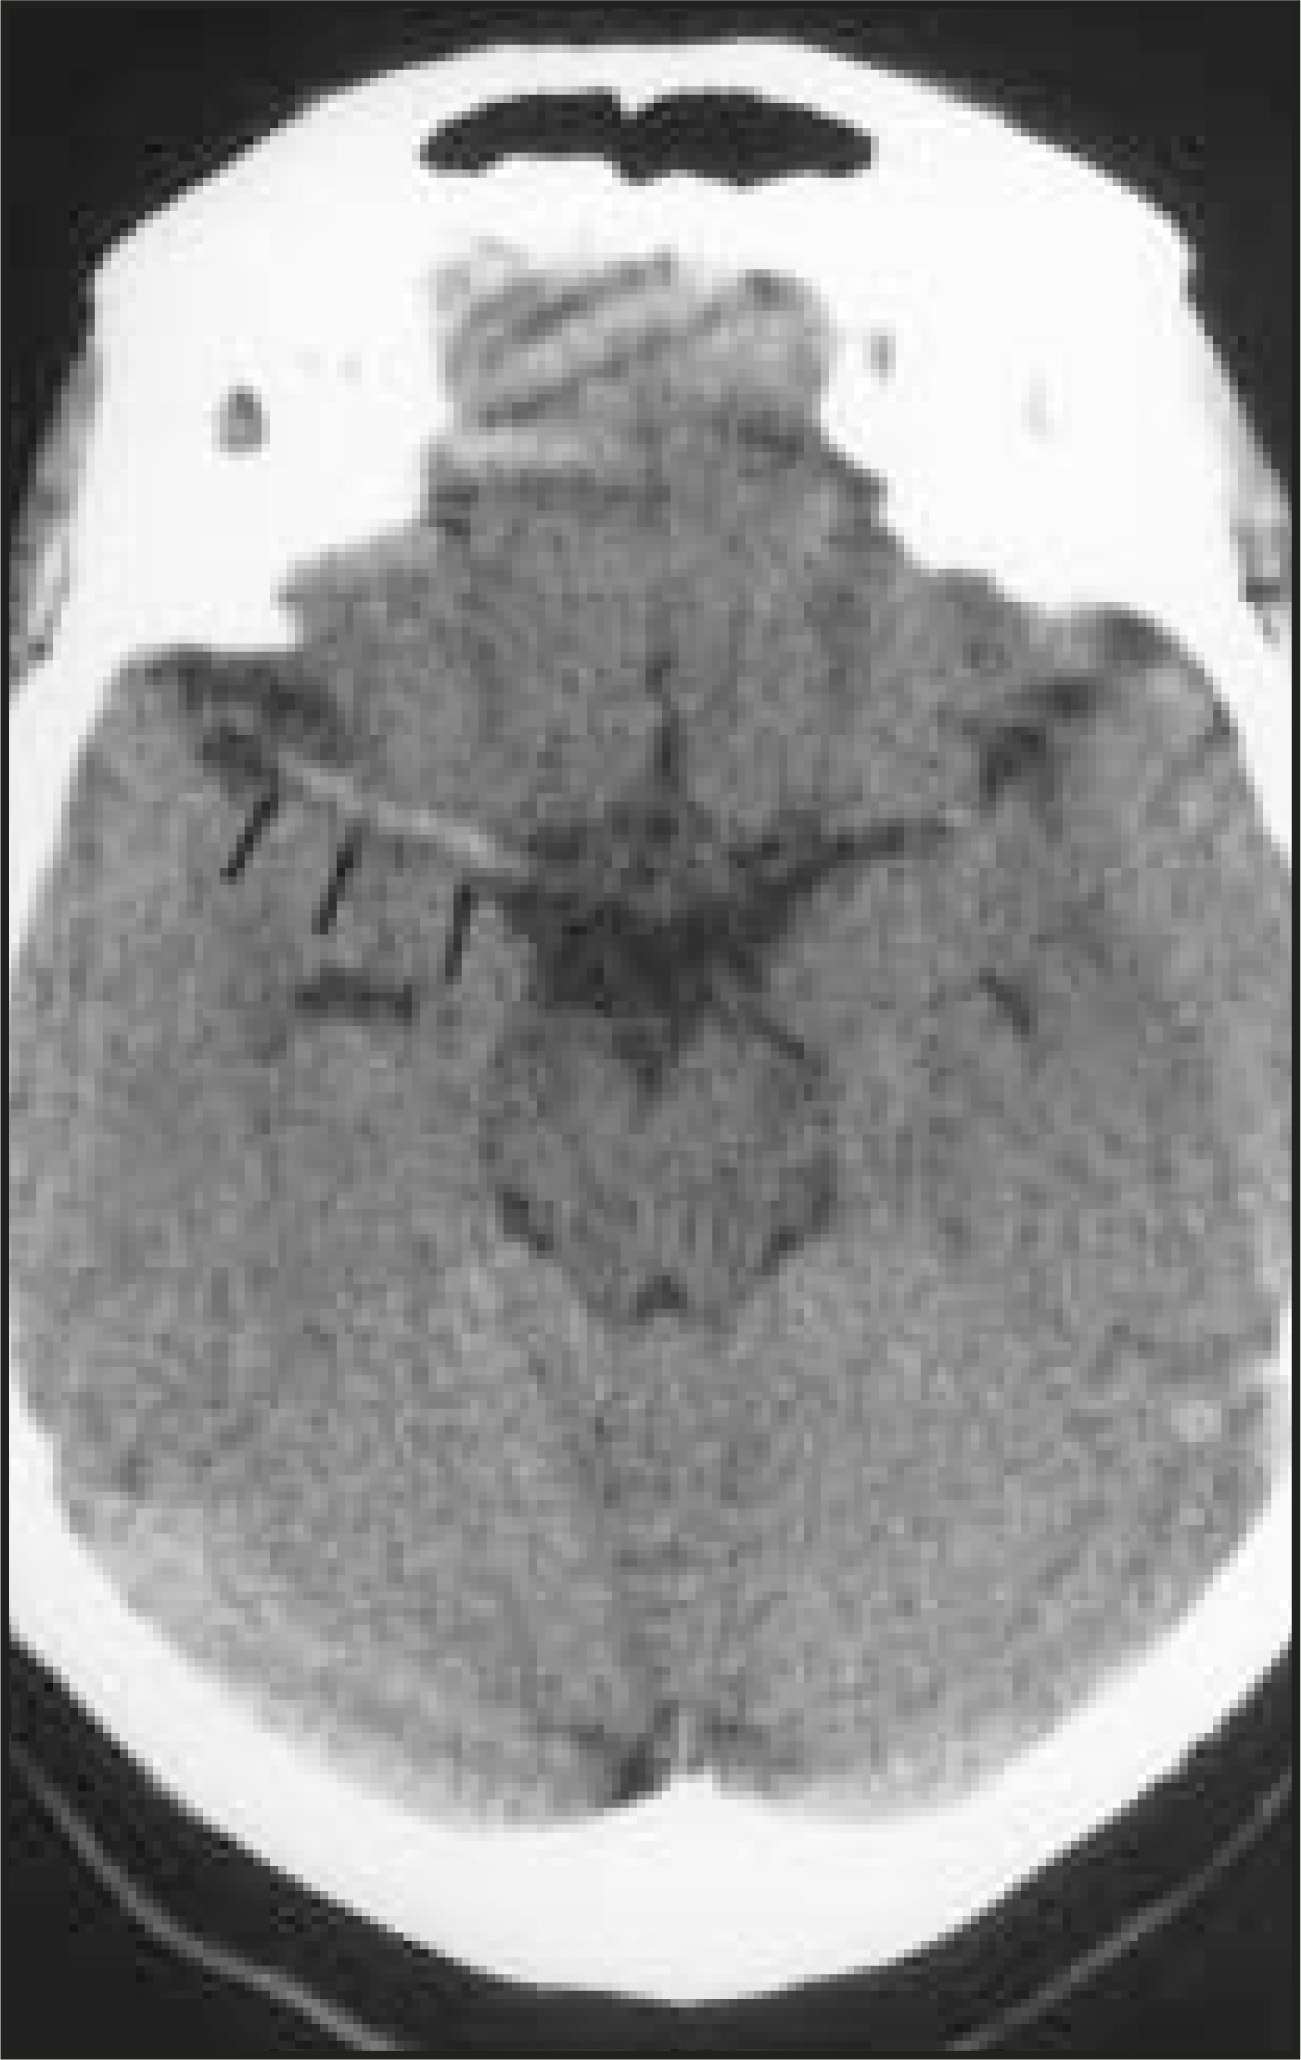
An extraparenchymal CT finding that can be identified as early as 90 minutes6,7 after symptom onset is the “hyperdense vessel sign” (Figure 3), which is usually seen in the proximal (M1 segment) MCA, but can be seen in any arterial structure.8,9 The increased density in the vessel is thought to be secondary to local slow intravascular blood flow due to an intra-arterial thrombus or may represent direct visualization of the thrombus itself.6,8
While the NINDS study2 established that IV t-PA was useful if given to patients with nonhemorrhagic stroke within 3 hours of symptom onset regardless of associated parenchymal ischemic changes, the European Cooperative Acute Stroke Study (ECASS) trial10 studied patients with stroke symptoms of <6 hours’ duration who had CT-demonstrable ischemic changes involving no more than one third of the MCA territory. This and subsequent studies revealed that although patients with CT-demonstrable parenchymal changes within the first 3 hours after symptom onset have a relatively worse outcome than patients who present with symptoms but no abnormalities on CT,5 they may still benefit from IV t-PA administration if the identified parenchymal changes involve less than one third of a vascular territory.
Therefore, when reporting a CT scan for this patient population, pertinent findings to be mentioned include: the presence or absence of hemorrhage, the presence and extent of any ischemic parenchymal changes, and the presence or absence of nonvascular etiologies of stroke-like symptoms.
MR imaging
Conventional (standard spin-echo) magnetic resonance imaging (MRI) shows essentially the same parenchymal changes that can be seen on CT scanning, but with a greater degree of sensitivity and specificity.8 Cytotoxic edema of gray matter is seen as increased T2 signal and, in the case of MCA ischemia, is often first identified in the region of the insular cortex (ie, the MR corollary of the “insular ribbon” sign on a CT scan) or involving the lentiform nuclei of the basal ganglia (ie, the MR corollary of “obscuration” of the lentiform nucleus on a CT scan). Similarly, mild mass effect associated with early ischemic change is usually easier to identify on MRI. The greater contrast resolution of MR permits the earlier and more confident delineation of these findings, though these changes are still usually not seen for 3 to 4 hours. Exaggerated intravascular contrast enhancement reflecting relative stasis of contrast material within blood vessels in the involved ischemic territory is an MR sign of an acute vascular occlusion.8 While this sign can be seen within minutes of an occlusion, as it can persist for up to a week and does not identify the specific blood vessel involved, it is therefore relatively nonspecific for identifying a hyperacute area of ischemic change. Diffusion MR (dMR)
Diffusion-weighted MRI (dMR) is based on the principle that random Brownian motion of water molecules in tissues can be measured and quantified. Water molecules that are not “restricted” by cell membranes, macromolecules, or other structures will have greater net diffusion over a given period of time than will water molecules surrounded by cell organelles, membranes, large proteins, etc. Therefore, water molecules in the lateral ventricles have “high” (a large amount of) diffusion while water molecules within a cell have more “limited” diffusion.
During an acute ischemic event, cellular adenosine triphosphate (ATP) is depleted, leading to failure of cell membrane sodium-potassium pumps. This (along with other chemical effects) leads to an acute influx of water into cells with swelling of the affected cells (cytotoxic edema). The end result is that the increased intracellular water (which shows less overall diffusion than does extracellular interstitial water) demonstrates a decrease in the amount of net diffusion of water present in brain parenchyma experiencing cytotoxic edema. (It should be noted that there are alternative explanations for what is occurring at the cellular level, but the end result is the same with respect to imaging.)
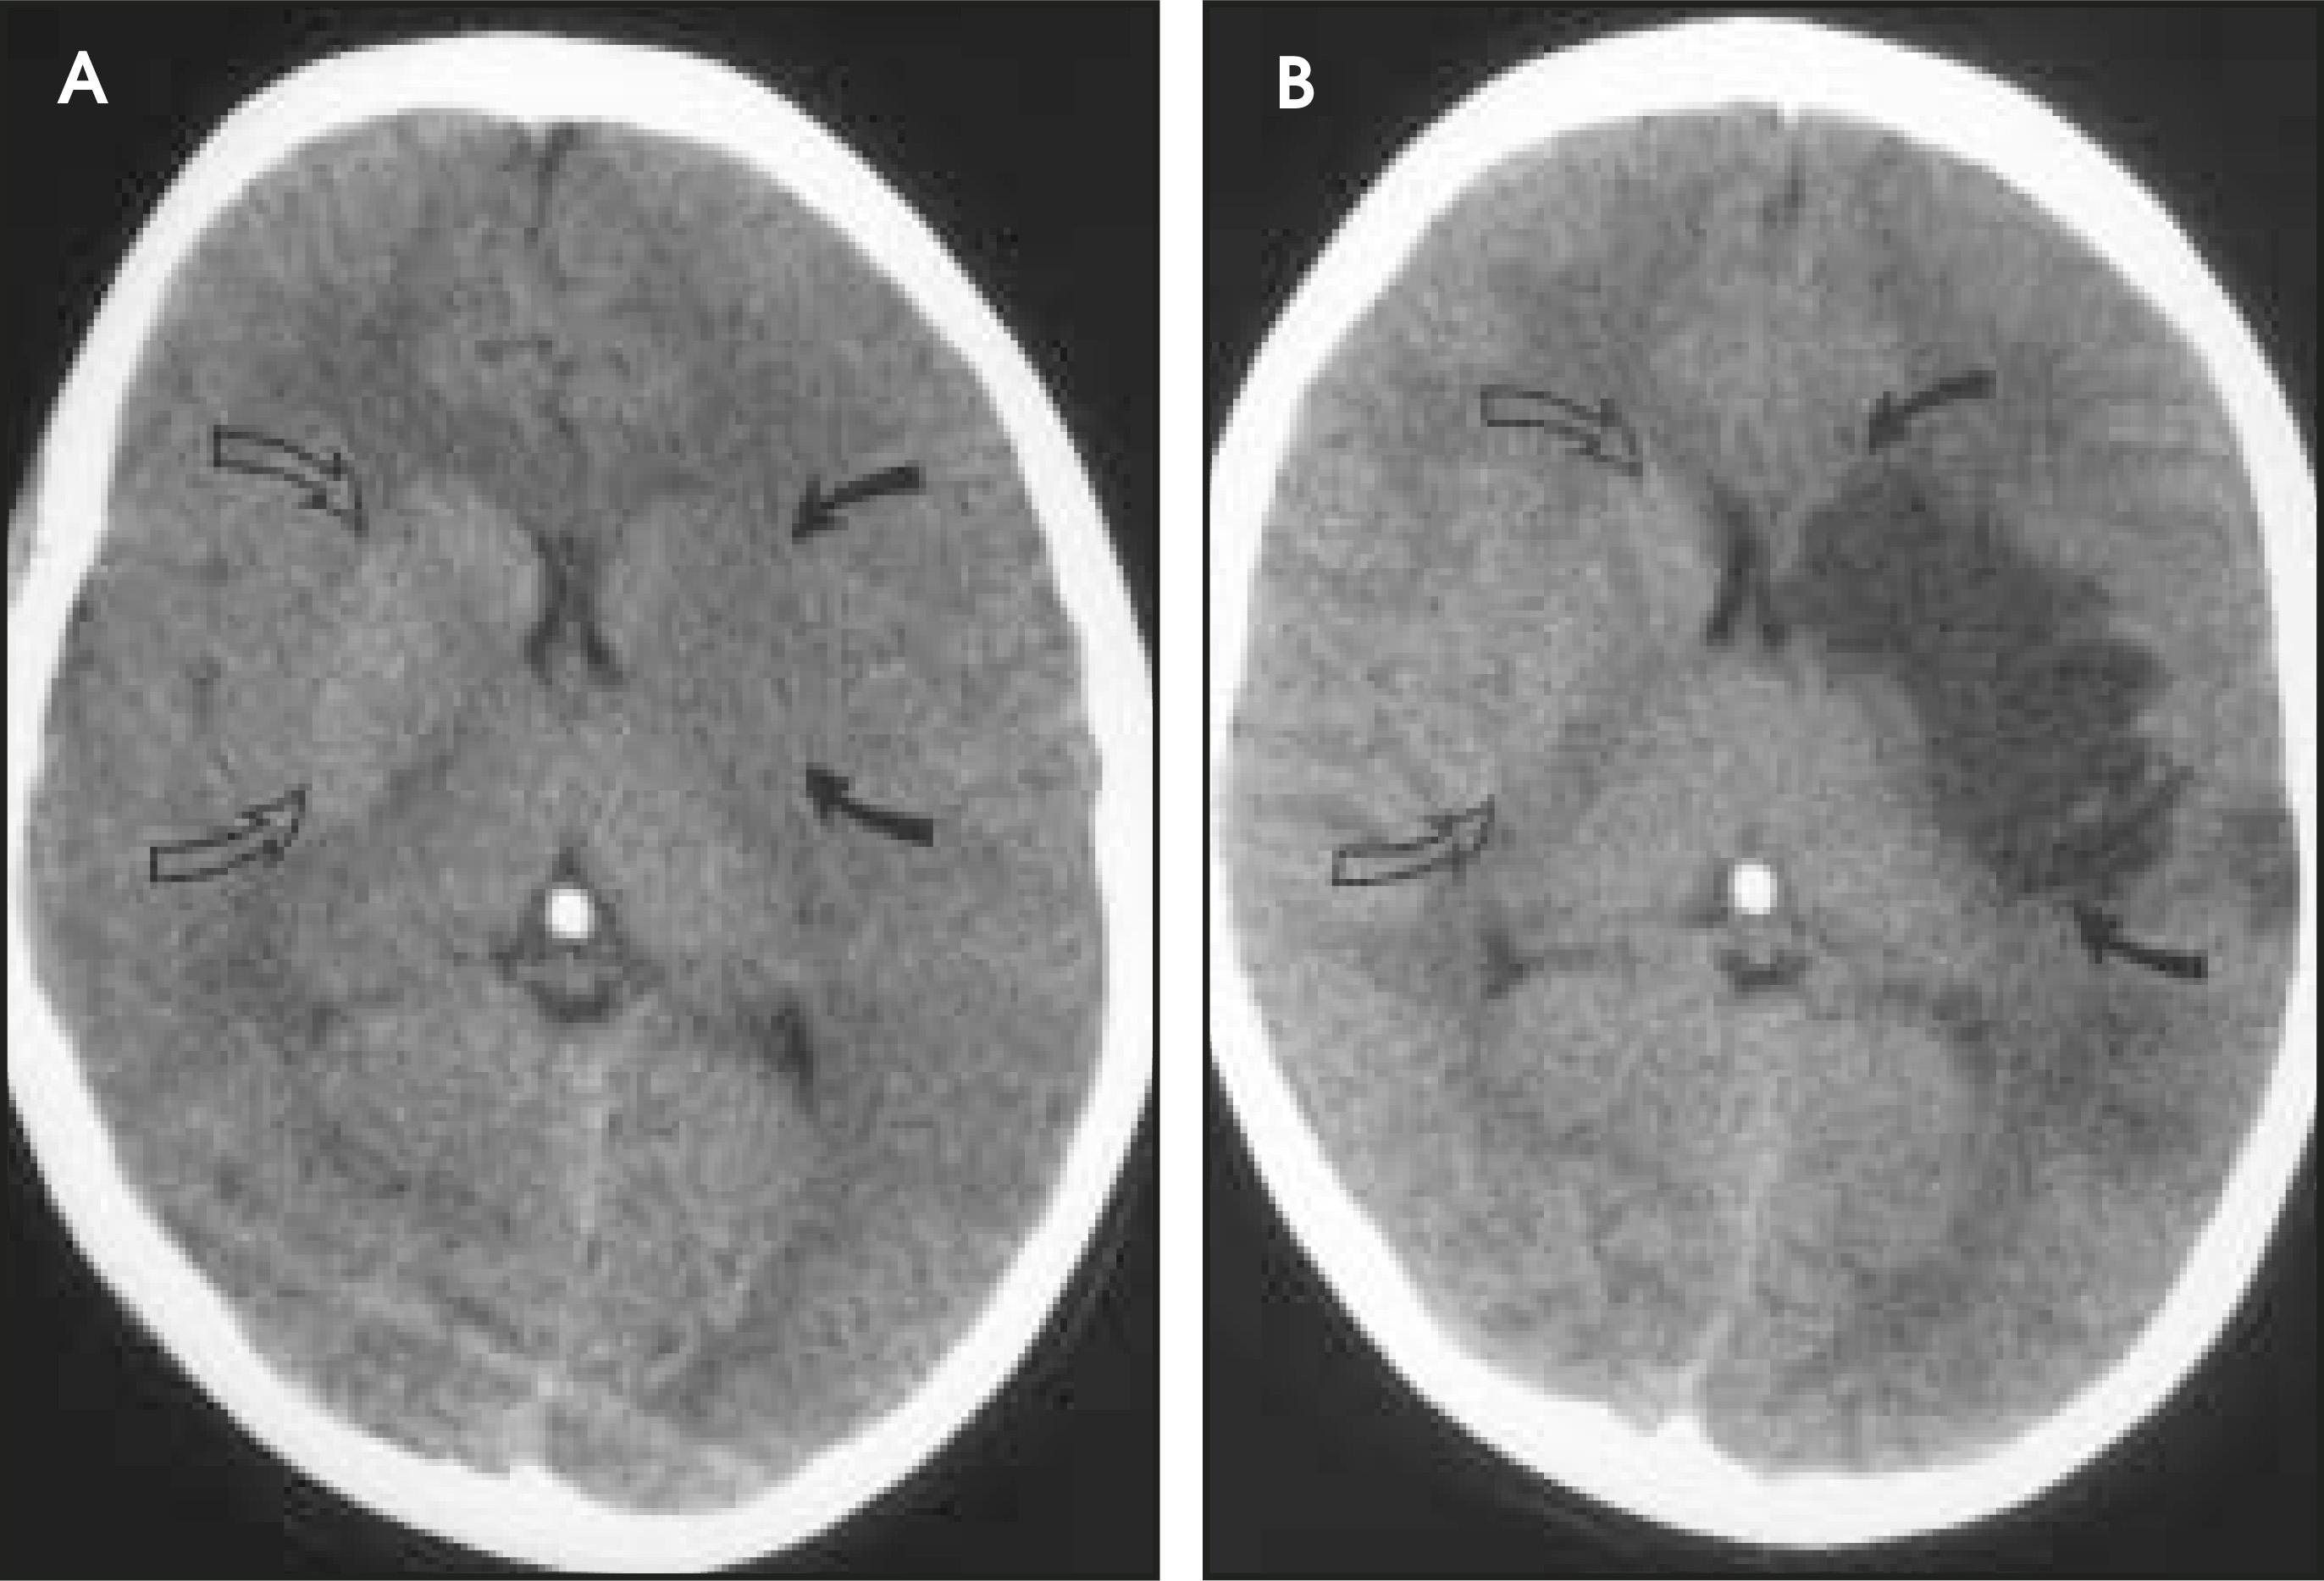
The net diffusion of water for any given tissue can be measured and displayed on a dMR scan (Figure 4A). Areas of decreased water diffusion will be seen as areas of increased signal on dMR and can be seen as early as 22 minutes after an ischemic insult.11 As dMR findings can occasionally be mimicked by chronic T2-changes (so-called “T2 shine-through”), apparent diffusion coefficient (ADC) maps (Figure 4B) can be generat-12,13 that reflect only diffusion data. Changes on dMR scans or ADC maps are usually considered evidence of irreversible ischemic damage, though there are reports of reversal of dMR findings after successful recanalization of a blood vessel with intra-arterial thrombolysis.14 Similarly, although dMR is considered a sensitive method for ruling out infarction, there have also been case reports of patients with initially (within 4 hours) negative dMR scans who went on to cerebral infarction.15
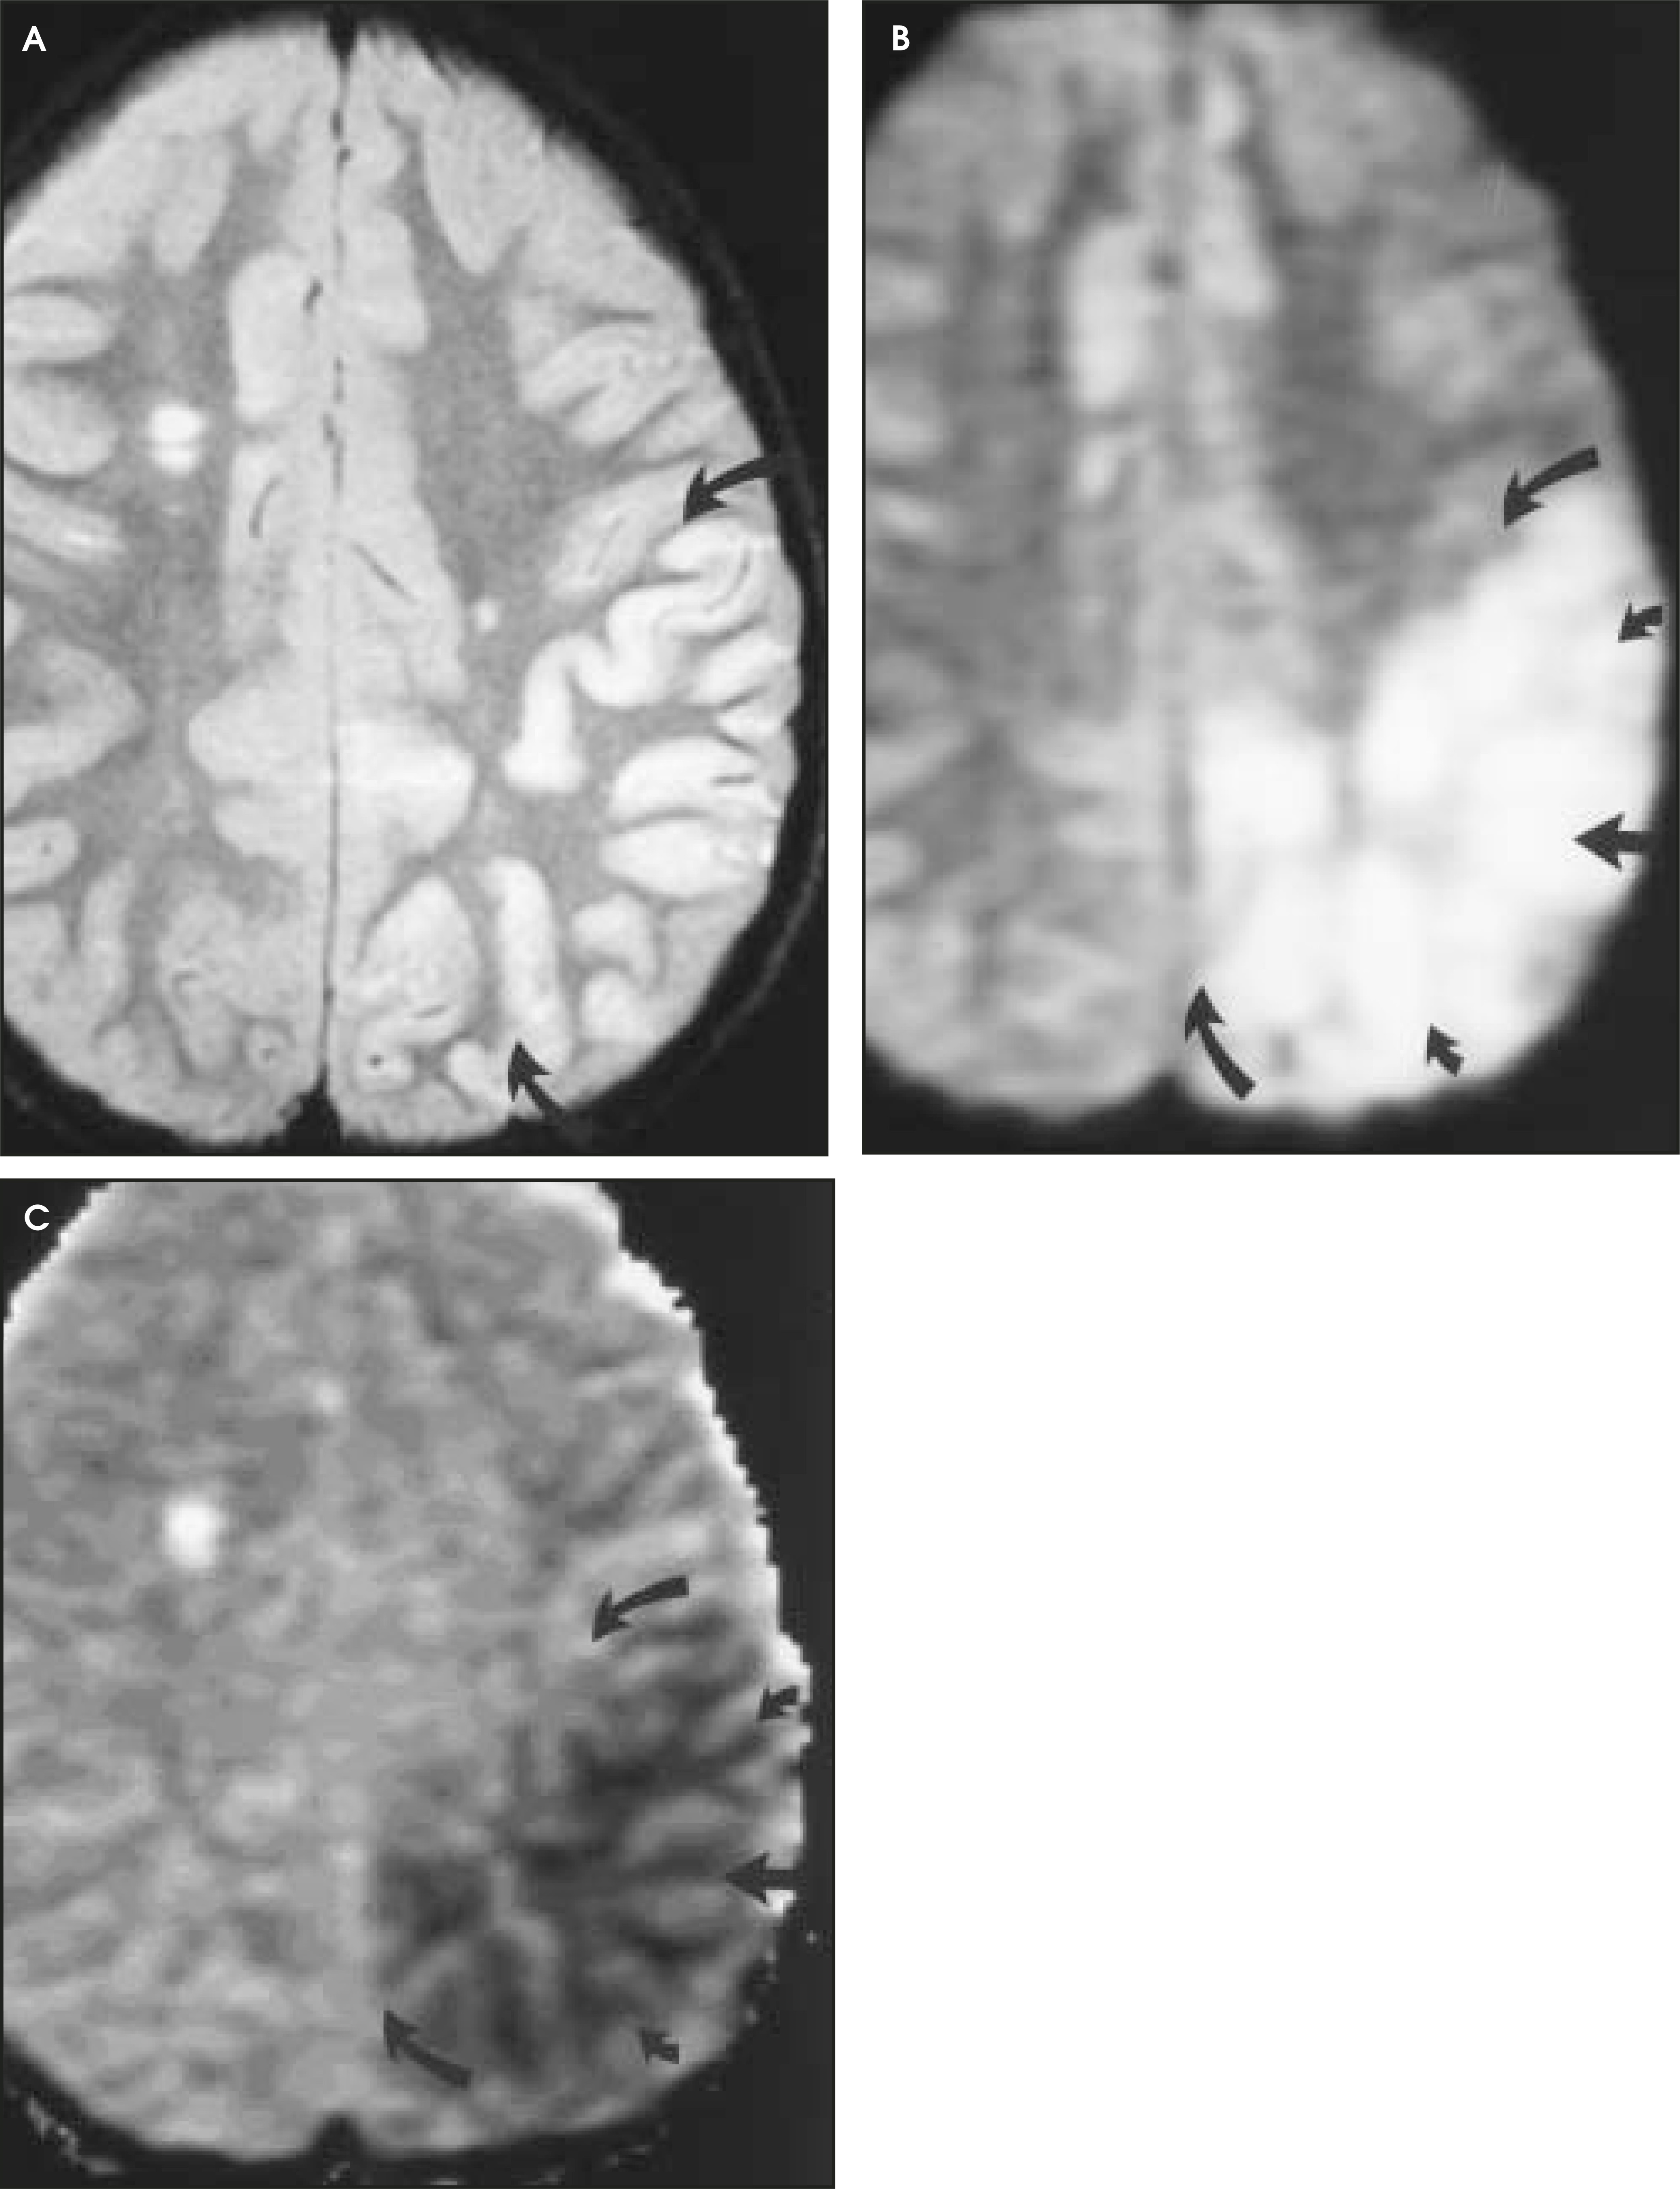
MRI is considered a better test than CT for identifying acute ischemic changes, with dMR being a highly specific test for early detection of usually irreversible parenchymal injury.
Perfusion imaging
Perfusion imaging, be it perfusion MR (pMR) or perfusion CT (pCT), evaluates the characteristics of blood flow to a given region of the brain. It is recognized that brain parenchyma can be hypoperfused without permanent parenchymal injury. Therefore, a brain region with lower than normal perfusion can either be infarcted or be at increased risk to progress to infarction. The concept of “ischemic penumbra” refers to an area of reduced brain parenchymal perfusion with or without associated loss of neuronal function, but with involved neurons remaining viable.16 This area of the brain is considered “at risk” to go on to irreversible infarction if blood flow is not improved. This area of brain usually separates an area of frank cerebral infarction (presumably irreversible injury) from normal brain. It is this area of the brain that aggressive IV thrombolytic or neurointerventional management targets to protect from further injury. The time period during which brain tissue within the ischemic penumbra remains viable is debated,17 as the transition of brain tissue from potentially reversible to irreversible injury is dependent on the severity and duration of the underlying ischemic process.16 As a patient with a significant penumbra territory is likely to benefit from thrombolytic therapy, one of the current goals of imaging is to try to identify this “at risk” brain tissue so that appropriate aggressive therapy can be targeted to this region. Similarly, if imaging can indicate that there is little or no penumbral territory, those patients should probably not be exposed to the risks of aggressive therapy, because there may be little viable brain to salvage.
Perfusion MR
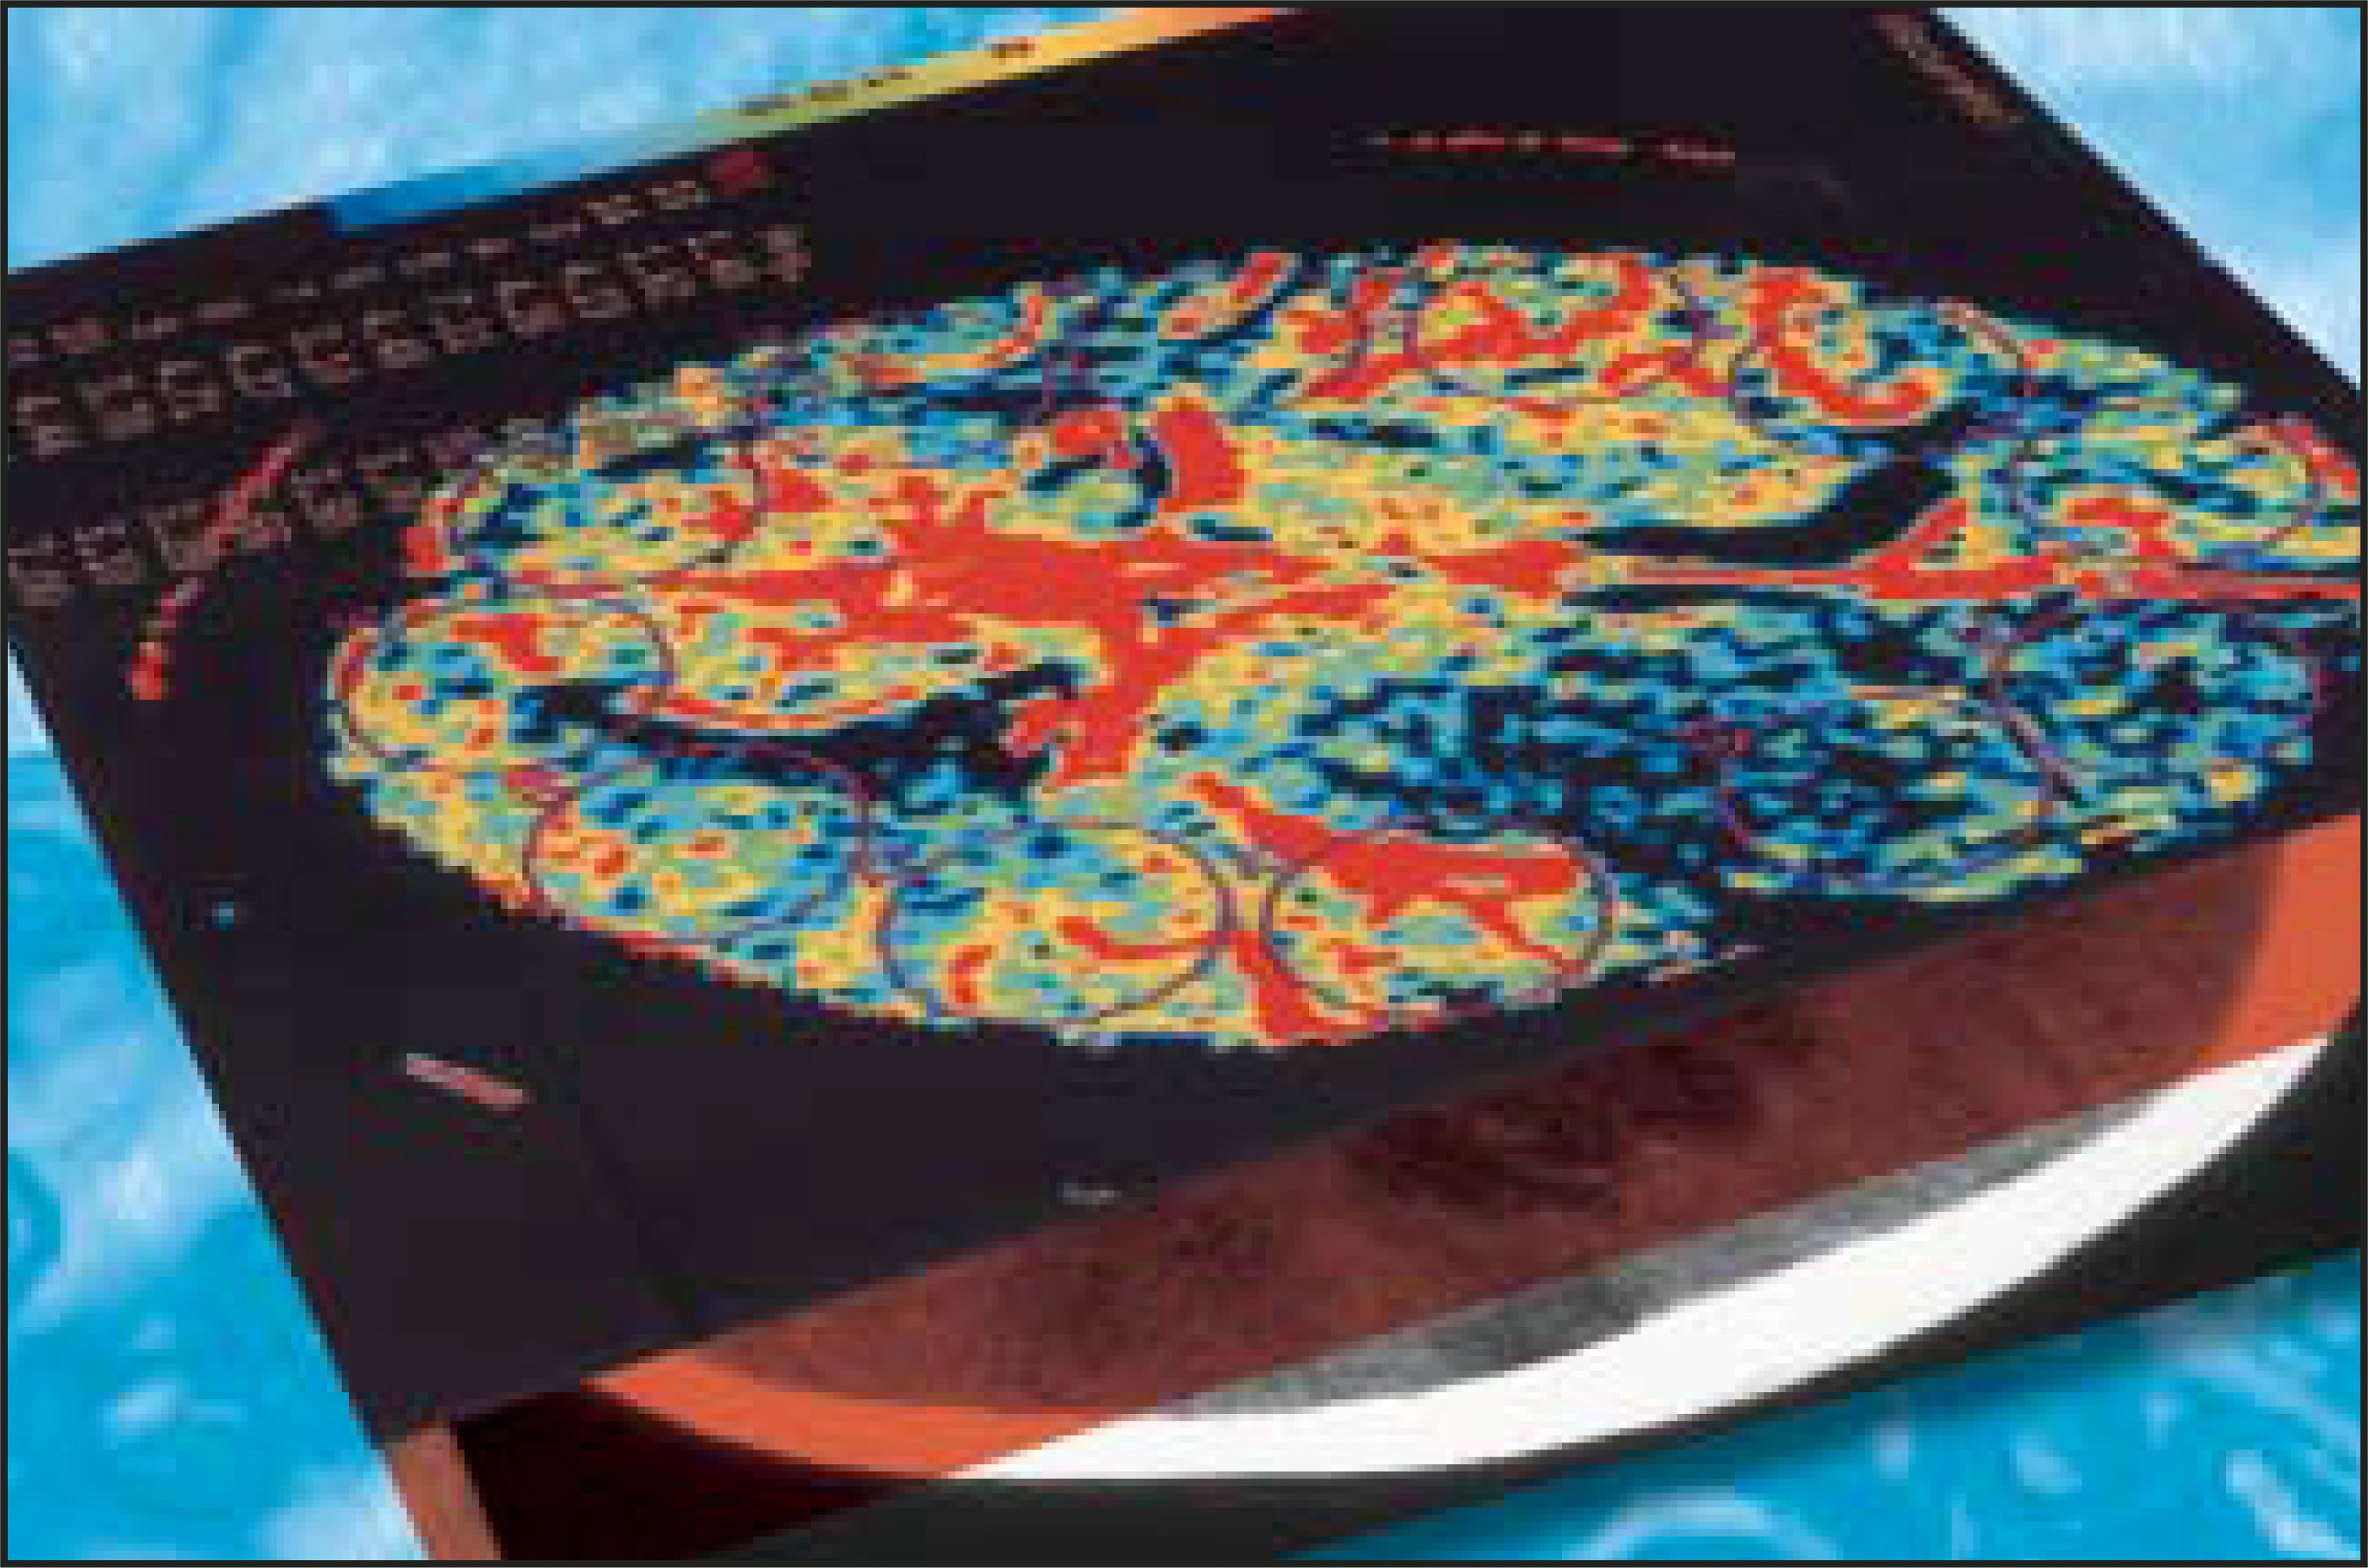
Perfusion MR imaging can be performed by multiple different techniques, However, a contrast-enhanced dynamic susceptibility (T2*-weighted) bolus technique is most commonly used. Hemodynamic maps are generated based on the degree of signal-intensity decrease identified on rapidly acquired scans obtained as a bolus of IV contrast material passes through the brain. Various hemodynamic parameters such as relative cerebral blood flow (CBF; in mL/min), relative cerebral blood volume (CBV; in mL), mean transit time (MTT; in sec), bolus arrival time (in sec) and flow heterogeneity18 can be measured and/or calculated (Figure 5). Uninvolved contralateral brain tissue is presumed to be “normal,” and ratios of abnormal/nor-mal can be determined. The exact role of each perfusion parameter in the evaluation of patients for determining the ischemic core (area of irreversible infarction), ischemic penumbra (area of hypoperfusion, but still potentially salvageable brain) and the final infarction size remains controversial.14,17,19-22
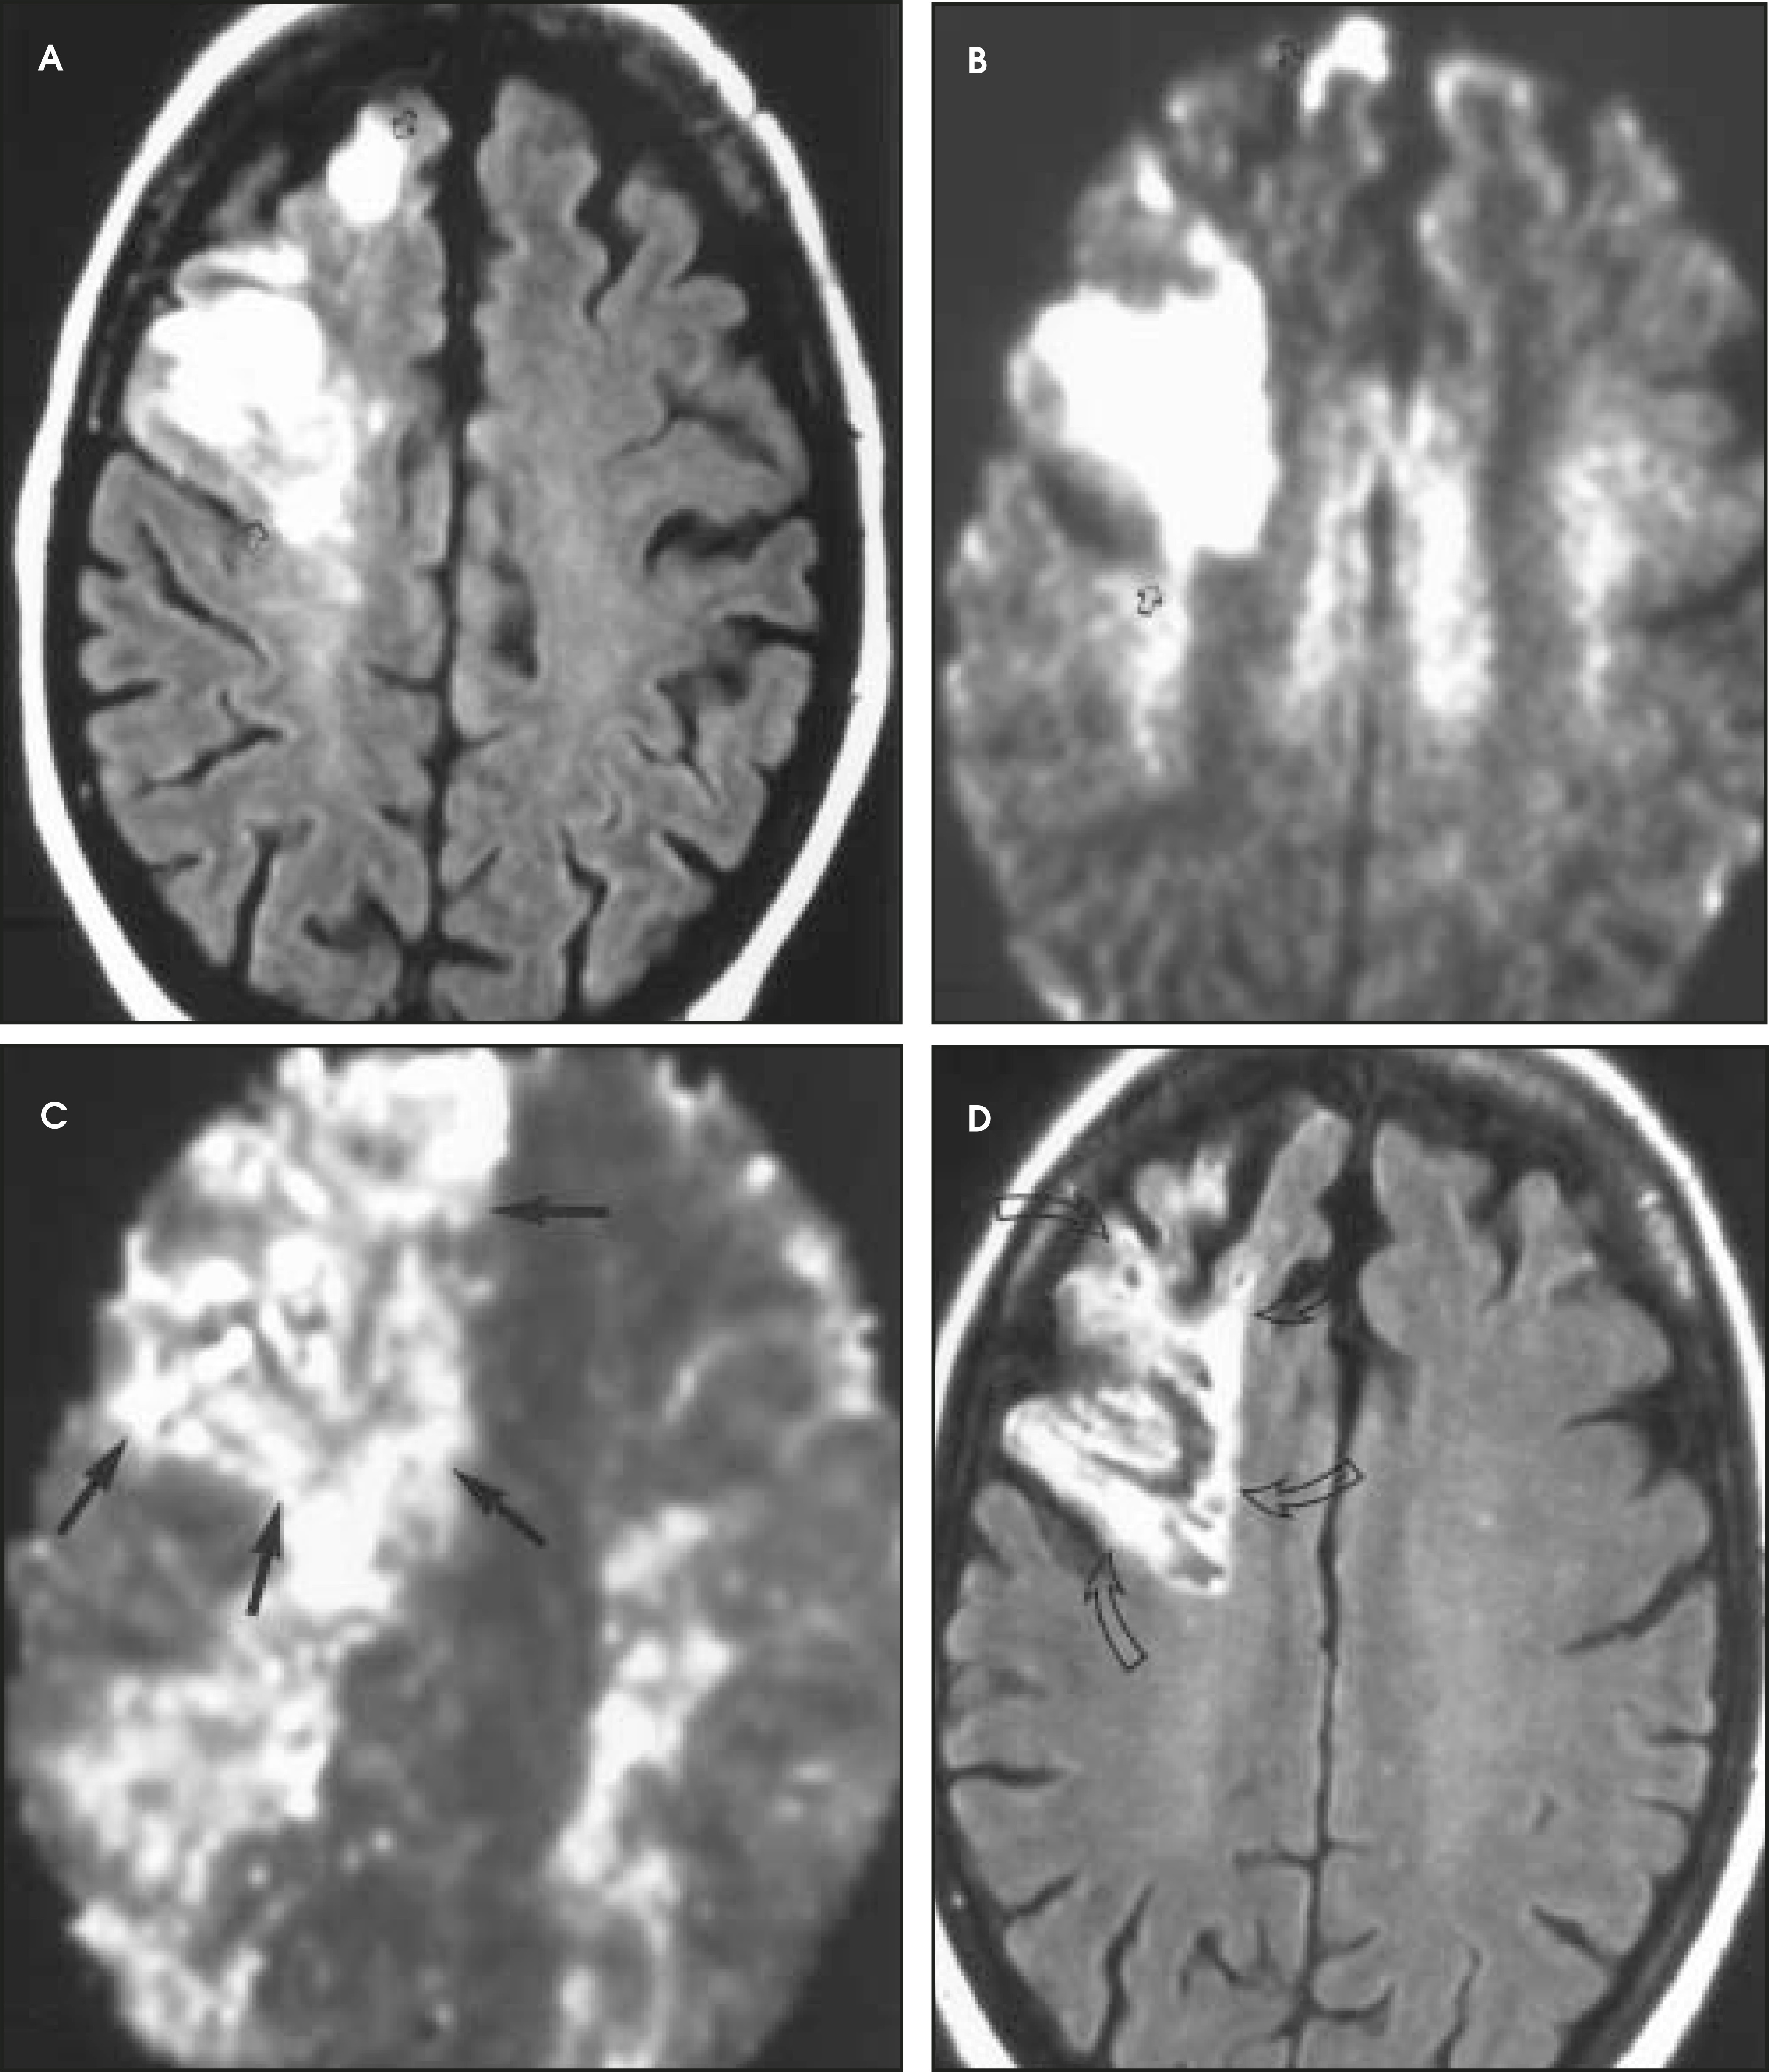
MR diffusion-perfusion mismatch
If an area of MR perfusion abnormality (that theoretically can include areas of salvageable brain) is larger than the underlying area of MR diffusion abnormality (which presumably represents irreversibly damaged brain tissue—the ischemic core) (Figure 5), then the difference in the amount of affected brain between these 2 studies may represent an area of potentially salvageable brain, the ischemic penumbra. The identification or exclusion of such an MR diffusion-perfusion mismatch may be the key for determining which patients might maximally benefit from aggressive (eg, thrombolytic or interventional) therapy.23
Perfusion CT
Perfusion CT is performed in a manner similar to pMR. Serial CT scans are acquired rapidly to dynamically track a bolus of IV contrast material as it travels through the brain24 at a single location (ie, the basal ganglia region in the case of suspected MCA stroke) or at several contiguous locations (but covering no more than a 2-cm-thick slab of the brain). Again, hemodynamic maps of brain perfusion can be generated as this contrast bolus passes through the brain. Different parameters, including time-to-peak (TTP; the time that elapses between the start of an IV contrast injection and the maximal attenuation of contrast-enhanced blood as it passes through a defined region of the brain), MTT (which can be oversimplified to be considered the time it takes blood to flow from a major cerebral artery feeding a given region of the brain to the major cerebral vein draining that region), CBV (the volume of blood in a defined portion of the brain at any given time), and CBF (cerebral blood volume/min) can be measured or calculated. While there is debate about the significance and reliability of these parameters, some researchers24,25 believe that CBF (or MTT) on pCT is similar to a perfusion abnormality on pMR, while CBV on pCT is similar to a diffusion abnormality on pMR, so that a CBF/CBV (or MTT/CBV) “mismatch” on perfusion CT (Figure 6) is similar to a perfusion/diffusion “mismatch” on MR (Figure 5) and may have the same implications with respect to identifying the presence or absence of an ischemic penumbra and the potential usefulness of aggressive neurointerventional therapy in any given patient.
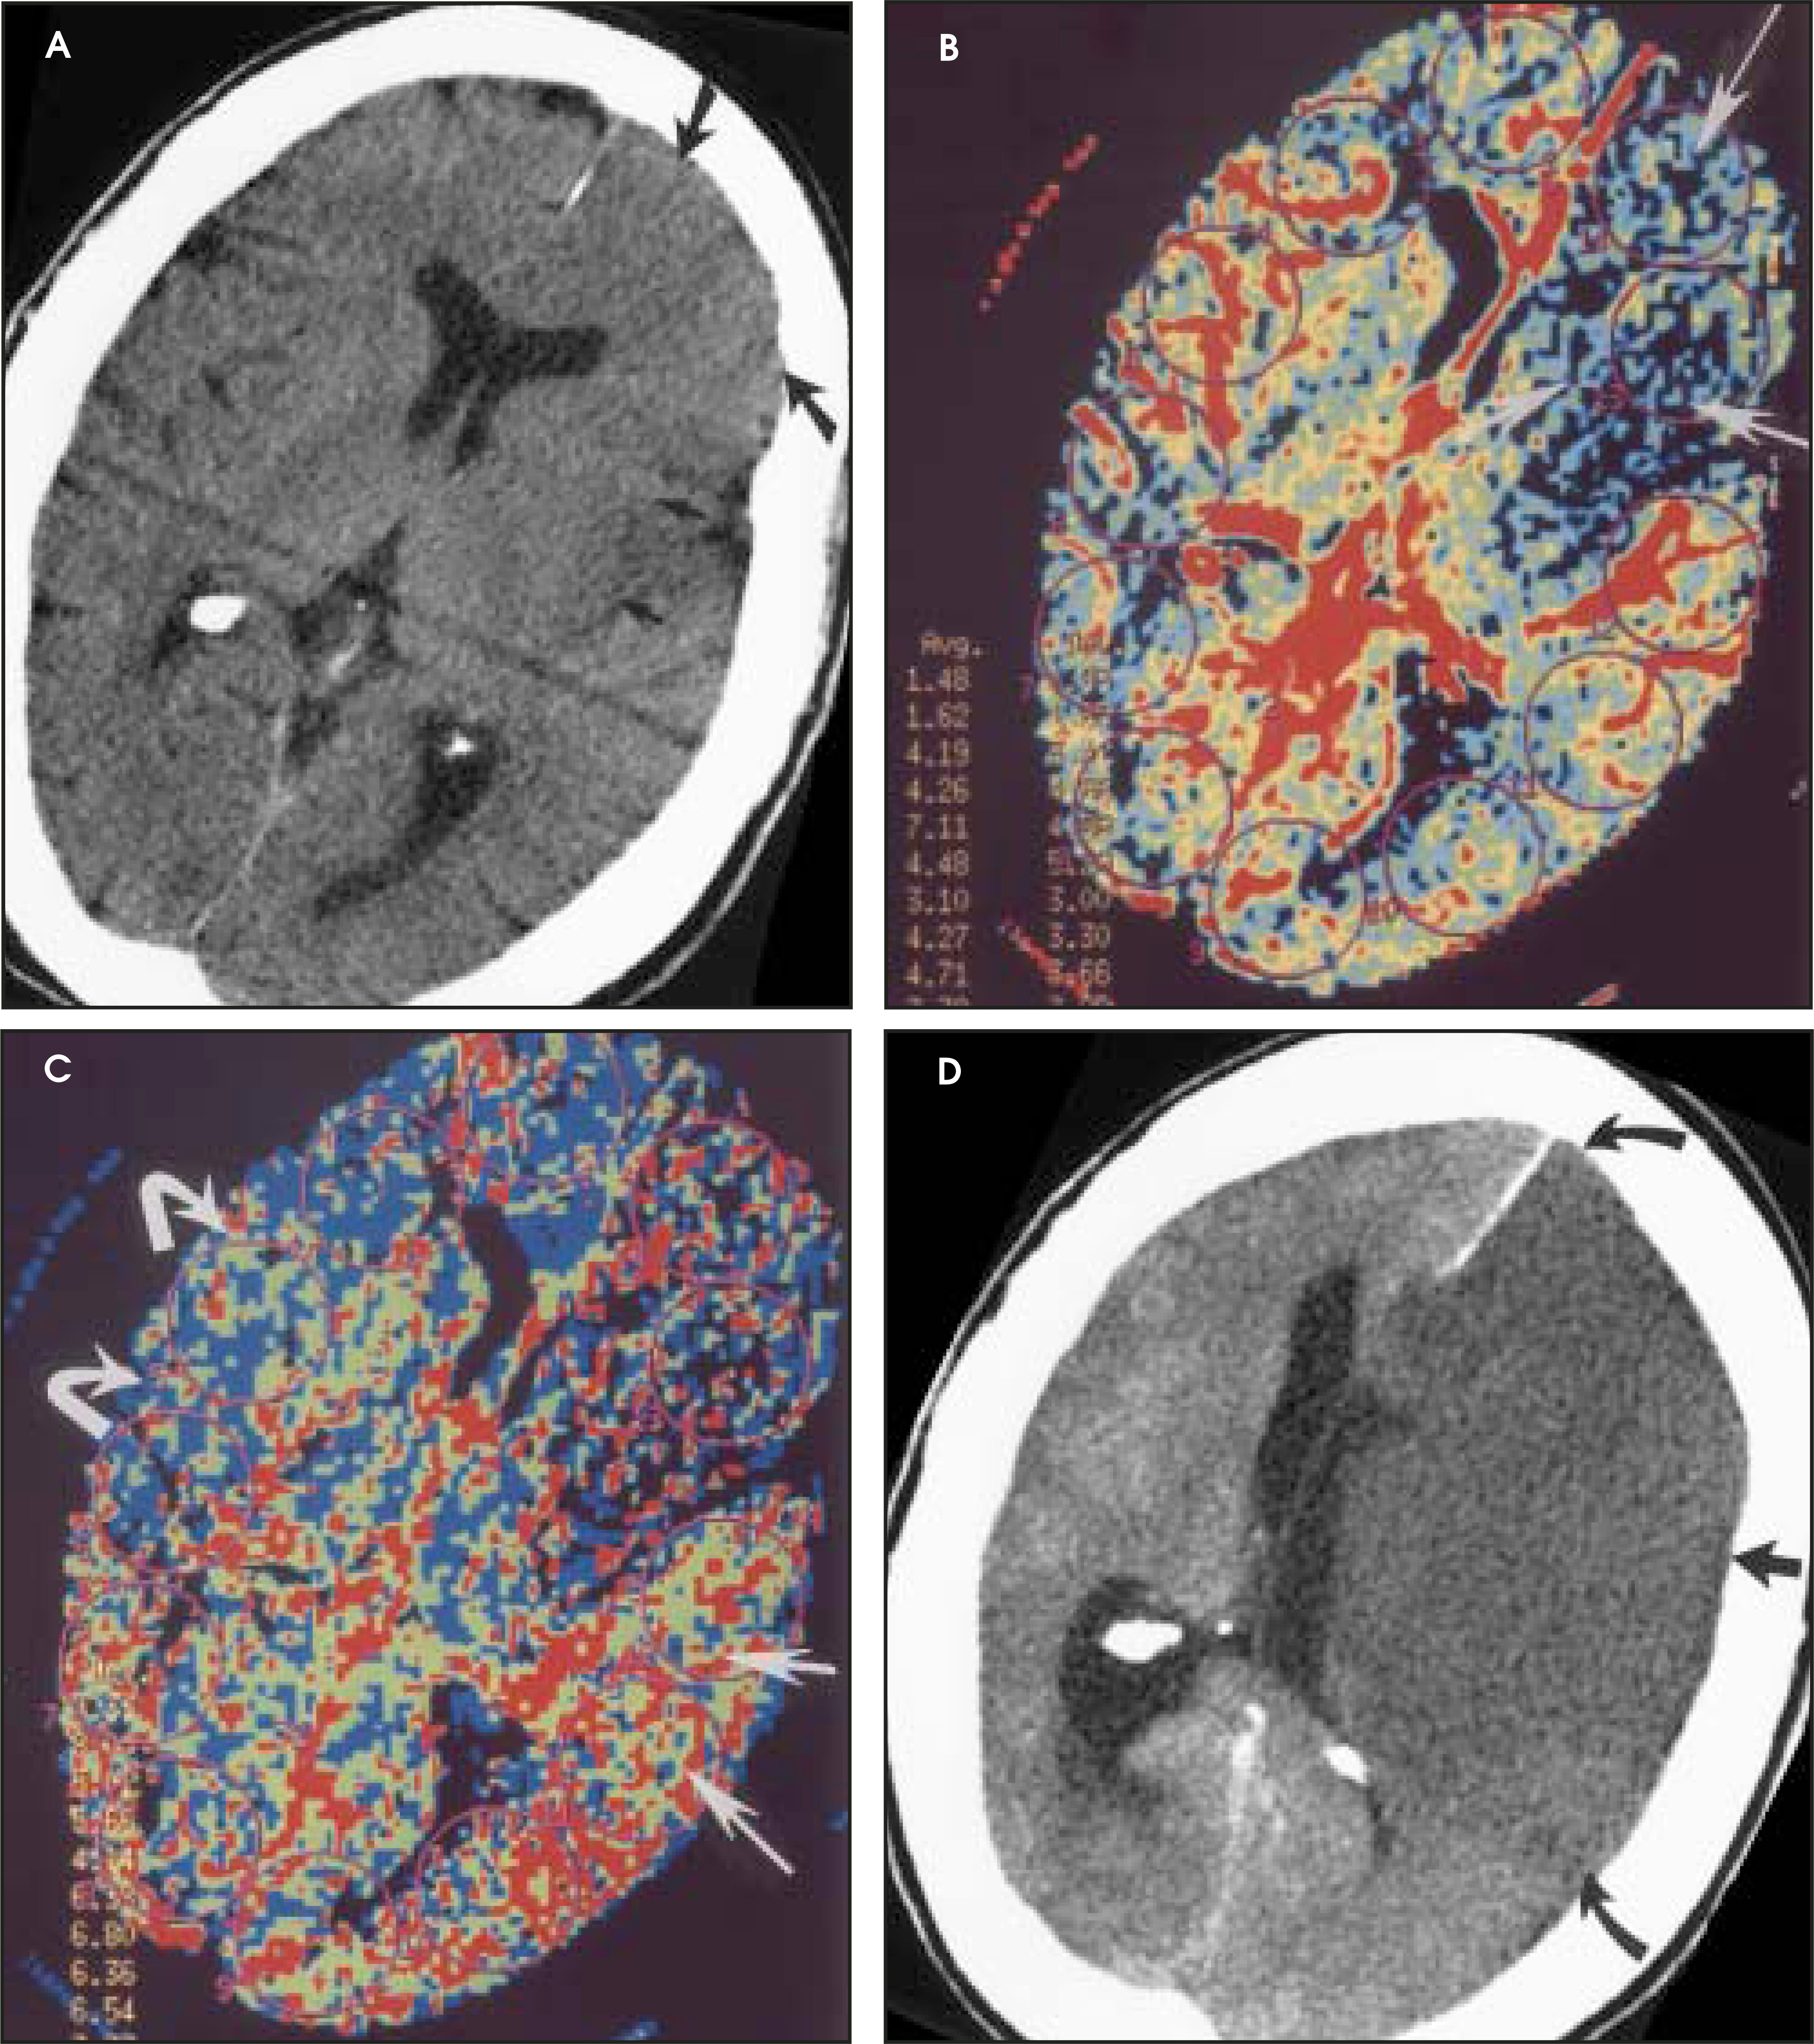
CT angiography
CT angiography (CTA) is best performed on a late-generation multislice CT scanner on which a fast thin-section volumetric spiral examination is performed during a time-optimized bolus of IV contrast material injection with opacification of blood vessels.9,26 Complete imaging of the craniocervical circulation from the aortic arch through the circle of Willis region can be performed in as little as 20 seconds. High-resolution two-dimensional (2D) (multiplanar reformatted [MPR]) or three-dimensional (3D) reconstructed images presented as maximum intensity projection (MIP) or shaded surface display (SSD) images (Figure 7) can be obtained. CT angiography can be performed at the same time that a dedicated cranial CT examination is performed, as CTA requires relatively little patient cooperation, is a quick examination, and can identify sites of intracranial or extracranial vessel stenosis or occlusion as possible underlying causes of a patient’s acute symptoms. It can, therefore, potentially identify the source of an ischemic process to aid in the planning of (sometimes emergent) definitive therapy.
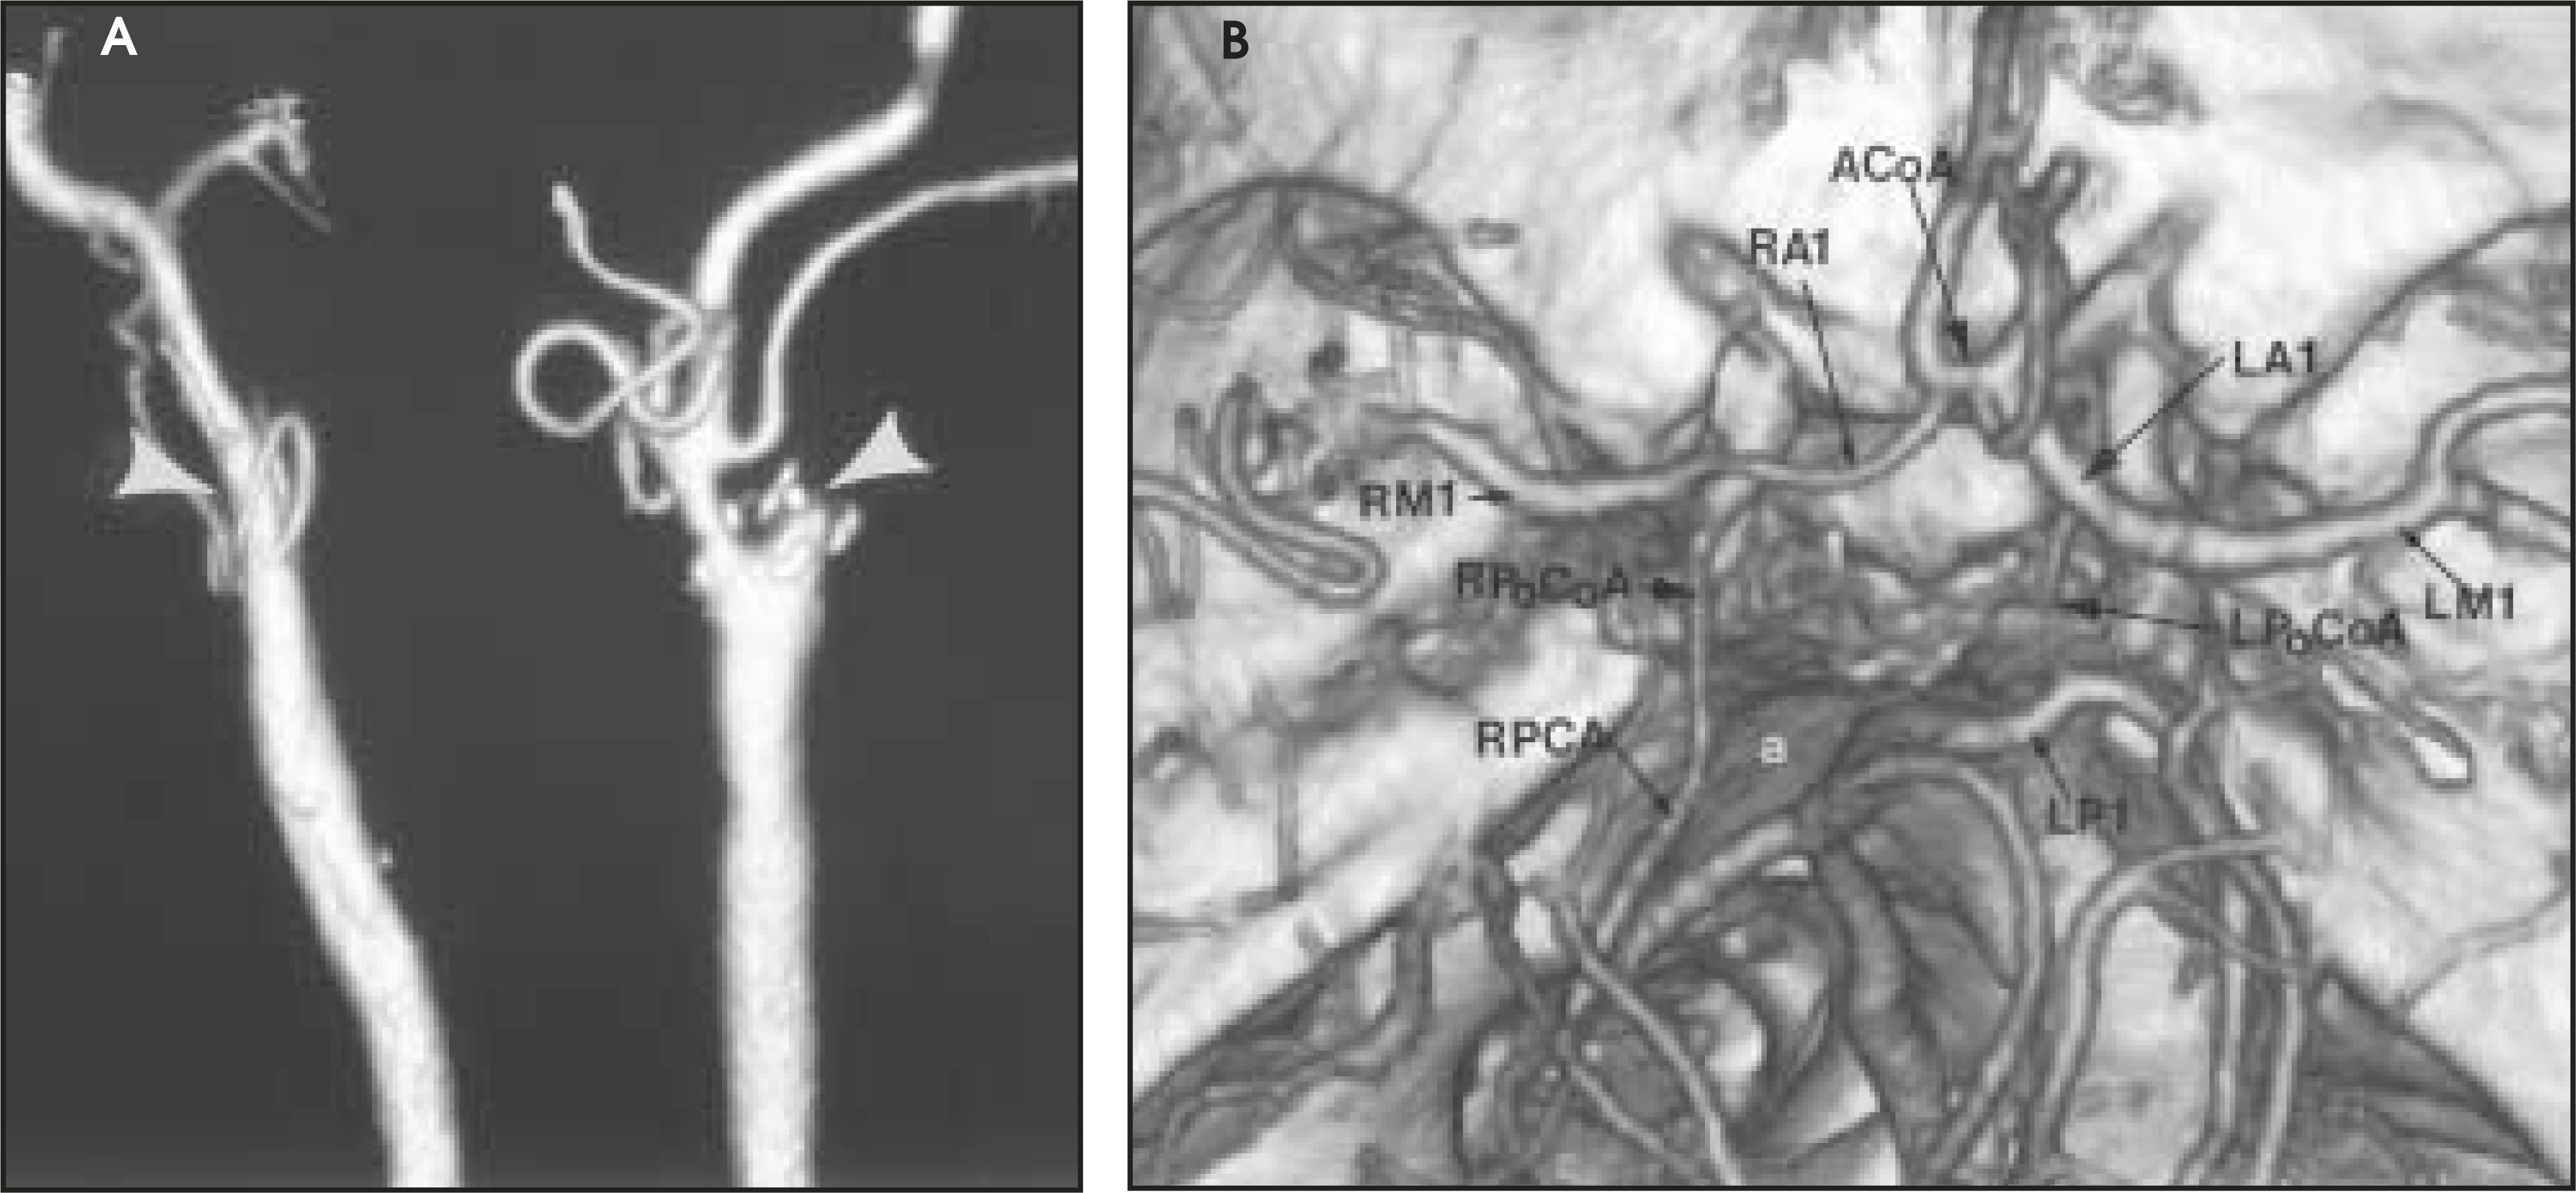
Conclusion
The current role of imaging in patients with acute onset of stroke-like symptoms not only includes ruling out nonvascular causes of stroke-like symptoms, excluding intracranial hemorrhage, and defining the extent of an acute ischemic process, but also differentiating between the infarcted core and the ischemic penumbra of an area of acute ischemic change and, if possible, to identify the cause of an acute ischemic process. Standard CT and MR scanning, diffusion/perfusion MR, perfusion CT, and CTA (and possibly MRA) each has a potential role in defining an abnormality and determining appropriate emergent management in these patients. In the future, it is hoped that some combination of these imaging techniques, and possibly others (eg, MR spectroscopy, MR tensor imaging), will help identify potentially salvageable brain tissue beyond the currently accepted short (3- to 6-hour) window.
References
- Heart Disease and Stroke Statistics—2003 Update. 2003.
- National Institute of Neurological Disorders and Stroke rt-PA Stroke Study Group. Tissue plasminogen activator for acute ischemic stroke. N Engl J Med. 1995;333:1581-1587.
- Del Zoppo G, Higashida R, Furlan A. PROACT: A phase II randomized trial of recombinant pro-urokinase by direct arterial delivery in acute middle cerebral artery stroke. PROACT Investigators. Prolyse in Acute Cerebral Thromboembolism. Stroke. 1998;29:4-11.
- Furlan A, Higashida R, Wechsler L. Intra-arterial prourokinase for acute ischemic stroke. The PROACT II study: A randomized controlled trial. Prolyse in Acute Cerebral Thromboembolism. JAMA. 1999;282:2003-2011.
- Patel S, Levine S, Tilley B. Lack of clinical significance of early ischemic changes on computed tomography in acute stroke. JAMA. 2001;286:2830-2838.
- Tomsick T, Brott T, Chambers A. Hyperdense middle cerebral artery sign on CT: Efficacy in detecting middle cerebral artery thrombosis. AJNR Am J Neuroradiol. 1990;11:473-477.
- Tomsick T, Brott T, Barsan W. Prognostic value of the hyperdense middle cerebral artery sign and stroke scale score before ultra-early thrombolytic therapy. AJNR Am J Neuroradiol. 1996;17:79-85.
- Provenzale J, Jahan R, Naidich T. Assessment of the patient with hyperacute stroke: Imaging and therapy. Radiology. 2003;229:347-359.
- Tomandl B, Hastreiter P, Iserhardt-Bauer S. Standardized evaluation of CT angiography with remote generation of 3D video sequences for the detection of intracranial aneurysms. RadioGraphics. 2003;23.
- Hacke W, Kaste M, Fieschi C. Intravenous thrombolysis with recombinant tissue plasminogen activator for acute hemispheric stroke. The European Cooperative Acute Stroke Study (ECASS). JAMA. 1995;274:1017-1025.
- Von Kummer R, Bourquain H, Bastianello S. Early prediction of irreversible brain damage after ischemic stroke at CT. Radiology. 2001;219:95-100.
- Moseley M, Butts K, Stark D, Bradley W. Magnetic Resonance Imaging. 1999:1515-1538.
- DeLano M, Cao Y. High b-value diffusion imaging. Neuroimag Clin North Am Imaging. 2002;12:21-34.
- Kidwell C, Saver J, Mattiello J. Thrombolytic reversal of acute human cerebral ischemic injury shown by diffusion/perfusion magnetic resonance imaging. Ann Neurol. 2000;47:462-469.
- Wang P, Barker P, Wityk R. Diffusion-negative stroke: A report of two cases. AJNR Am J Neuroradiol. 1999;20:1876-1880.
- Kaufmann A, Firlik A, Fukui M. Ischemic core and penumbra in human stroke. Stroke. 1999;30:93-99.
- Rohl L, Ostergaard L, Simonsen C. Viability thresholds of ischemic penumbra of hyperacute stroke defined by perfusion-weighted MRI and apparent diffusion coefficient. Stroke. 2001;32:1140-1146.
- Simonsen C, Rohl L, Vestergaard-Poulsen P. Final infarct size after acute stroke: Prediction with flow heterogeneity. Radiology. 2002;225:269-275.
- Karonen J, Liu Y, Vanninen R. Combined perfusion- and diffusion-weighted MR imaging in acute ischemic stroke during the 1st week: A longitudinal study. Radiology. 2000;217:886-894.
- Sunshine J, Bambakidis N, Tarr R. Benefits of perfusion MR imaging relative to diffusion MR imaging in the diagnosis and treatment of hyperacute stroke. AJNRAm J Neuroradiol. 2001;22:915-921.
- Hatazawa J, Shimosegawa E, Toyoshima H. Cerebral blood volume in acute brain infarction: A combined study with dynamic susceptibility contrast MRI and 99mTc-HMPAO-SPECT. Stroke. 1999;30:800-806.
- Neumann-Haefelin T, Wittsack H, Wenserski F. Diffusion- and perfusion-weighted MRI: The DWI/PWI mismatch region in acute stroke. Stroke. 1999;30:1591-1597.
- Albers G. Expanding the window for thrombolytic therapy in acute stroke. The potential role of acute MRI for patient selection. Stroke. 1999;30:2230-2237.
- Konig M, Klotz E, Heuser L. Diagnosis of cerebral infarction using perfusion CT: State of the Art. Electromedia. 2000;68:9-10.
- Radaideh M, Devine C, Schomer D. Correlating the basic chronological pathophysiologic neuronal changes in response to ischemia with multisequence MRI imaging. Neurographics. 2003;2:1.
- Chuang Y, Chao A, Teng M. Use of CT angiography in patient selection for thrombolytic therapy. Am J Emerg Med. 2003;21:167-172.
Citation
. Imaging of acute stroke. Applied Radiology. 2005;34(2):10-19. doi:10.37549/AR1319.