Imaging of ovarian cancer
Applied Radiology — Vol. 34 , Issue 9 , pp. 11 -11
DOI: 10.37549/AR1366
Published: September 1, 2005
Categories
Ovarian cancer is the second most common gynecologic malignancy and is the fifth leading cause of cancer death in women.1 Nearly 75% of women with ovarian cancer present with advanced stage disease, which is associated with a poor prognosis.2 There has been a relative standstill in the progress of treating ovarian cancer that has been attributed to the late stage of disease presentation.3 Ovarian neoplasms can be classified based on cells of their origin into epithelial, germ cell, sex cord stromal, or metastatic types. Epithelial tumors account for nearly 85% to 90% of all ovarian malignancies.4 Histologic subtypes in epithelial ovarian cancer include serous, mucinous, endometrioid, clear cell, and undifferentiated tumors. In advanced stage disease, they are all associated with a similarly poor prognosis.
Ovarian cancer can metastasize through intraperitoneal spread (most common), or lymphatic or hematogenous invasion. Staging of ovarian cancer is based on the findings at an exploratory laparotomy. A complete staging exploratory laparotomy includes a hysterectomy with bilateral salpingo-oophorectomy, omentectomy, random peritoneal biopsies and washings, and pelvic/para-aortic lymph node biopsies.5 The International Federation of Gynecology and Obstetrics (FIGO) system, which is surgically based, is the most commonly used staging system (Table 1).3 The staging of ovarian cancer is critical, as it affects both the prognosis and the treatment of the patient. The 5-year survival rate of ovarian cancer varies from 80% for stage I disease to 8% for stage IV disease.6 The role of imaging in ovarian cancer involves detection, characterization, and staging. Imaging plays an important role in characterization of ovarian masses, as the number of benign ovarian masses greatly exceeds the number of malignant masses.
Ultrasound
The easy accessibility and relative low cost of ultrasound have made it the study of choice in the initial evaluation of a patient with a suspected adnexal mass.7 Compared with transabdominal ultrasound (3 to 5 MHz), transvaginal ultrasound uses 8-MHz probes, which provide significantly improved resolution of the adnexa.
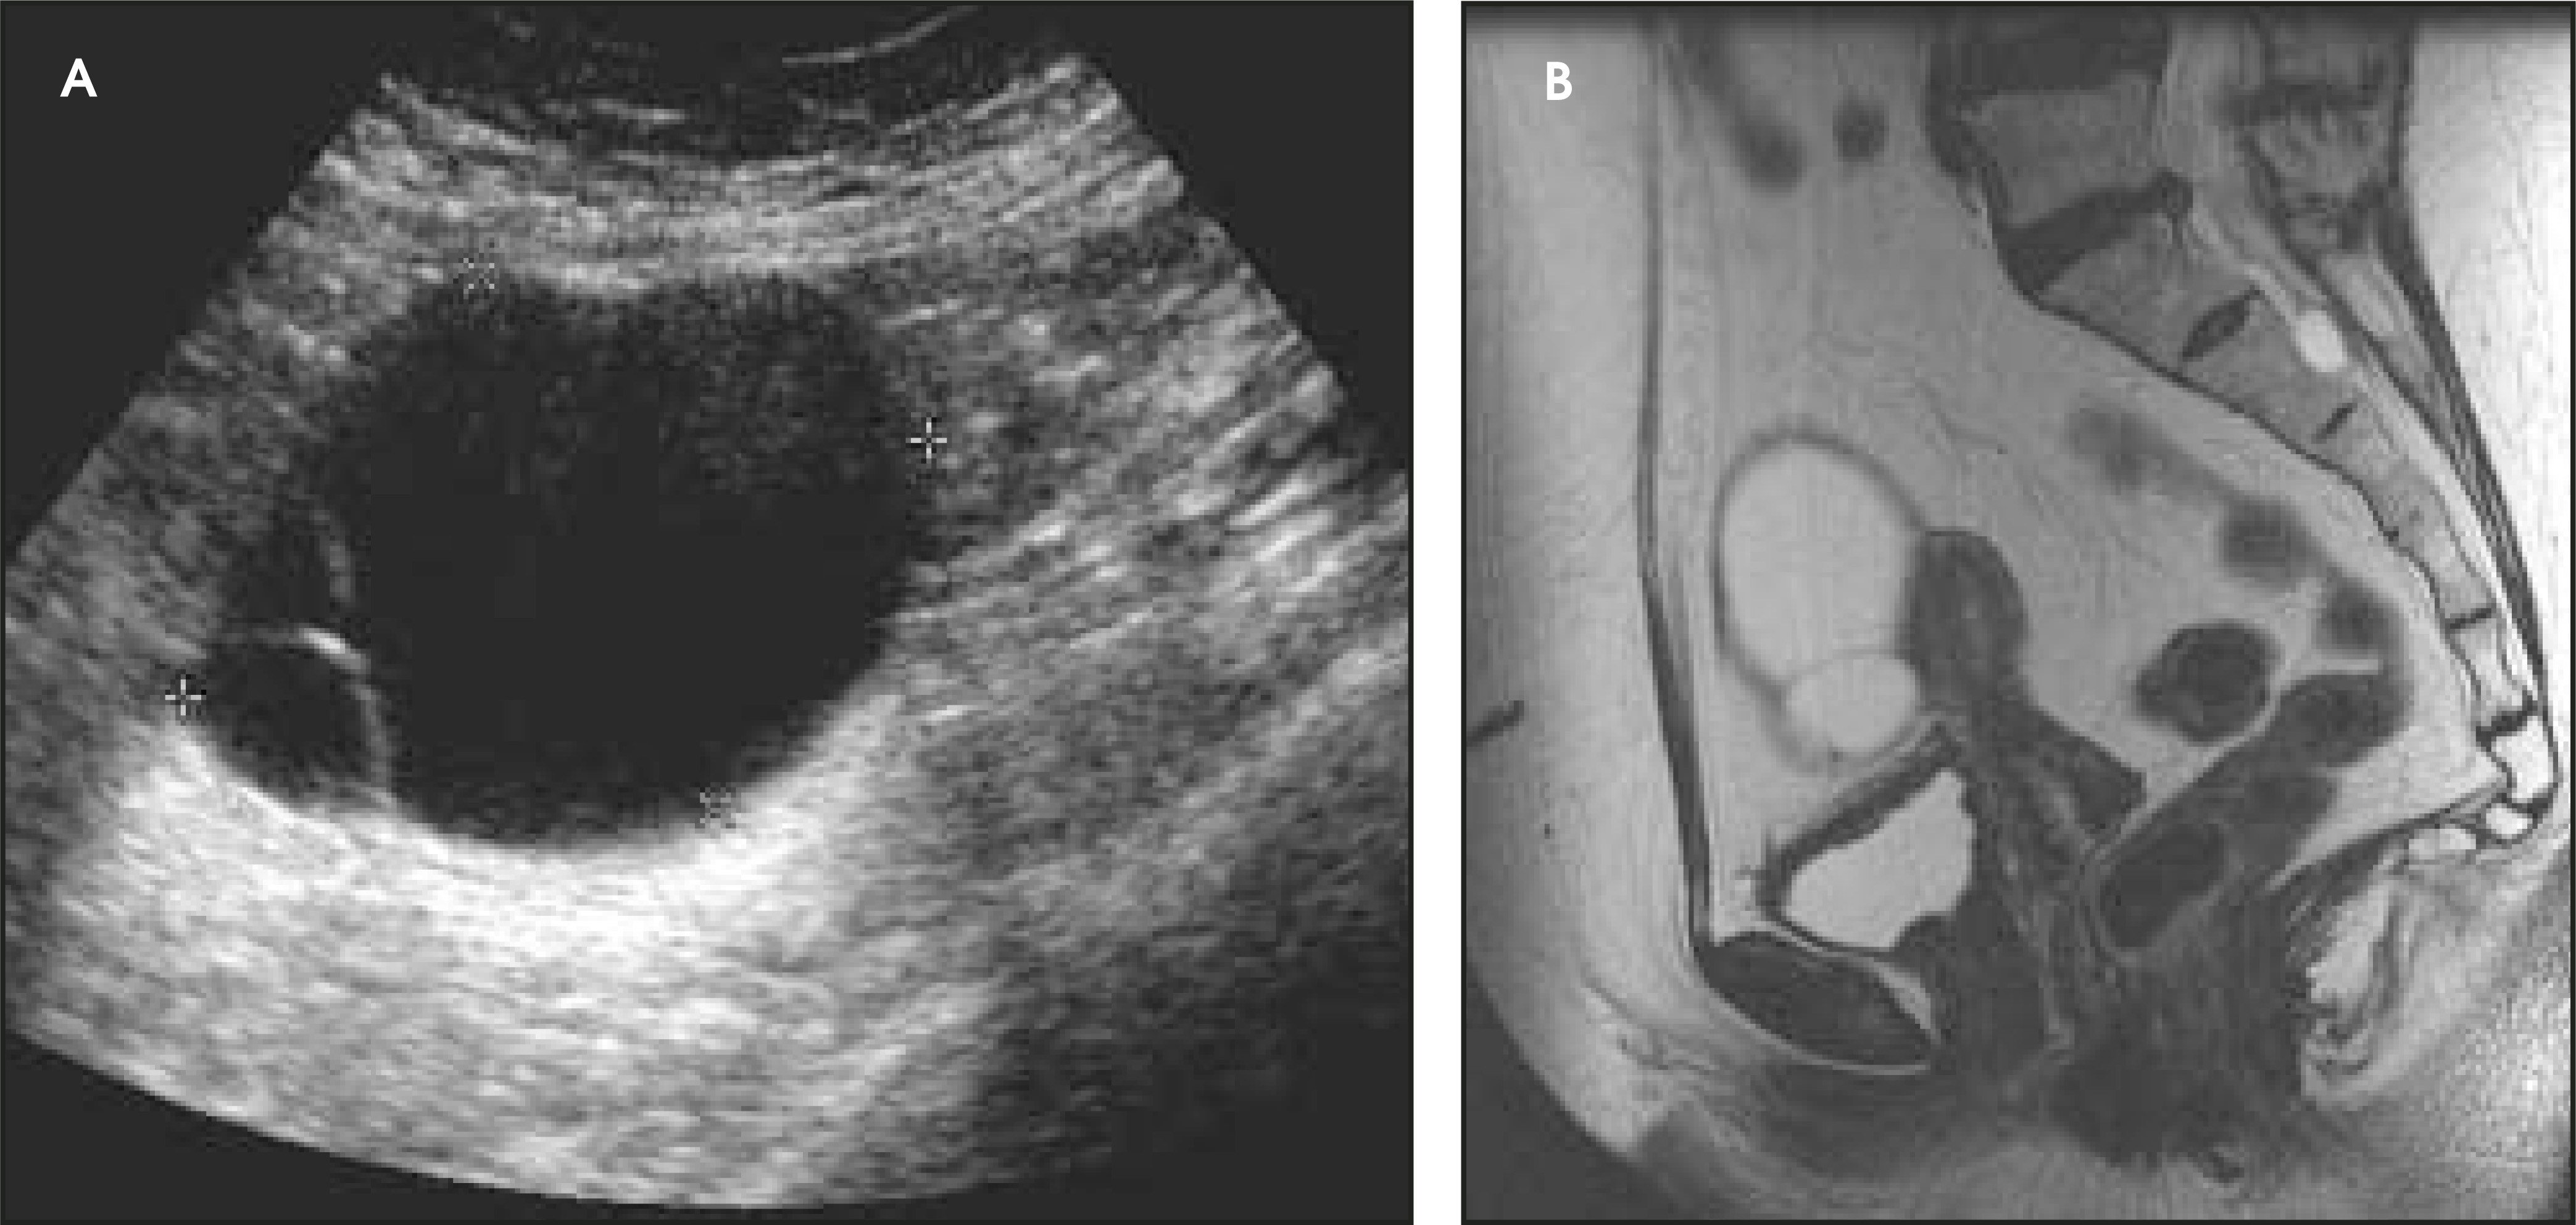
Unilocular simple anechoic cysts <5 cm in diameter are considered to be seldom malignant even in postmenopausal women. Multilocular cysts with wall thickness >3 mm, mural nodularity, papillary projections, septations >3 mm in thickness, and solid ovarian masses or masses with solid components are considered to be suggestive of ovarian cancer.8-11 The single most predictive sonographic feature of malignancy in cystic masses is papillary projections. The ultrasound appearance of benign and malignant ovarian lesions is shown in Figures 1 through 3.
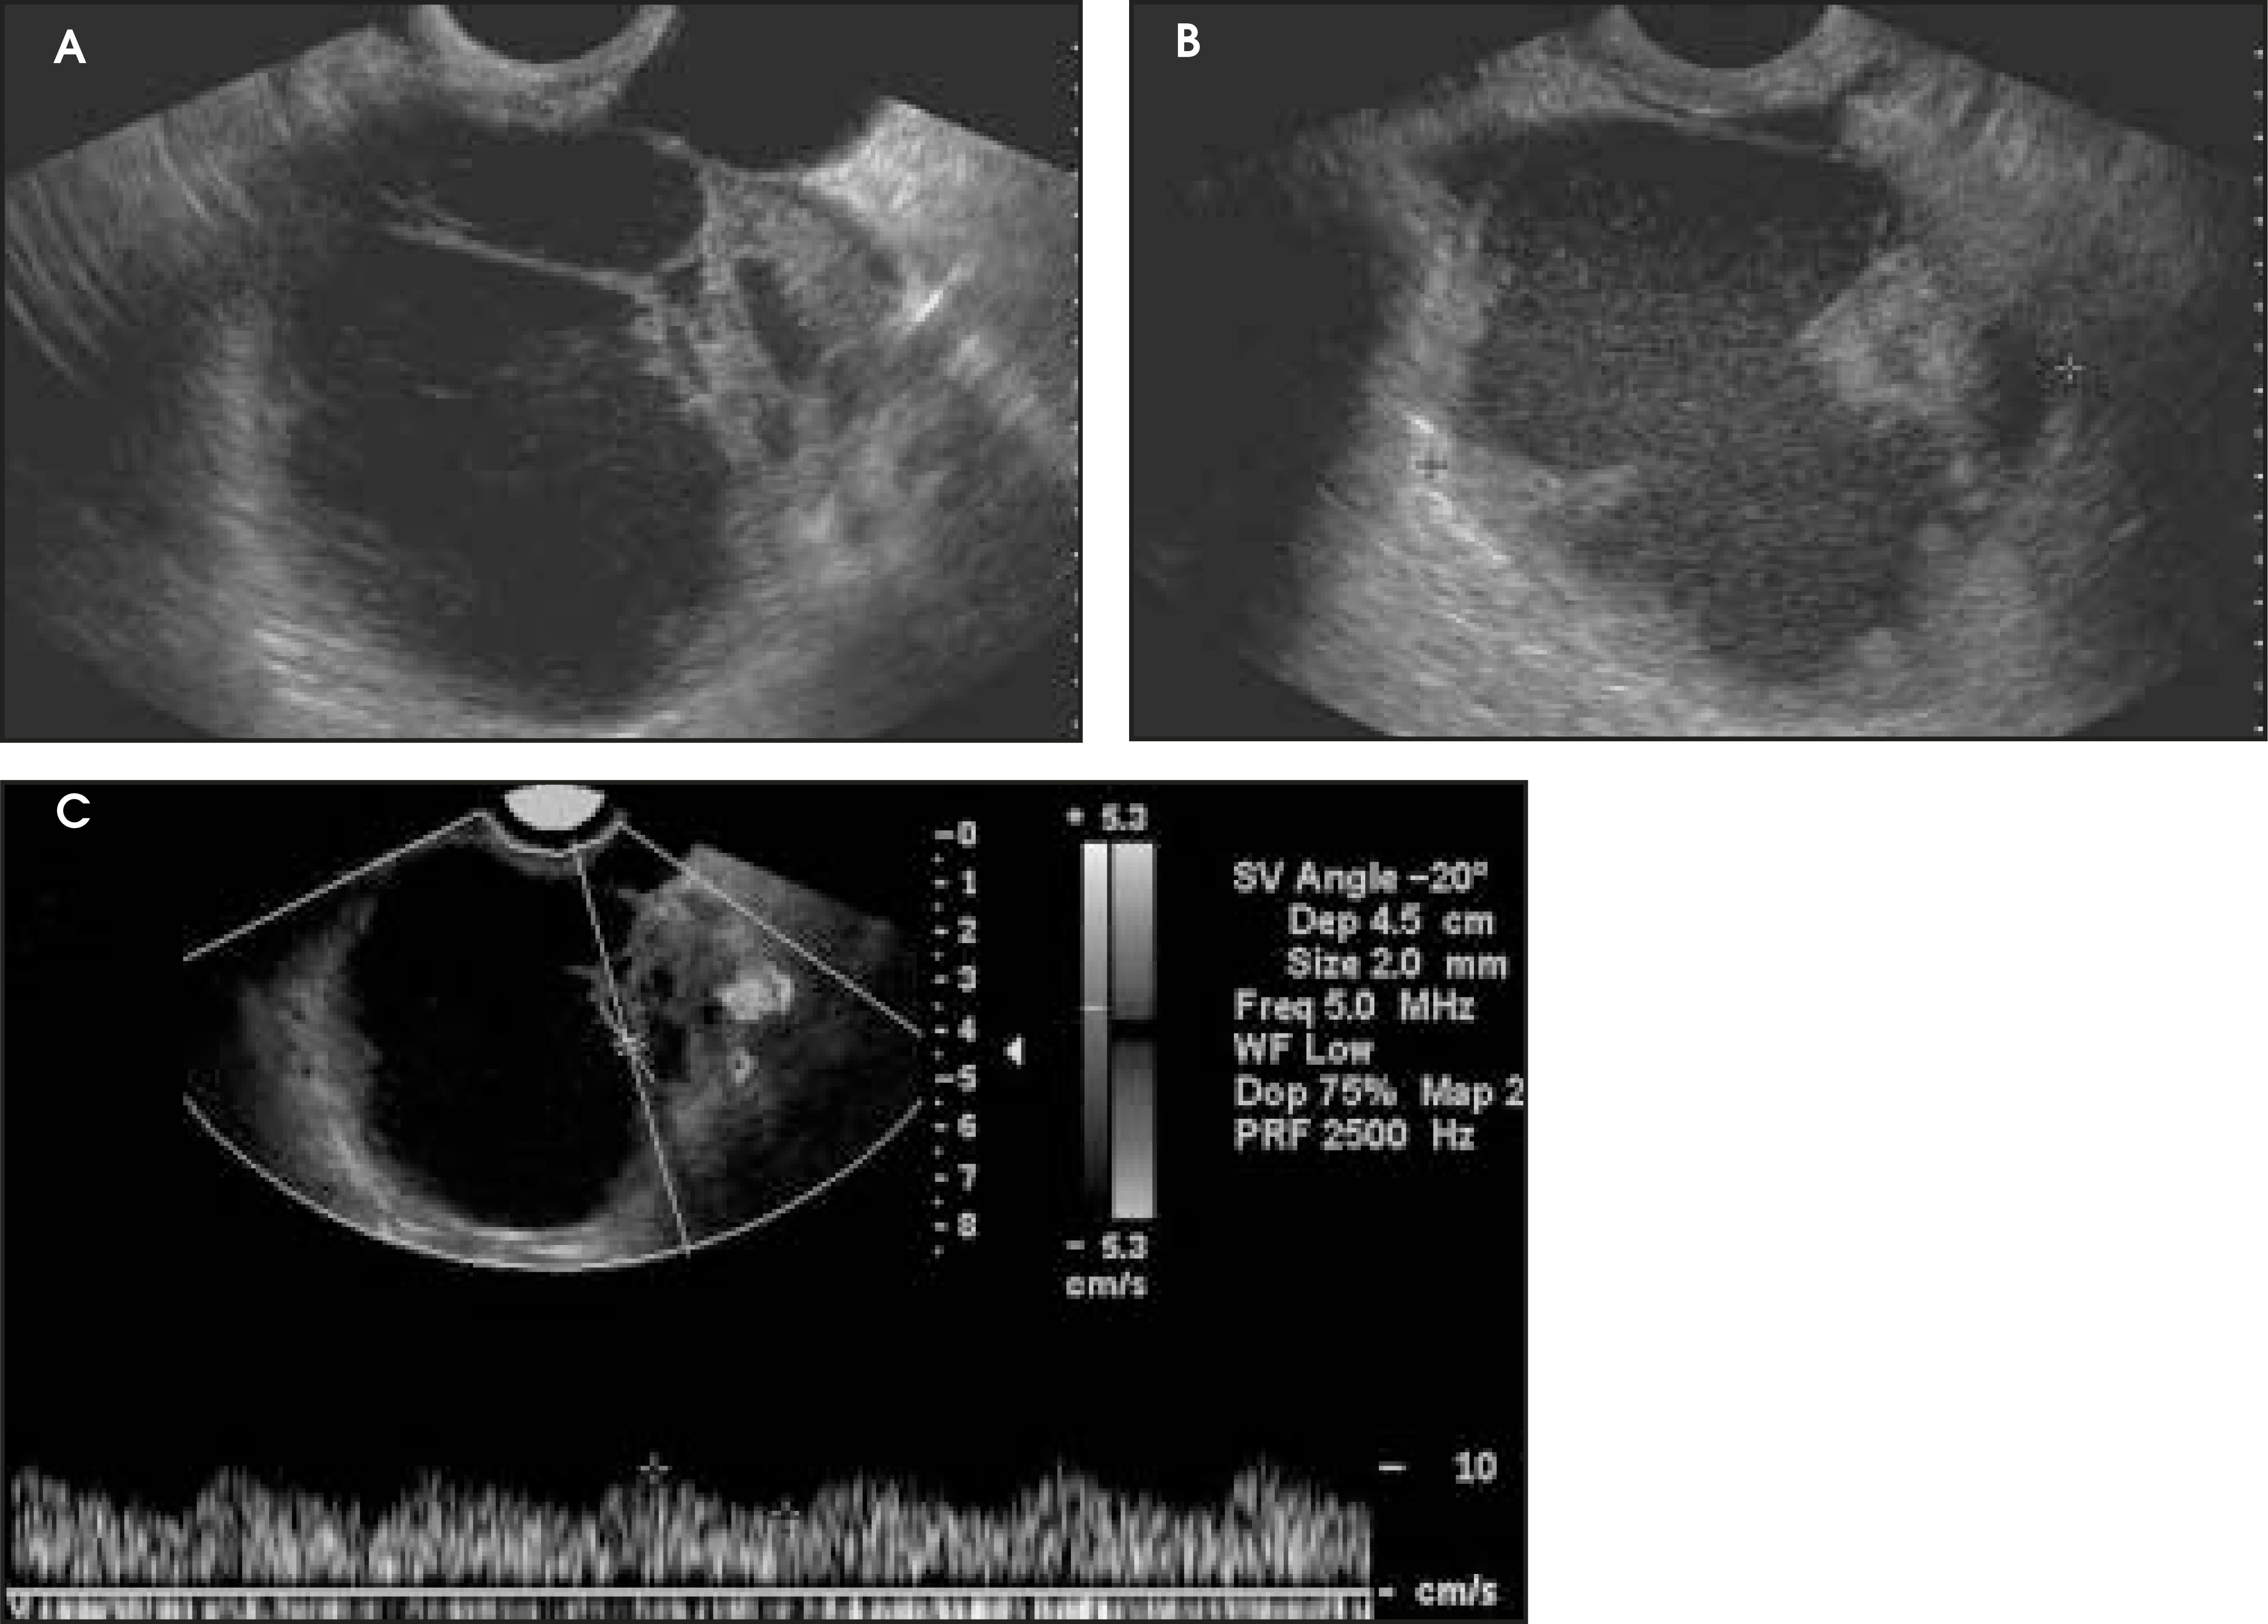
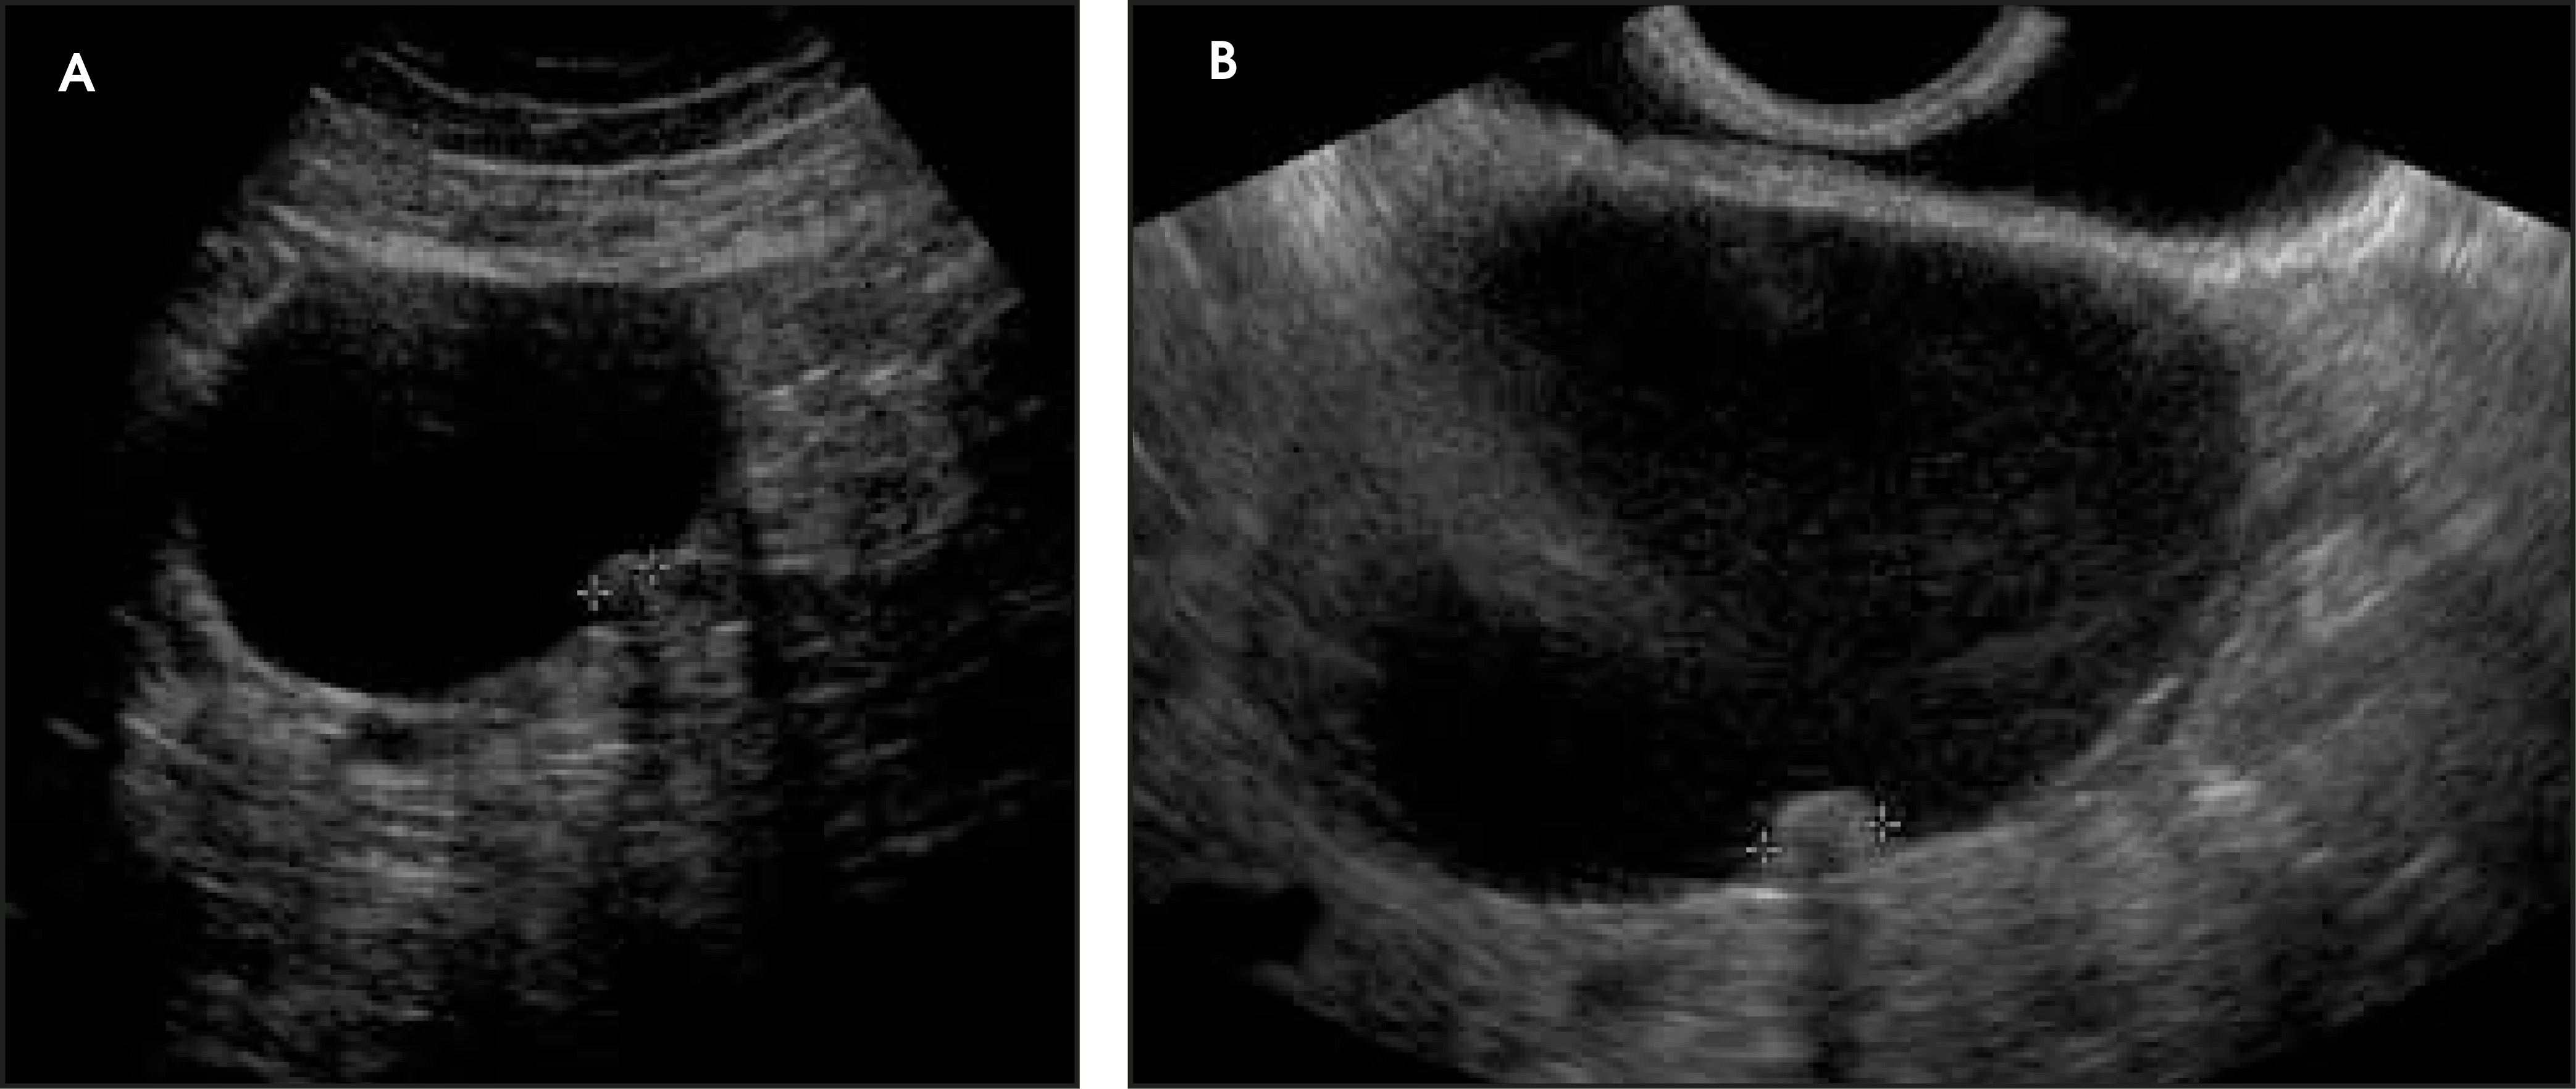
Some authors have also proposed morphologic scoring systems.8-11 Numerical scores are assigned to morphologic features, such as wall structure, cyst wall thickness, septations, and echogenicity. These scoring systems have helped to standardize the interpretation of ultrasound images. The sensitivity of morphologic analysis with ultrasound in predicting malignancy in ovarian tumors has been shown to be 85% to 97%, whereas its specificity ranges from 56% to 95%.7 Color and pulsed Doppler ultrasound have also been used in the evaluation of ovarian masses. The presence of central blood flow within an ovarian mass is considered to be suggestive of malignancy.12 The resistive index (RI) and pulsatility index (PI) have been used in the evaluation of ovarian masses because of the expected low impedance and high diastolic blood flow seen in blood vessels supplying the malignant tumor. Typically, an RI less than 0.4 to 0.8 and a PI <1 are considered to be suggestive of malignancy.12-17 However, due to operator dependence and overlap of these indices between malignant and benign lesions (such as in pelvic inflammatory disease and endometriosis), the usefulness of color and pulsed Doppler is limited.13-17
Currently, there is no consensus opinion on the use of Doppler ultrasound for the differentiation between benign and malignant ovarian masses. The combined use of morphologic scoring and Doppler ultrasound in evaluating ovarian masses has proven to be more effective than the use of either morphologic assessment or Doppler assessment alone.10,17-19 A large multicenter trial comparing ultrasound, computed tomography (CT), and magnetic resonance imaging (MRI) in the diagnosis and staging of ovarian cancer showed little difference between these modalities. The lowest sensitivity and highest specificity for diagnosis was found with ultrasound. These authors found that if stage III disease is not detected at the initial abdominal ultrasound, then CT or MRI should be performed because these modalities were found to have higher sensitivity in the detection of peritoneal implants beyond the pelvis.20 Evaluation of all peritoneal implants by ultrasound has significant limitations, including operator dependence, that require a meticulous search of all peritoneal surfaces and the presence of overlying bowel gas that may obscure lesions.21,22
At our institution, we perform transabdominal and transvaginal examinations along with color Doppler for characterization and diagnosis of ovarian masses. The transabdominal portion of the study is performed to evaluate the ovaries in patients with superficially placed ovaries and to evaluate large ovarian masses, which would be depicted in their entirety on the transabdominal images.
CT
A surgical procedure leaving the patient with <1 cm maximal diameter residual disease is considered to be an optimal debulking procedure.23 Clinical trials have shown that optimal surgical debulking is associated with a more favorable response to postoperative chemotherapy and, therefore, prolonged survival.24 The role of preoperative CT in identifying patients who are potential candidates for optimal debulking surgery is extremely important. Studies have been performed using radiographic data as tools for selecting candidates for optimal surgery.23,25 The pattern of tumor growth, such as diaphragmatic involvement, infiltration of the pelvic sidewall, and hydronephrosis, has been implicated in precluding an optimal surgical outcome. In these patients, neoadjuvant therapy is used to reduce the extent of metastatic disease prior to surgical debulking.
CT has been used extensively in the staging of ovarian cancer. Reported rates of accuracy of CT in preoperative staging vary from 60% to 20,26 Preoperative CT can be used to identify sites of disease that are difficult to assess and debulk at surgery. These sites include the surface of the diaphragm, the lesser sac, the mesenteric root, the splenic hilum, and the para-aortic nodes above the renal vessels.23 CT is also used preoperatively to evaluate the lung parenchyma and pleural surfaces for metastatic deposits as well as the paracardiac regions for metastatic lymphadenopathy.
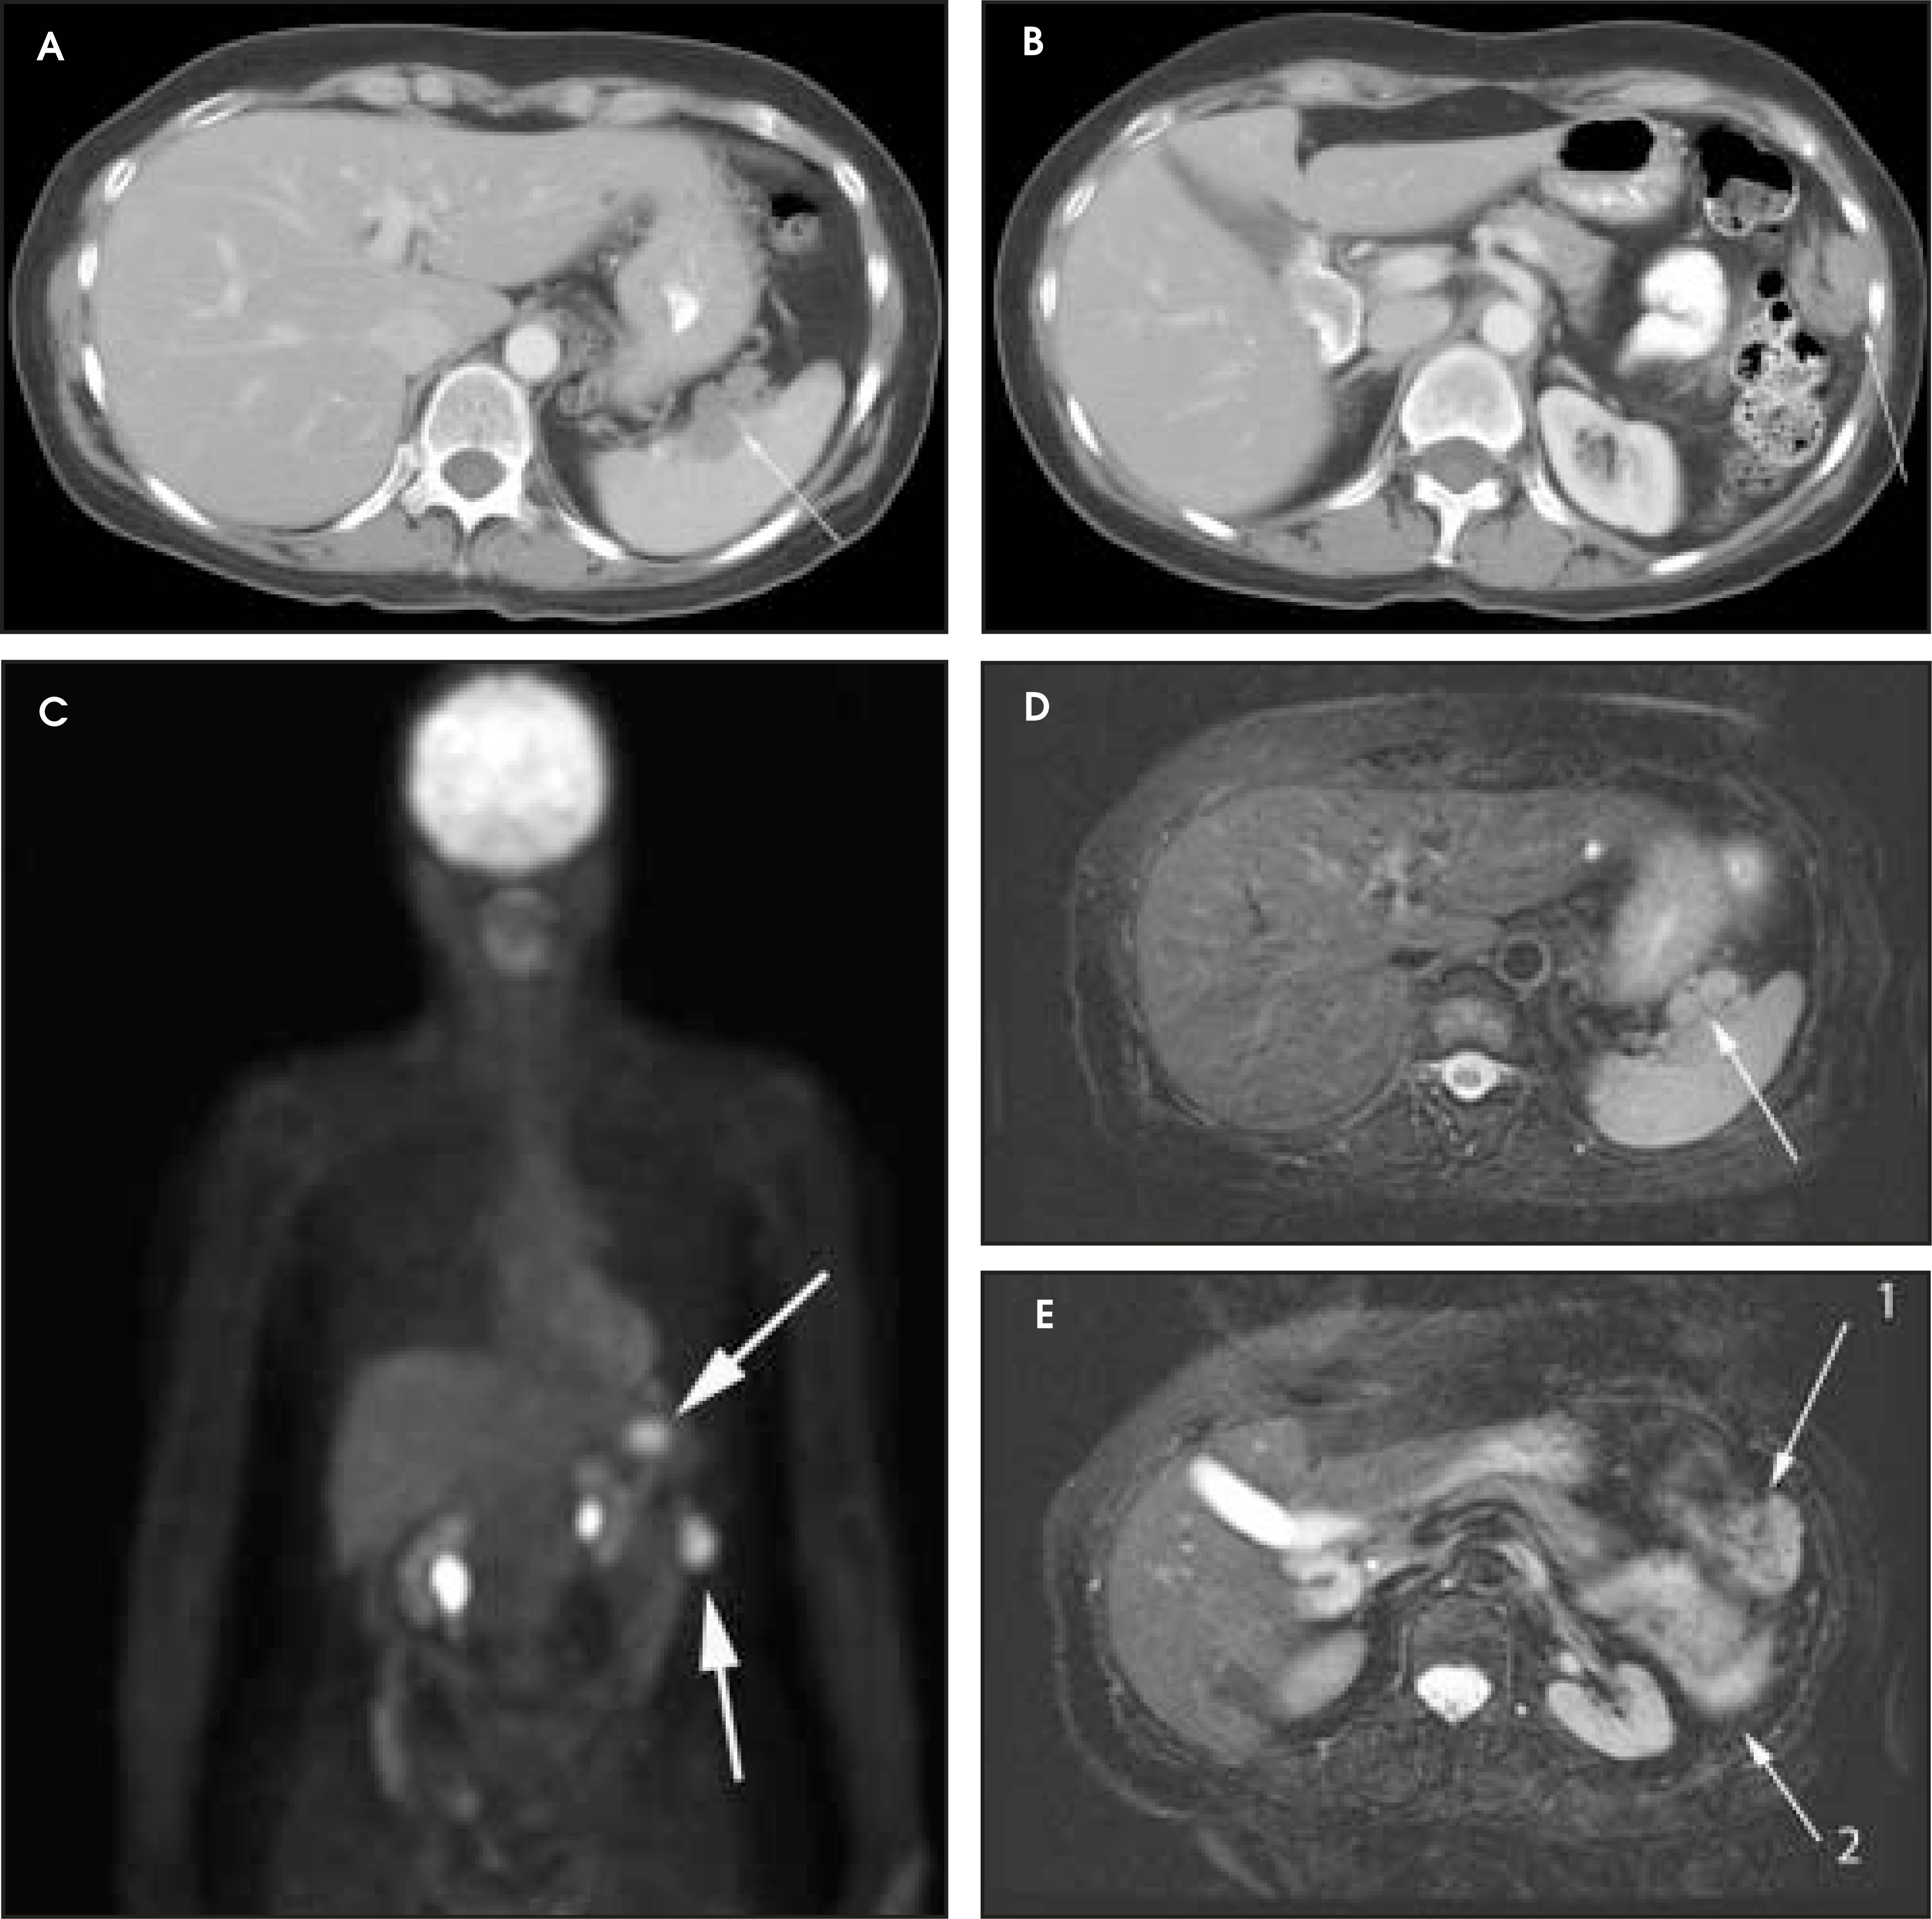
Peritoneal metastases are well depicted on CT due to the rapidity of the scan in evaluating both the abdomen and the pelvis and the use of contrast to distend the bowel. With the use of multidetector CT, there is improved detection of peritoneal implants due to the thinner sections, quicker acquisition, absence of section misregistration, and ability to reformat multiplanar images.27 The CT appearance of peritoneal implants and malignant ovarian masses is shown in Figures 4 through 7. CT is still limited in its ability to detect peritoneal implants <1 cm in size.
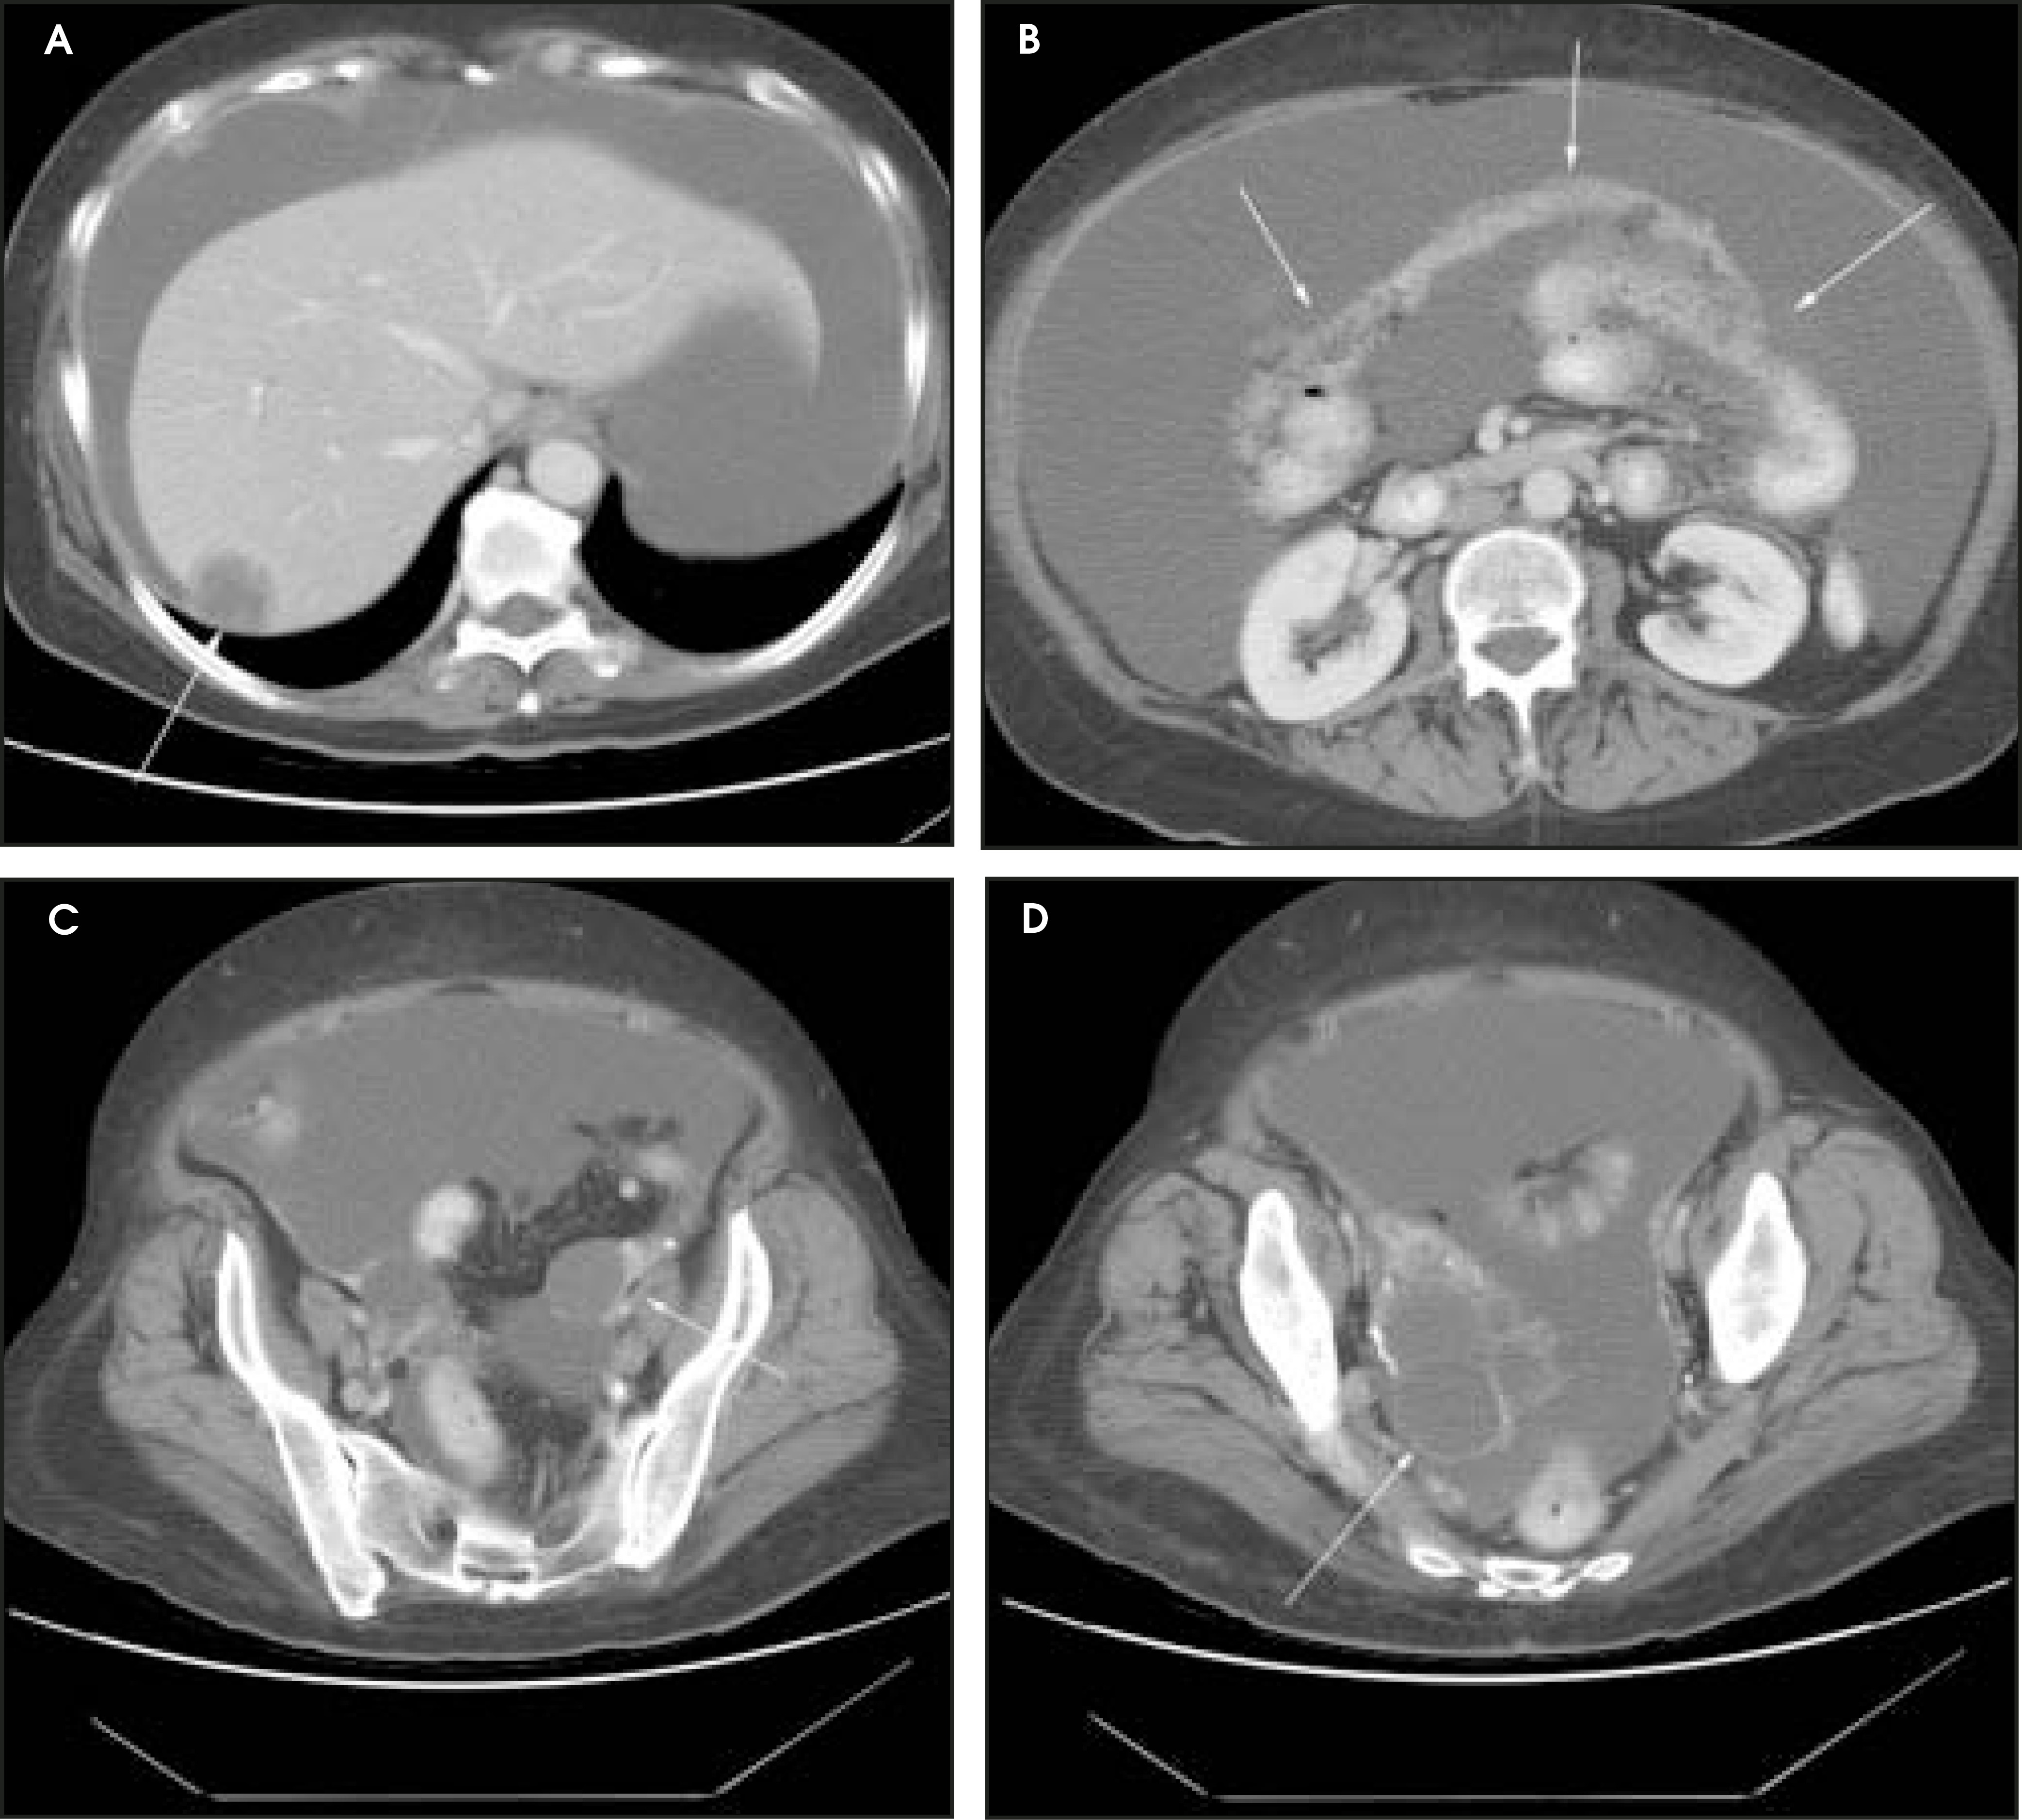
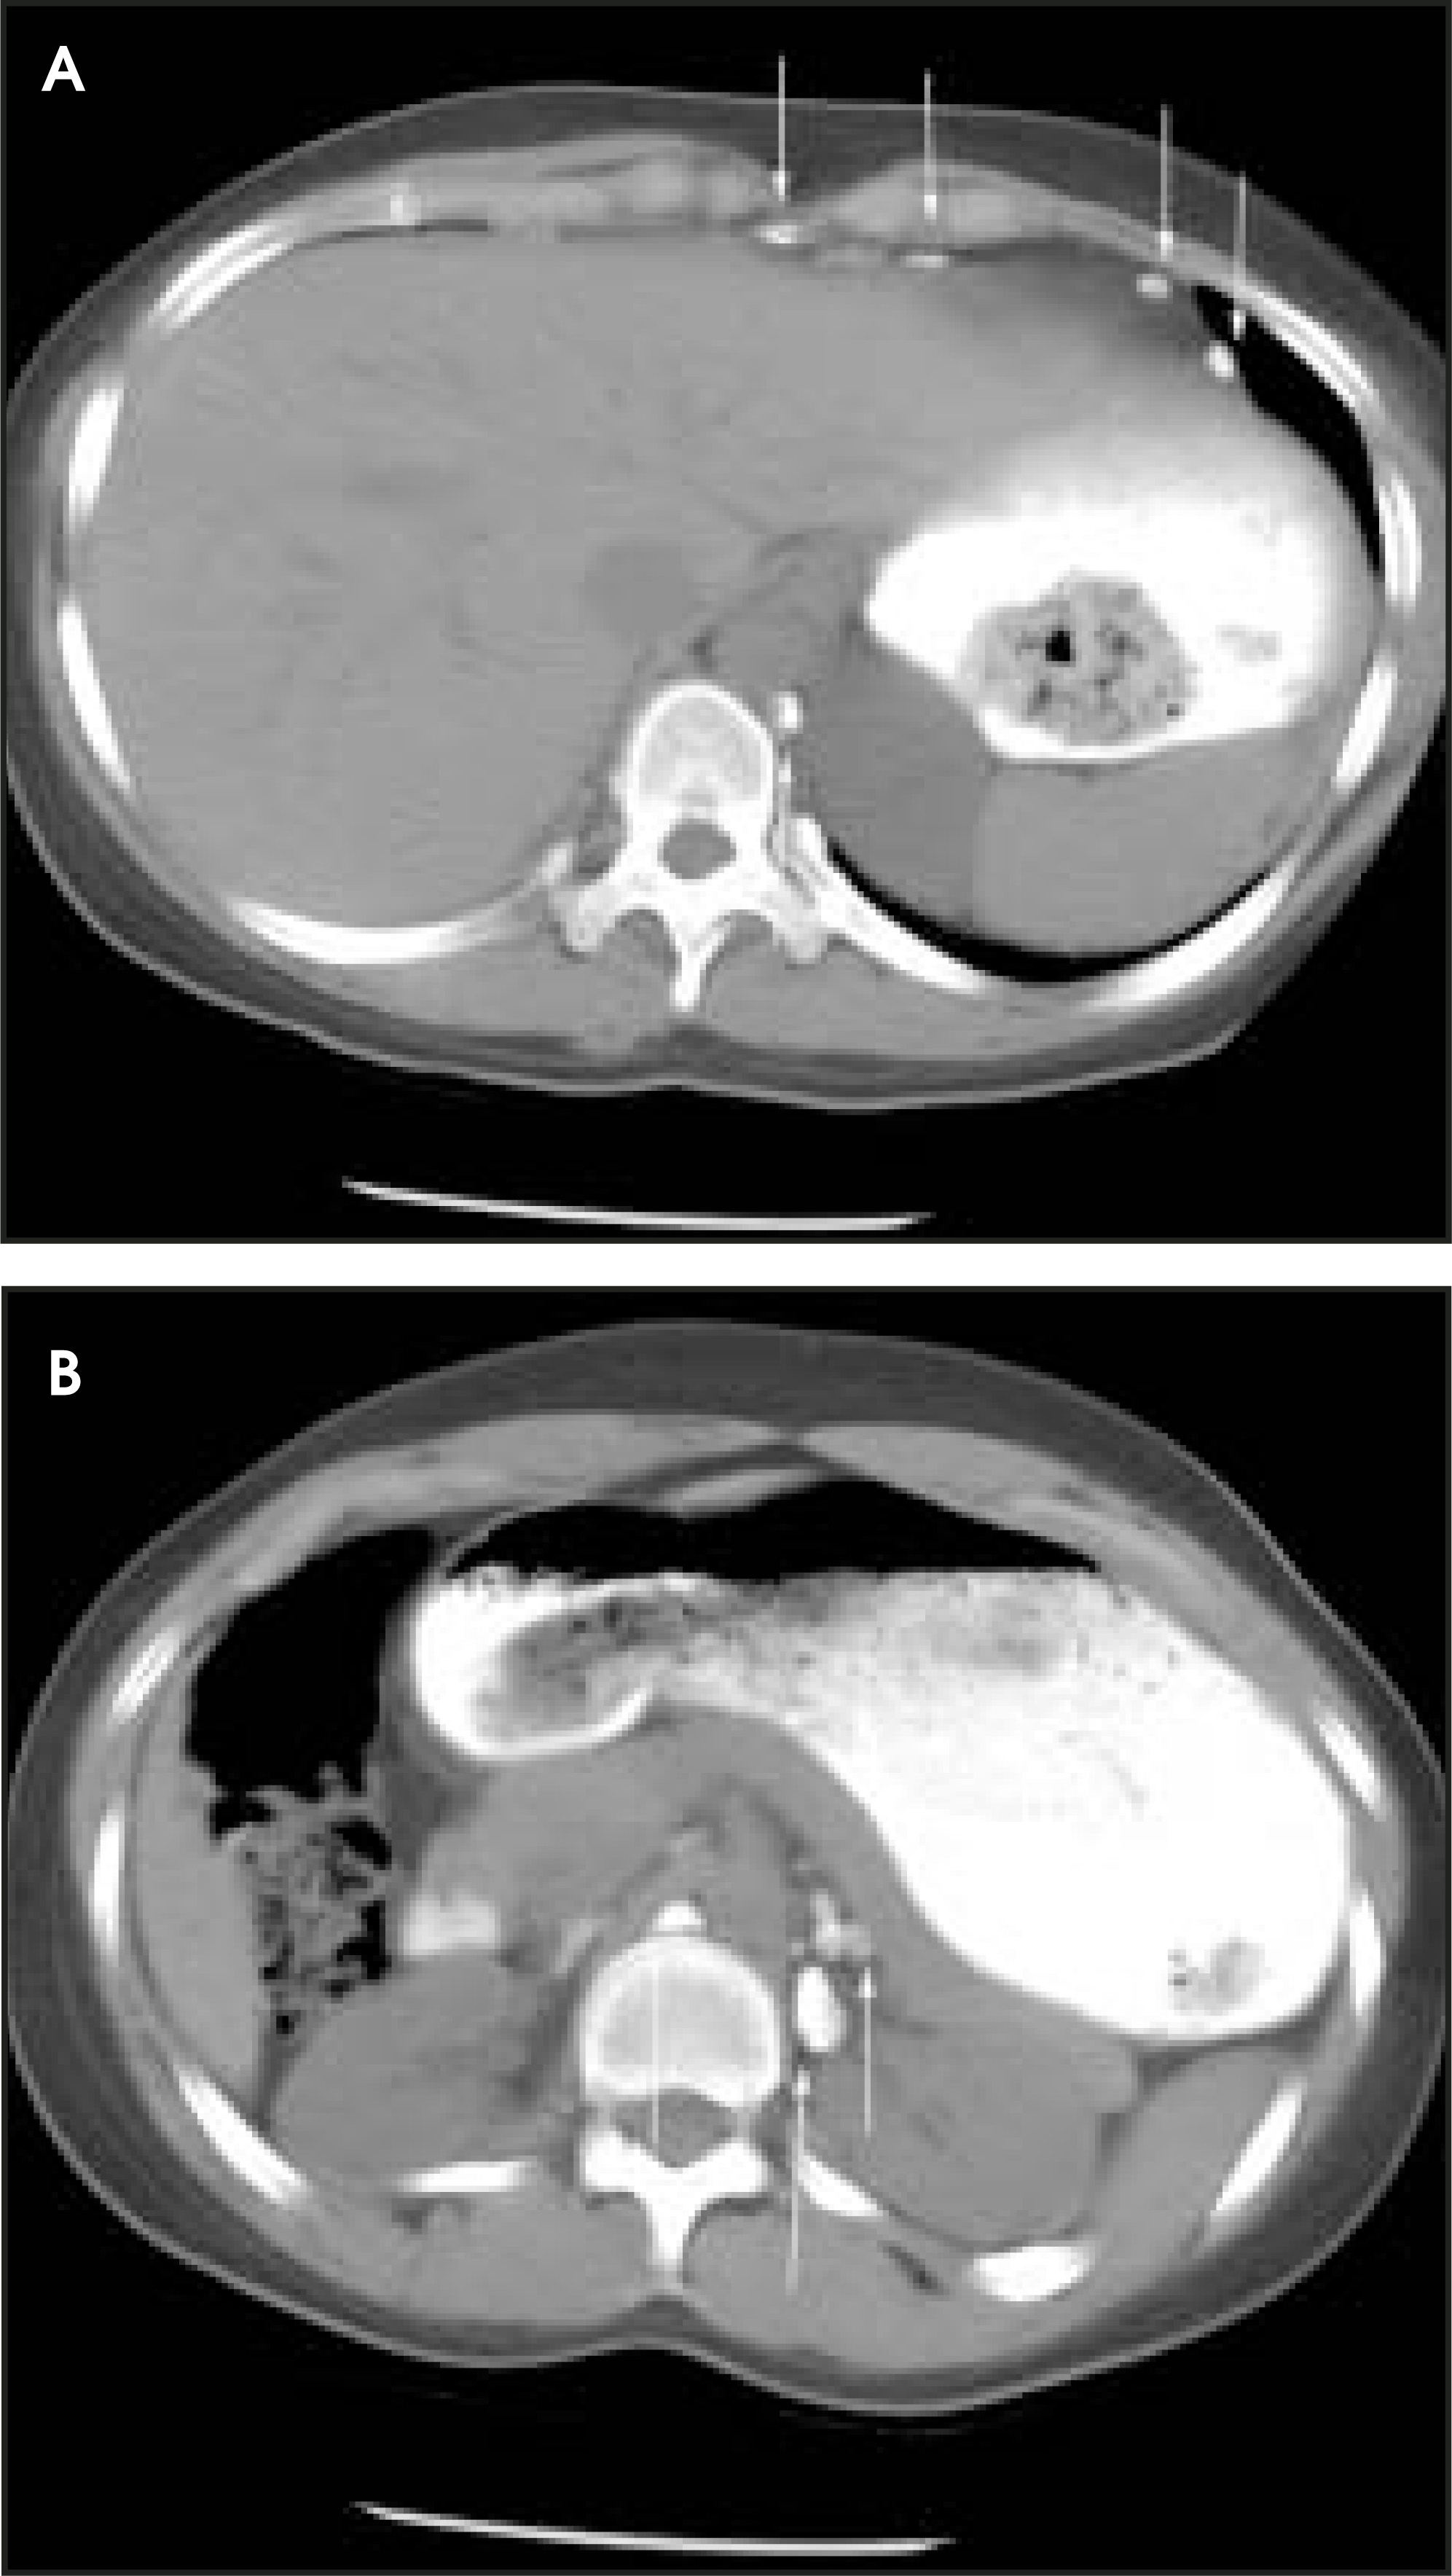
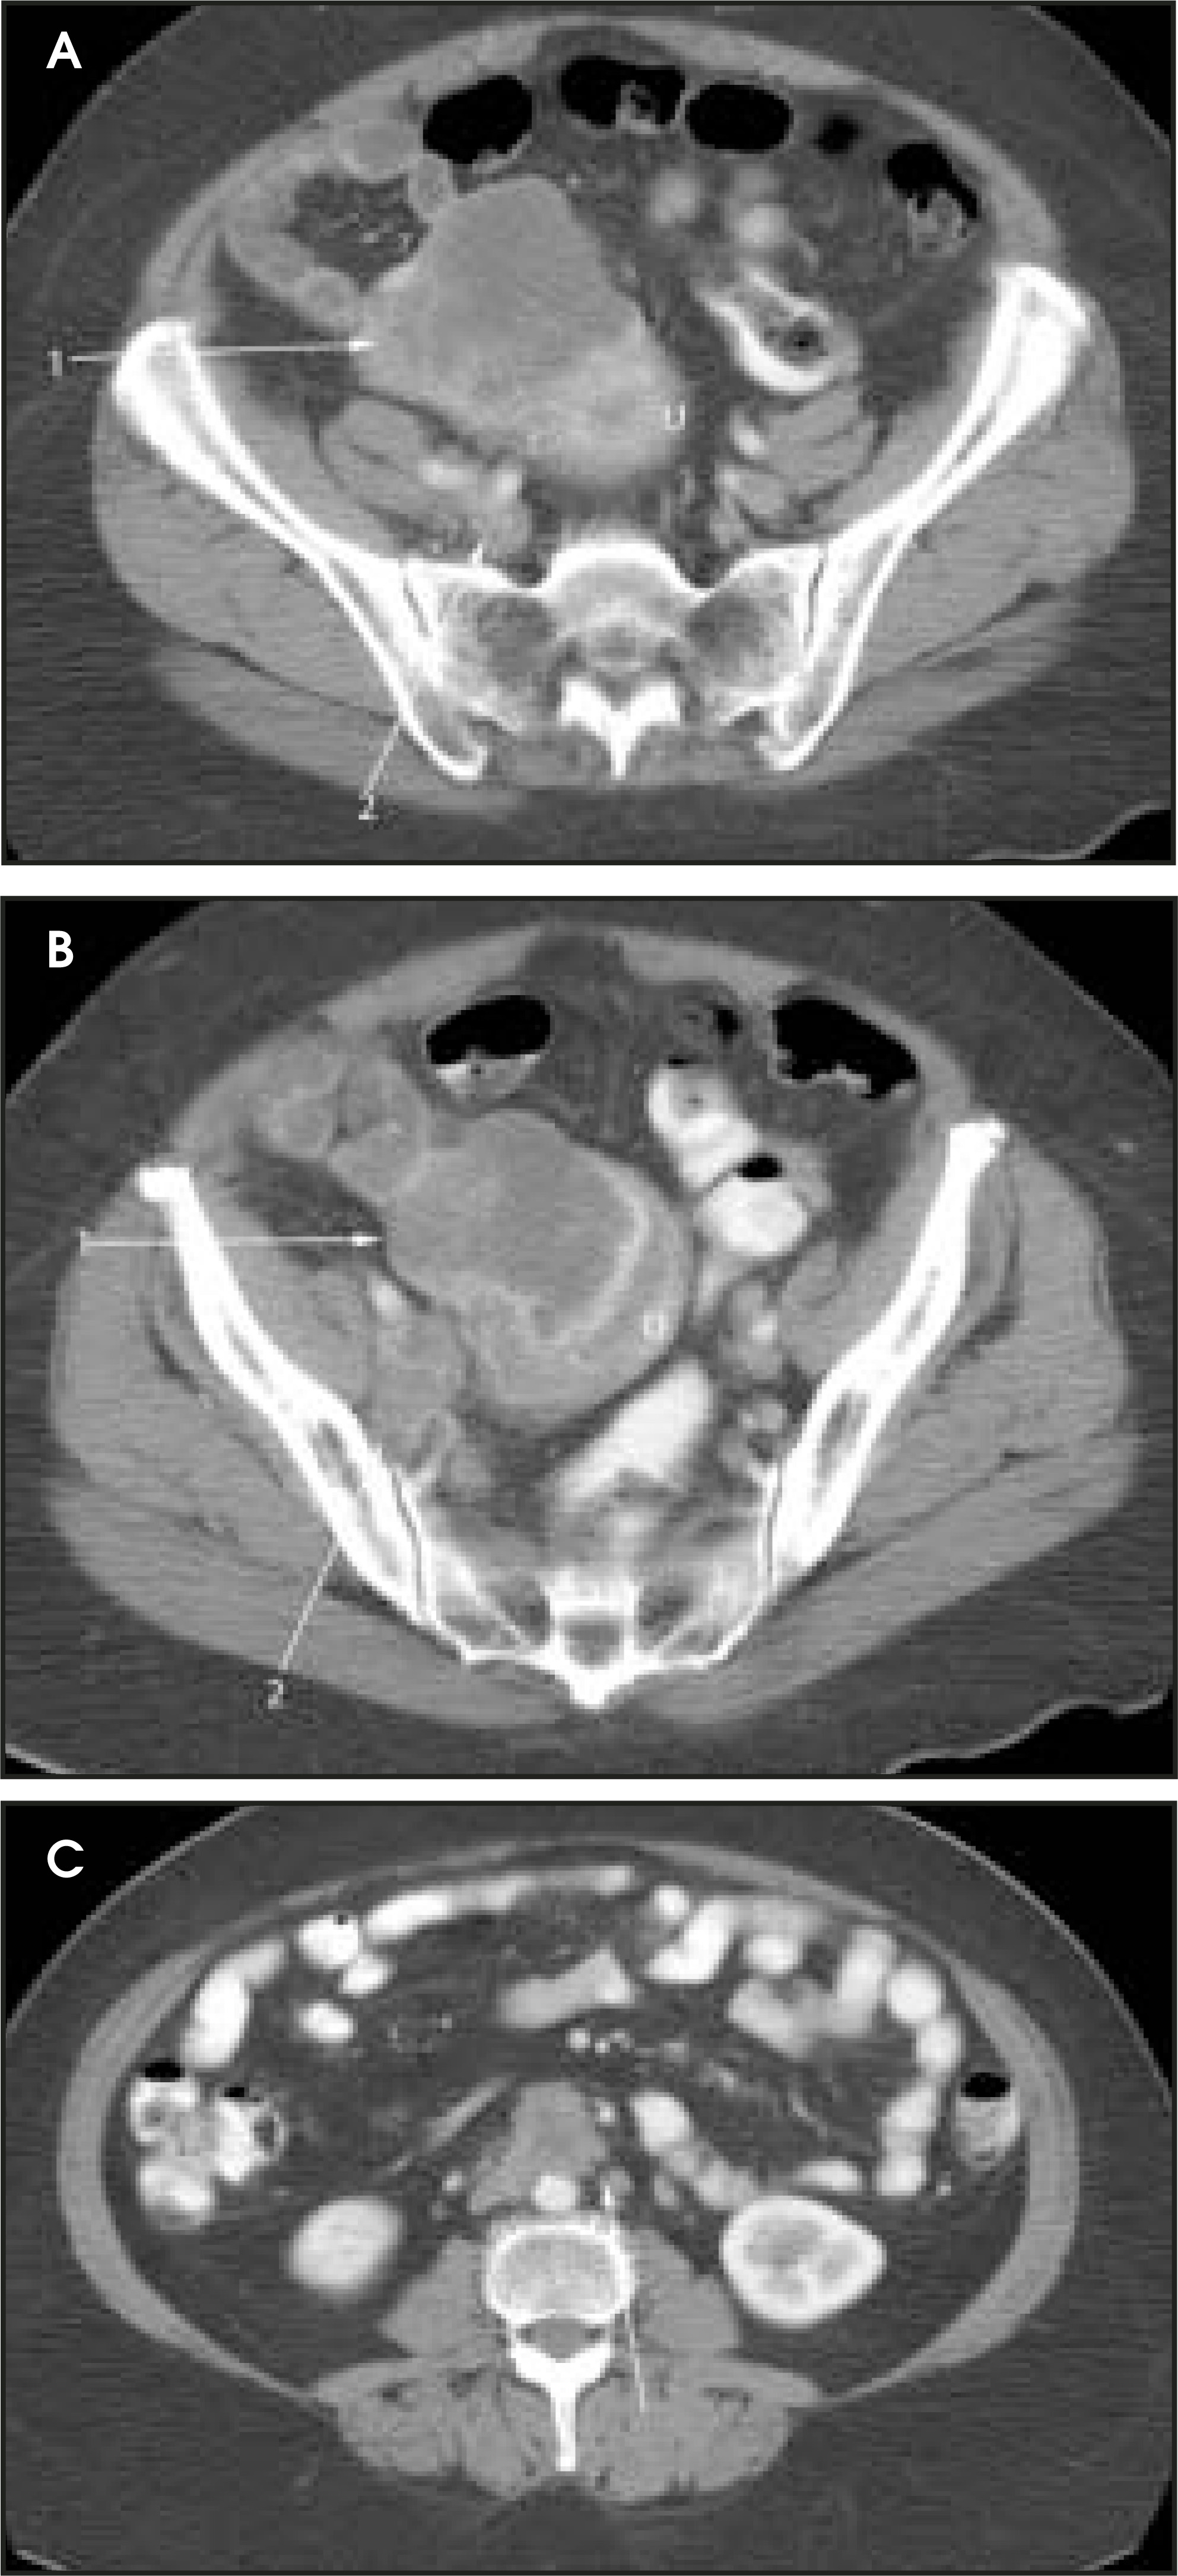
At our institution, we use oral, rectal, and intravenous contrast in our CT studies. Oral contrast is consumed over a period of 90 minutes. Following this, the helical CT scan is performed at 5-mm collimation in the portal-venous phase of contrast enhancement at 60 seconds following the contrast injection. The importance of the use of oral and rectal contrast is to optimally distend both the small and large bowel. This improves the detection of those peritoneal implants that, in the absence of good oral contrast opacification, would not likely be detected because of volume averaging with adjacent small bowel.
MRI
MRI can be used as a problem-solving tool in sonographically indeterminate ovarian masses by providing better tissue characterization. MRI can be extremely accurate in the diagnosis of benign lesions, such as mature cystic teratomas (containing fat), endometriomas (containing blood products), and nondegenerative leiomyomas in the adnexa.28 In most studies, including a large multicenter trial, MRI was shown to be superior to both ultrasound and CT in diagnosing malignancy in indeterminate ovarian masses.20 The findings most predictive of malignancy on MRI are vegetations in a cystic mass and necrosis in a solid tumor. Gadolinium-enhanced imaging is useful in characterizing the internal architecture of cystic lesions. Papillary projections, necrosis in a solid tumor, and septations can be readily detected on contrast-enhanced MRI. Peritoneal implants are best detected on postcontrast, breath-hold, fat-saturated T1-weighted images. MRI and CT have been shown to be equally effective for staging of advanced ovarian cancer.20,26 Limitations of MRI include the cost, long acquisition time, and the resultant motion artifact. The appearances of benign ovarian masses and peritoneal implants on MRI are shown in Figures 3, 4, and 8.
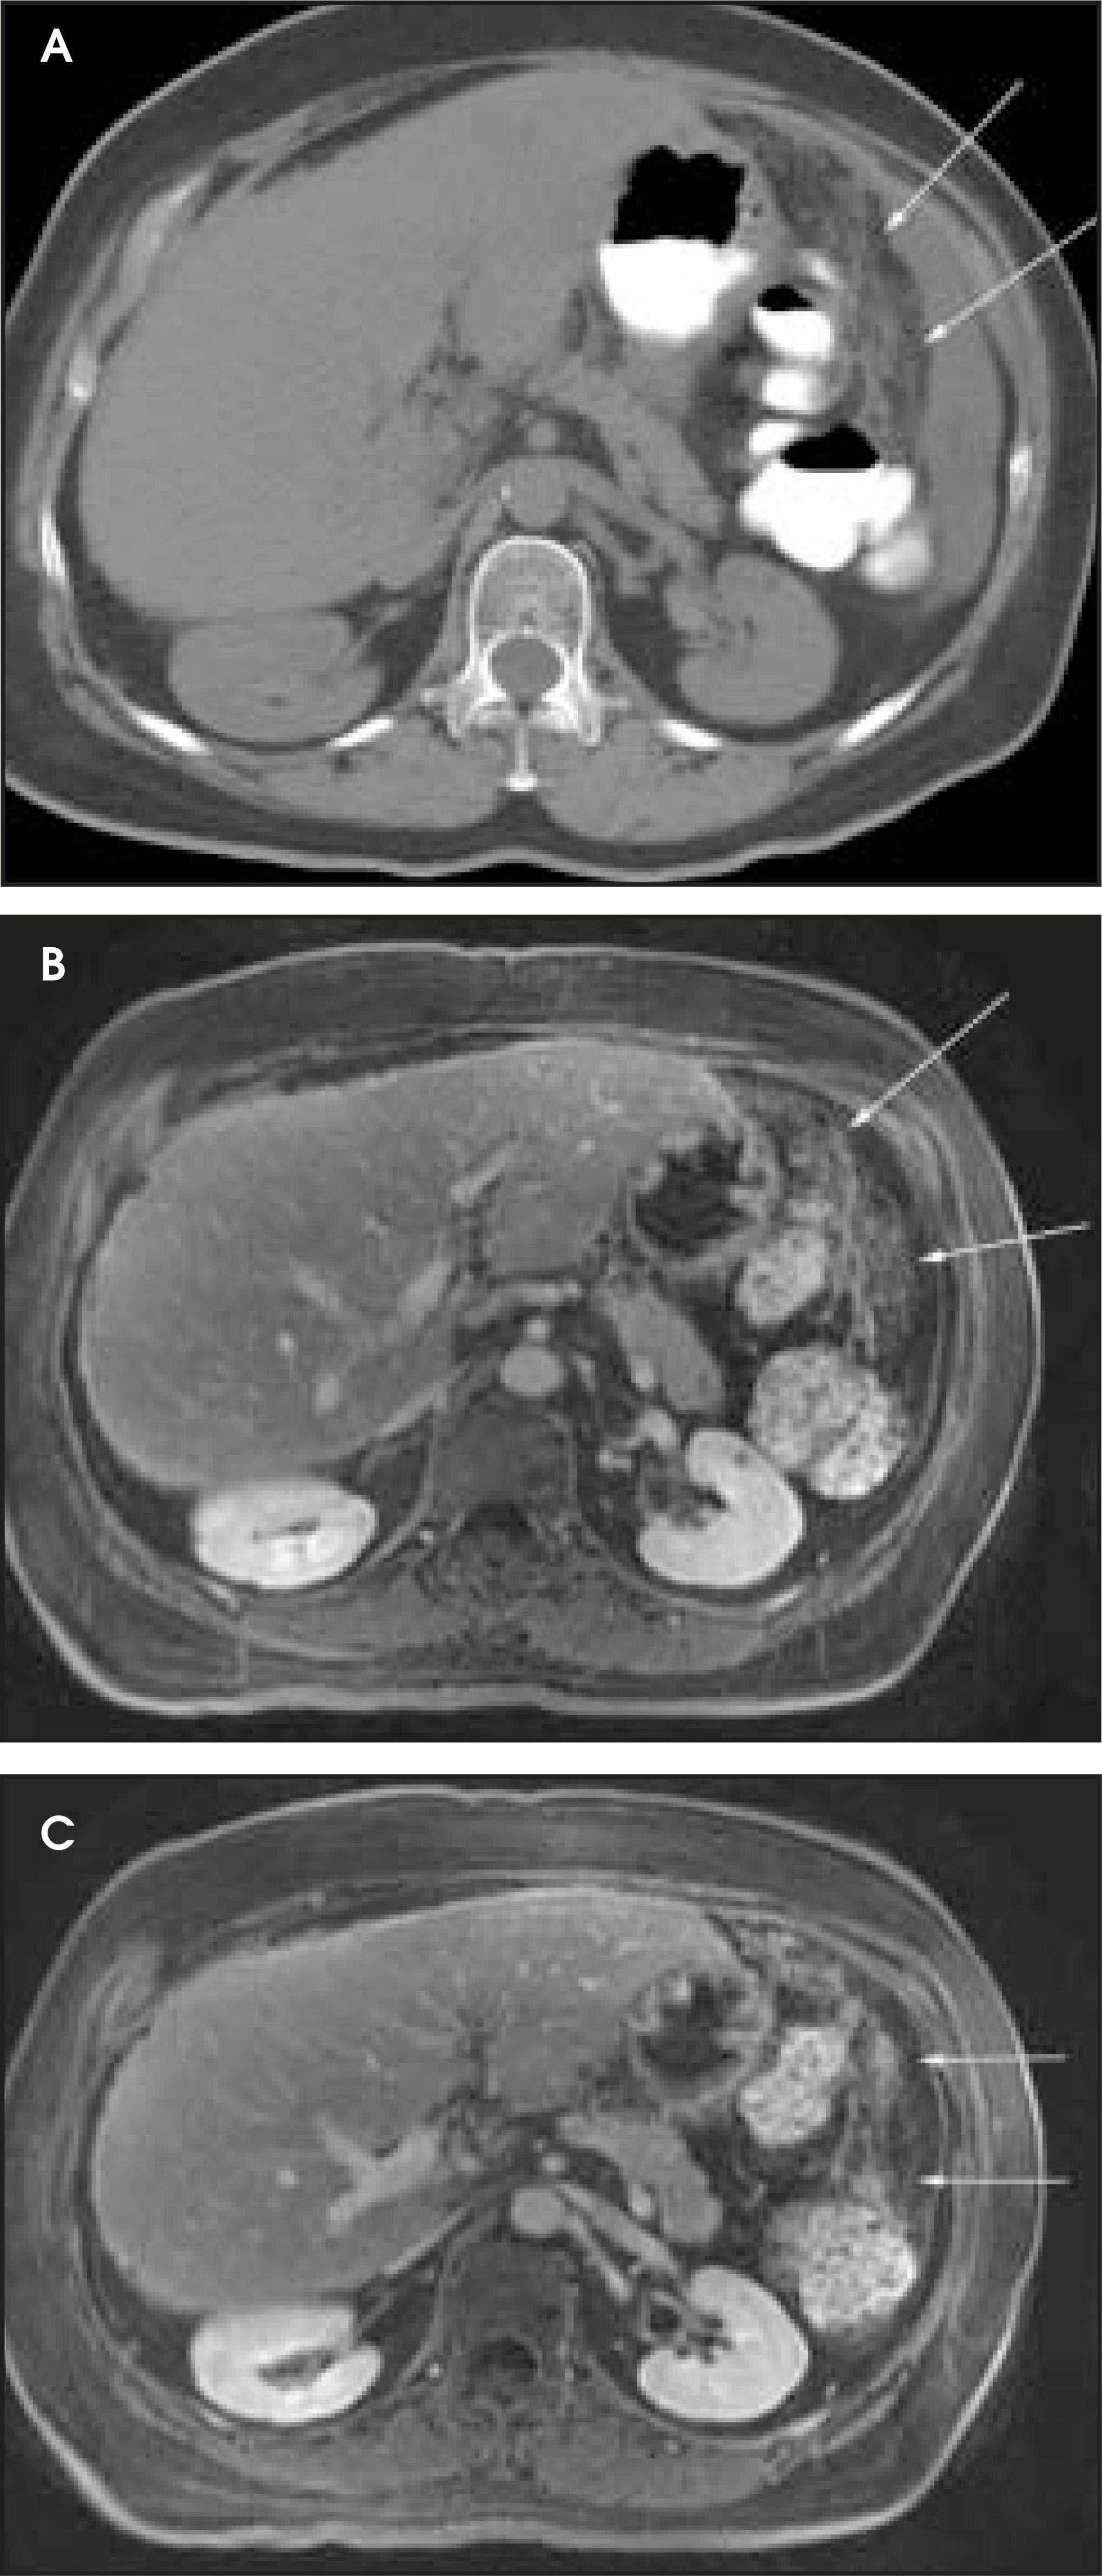
At our institution, we use a 1.5T magnet and acquire coronal T1-weighted, axial T2-weighted, sagittal T2-weighted, and pre- and post-gadolinium axial fat-saturated T1-weighted images. The postcontrast fat-saturated axial T1-weighted images are extremely useful in the detection of peritoneal implants, necrosis in a solid mass, and enhancing septations or vegetations in a cystic mass. Benign mature cystic teratomas contain macroscopic fat, which is suppressed on the fat-saturated sequences and, hence, will be helpful in making the diagnosis.
Ovarian masses with fibrous components include fibroma, fibrothecoma, cystadenofibroma, and Brenner tumor. The fibrous components of these masses tend to have very low signal intensity on T2-weighted MRI. Hemorrhagic cysts can be diagnosed by the signal intensity of the hemorrhage within the cyst with lack of contrast enhancement on the postcontrast images. Typically, hemorrhagic cysts are of high T1 signal intensity and of variable T2 signal intensity.
PET
Positron emission tomography (PET) using 18F-labeled fluorodeoxyglucose (FDG) is a relatively new imaging modality. The role for PET and PET/CT in the diagnosis and staging of ovarian cancer is controversial. The reported sensitivity for the diagnosis varies between 83% and 86%, and specificity varies between 54% and 86%.29 The PET appearance of peritoneal implants is shown in Figure 4.
Borderline and early-stage ovarian cancers can be falsely negative on PET imaging due to the small amount of FDG-avid tissue. False-positive results can also arise from inflammatory processes and benign ovarian tumors. Due to the limited resolution of PET, small tumor implants may not be detected despite increased FDG uptake.29,30 There appears to be a role for PET/CT in detecting sites of recurrent ovarian cancer when CT or MRI is negative despite a rise in cancer antigen (CA) 125 levels.31
Conclusion
The role of imaging in ovarian cancer is threefold: Detection, characterization, and staging. The detection of ovarian cancer can often be difficult by physical examination alone. Imaging has come to play a key role in the detection of ovarian cancer. Imaging plays an equally important role in the characterization of ovarian masses, as the number of benign ovarian masses greatly exceeds the number of malignant masses. Preoperative staging by imaging is also crucial to identify patients who are potential candidates for optimal debulking surgery. This article reviewed the roles of the different imaging modalities in the evaluation of ovarian cancer.
References
- Cancer Facts and Figures: 1997. 1998.
- Morrow C, Curtin J. Synopsis of Gynecologic Oncology. . 1998.
- Heintz A, Odicino F, Maisonneuve P. Carcinoma of the ovary. Int J Gynaecol Obstet. 2003;83(1):135-166.
- Koonings P, Campbell K, Mishell D, Grimes D. Relative frequency of primary ovarian neoplasms: A 10-year review. Obstet Gynecol. 1989;74:921-926.
- Marsden D, Friedlander M, Hacker N. Current management of epithelial ovarian carcinoma: A review. Semin Surg Oncol. 2000;19:11-19.
- Wagner B, Buck J, Seidman J, McCabe K. Ovarian epithelial neoplasms: Radiologic-pathologic correlation. RadioGraphics. 1994;14:1351-1374.
- Jeong Y, Outwater E, Kang H. Imaging evaluation of ovarian masses. RadioGraphics. 2000;20:1445-1470.
- Sassone A, Timor-Tritsch I, Artner A. Transvaginal sonographic characterization of ovarian disease: Evaluation of a new scoring system to predict malignancy. Obstet Gynecol. 1991;78:70-76.
- Lerner J, Timor-Tritsch I, Federman A, Abramovich G. Transvaginal ultrasonographic characterization of ovarian masses with an improved, weighted scoring system. Am J Obstet Gynecol. 1994;170(1):81-85.
- Reles A, Wein U, Lichtenegger W. Transvaginal color Doppler sonography and conventional sonography in the preoperative assessment of adnexal masses. J Clin Ultrasound. 1997;25:217-225.
- Ferrazzi E, Zanetta G, Dordoni D. Transvaginal ultrasonographic characterization of ovarian masses: Comparison of five scoring systems in a multicenter study. Ultrasound Obstet Gynecol. 1997;10:192-197.
- Kurjak A, Predanic M, Kupesic-Urek S, Jukic S. Transvaginal color and pulsed Doppler assessment of adnexal tumor vascularity. Gynecol Oncol. 1993;50:3-9.
- Hamper U, Sheth S, Abbas F. Transvaginal color Doppler sonography of adnexal masses: Differences in blood flow impedance in benign and malignant lesions. AJR Am J Roentgenol. 1993;160:1225-1228.
- Stein S, Laifer-Narin S, Johnson M. Differentiation of benign and malignant adnexal masses: Relative value of gray-scale, color Doppler, and spectral Doppler sonography. AJR Am J Roentgenol. 1995;164:381-386.
- Brown D, Frates M, Laing F. Ovarian masses: Can benign and malignant lesions be differentiated with color and pulsed Doppler US?. Radiology. 1994;190:333-336.
- Carter J, Saltzman A, Hartenbach E. Flow characteristics in benign and malignant gynecologic tumors using transvaginal color flow Doppler. Obstet Gynecol. 1994;83:125-130.
- Jain K. Prospective evaluation of adnexal masses with endovaginal gray-scale and duplex and color Doppler US: Correlation with pathologic findings. Radiology. 1994;191:63-67.
- Timor-Tritsch L, Lerner J, Monteagudo A, Santos R. Transvaginal ultrasonographic characterization of ovarian masses by means of color flow-directed Doppler measurements and a morphologic scoring system. Am J Obstet Gynecol. 1993;168:909-913.
- Kurjak A, Schulman H, Sosic A. Transvaginal ultrasound, color flow, and Doppler waveform of the postmenopausal adnexal mass. Obstet Gynecol. 1992;80(3):917-921.
- Kurtz A, Tsimikas J, Tempany C. Diagnosis and staging of ovarian cancer: Comparative values of Doppler and conventional US, CT, and MR imaging correlated with surgery and histopathologic analysis—Report of the Radiology Diagnostic Oncology Group. Radiology. 1999;212:19-27.
- Goerg C, Schwerk W. Peritoneal carcinomatosis with ascites. AJR Am J Roentgenol. 1991;156:1185-1187.
- Hanbidge A, Lynch D, Wilson S. US of the peritoneum. RadioGraphics. 2003;23:663-685.
- Bristow R, Duska L, Lambrou N. A model for predicting surgical outcome in patients with advanced ovarian carcinoma using computed tomography. Cancer. 2000;89:1532-1540.
- Bristow R, Tomacruz R, Armstrong D. Survival effect of maximal cytoreductive surgery for advanced ovarian carcinoma during the platinum era: A meta-analysis. J Clin Oncol. 2002;20:1248-1259.
- Meyer J, Kennedy A, Friedman R. Ovarian carcinoma: Value of CT in predicting success of debulking surgery. AJR Am J Roentgenol. 1995;165:875-878.
- Tempany C, Zou K, Silverman S. Staging of advanced ovarian cancer: Comparison of imaging modalities—Report from the Radiological Diagnostic Oncology Group. Radiology. 2000;215:761-767.
- Pannu H, Bristow R, Montz F, Fishman E. Multidetector CTof peritoneal carcinomatosis from ovarian cancer. RadioGraphics. 2003;23:687-701.
- Siegelman E, Outwater E. Tissue characterization in the female pelvis by means of MR imaging. Radiology. 1999;212:5-18.
- Rieber A, Nussle K, Stohr I. Preoperative diagnosis of ovarian tumors with MR imaging: Comparison with transvaginal sonography, positron emission tomography, and histologic findings. AJR Am J Roentgenol. 2001;177:123-129.
- Nakamoto Y, Saga T, Ishimori T. Clinical value of positron emission tomography with FDG for recurrent ovarian cancer. AJR Am J Roentgenol. 2001;176:1449-1454.
- Woodward P, Hosseinzadeh K, Saenger J. From the archives of the AFIP: Radiologic staging of ovarian carcinoma with pathologic correlation. RadioGraphics. 2004;24:225-246.
Citation
. Imaging of ovarian cancer. Applied Radiology. 2005;34(9):11-11. doi:10.37549/AR1366.