Imaging sellar and suprasellar pathology
Applied Radiology — Vol. 38 , Issue 4 , pp. 9 -21
DOI: 10.37549/AR1686
Published: April 1, 2009
Categories
The sellar region is a relatively small area of valuable “real estate” in the basicranium. This region contains critical neurovascular structures that directly cause disease processes or that are involved in the pathology as a result of the compact surroundings. This article will review relevant anatomy and important pathologic processes that involve the sellar and parasellar regions.
Anatomy
Advances in imaging techniques have enabled visualization of vital neural and vascular structures involving the sellar and parasellar regions.
The primary component of the sella turcica is the sphenoid bone with a component from the basiocciput. Anteriorly, it is bounded by a bony ridge, the tuberculum sella, and posteriorly by the dorsum sella and the posterior clinoid processes. The anterior clinoid processes of the lesser wing of the sphenoid are lateral to the tuberculum sella and project posteriorly. The roof of the sphenoid sinuses form the floor of the sella, and their architecture affects the floor of the sella and its reaction to pathology. A dural extension defines the superior margin, the diaphragma sella. This lines the sella turcica, envelopes the pituitary gland and forms the incomplete superior border. Laterally, there are the venous sinusoids of the cavernous sinues and middle clinoid processes are variably present.
The pituitary fossa holds the pituitary gland, which is composed of the adenophysis and neurohypophysis. The pars distalis, pars intermedia and pars tuberalis form the adenophypophysis. The neurohypophysis is made up of the pars nervosa, infundibular stalk and the infundibula proper. The size of the pituitary gland varies with age and gender: 6 mm in children, 8 mm in males and post-menopausal females, 10 mm in pre-menopausal females, and up to 12 mm in pregnant lactating females.1
The hypothalamus and pituitary gland are connected by important neurovascular connections. Axons of supra-optic and paraventricular nuclei of the hypothalamus traverse the infundibular stalk and extend into the neurohypophysis. The secretary granules carrying vasopression and oxytocin appear as the “bright spot” of the posterior lobe of the pituitary gland on T1-weighted unenhanced magnetic resonance imaging (MRI). Releasing and inhibiting factors produced in the neurons in the hypothalamus are transported to the adenohypophysis via the tuberhypophyseal neural tract and the hypophyseal portal system. Bilateral cavernous sinuses extend from the petrous segment of the temporal bone to the orbit and contain cranial nerves III (oculomotor), IV (trochlear), V1 (ophthalmic division of the trigeminal nerve), V2 (maxillary division of the trigeminal nerve) and VI (abducens). The cavernous segment of the internal carotid arteries and their meningohypophyseal trunks travel through these paired duraperiosteal spaces. The most medial structures within the cavernous sinuses are the internal carotid artery and cranial nerve VI. The other forementioned cranial nerves travel along the lateral aspects. The mandibular division of the trigeminal nerve (V3) lies external to the cavernous sinus and exits through foramen ovale vertically oriented beneath Meckel’s cave. Bilateral Meckel’s caves are inferolateral to each of the cavernous sinuses.
Above the sellar region lies the suprasellar cistern. Several critical structures traverse this area, including the circle of Willis, optic nerves and optic chiasm, hypothalamus, pituitary infundibulum, and the infundibular and suprachiasmatic recesses of the third ventricle.
Imaging
Computed tomography (CT) is useful in the delination of the osseous margins of the sella. It is particularly helpful in evaluating the bony changes related to pathologic processes. CT may be the only option in patients who cannot have an MRI examination (e.g. those with pacemakers, incompatible hardware and severe claustrophia). Thin section 0.625 mm axial spirally acquired images can be reformatted into sagittal and coronal images. The examination may be obtained without contrast for dedicated bony assessment.
MRI provides detailed information about the contents of the sellar and parasellar regions. It is the fundamental preoperative and postoperative imaging modality. Sagittal and coronal images with a small field of view in thin sections (≤3 mm) are obtained through the sella turcica to include the parasellar structures, including the suprasellar cistern, cavernous sinuses, Meckel’s cave and hypothalamus. Post-gadolinium enhanced sequences are obtained with fat saturation to improve contrast between pathology and the basicranium.
Generating differential diagnoses can be difficult because of the complexity of the structures in the sellar and suprasellar region. Dividing this region into the pituitary fossa, cavernous sinuses and the suprasellar cisterns can be helpful. However, many disease processes can involve multiple components of the sellar and parasellar region and it can sometimes be difficult to delineate the origin of large neoplasms and extensive disease processes. Identification of normal structures, such as the pituitary gland, in relation to the pathology can be helpful to determine the etiology.
Pituitary fossa pathology
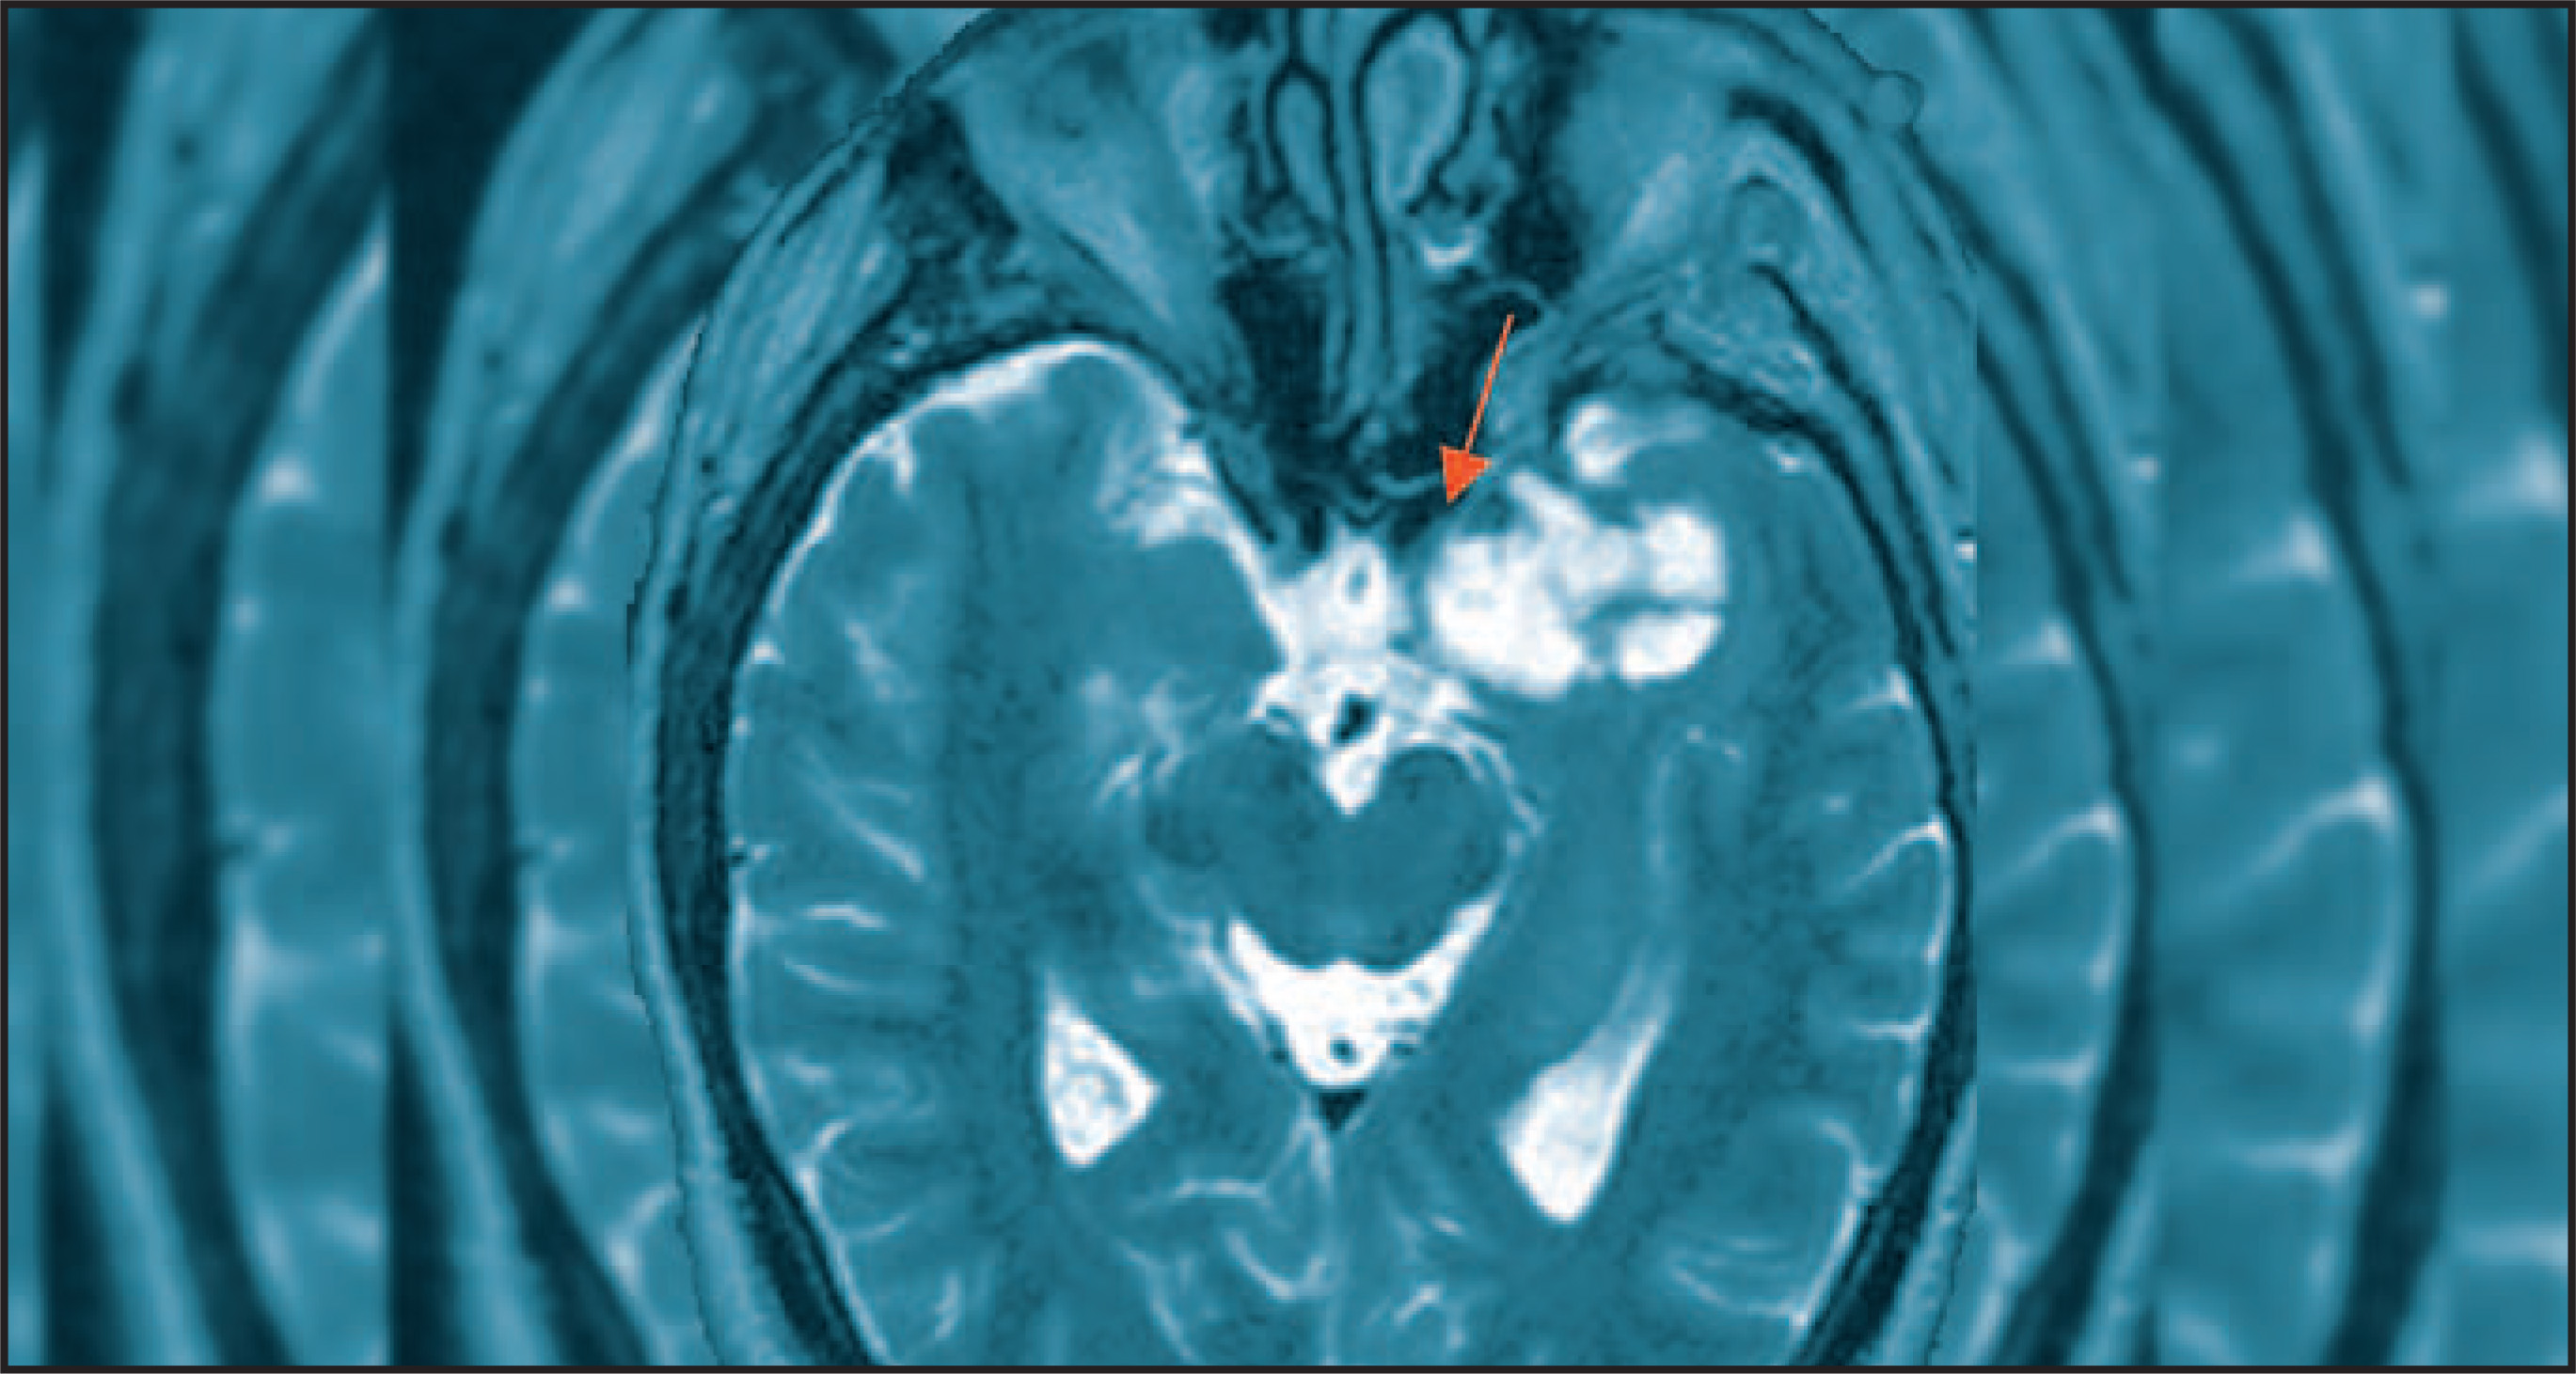
The “empty sella” appearance is due to the patulous diaphragma sella and extension of the suprasellar subarachnoid space. The superior margin of the pituitary is flattened or concave. (Figure 1). The sella turcica is often enlarged, and there may occasionally be intrasellar herniation of the anteroinferior portion of the third ventricle or optic nerves/chiasm. There is usually no functional impairment of the pituitary gland. However, a partially empty sella appearance can be seen in a premenopausal female with additional signs and symptoms of pseudo-tumor cerebri.2 Pituitary microadenomas have also been reported to coexist with an empty sella.3
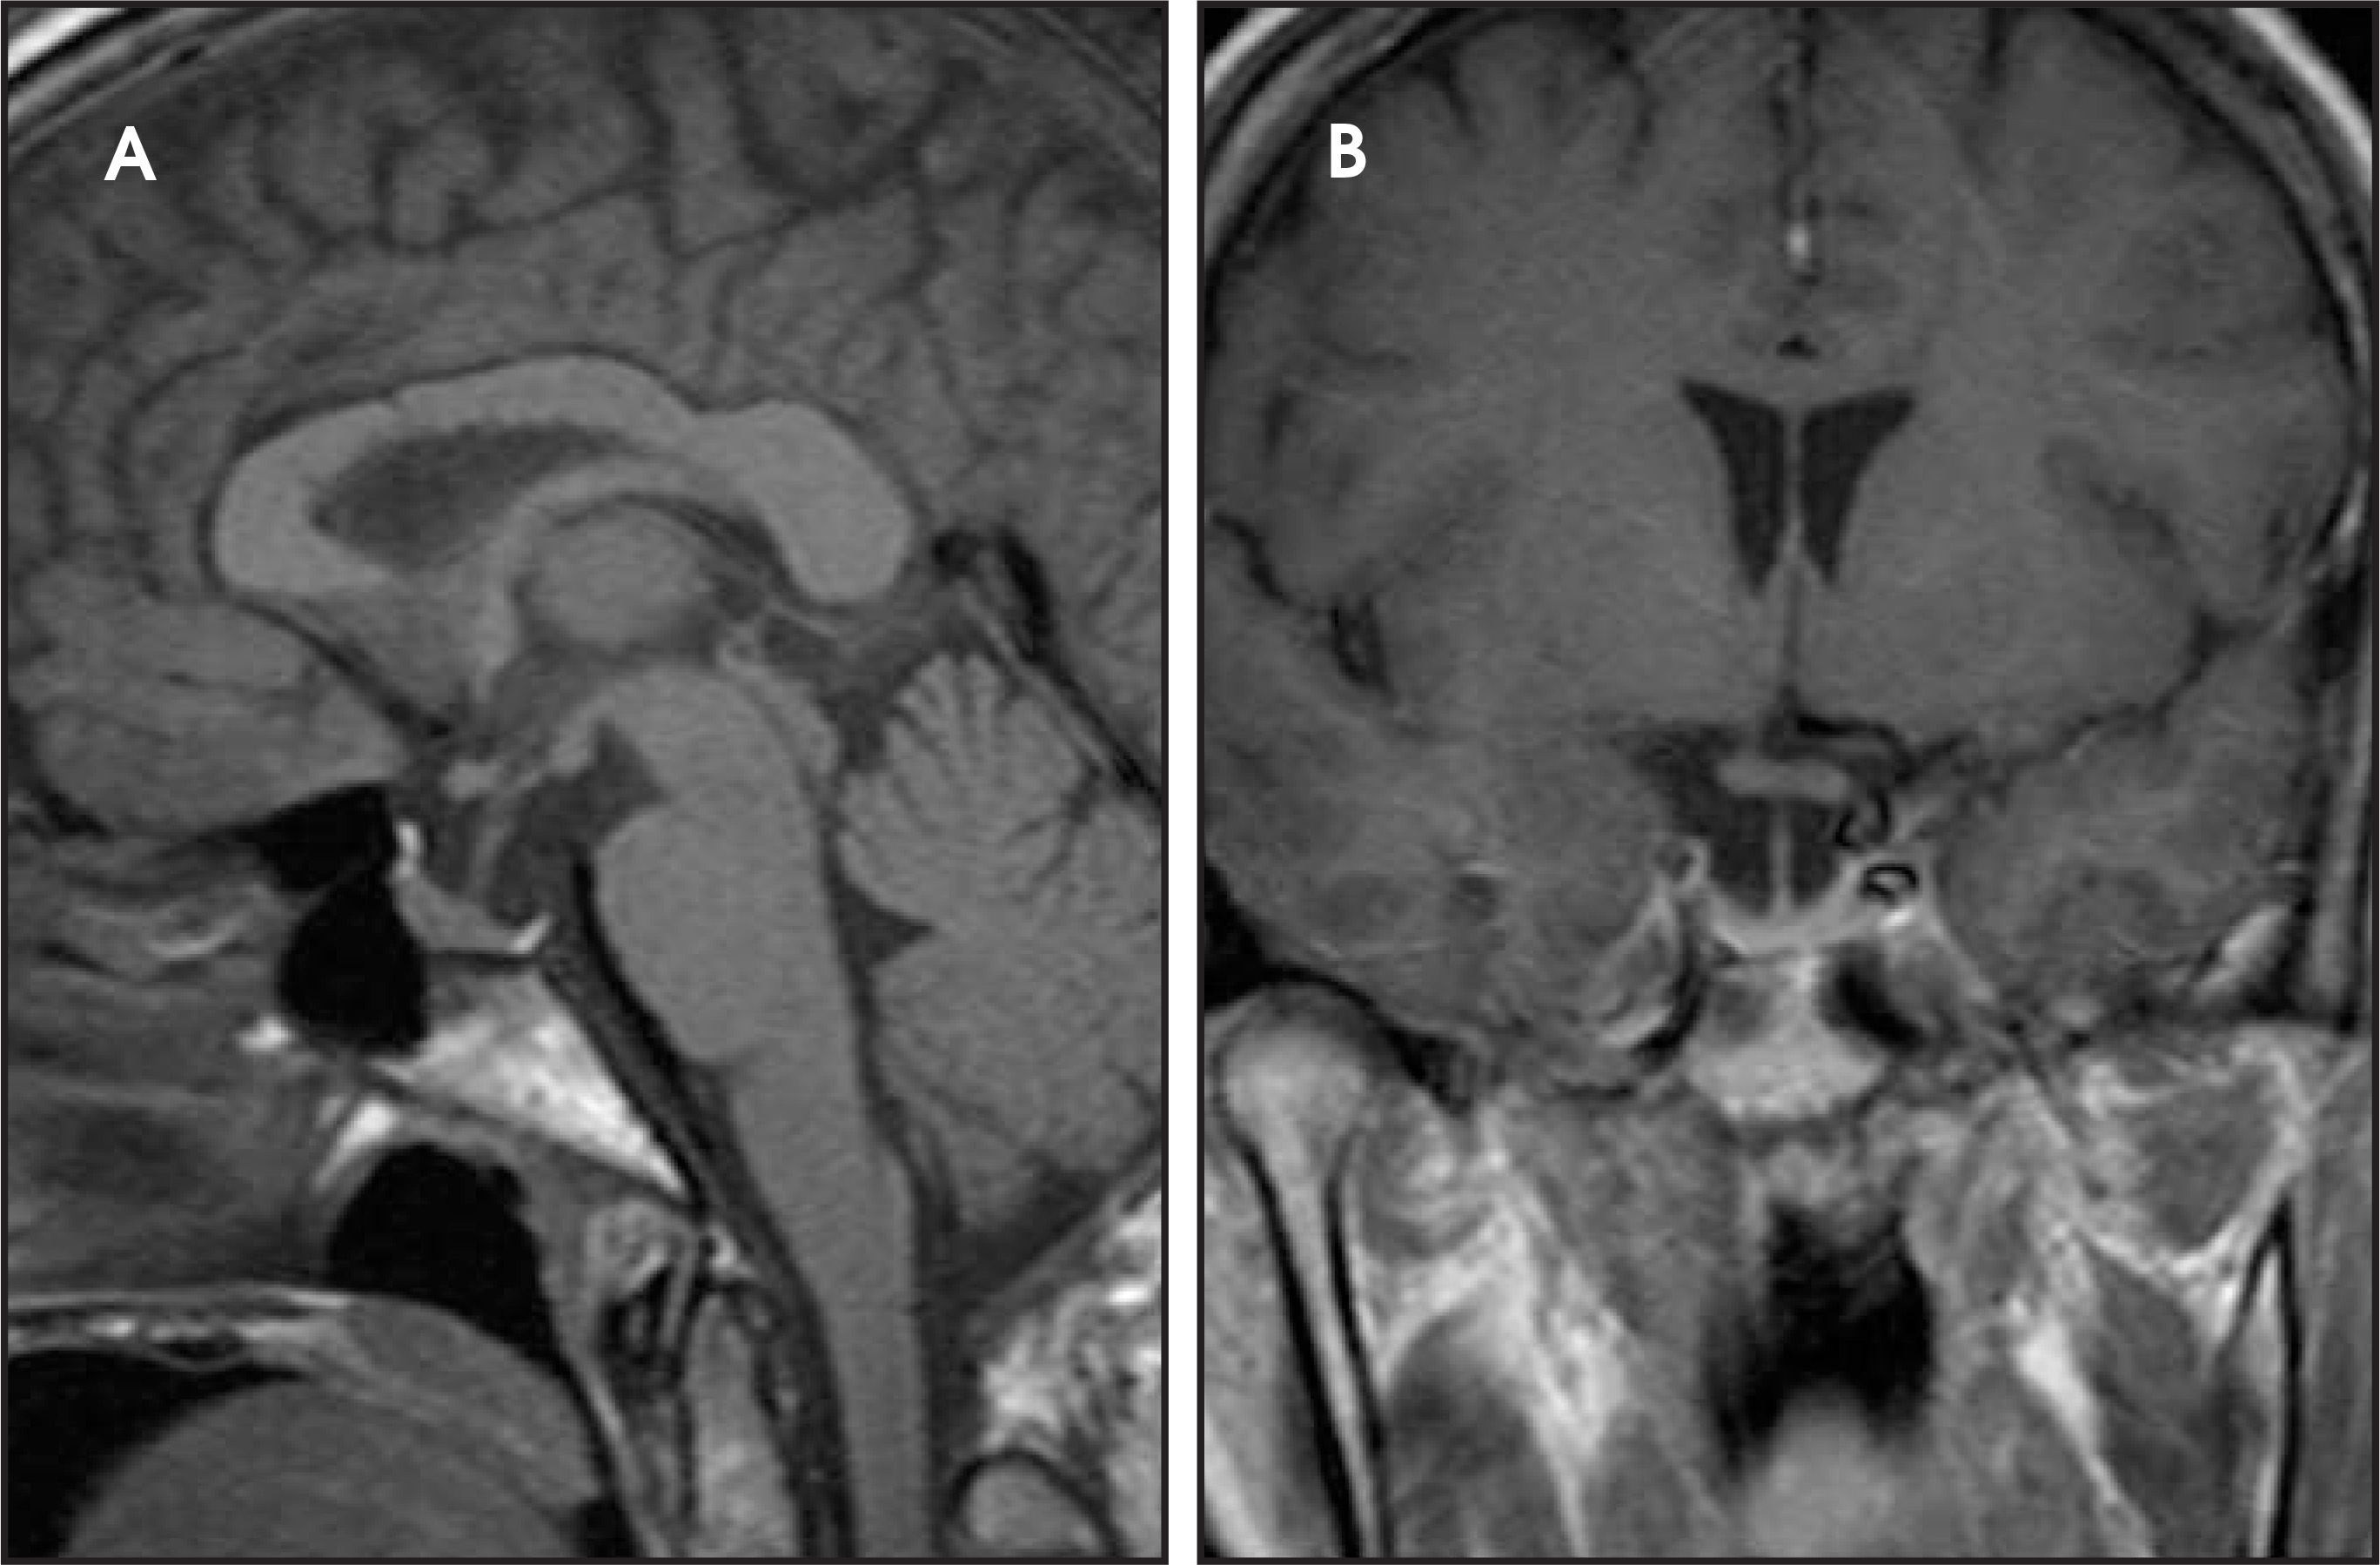
Rathke’s cleft cysts are congential cystic lesions in the sellar region (25%), suprasellar region (5%) or both (70%), which are lined by cuboidal or columnar cells. The MR signal intensity and CT attenuation of these lesions is variable due to the amount of proteinaceous material within them. On occasion, they can show peripheral enhancement (Figure 2).
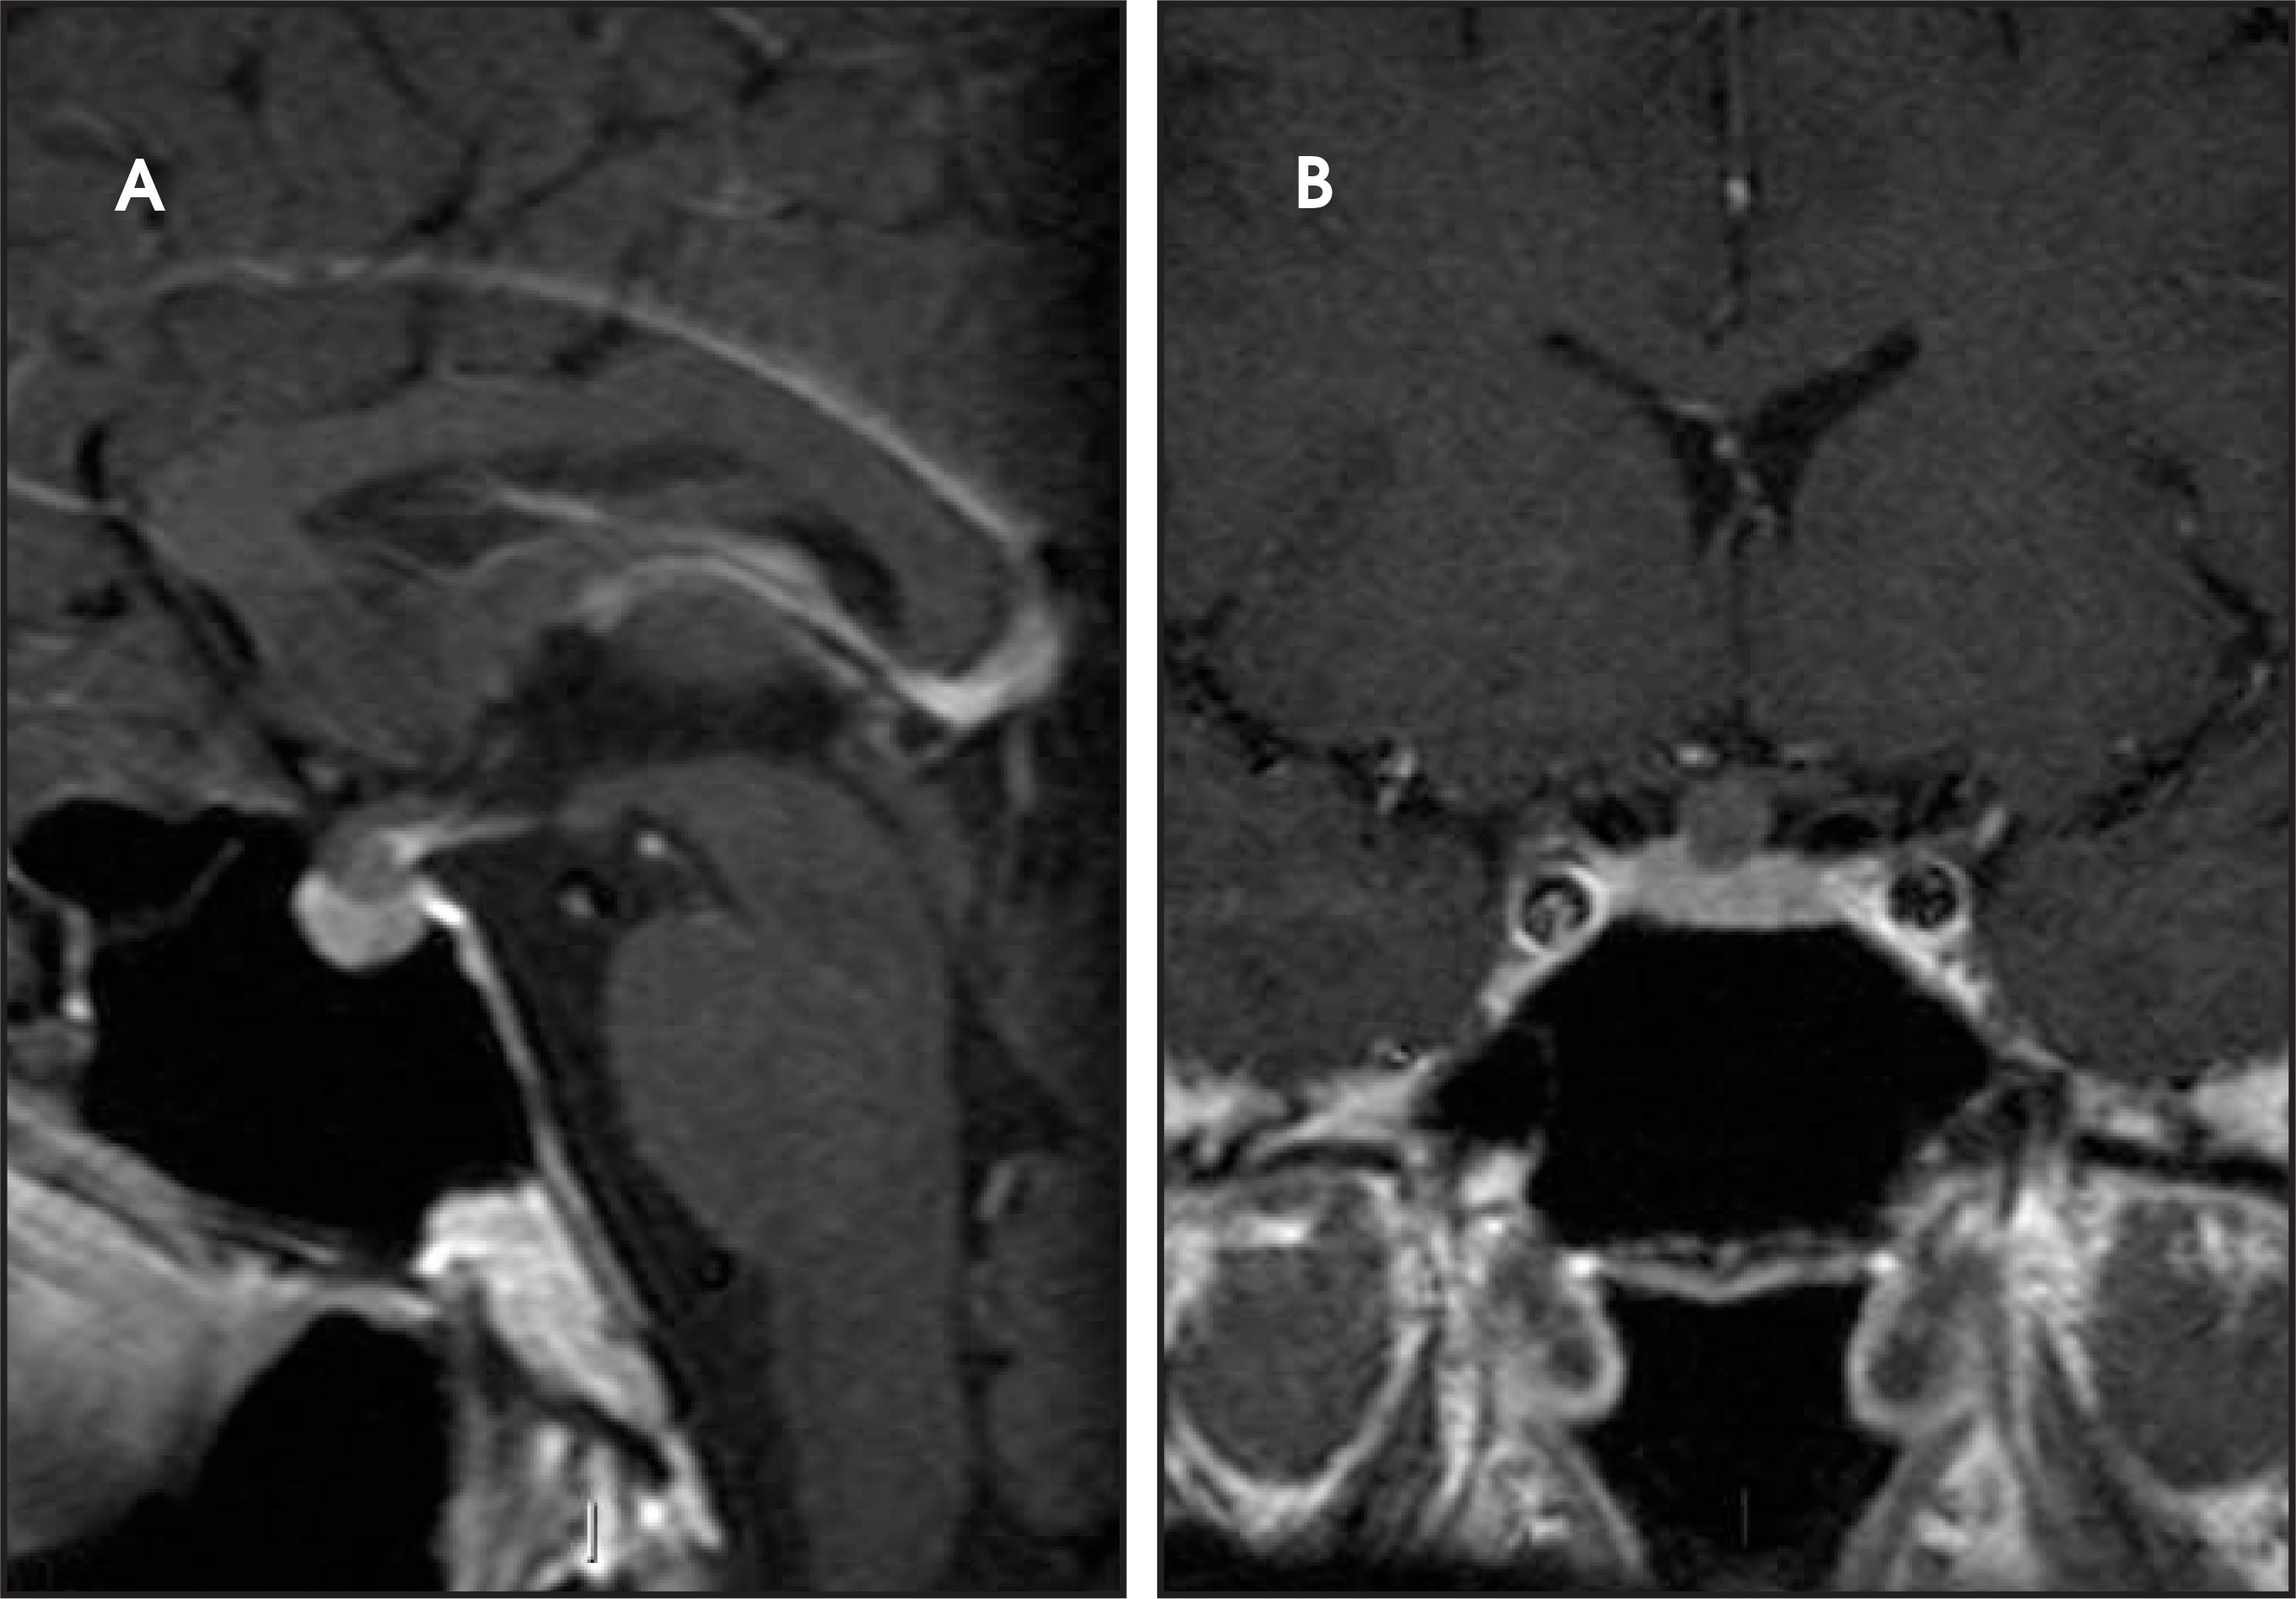
Pituitary hyperplasia can be a physiologic manifestation during pregnancy or lactation due to hypertrophy of prolactin cells. It can also occur in the setting of hypofunction of the thyroid gland, adrenal glands, or gonads as a result of the lack of negative feedback4 (Figure 3). Nodular or diffuse pituitary hyperplasia can also be seen as a cause of Cushing’s disease.
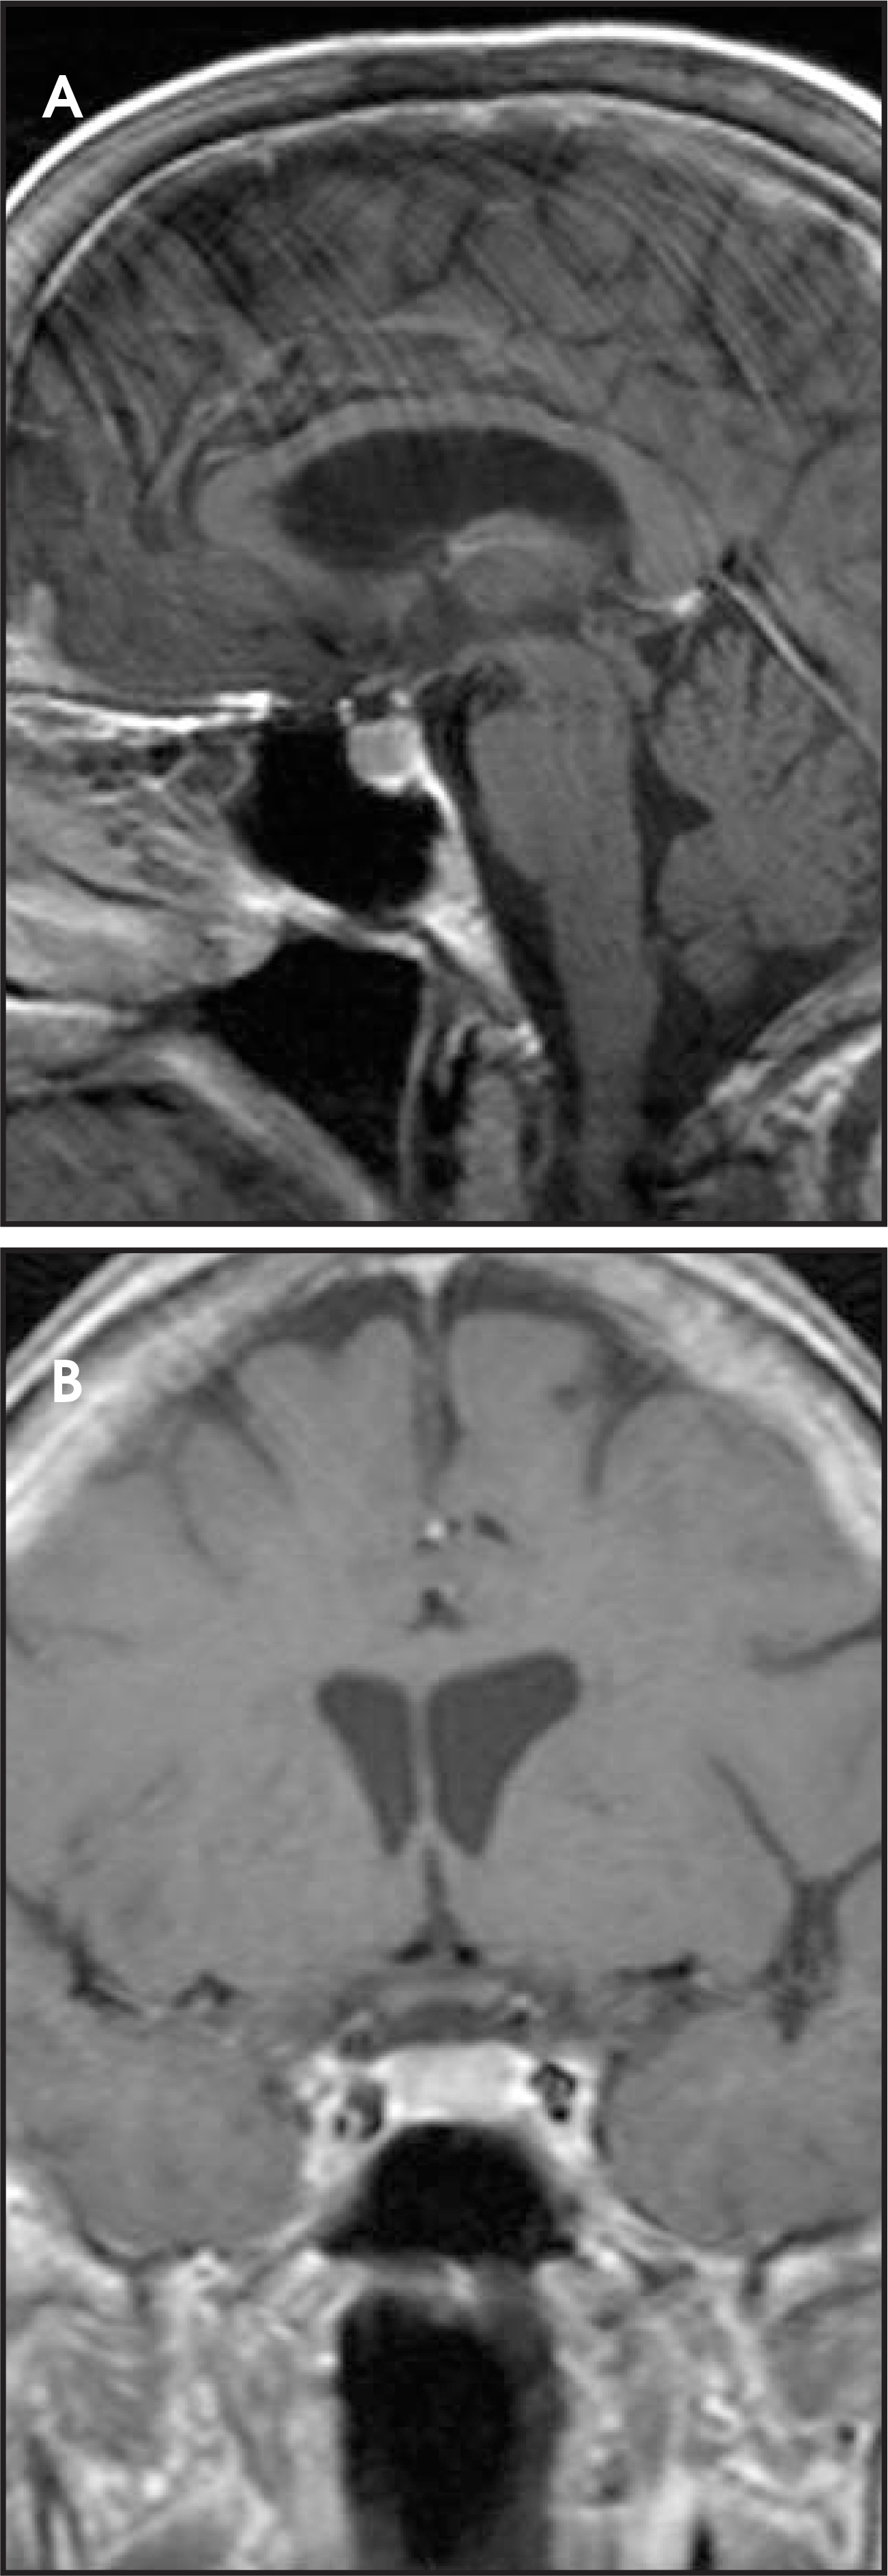
In pituitary apoplexy syndrome (Figure 4), patients present with ophthalmoplegia, headache, and visual loss due to pituitary infarction/hemorrhage. This may occur in the setting of massive hemorrhage or tumor necrosis. Acute hemorrhage will appear hypointense on T2-weighted images with T1 hyperintensity as the hemorrhagic products evolve.5 There is usually no hemosiderin deposition associated with pituitary hemorrhage. In the postpartum setting, insufficiency of the hypophyseal portal system can result in infarction of the adenophysis, i.e. Sheehan’s syndrome.
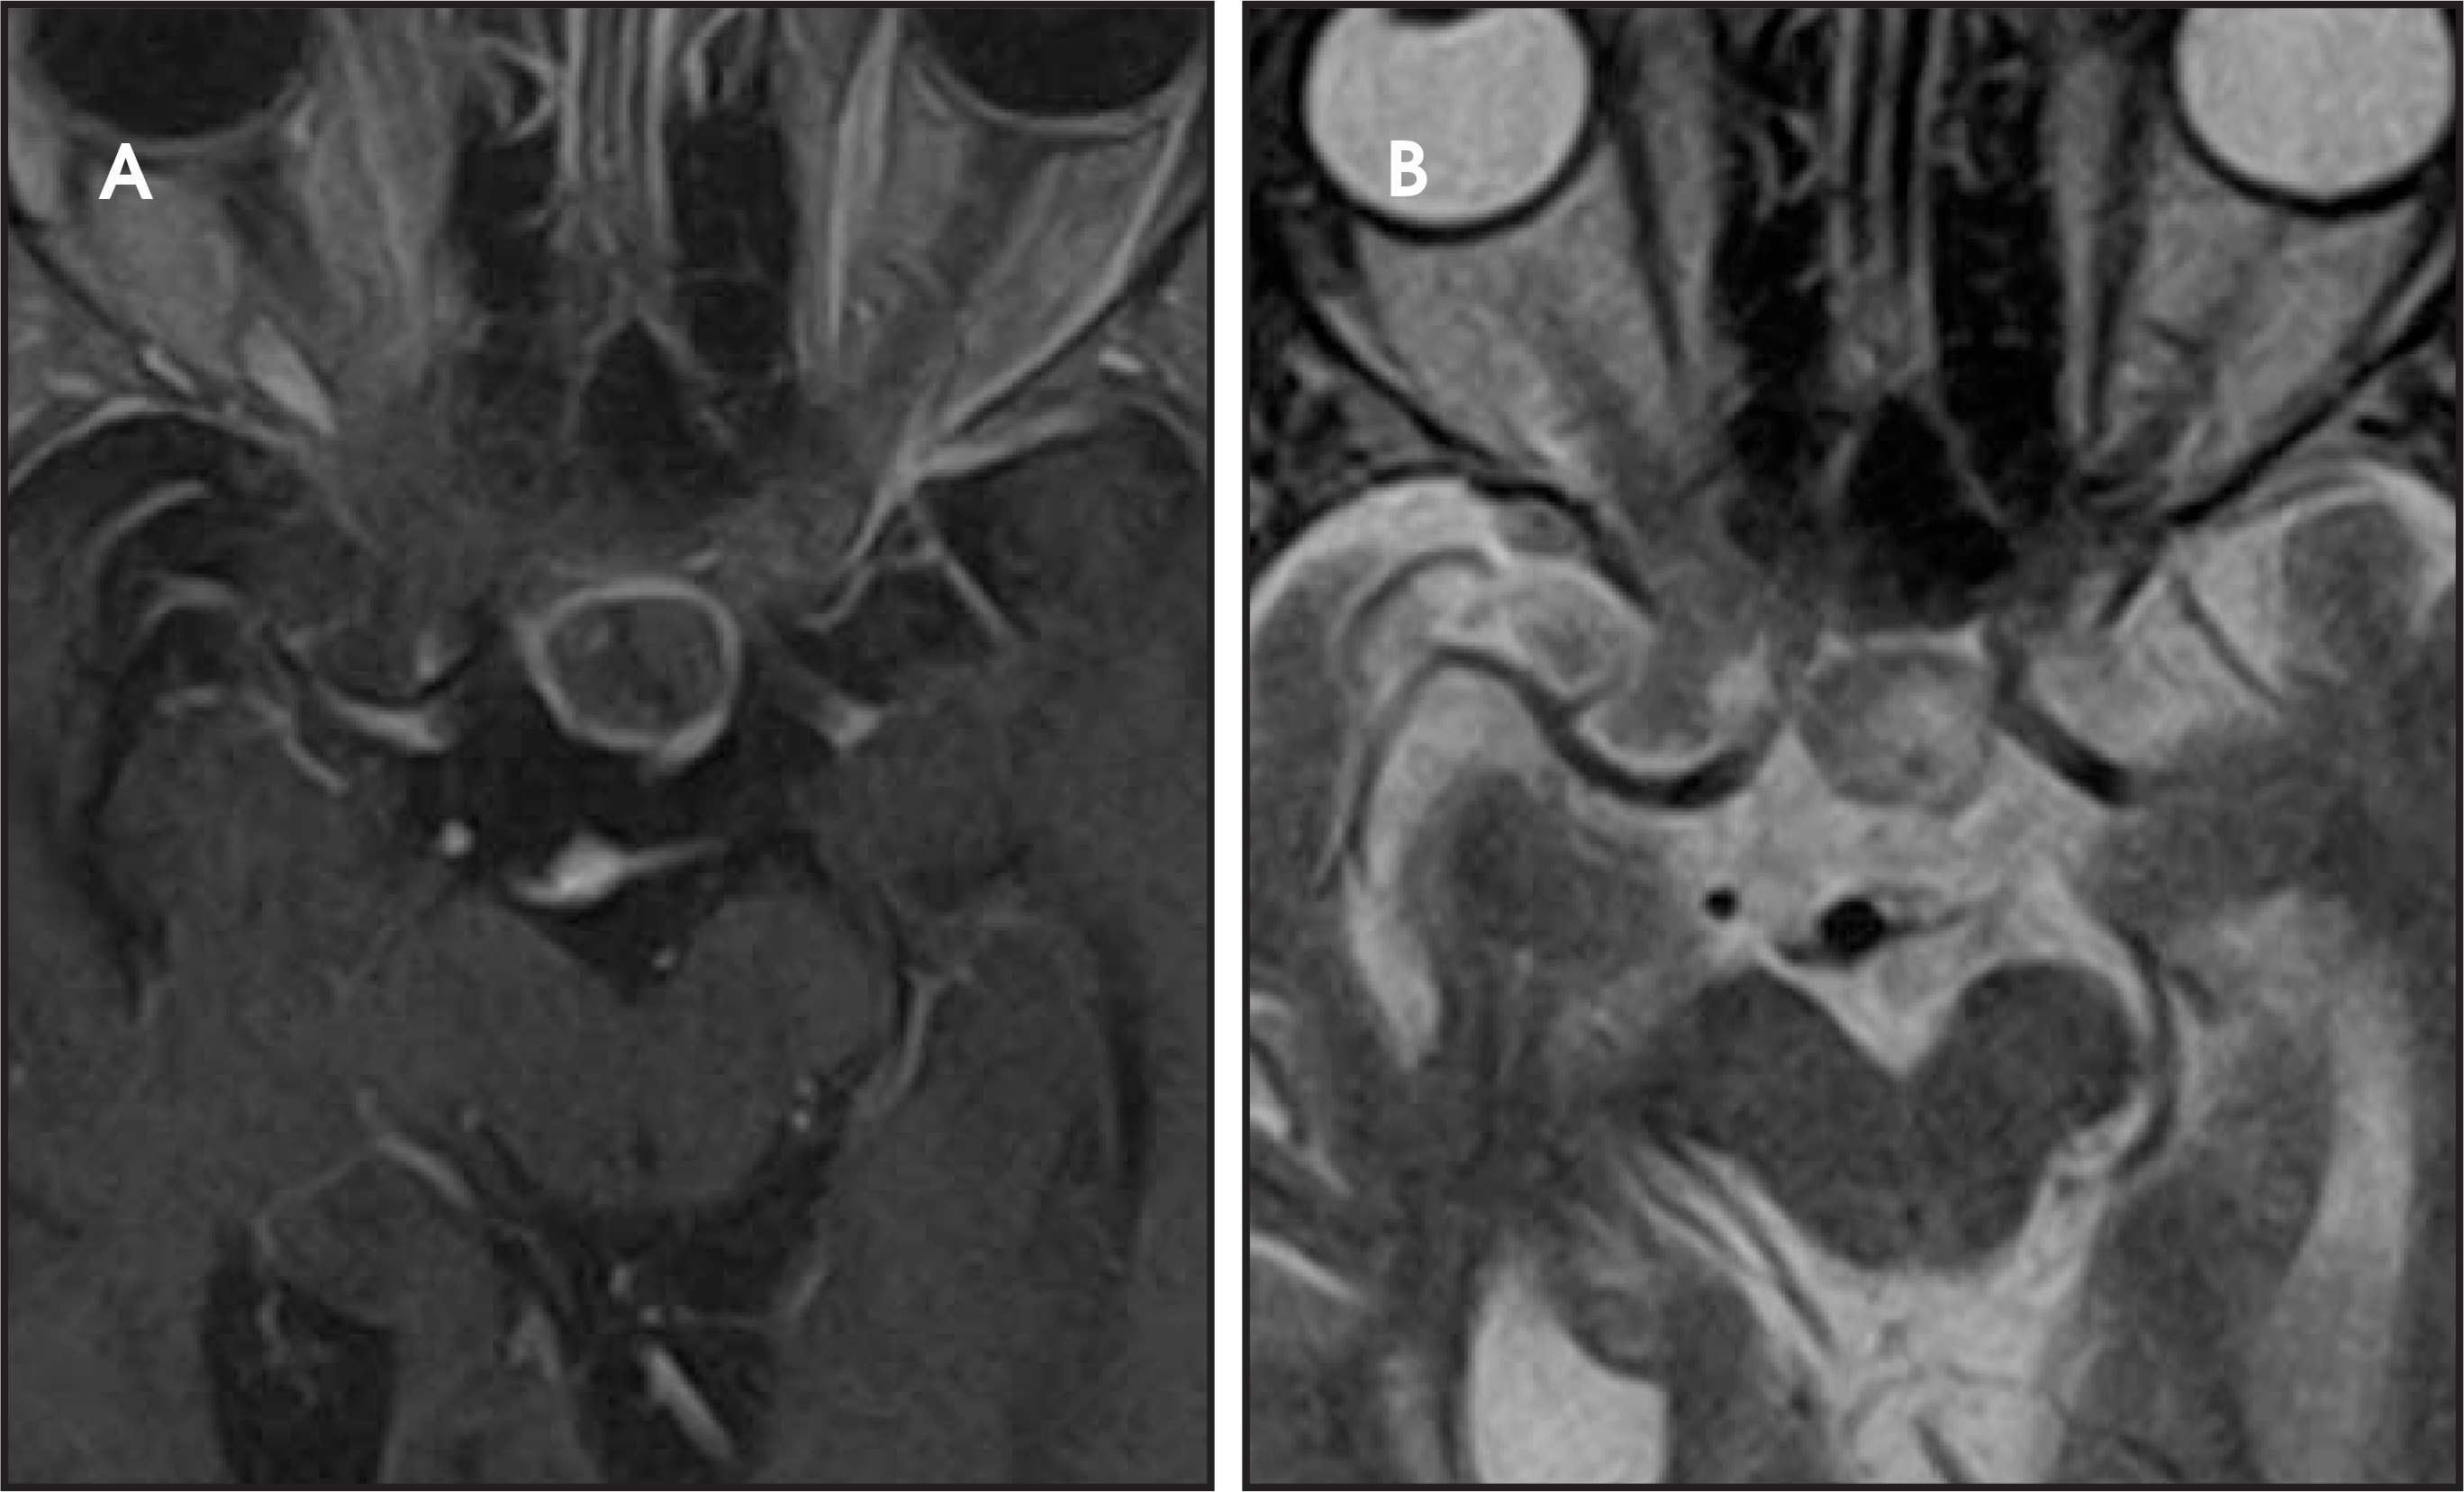
Adenomas comprise the majority (80%) of pituitary lesions. A large percentage of these (approximately 75%) are functioning6 and result in endocrine abnormalities. Hyperprolactinemia is the most common manifestation. They can be clinically silent and detected incidentally on MRI performed for other reasons. Patients may have symptoms due to compression of adjacent structures, particularly the optic chiasm and optic nerves. Microadenomas are defined as lesions ≤10 mm (Figure 5). Upon immediate imaging after contrast enhancement, they are typically hypointense on T1-weighted imaging relative to the remaining normal pituitary tissue. As there is up to a 20% false-negative rate in the detection of microadenomas, dynamic contrast-enhanced MRI can be performed to increase the sensitivity and specificity.7
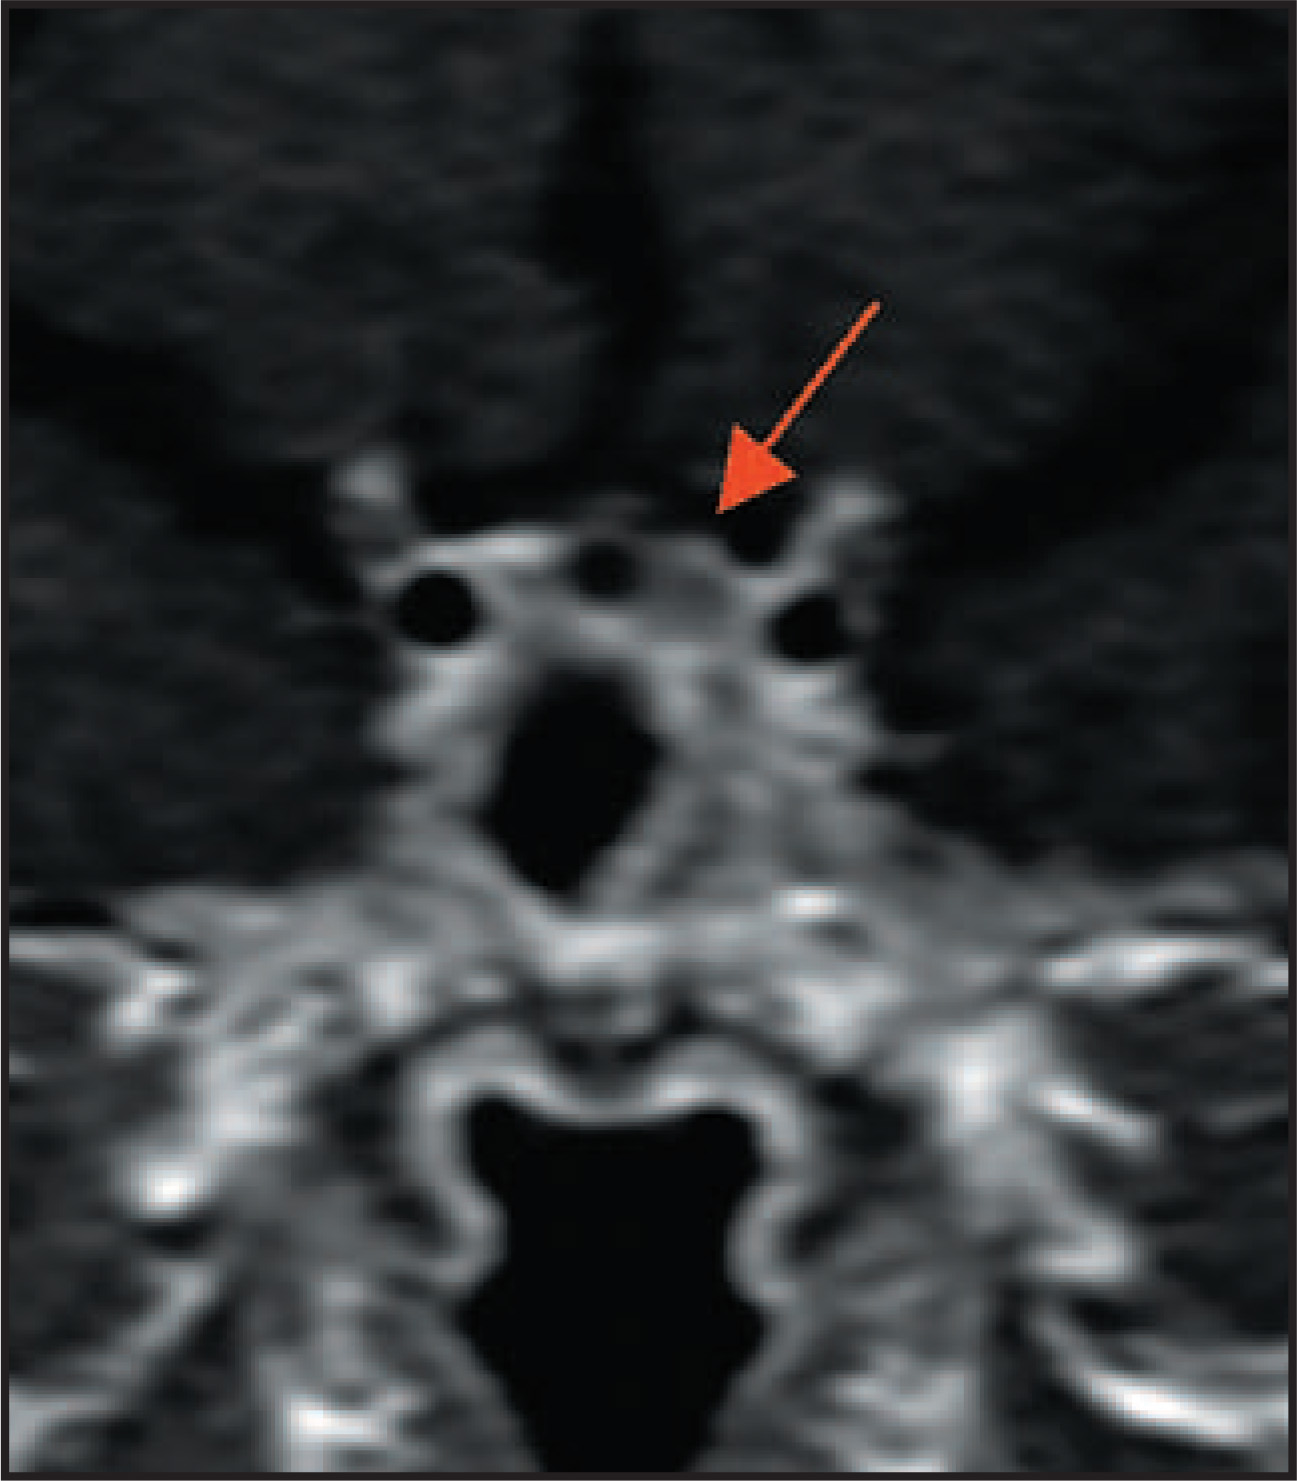
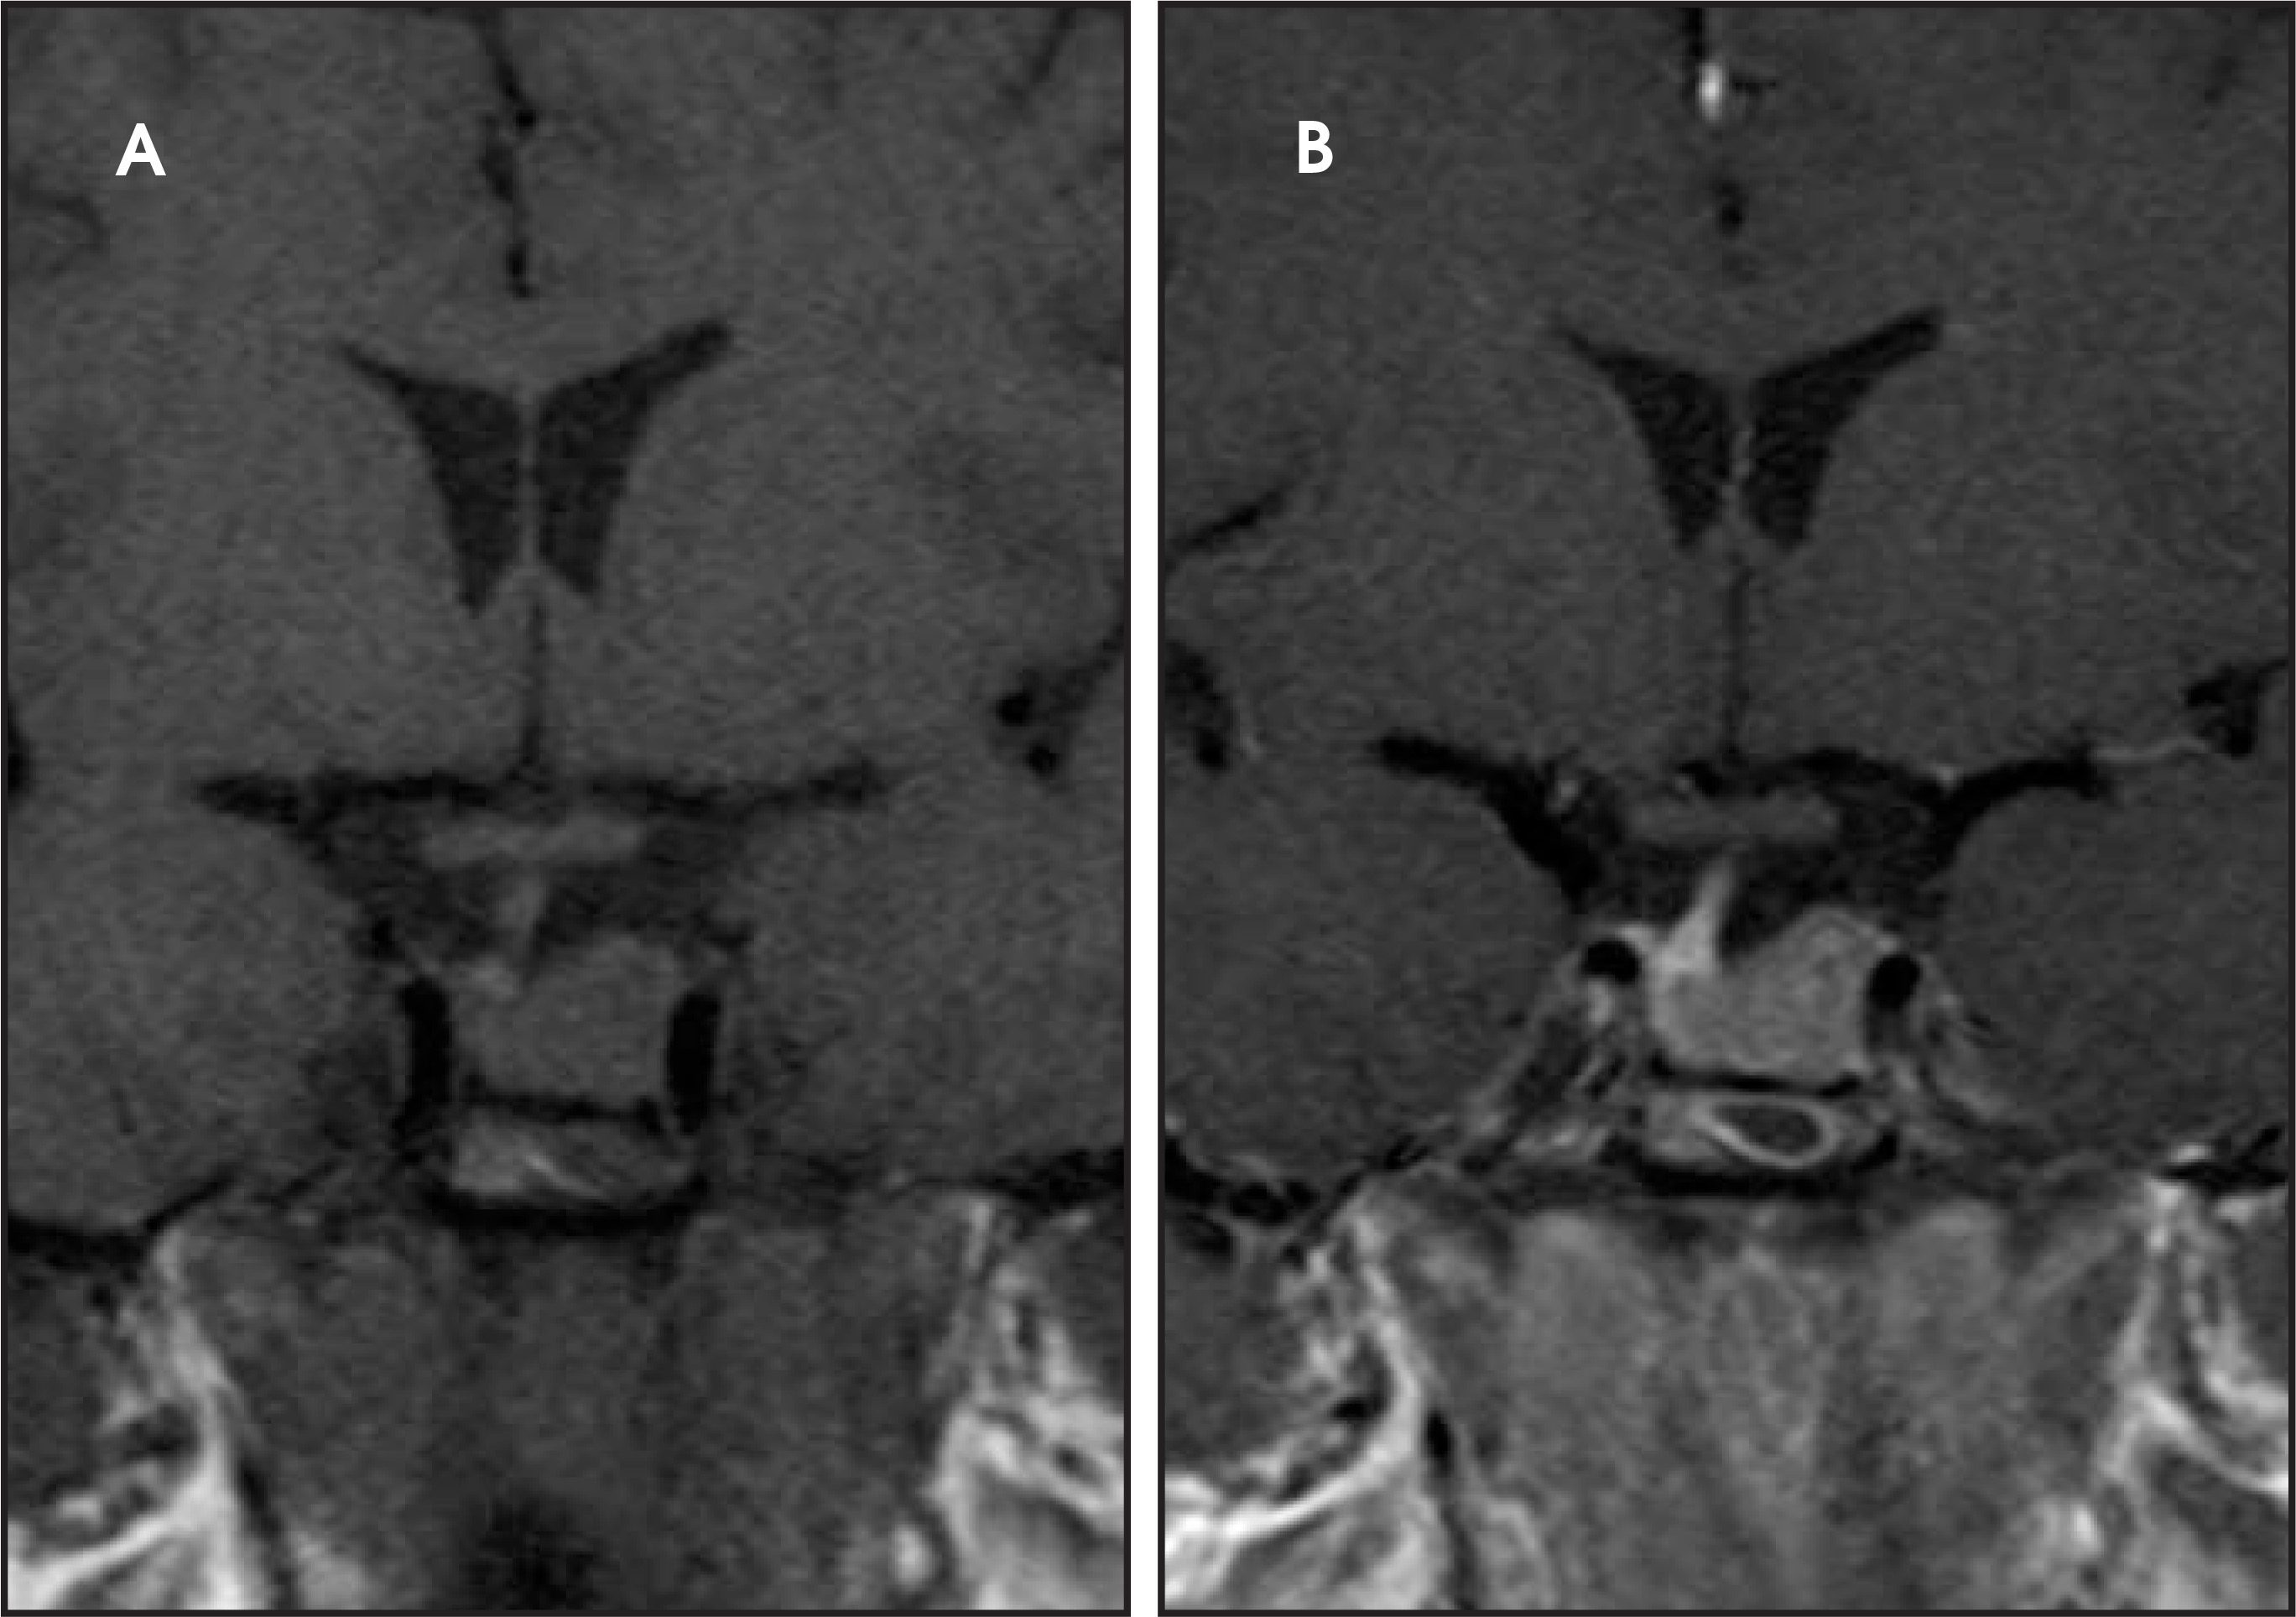
Macroadenomas are >10 mm in diameter (Figure 6). These lesions are isointense to gray matter on T1- and T2-weighted imaging and demonstrate homogenous enhancement. Approximately, 10% of adenomas can be complicated by hemorrhage, infarction or necrosis/cystic change, which alters the MRI signal intensities (Figure 7). Adenomas can expand cephalad into the suprasellar cistern and compress the optic chiasm and optic nerves, caudally to erode the sella turcia, and laterally to compress or invade the cavernous sinuses. A prolactin level that is >1000 ng/mL correlates with cavernous sinus invasion.8 A reliable imaging finding of cavernous sinus involvement is abnormal tissue between the lateral wall of the cavernous sinus and the cavernous internal carotid artery (ICA).9
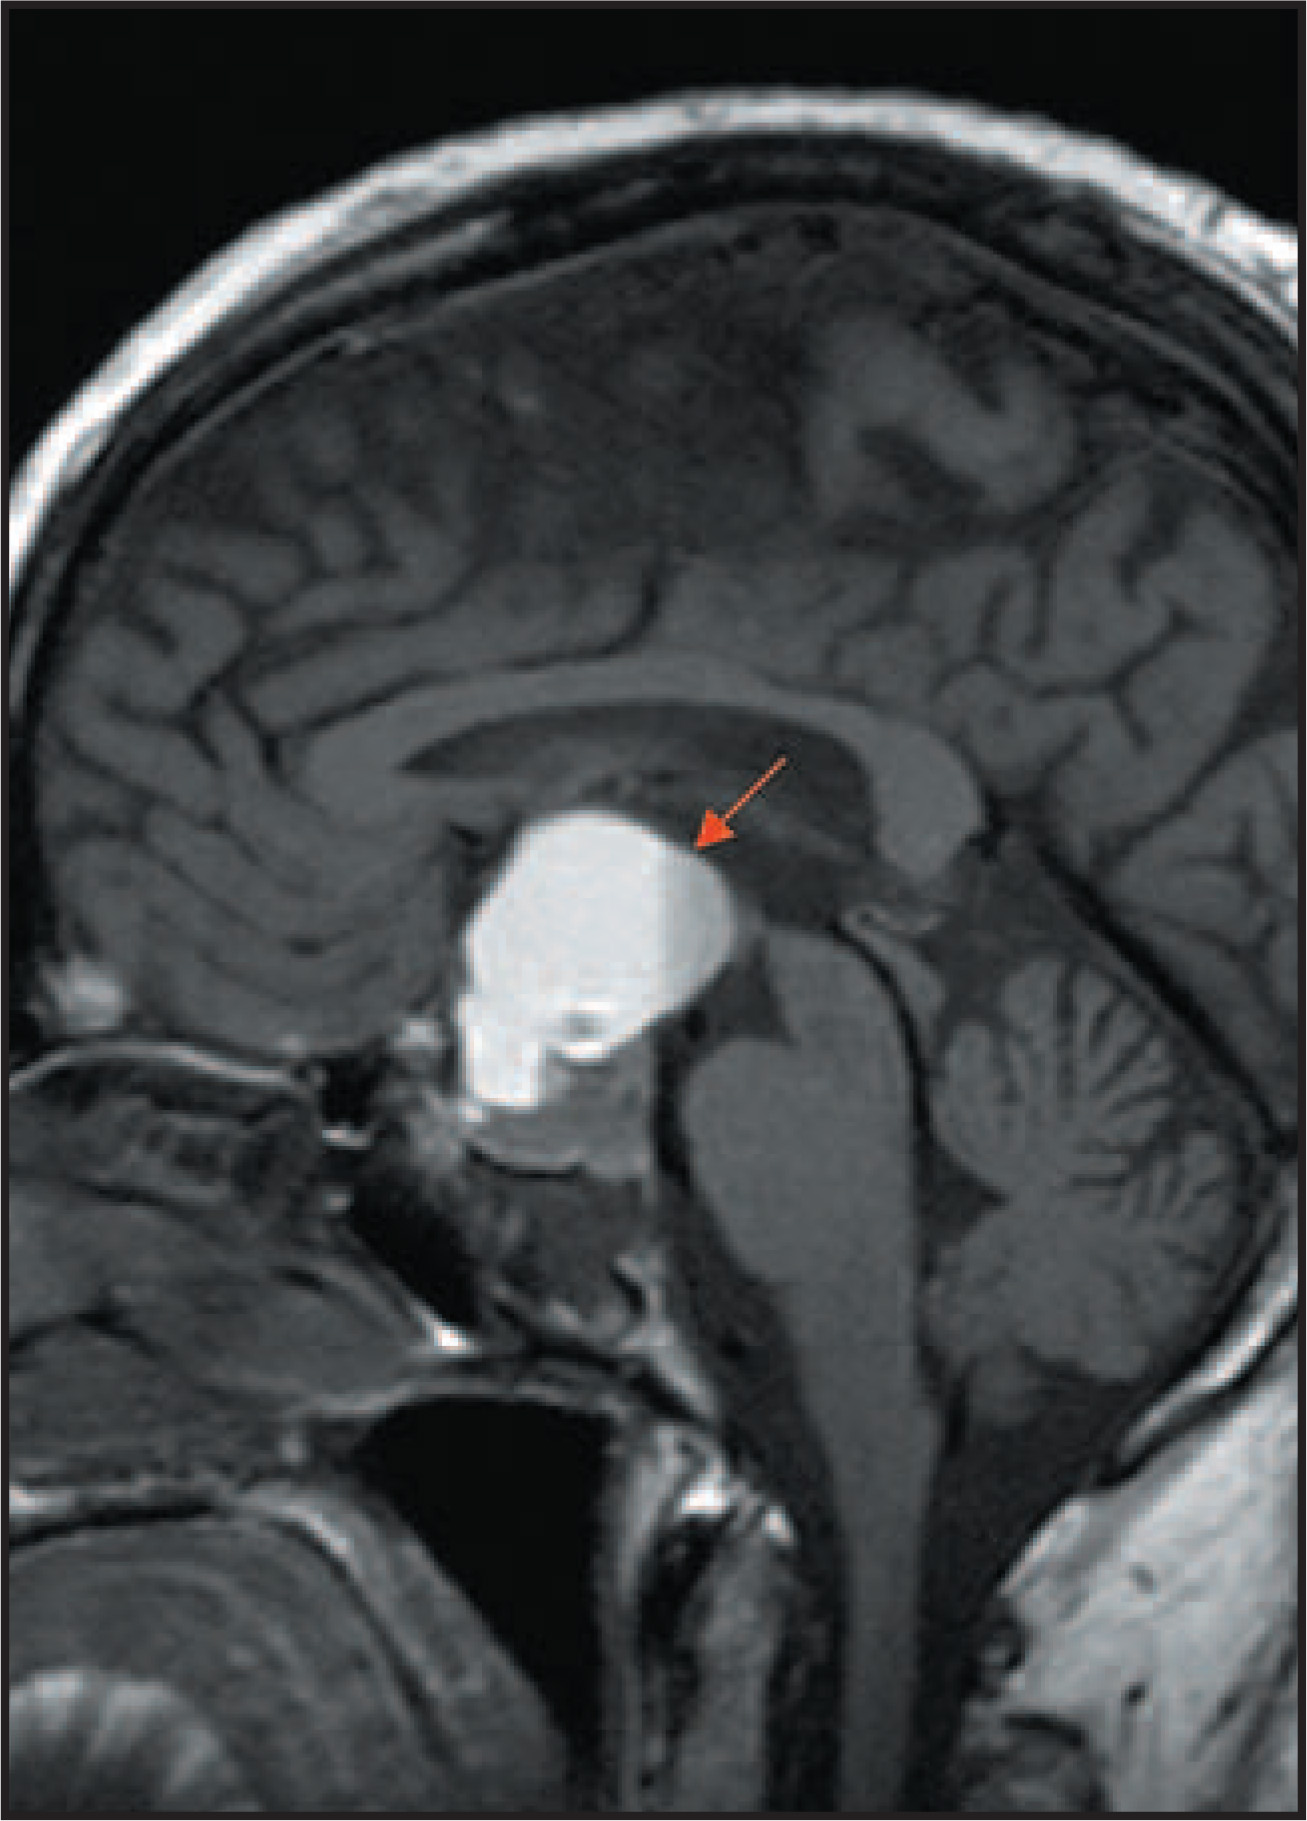
Craniopharyngiomas arise from remnants of Rathke’s pouch along the path of the craniopharyngeal canal. Most involve both the intrasellar and suprasellar compartments (70%); 10% are intrasellar and 20% are suprasellar. They can be seen in children (peak at 5-10 years) and adults (fifth through seventh decades). Craniopharyngiomas can cause symptoms such as visual disturbances, endocrine abnormalities, motor deficits and increased intracranial pressure. The main histologic subtypes are adamantinomatous and squamous papillary. Adamantinomatous subtypes are more often encountered in the suprasellar region in children. They are predominantly cystic, lobulated calcifications and they are highly likely to recur. The squamous papillary subtype presents more frequently in adults. These craniopharyngiomas are predominantly solid, spherical and they occur in either the intrasellar or suprasellar regions.10 Calcification is seen in 80% of lesions and is best delineated on CT. Cystic areas are observed in 85% of cases and can have a variable appearance on MRI depending on the degree of methemoglobin and/or high protein. Enhancement can be solid or nodular (Figure 8).
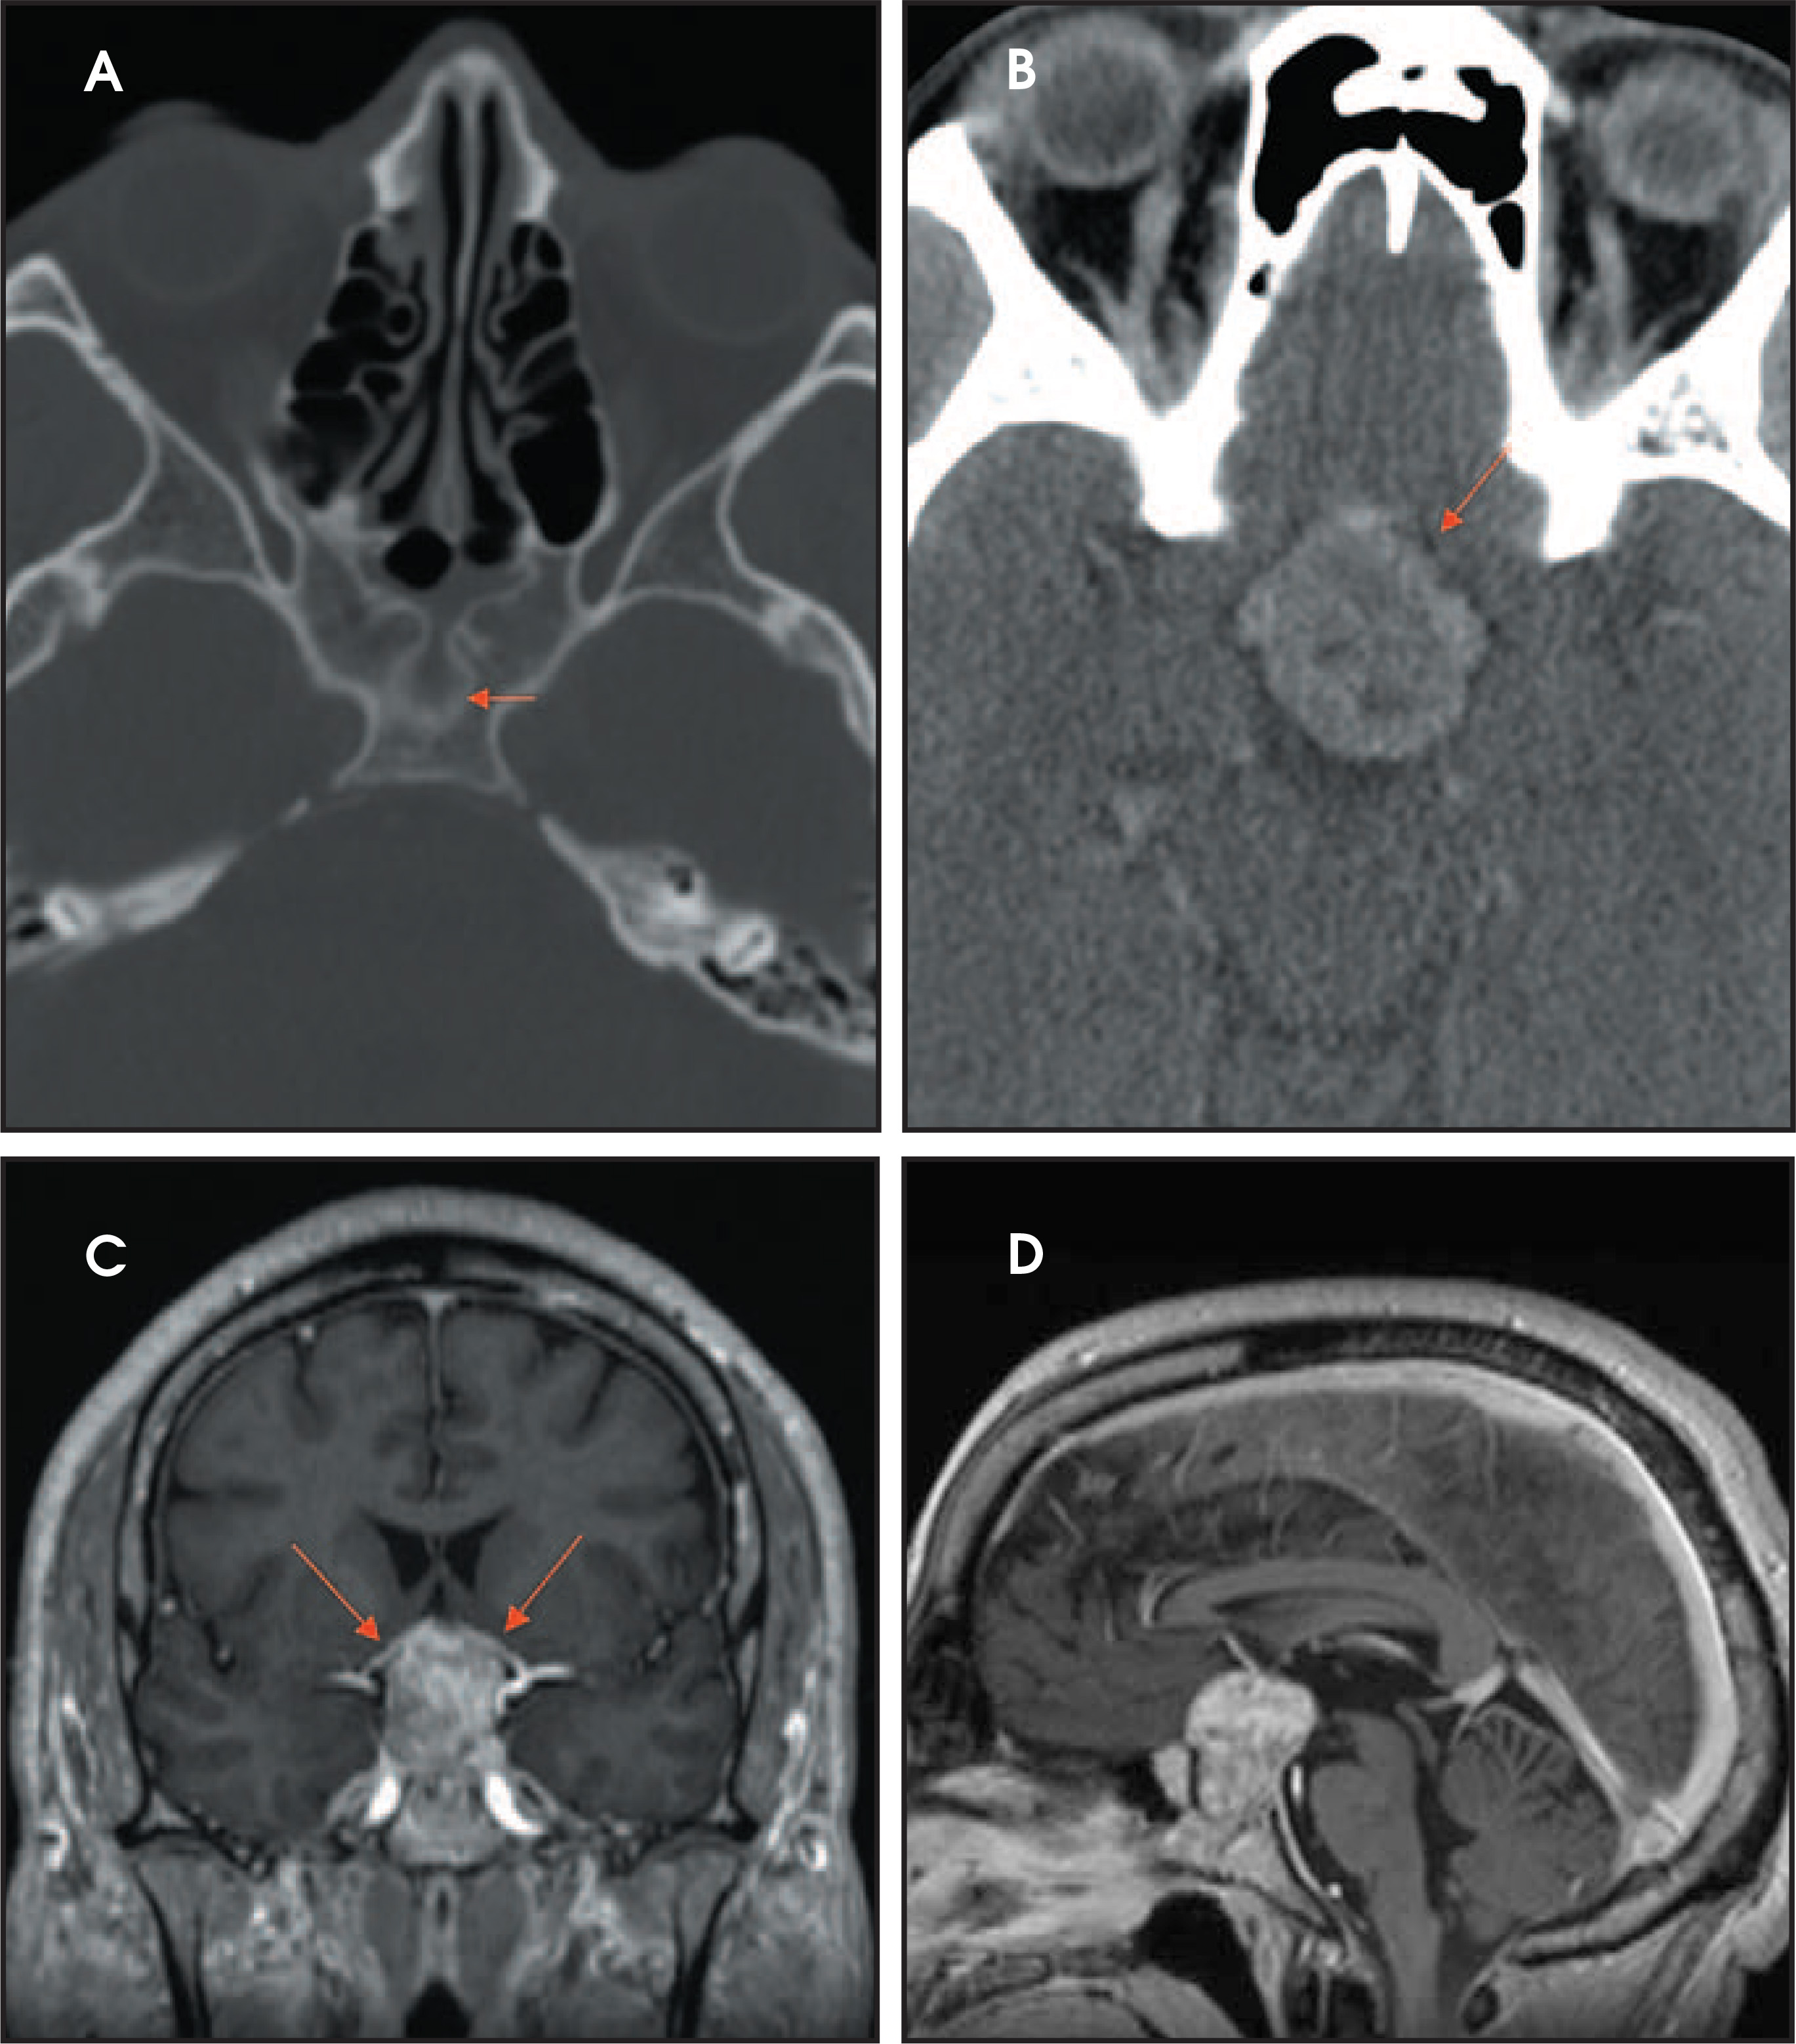
Meningiomas in this region originate from the tuberculum sella, anterior clinoid processes, diaphragma sellae, planum sphenoidale and upper clivus (Figure 9). They can cause osseous changes including hyperostosis and erosion. As meningiomas in other locations, they are isointense to slightly hypointense on T1-weighted imaging. They are isointense to slightly hyperintense on T2-weighted imaging and they enhance homogenously and intensely. The vascular supply to these lesions is from the carotid meningeal and ophthalmic arteries.
Infundibular pathology
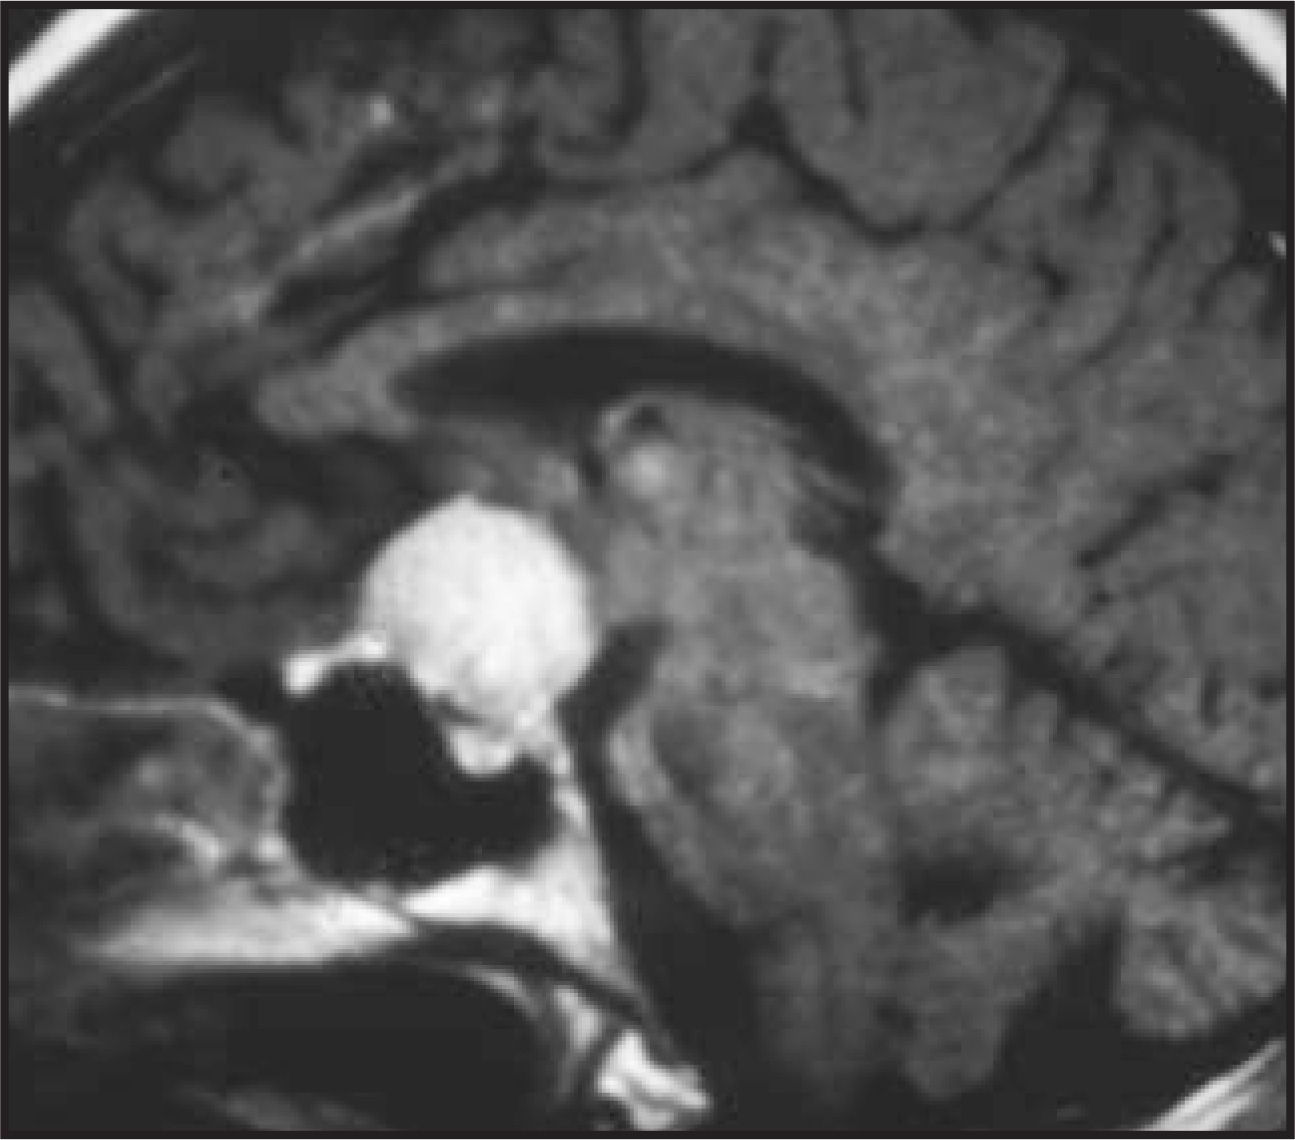
The infundibulum has a funnel-shaped contour 3 to 3.5 mm superiorly and 2 mm inferiorly. A variety of inflammatory (such as giant-cell granuloma and Langerhans cell histiocytosis) and neoplastic lesions can involve the infundibulum. These lesions often involve the hypothalamus and can result in diabetes inspidus. Langerhans cell histiocytosis (LCH) is the most common pediatric infundibular tumor (Figure 10).11,12 There may be meningeal involvement and choroid plexus lesions.12 In nearly all cases of LCH, the normal T1 hyperintensity of the neurohypophysis is absent.11
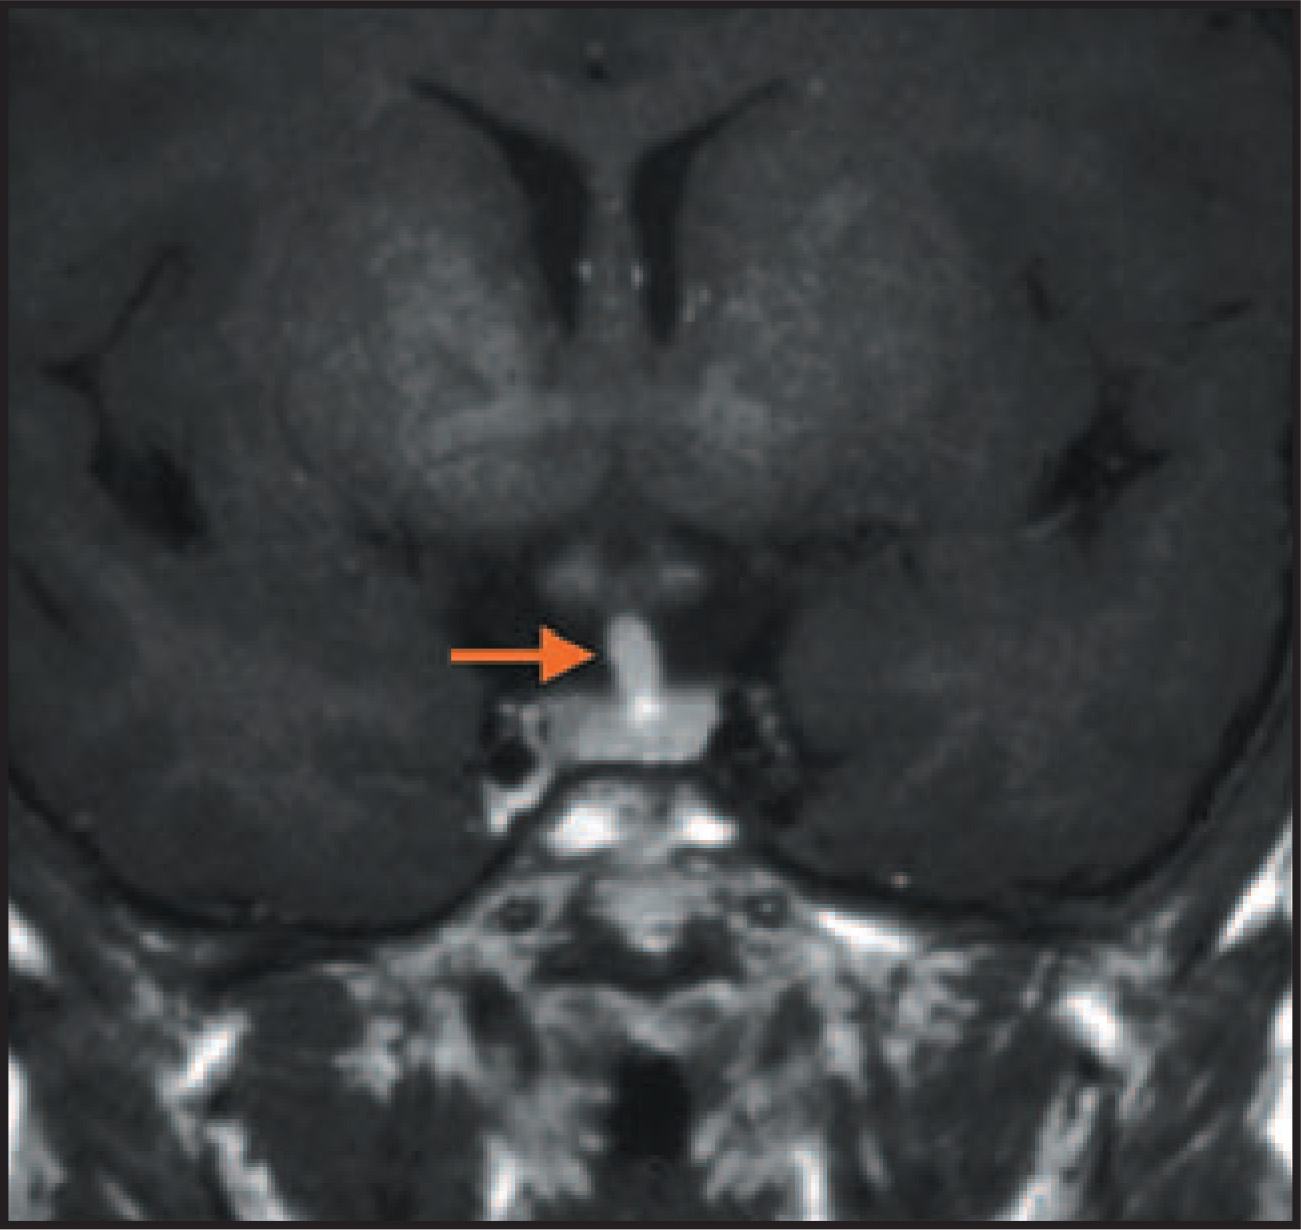
Neoplastic processes that can enlarge the stalk include lymphoma (Figure 11), metastases, germinoma and teratoma. Metastases (Figure 12) have been re-ported in 3% of patients with carcinoma, particularly breast or primary bronchogenic.13 The hematogenous route is likely and additional intra-axial or extra-axial lesions may be a diagnostic clue. They may have a dumbbell morphology from invasion through the diaphragma sella.
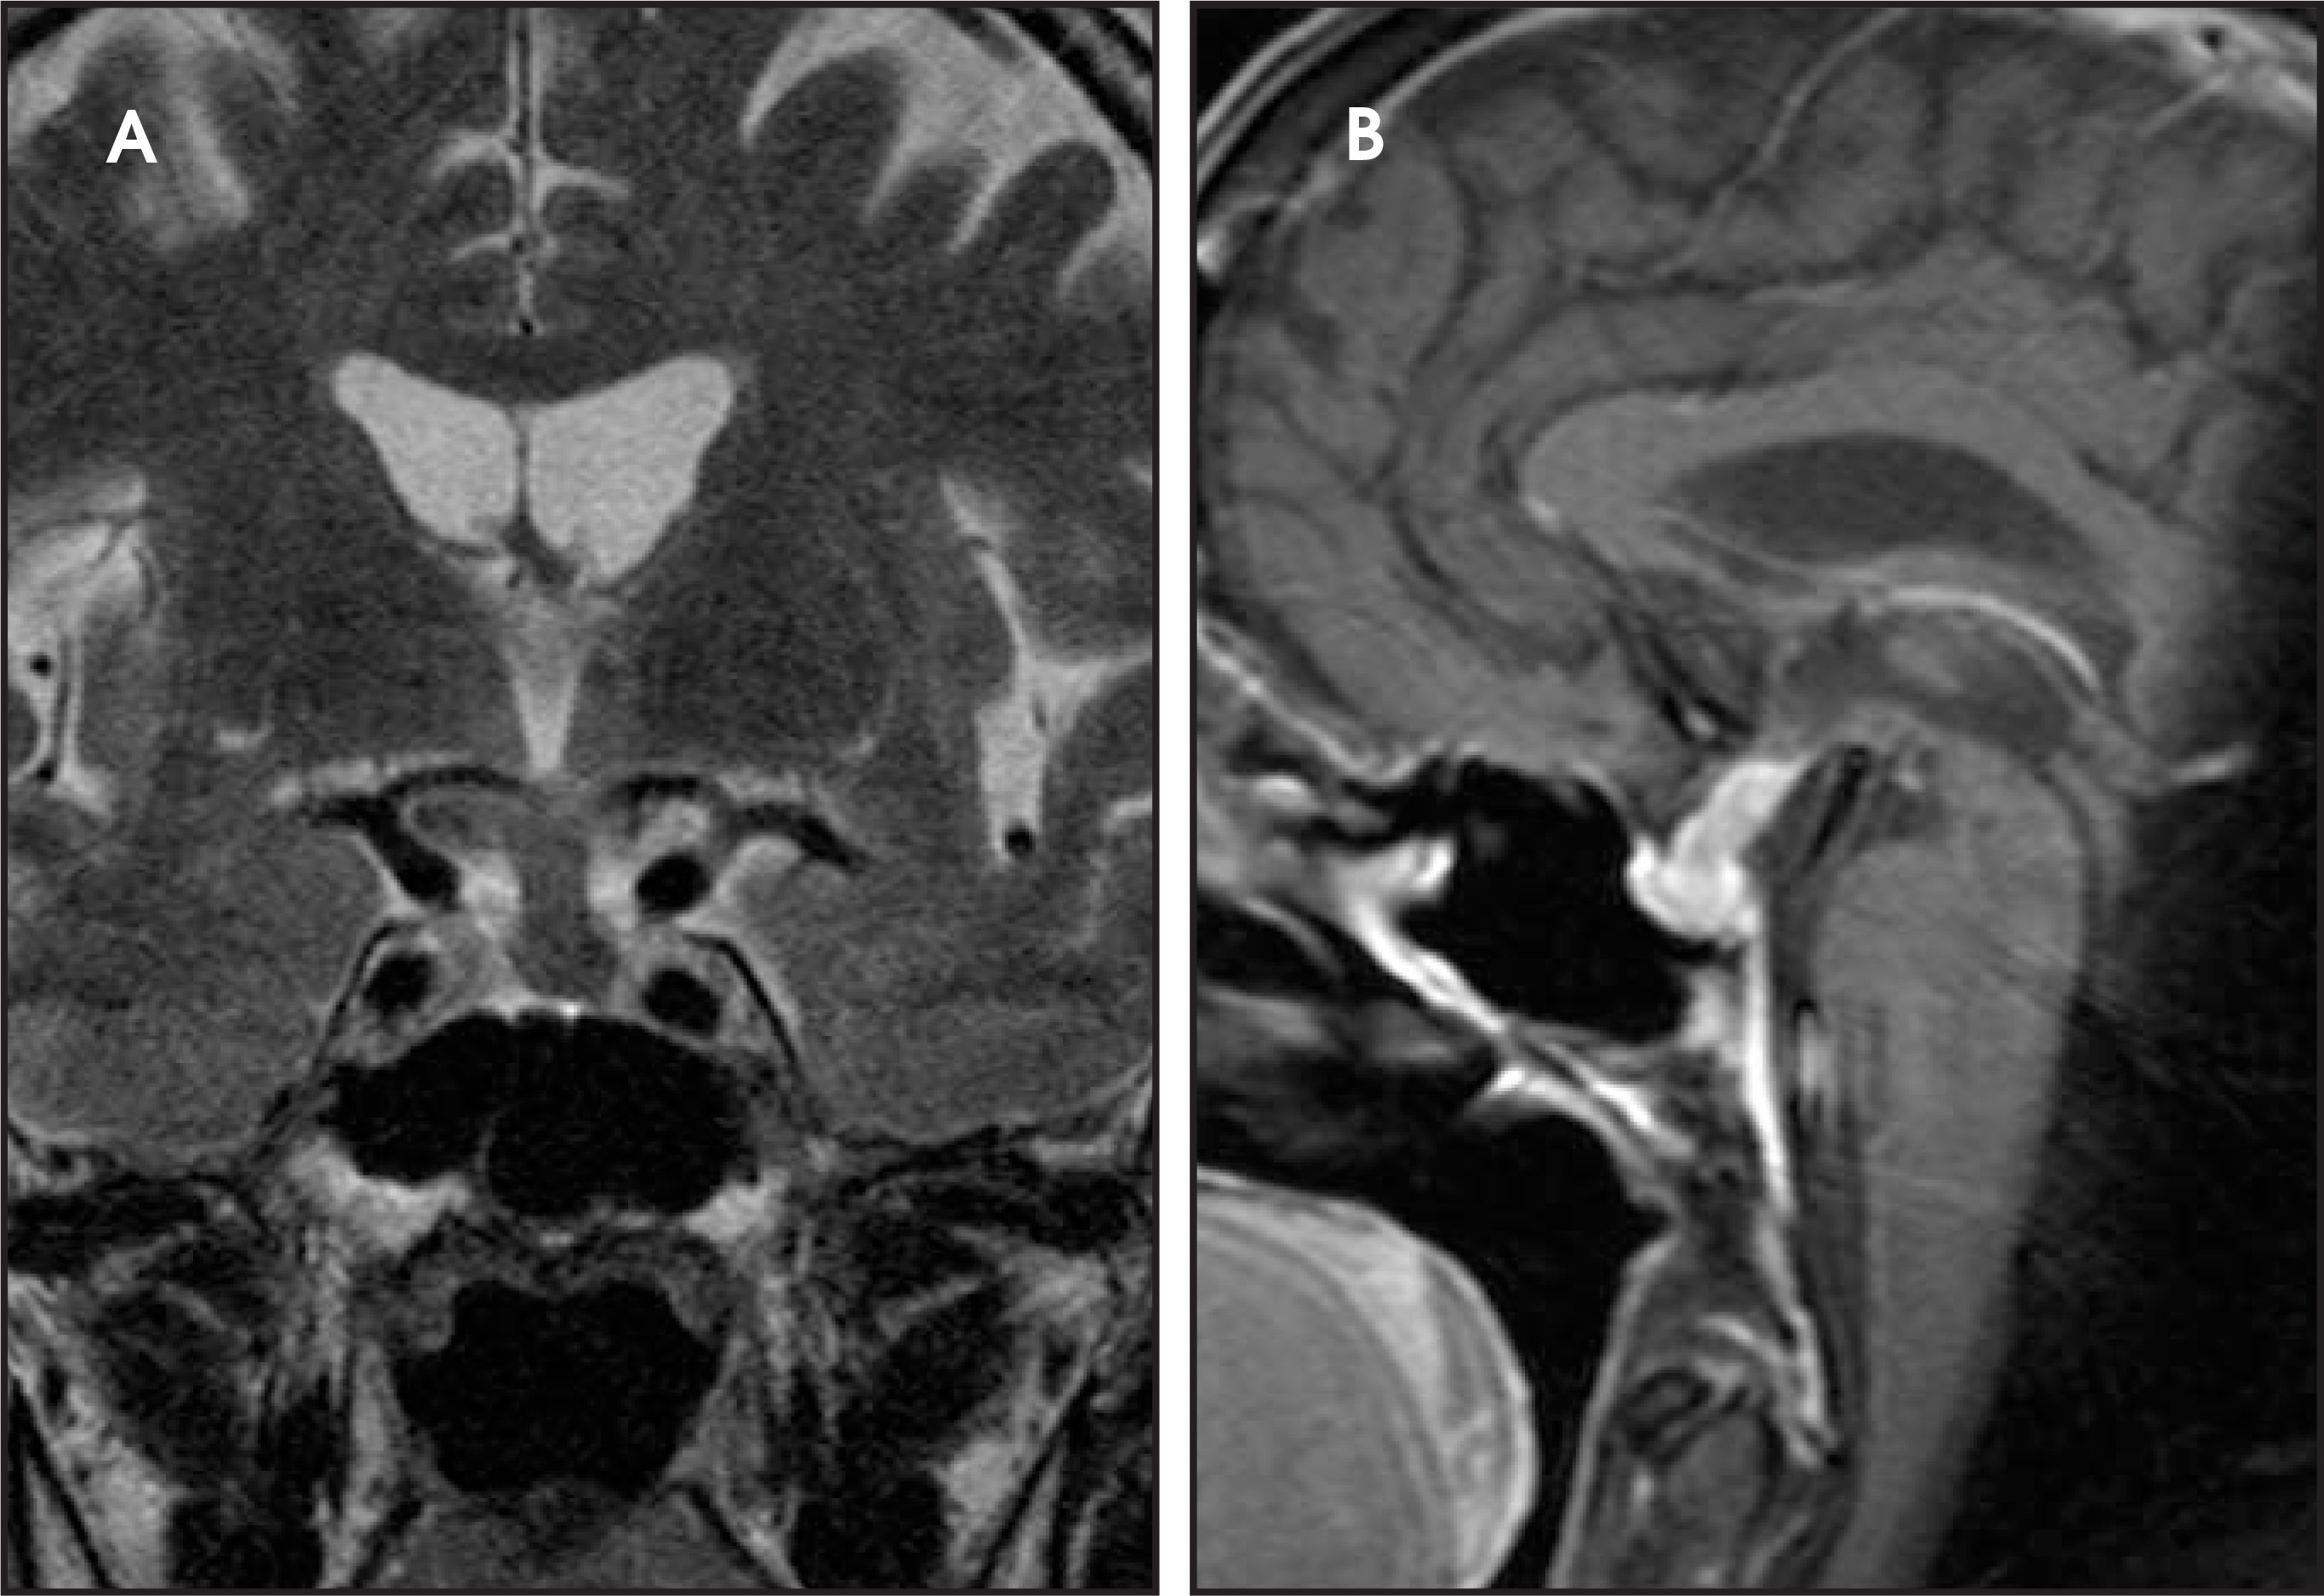
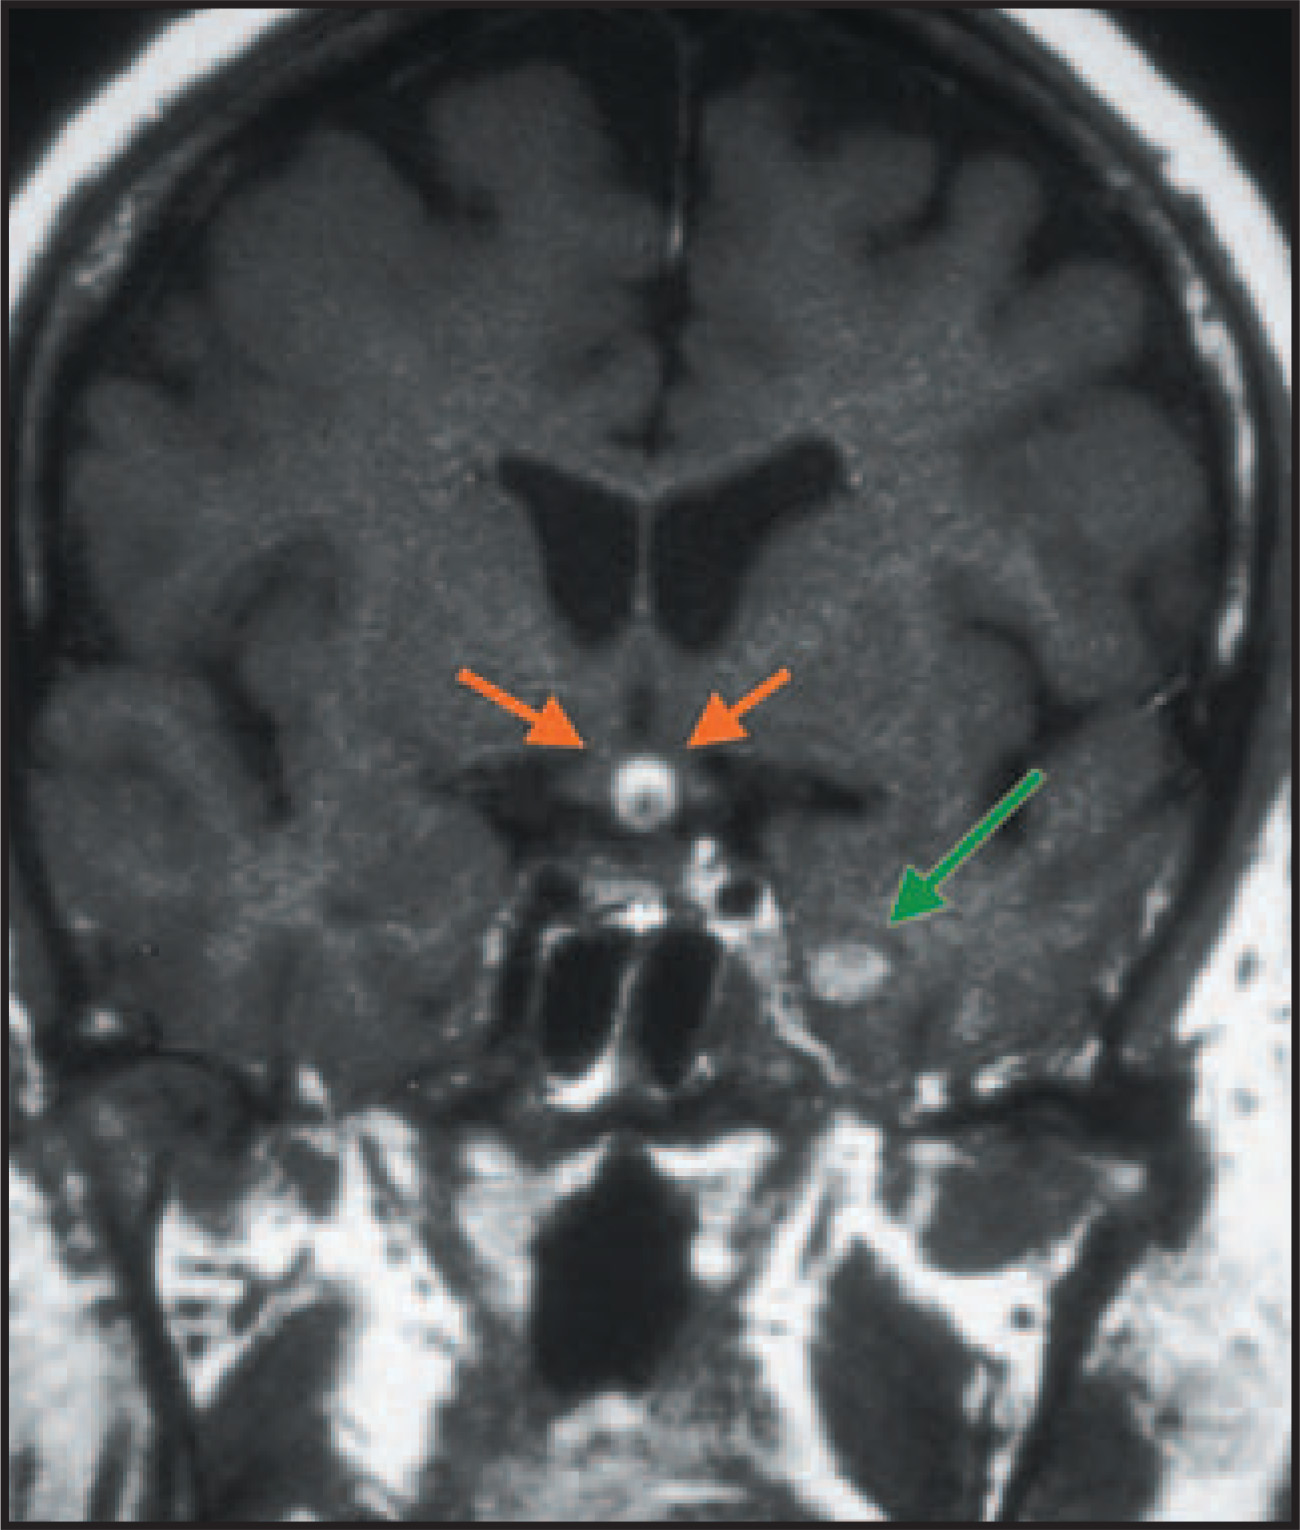
Primary brain tumors such as medulloblastoma, pineoblastoma and germinoma, and lymphoma and leukemia may spread to the infundibular or suparsellar region via cerebrospinal fluid (CSF) seeding. Germinomas (Figure 13) are more commonly seen in the pediatric population, presenting with diabetes inspidus, hypopituitarism and optic chiasm compression. There may be coexistent pineal masses, and there may be subarachnoid spread.
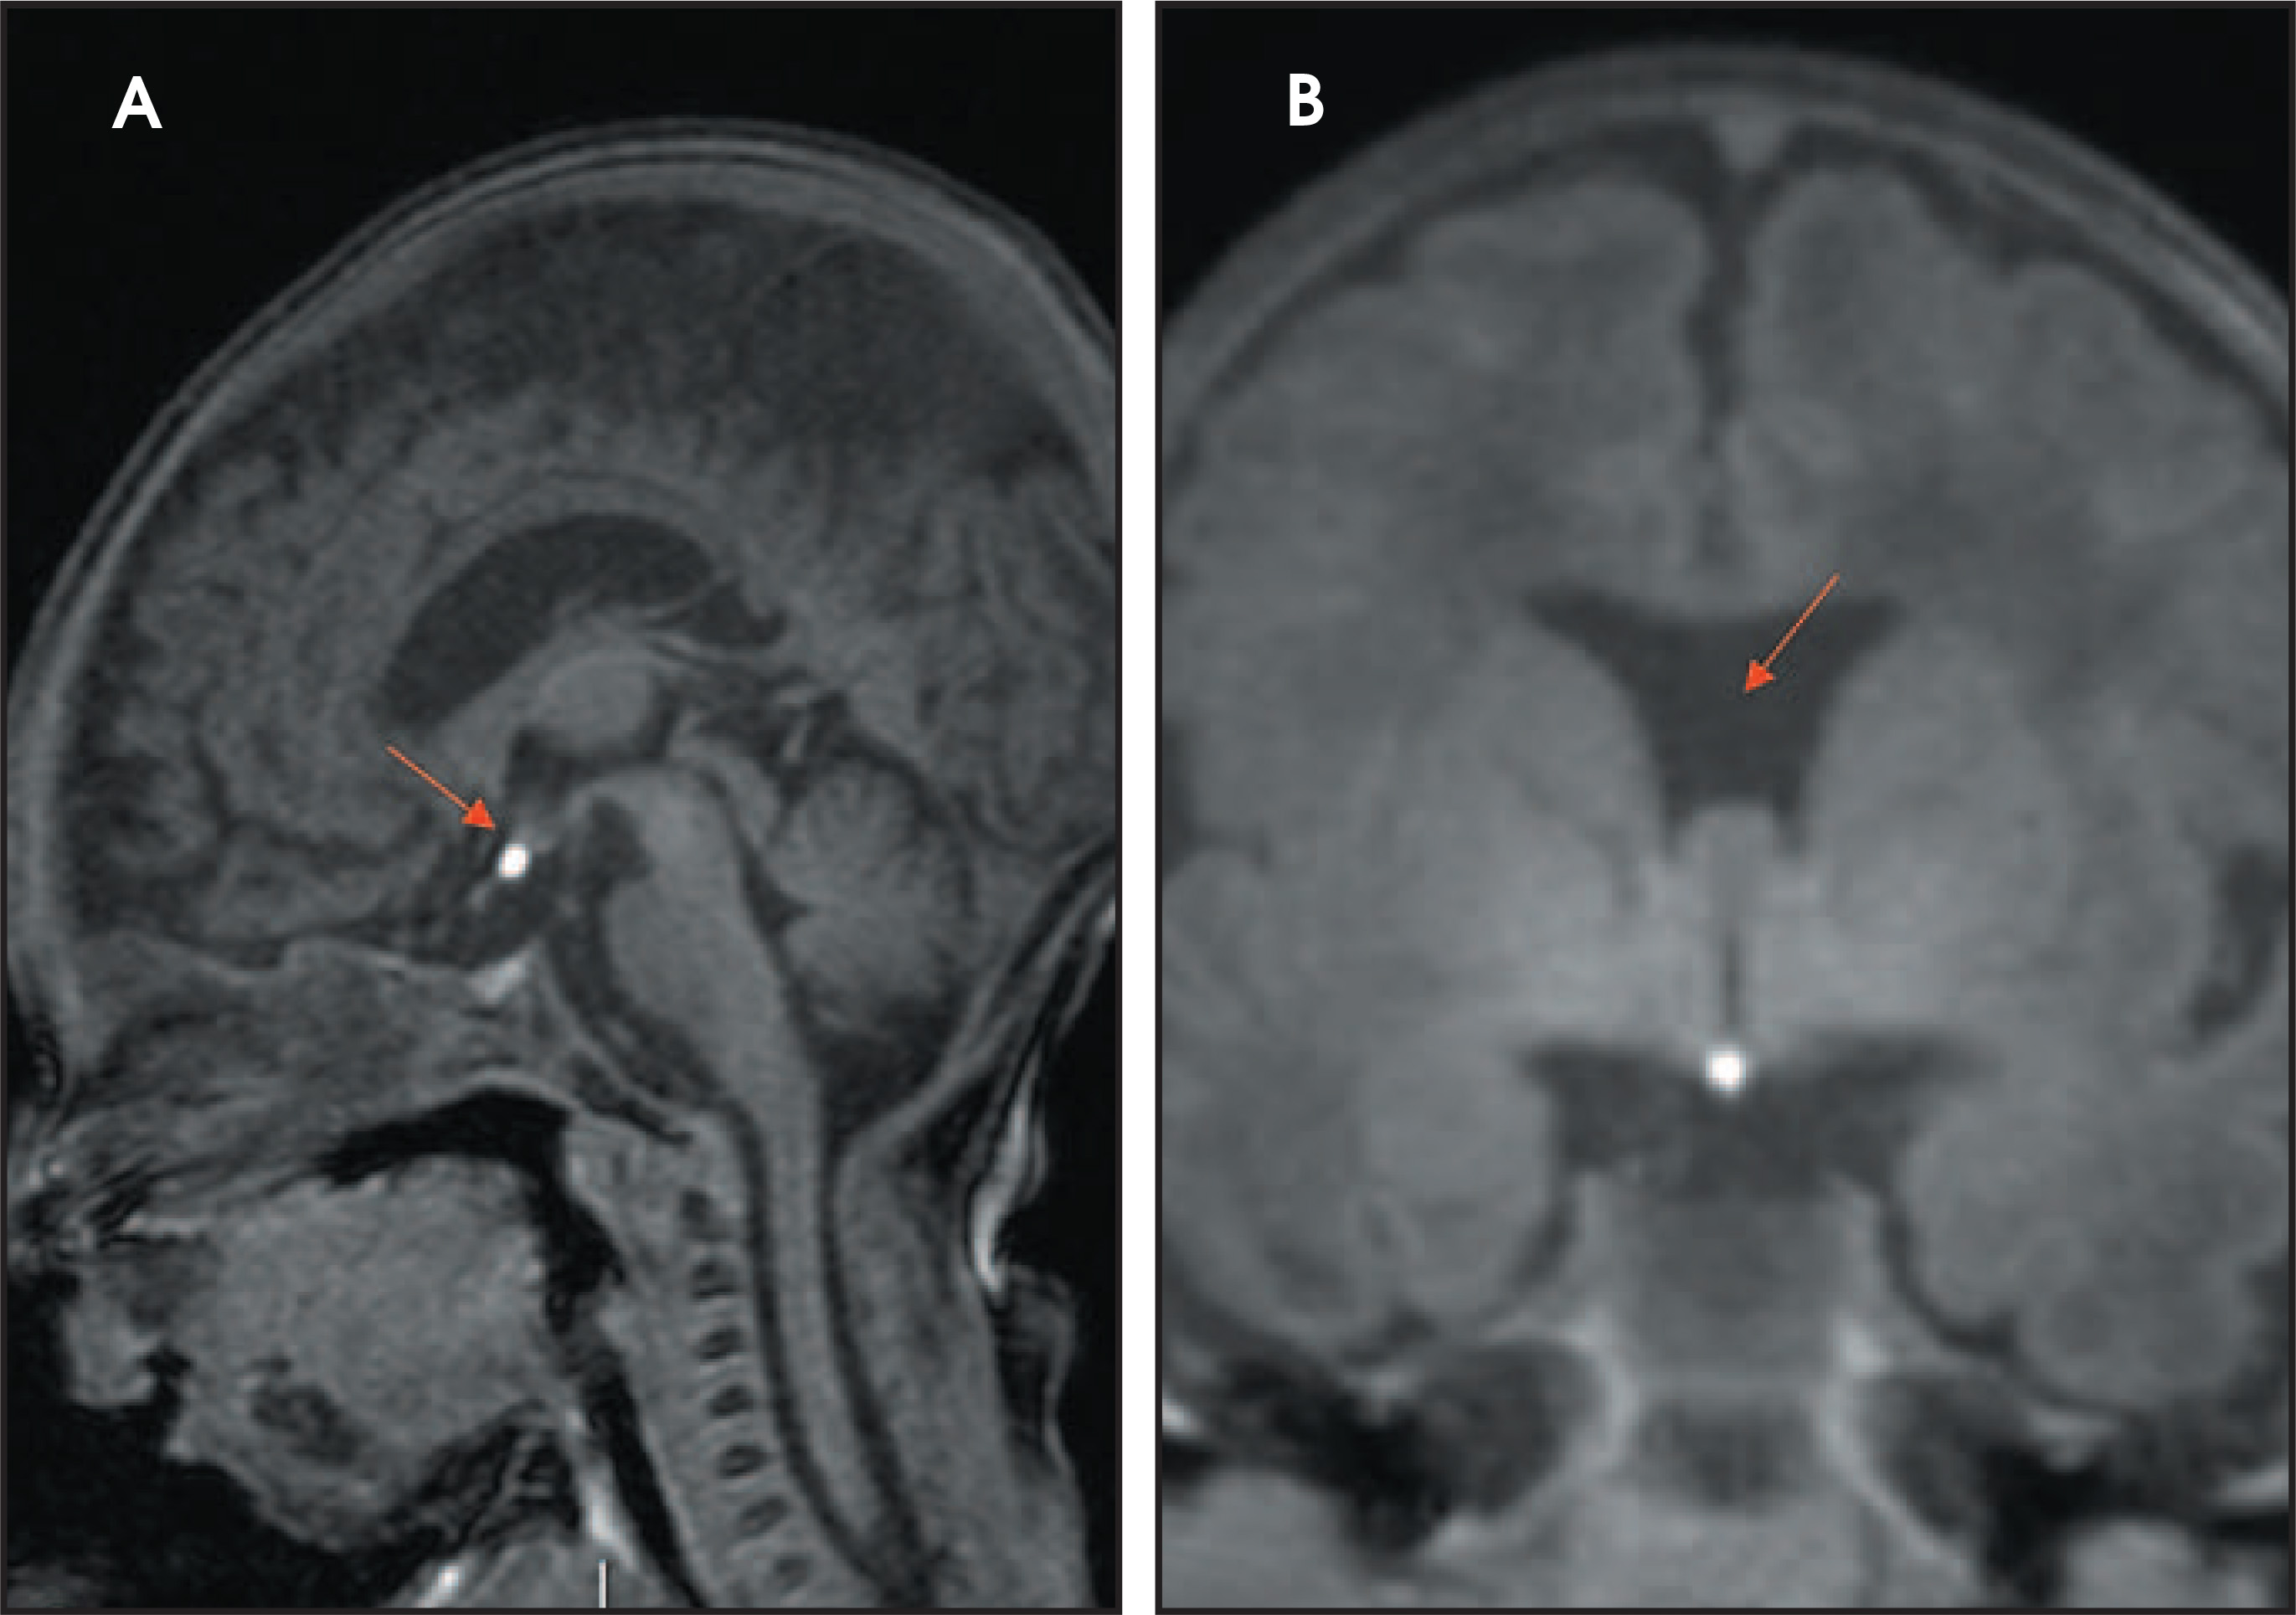
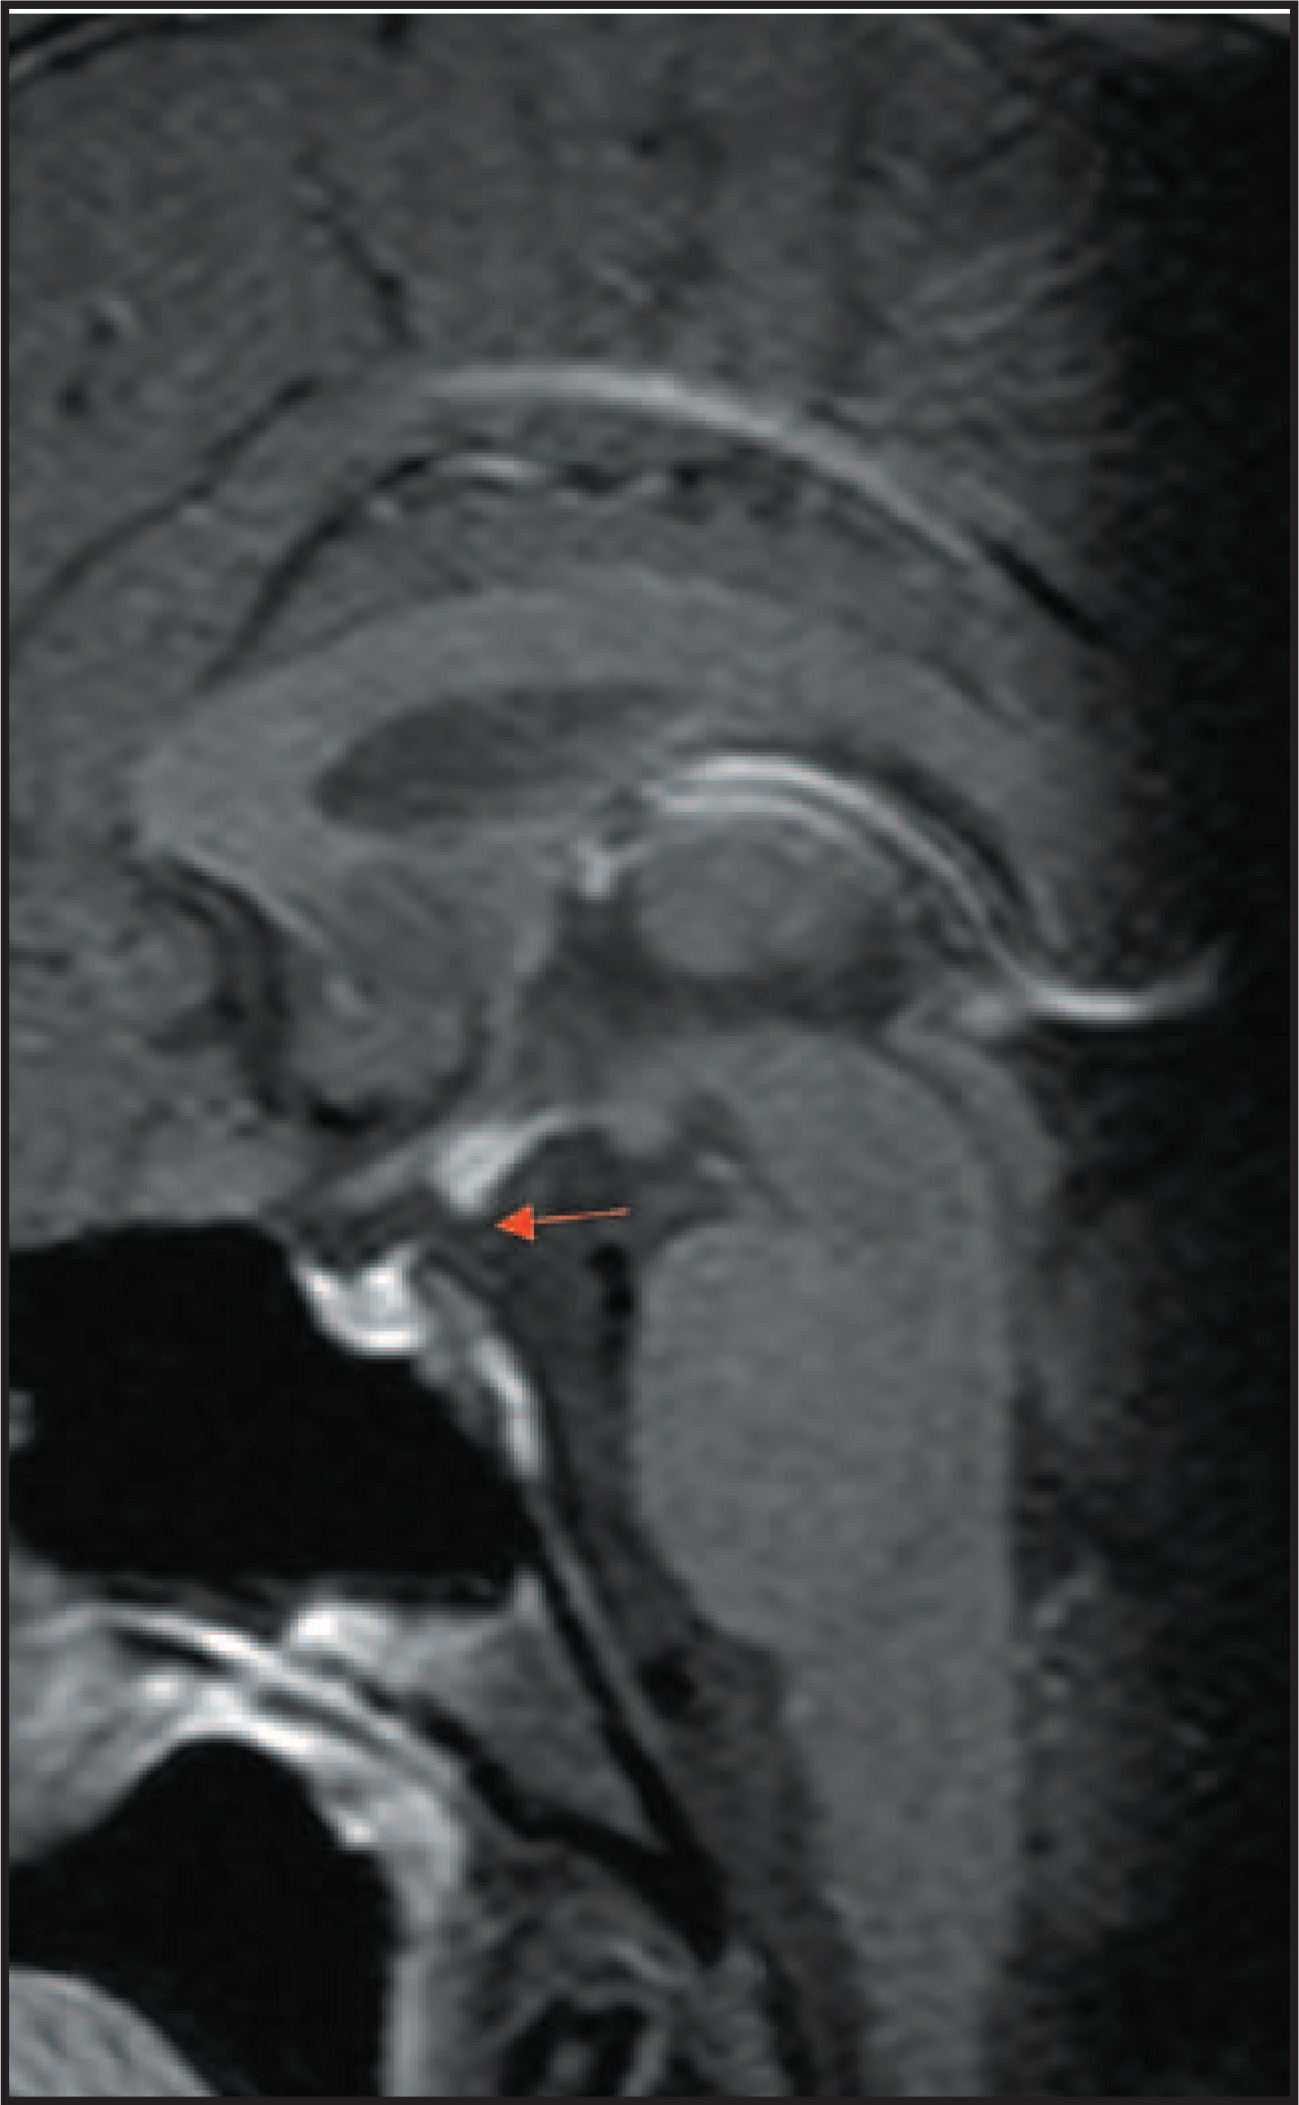
Ectopic neurohypophysis can be caused by trauma or neoplastic processes, which disrupt the transport of hormones from the hypothalamus to the neurohypophysis. Congential ectopic neurohypophysis is associated with other midline abnormalties such as septo-optic dysplasia (Figure 14). The expected posterior pituitary bright spot is frequently located in the suprasellar region. This can lead to growth hormone deficiency. In the extreme manifestation of this abnormality, i.e. pituitary stalk interruption syndrome, there is also an absence or hypoplastic infundibular stalk and adenohypophysis14 (Figure 15).
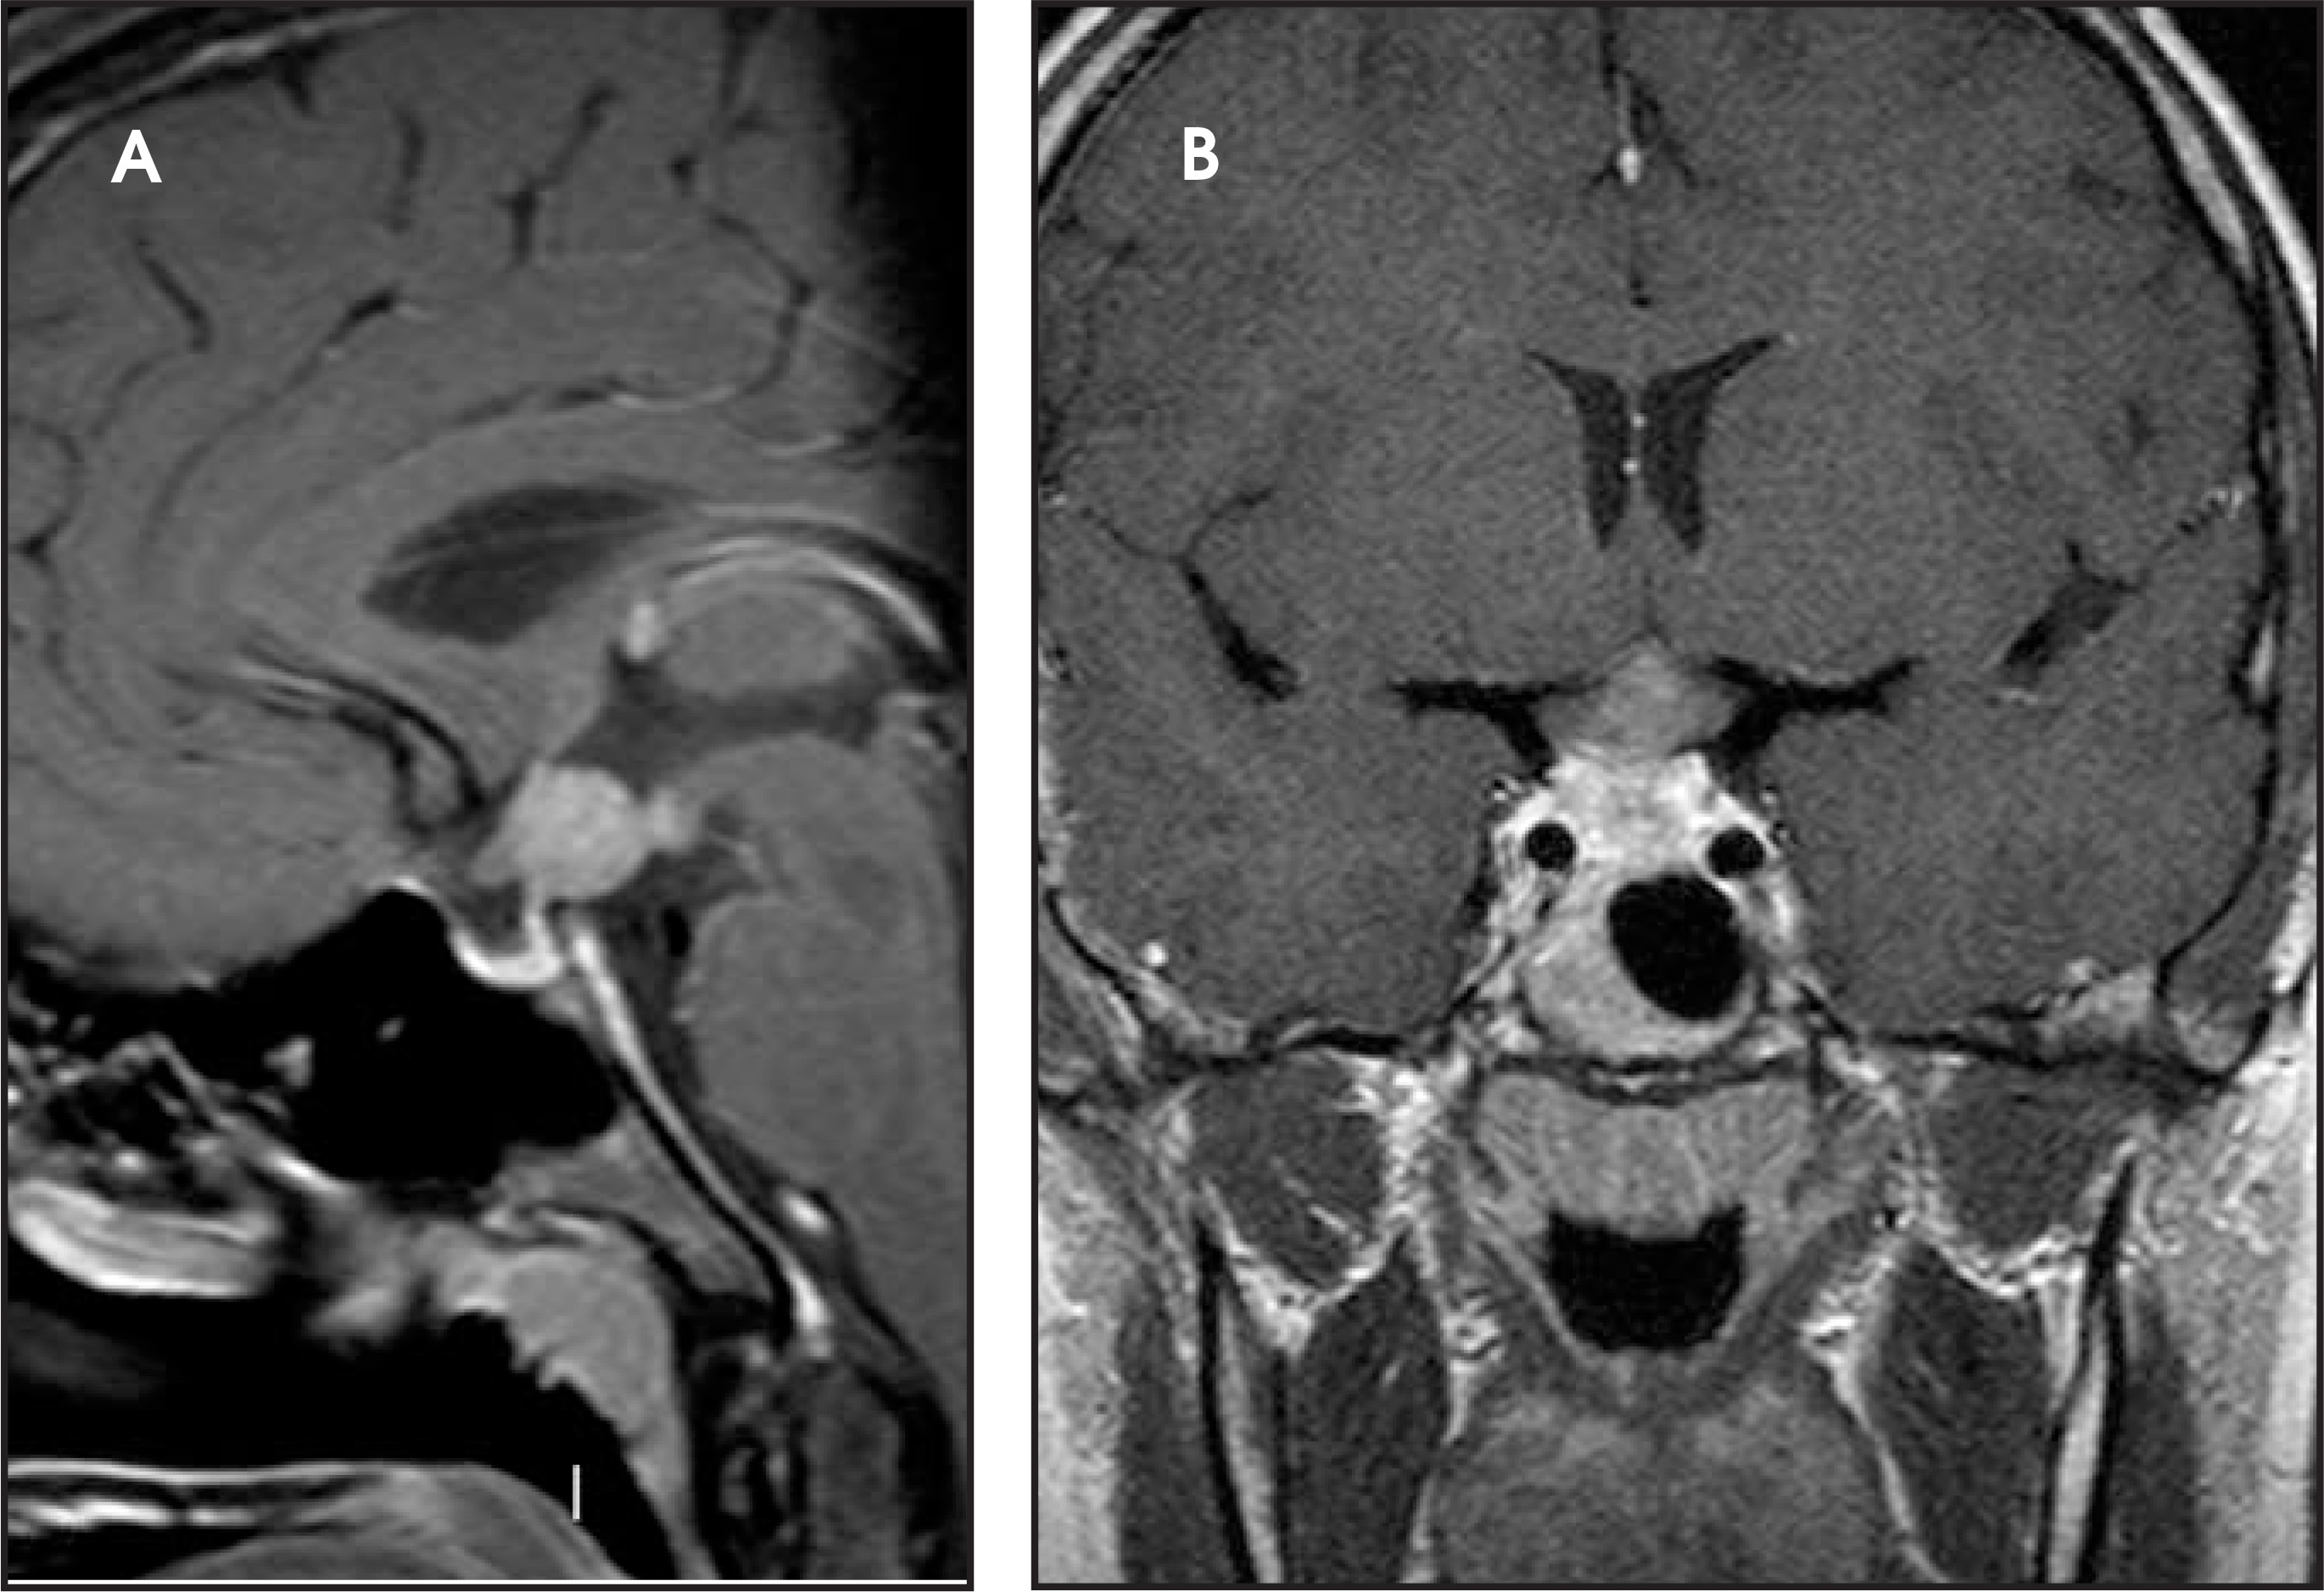
Lymphocytic hypophysitis (Figure 16) is an autoimmune disorder seen primarily in peripartum/postpartum females though it has also been reported in males and postmenopausal women.15 On MRI, there is intense enhancement of a pituitary mass extending along the infundibulum to the floor of the hypothalamus. The posterior pituitary bright spot may be absent. The adenohypophysis and/or the neurohypohysis can be affected.1 Dynamic MRI studies have shown that blood supply to the neurohypophysis is often compromised. Patients may present with visual field impairment and headache due to mass effect on adjacent structures. As the pituitary parenchyma is destroyed by the inflammatory process, partial or pan-hypopituitarism develops.15 However, the condition is responsive to corticosteroid treatment and can spontaneously resolve.
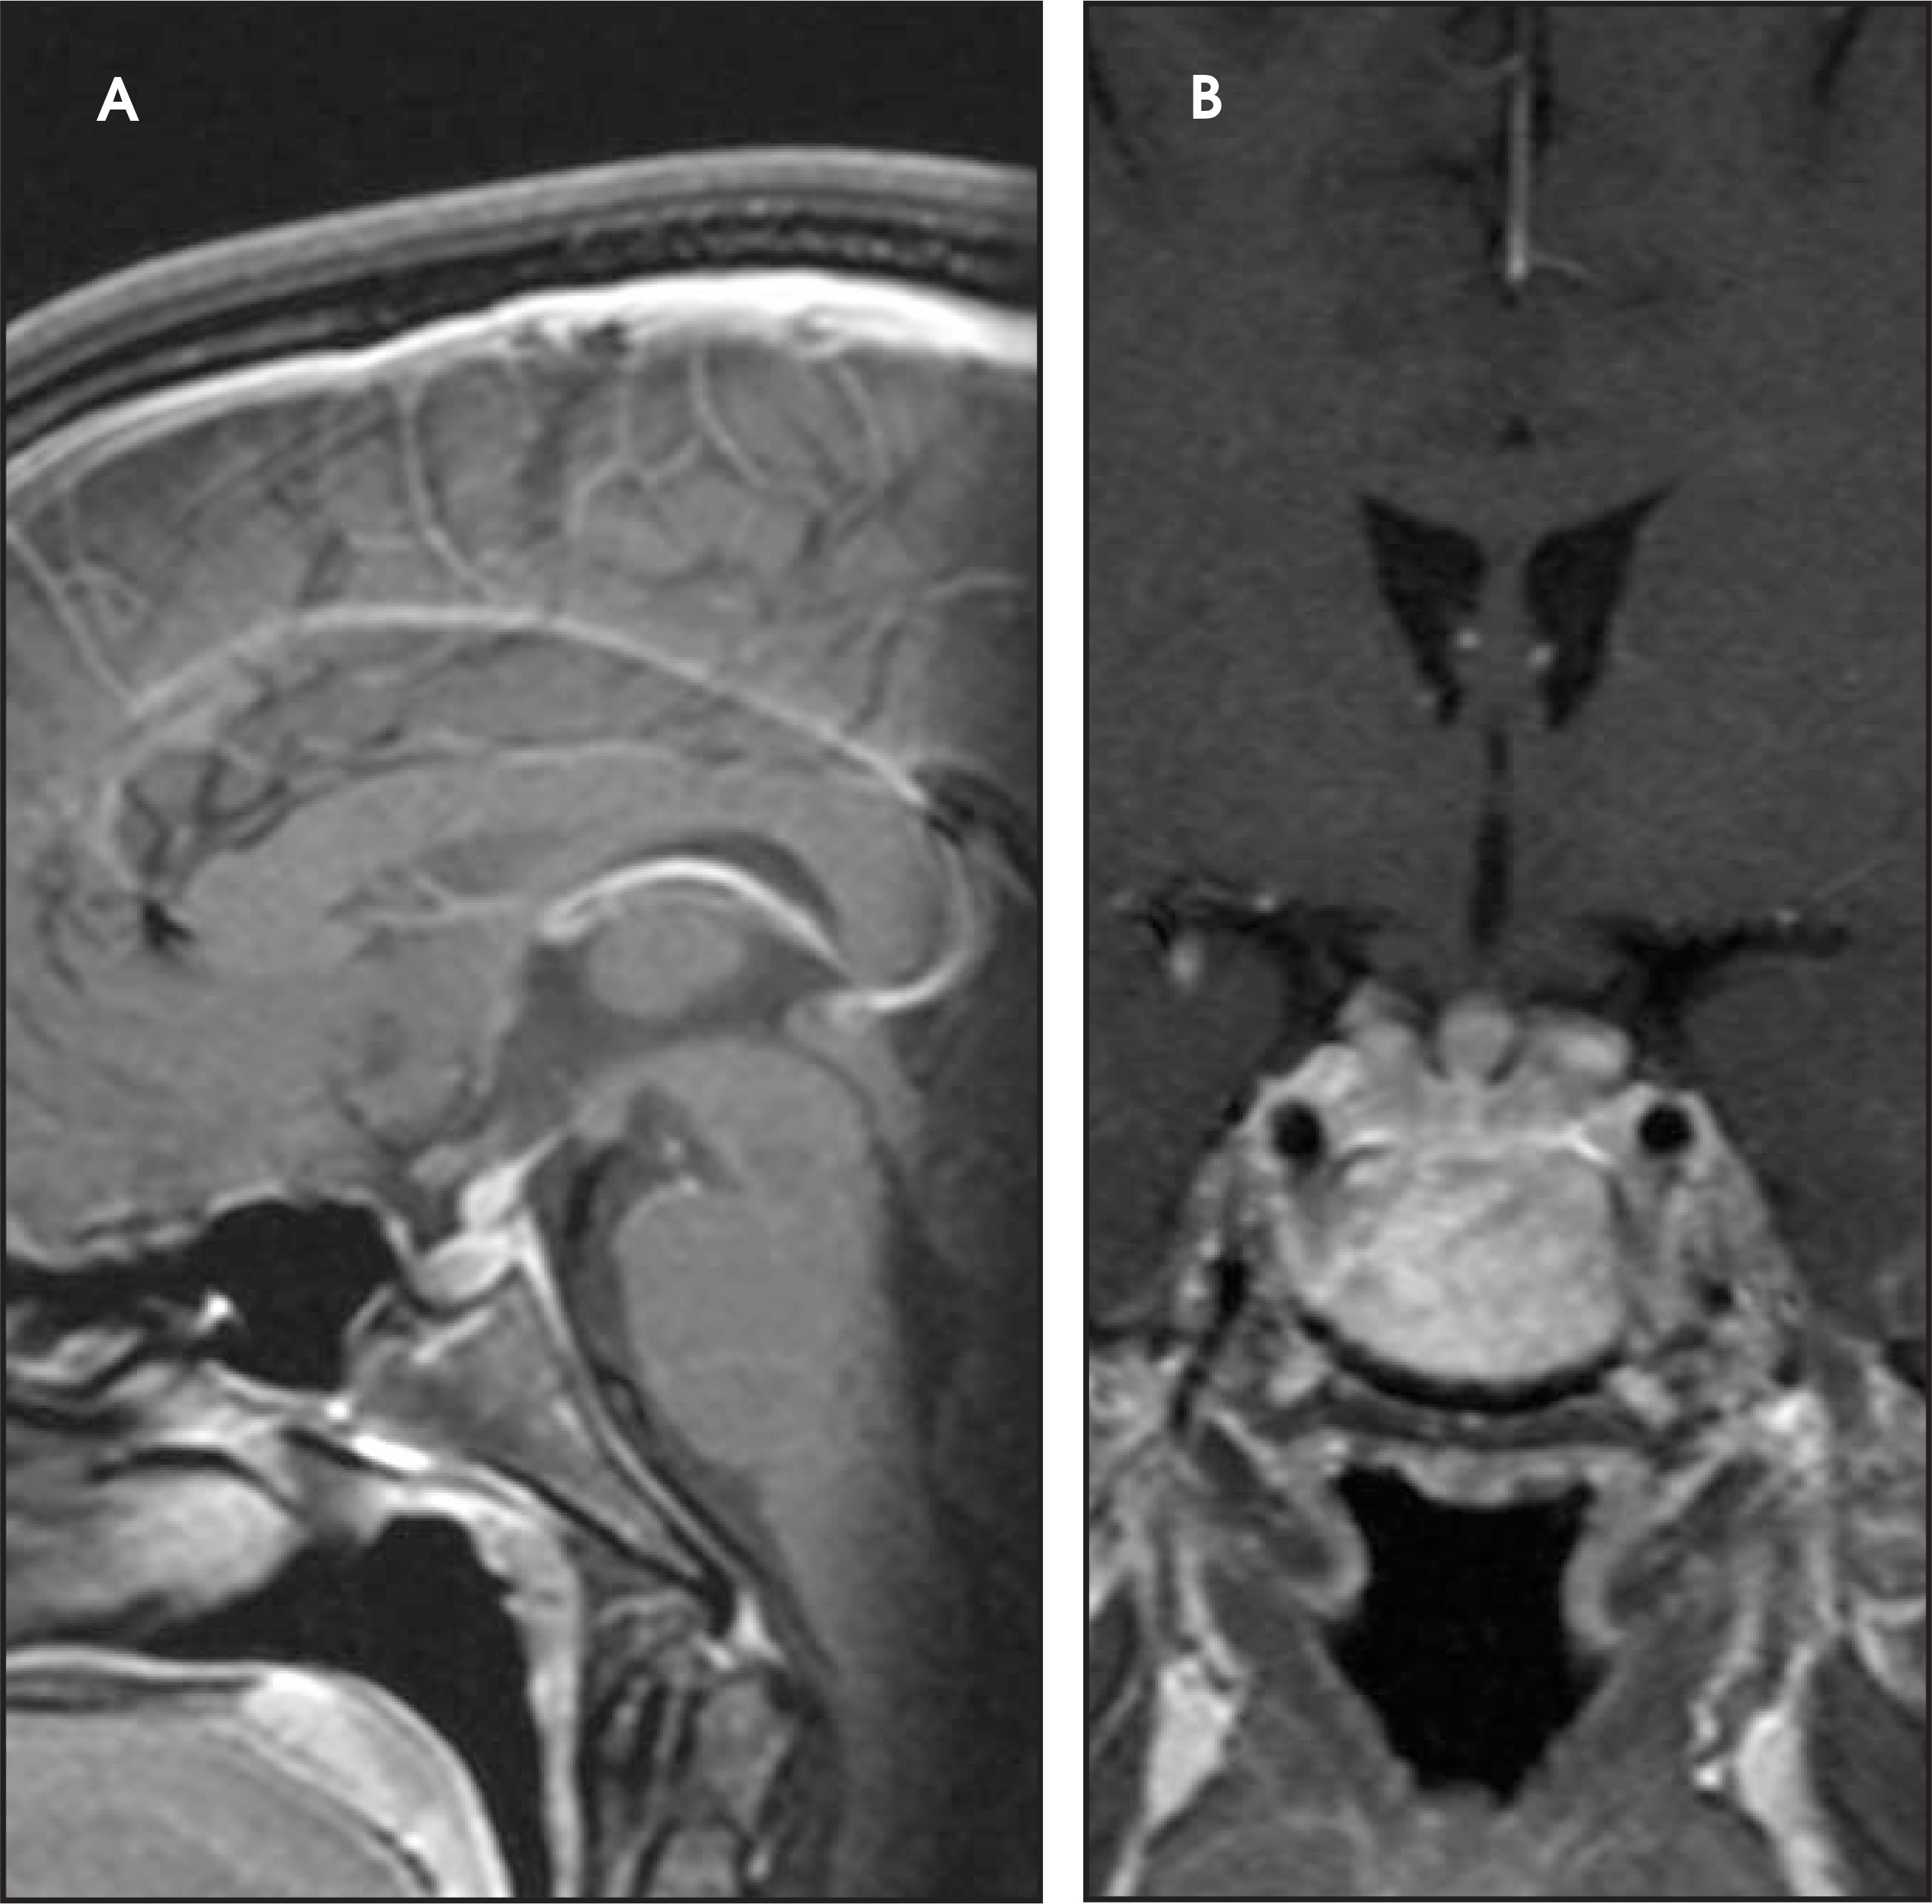
Neurosarcoidosis (Figure 17) is an inflammatory granulomatous process, which has a predilection for the leptomeninges.7 There can be involvement of the optic chiasm, hypothalamus, pituitary gland and infundibulum.
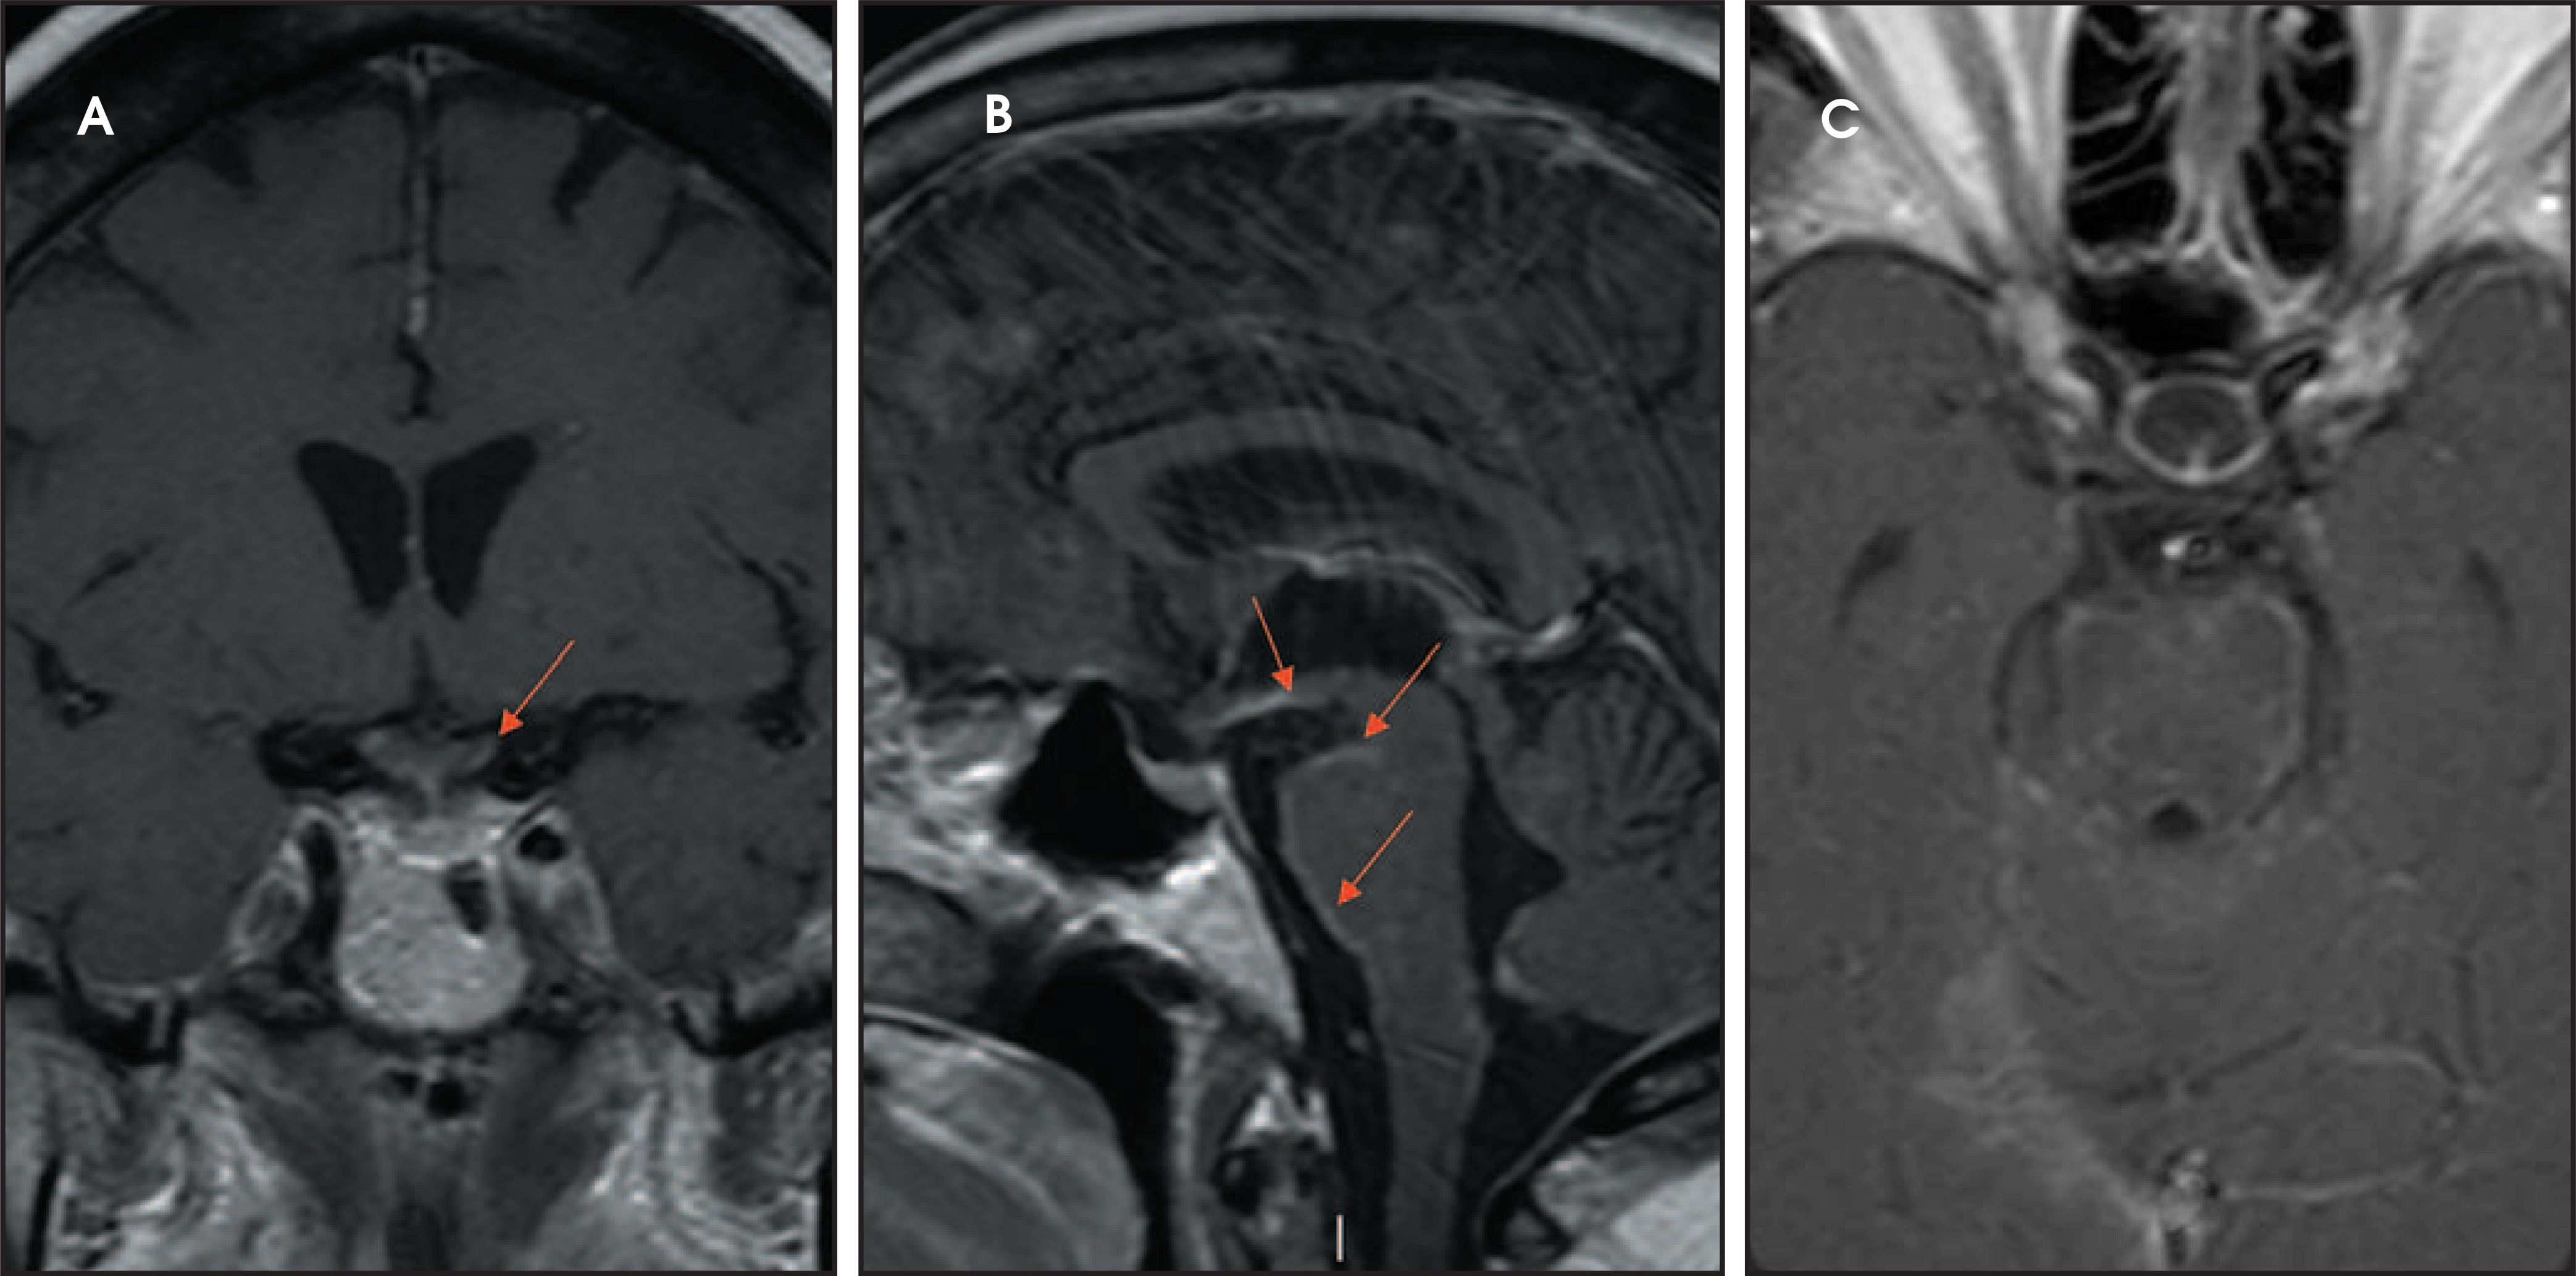
Suprasellar pathology
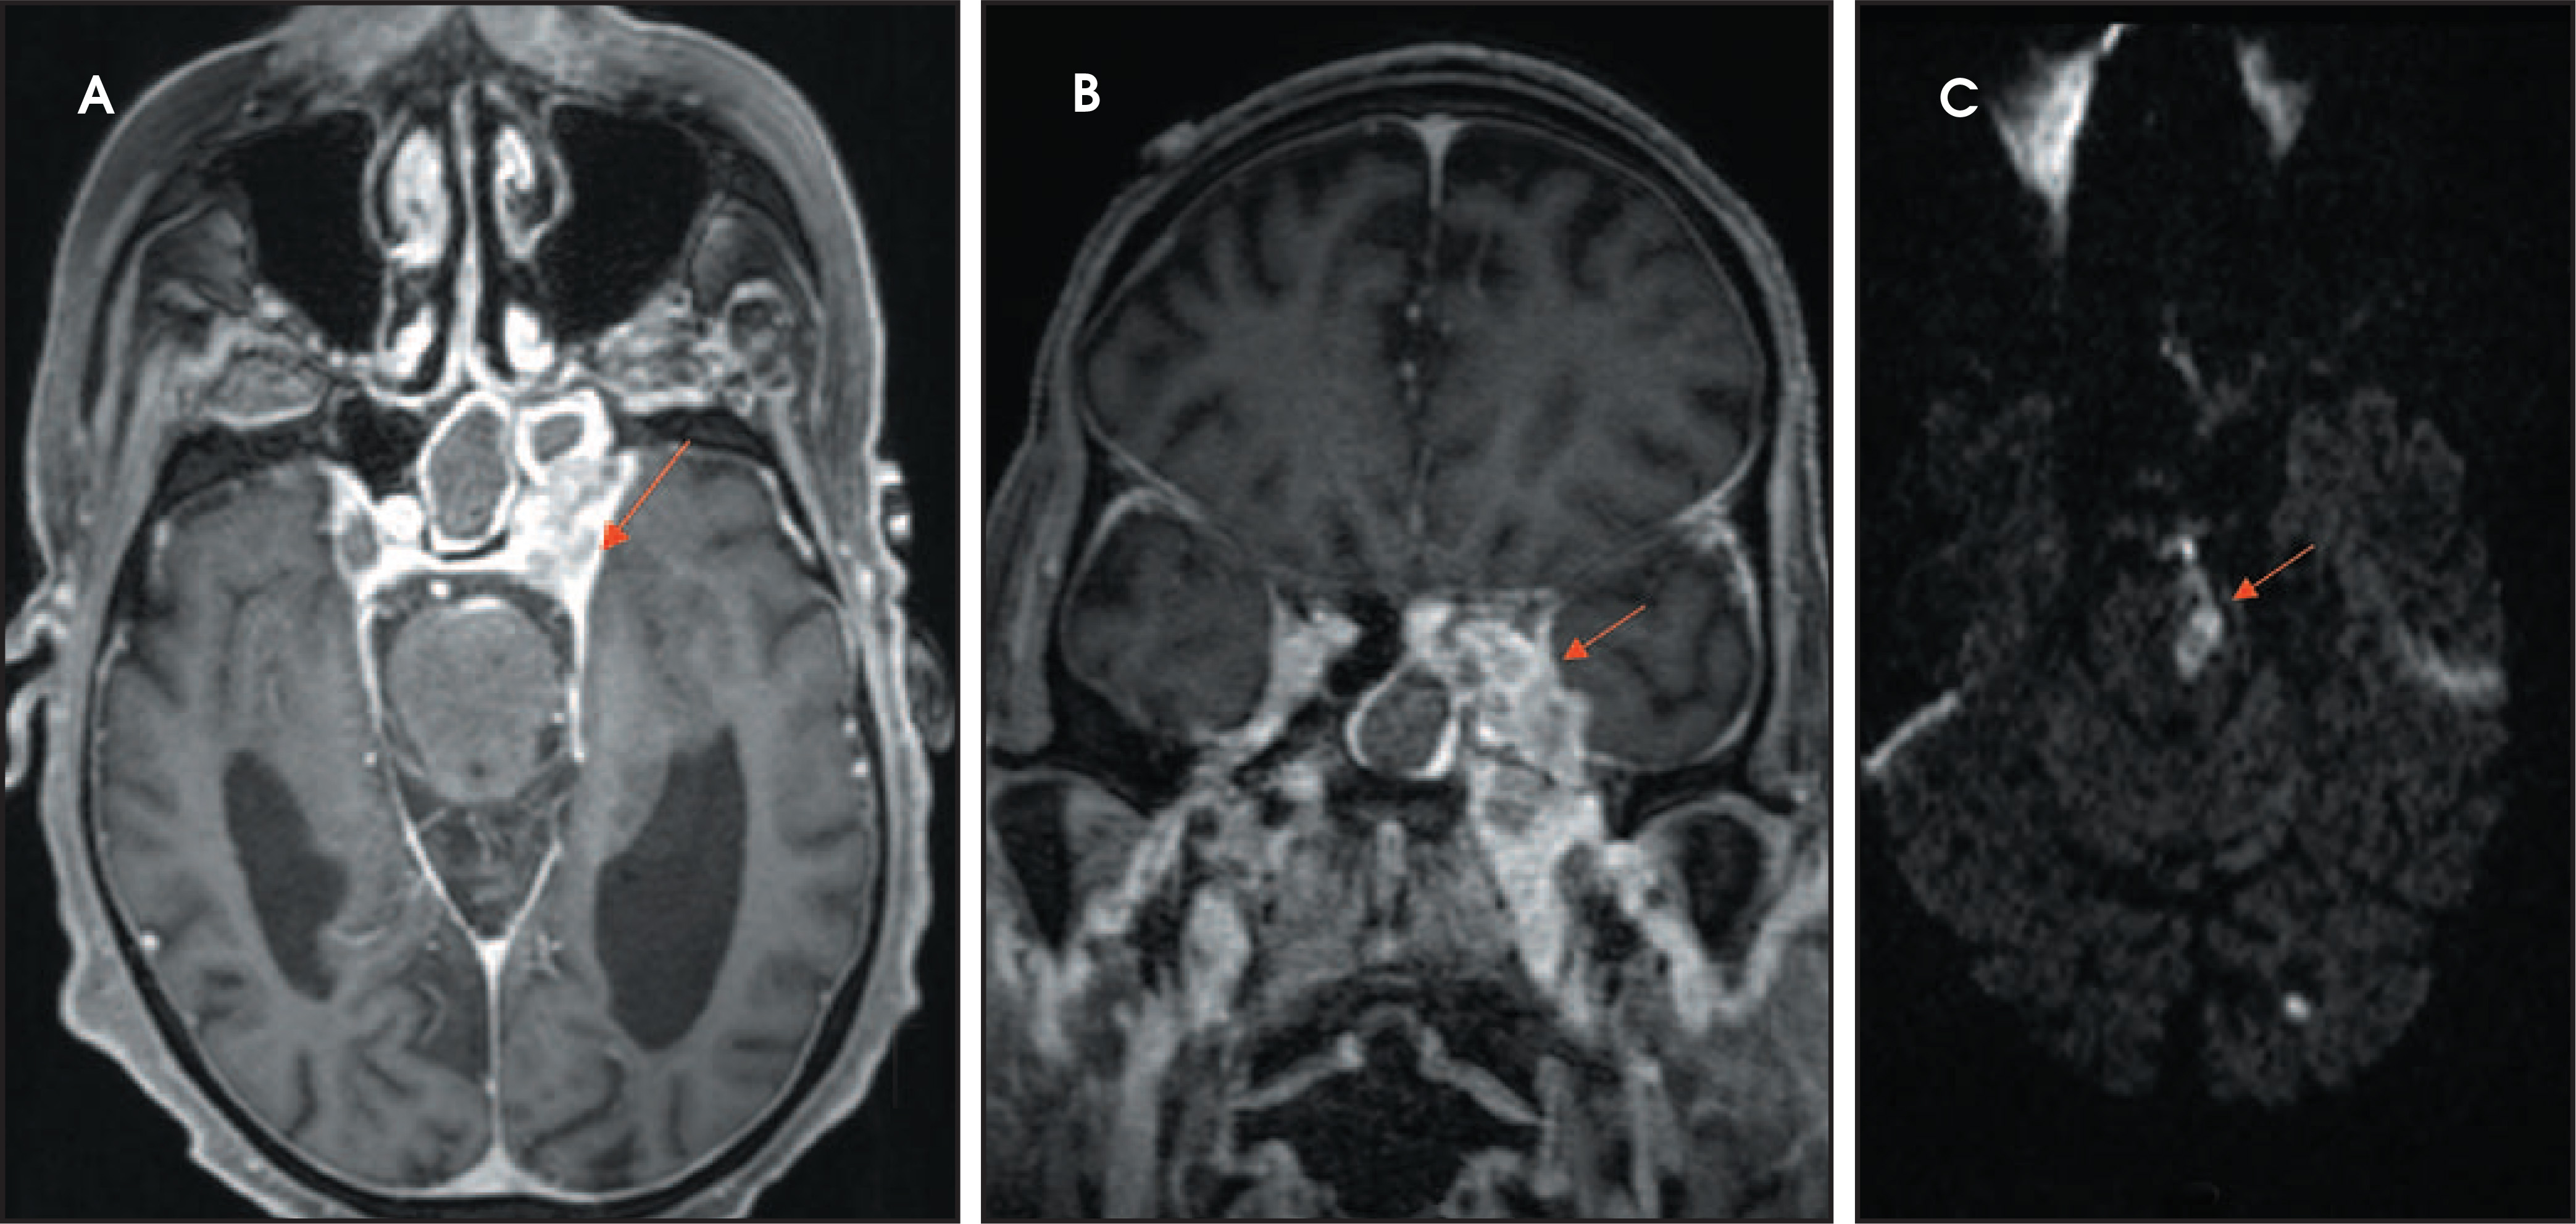
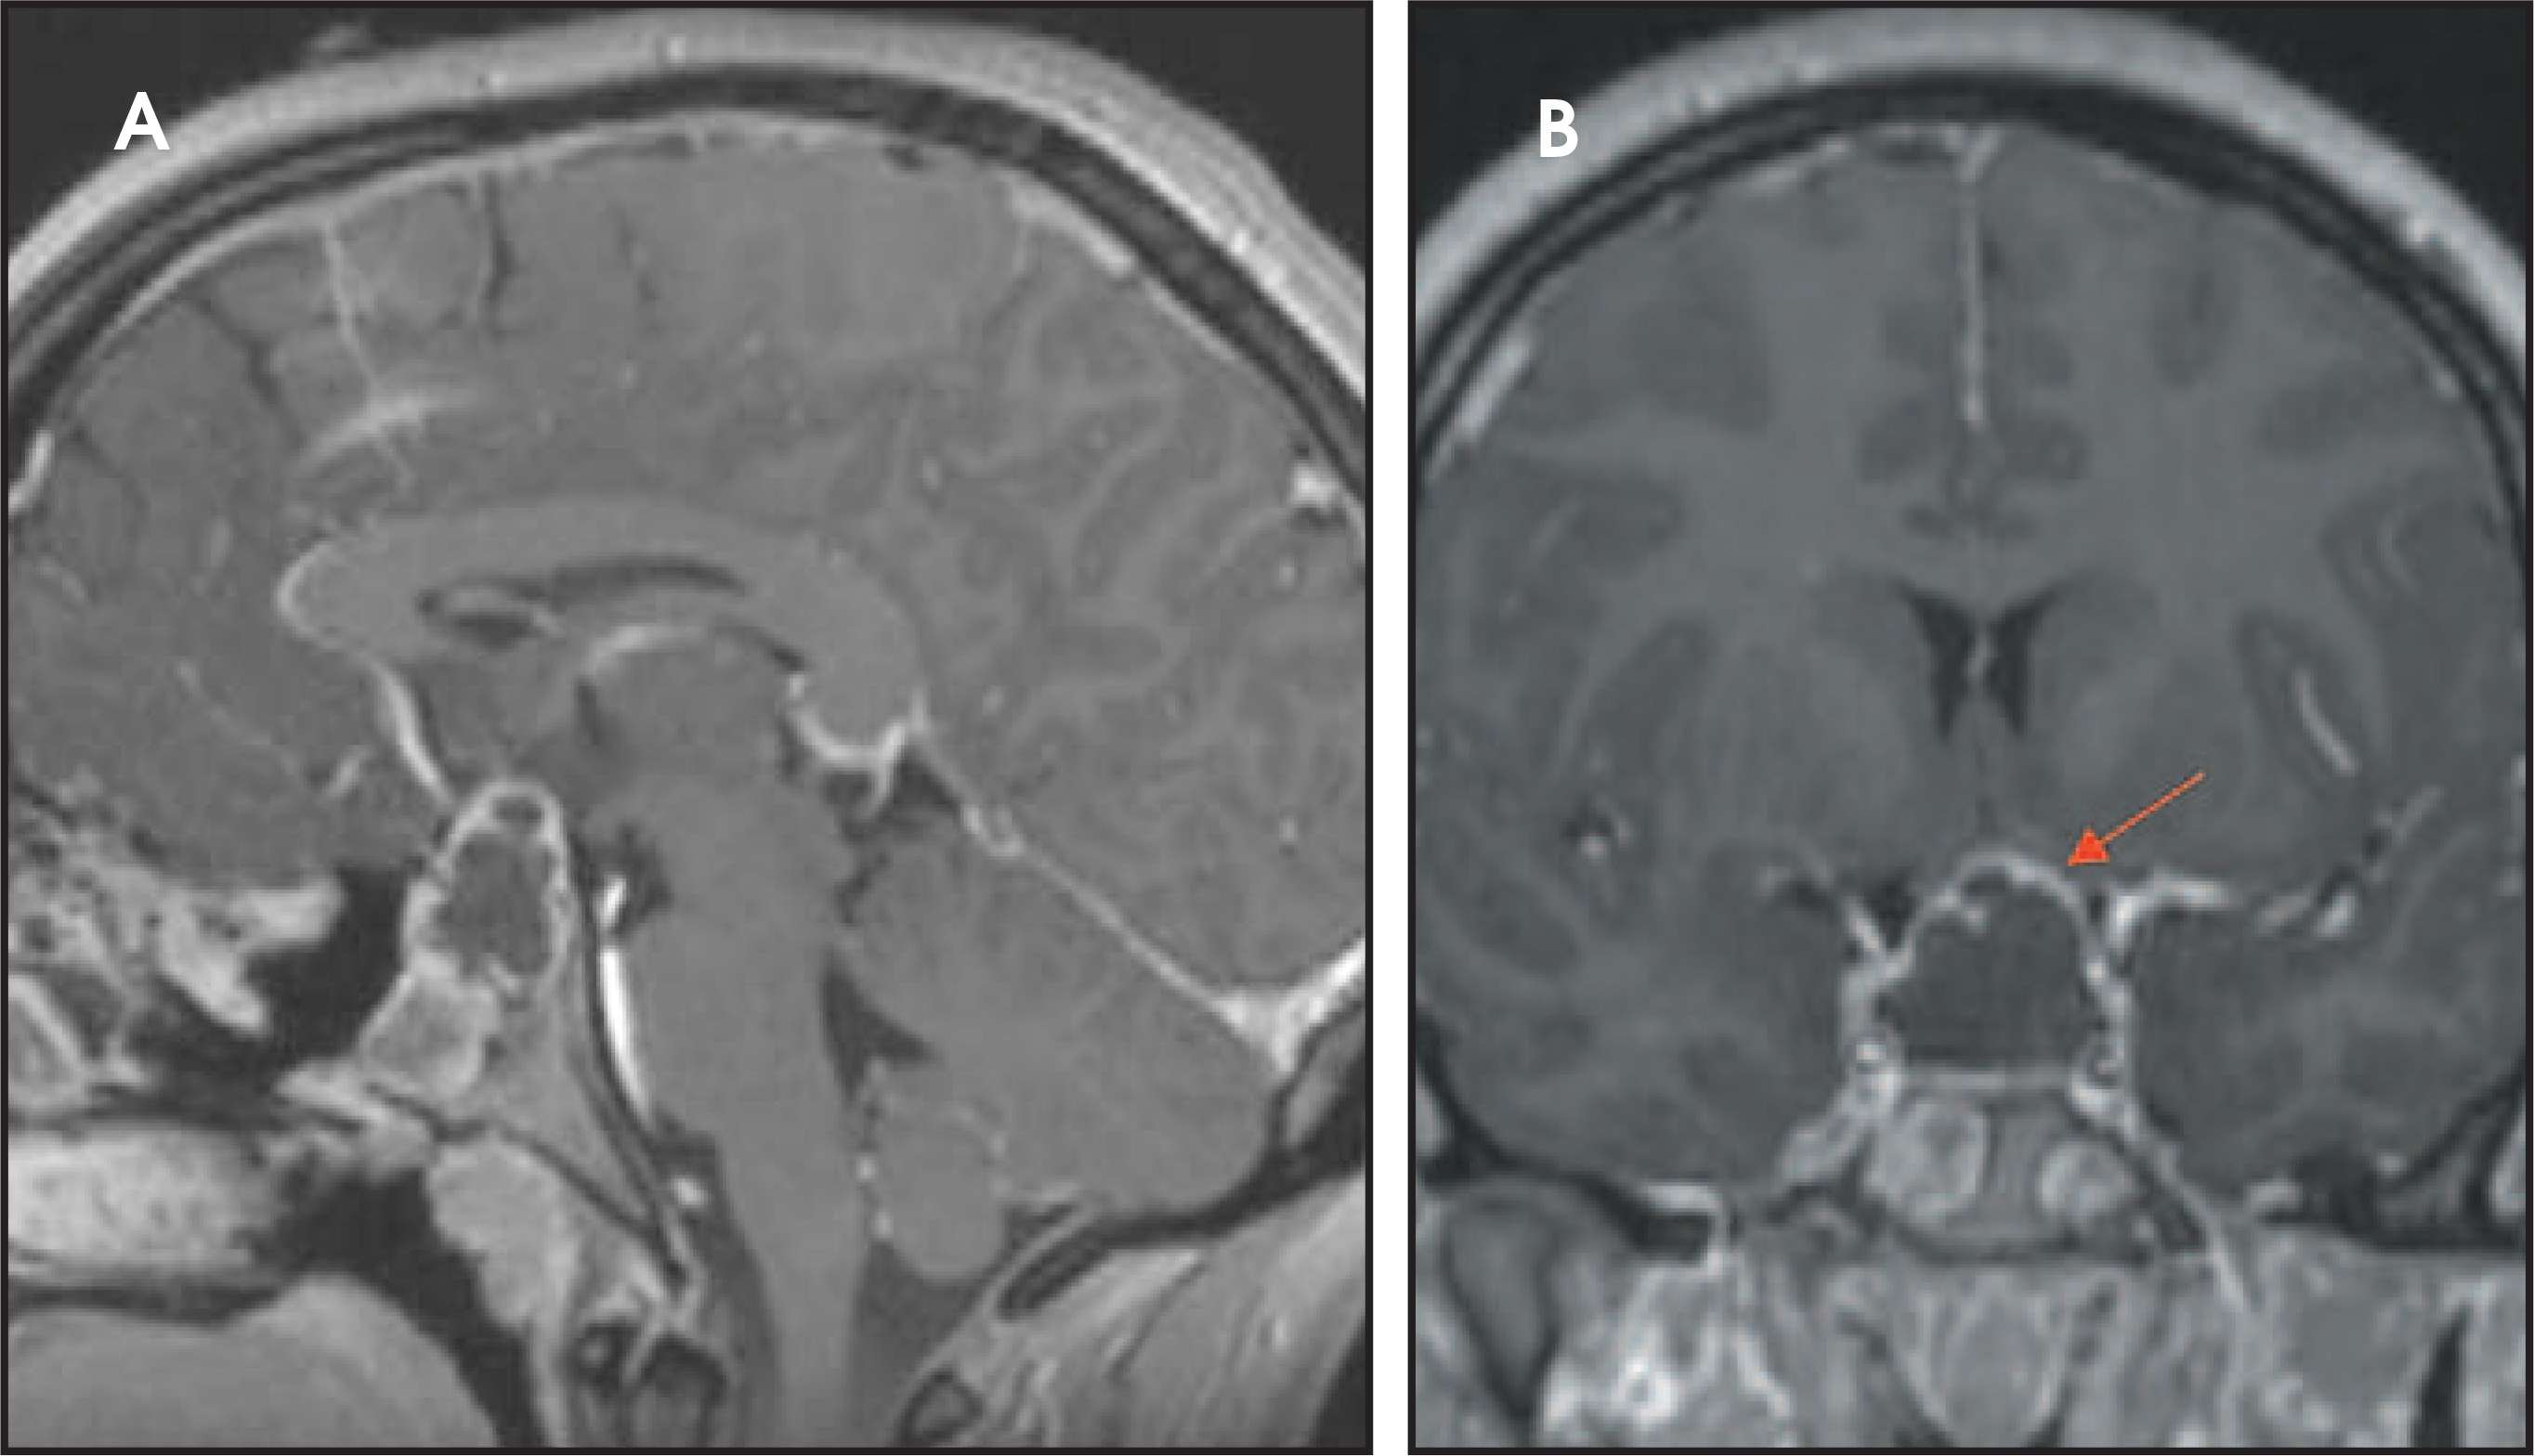
Pituitary abscesses can occur as sequelae of sepsis, extension of sinusitis, sphenoid osteomyelitis, cavernous sinus thrombophlebitis and meningitis. Infectious processes such as tuberculosis and fungal infection (Figure 18) may be spread in a hematogenous route or by direct extension.16 This can lead to brainstem infarction due to arteritis of the perforating vessels, pseudo-aneurysm of traversing vessels or leptomeningeal dissemination. Postoperative sellar abscess is a potential complication of transphenoidal surgery for pituitary macroadenoma resection (Figure 19).
Arachnoid cysts can occur in the suprasellar compartment and account for 1% of intracranial masses.1 These smoothly marginated lesions follow CSF imaging characteristics on CT and MRI. They may displace or compress the adjacent structures including the infundibulum, pituitary gland and third ventricle. (Figure 20).
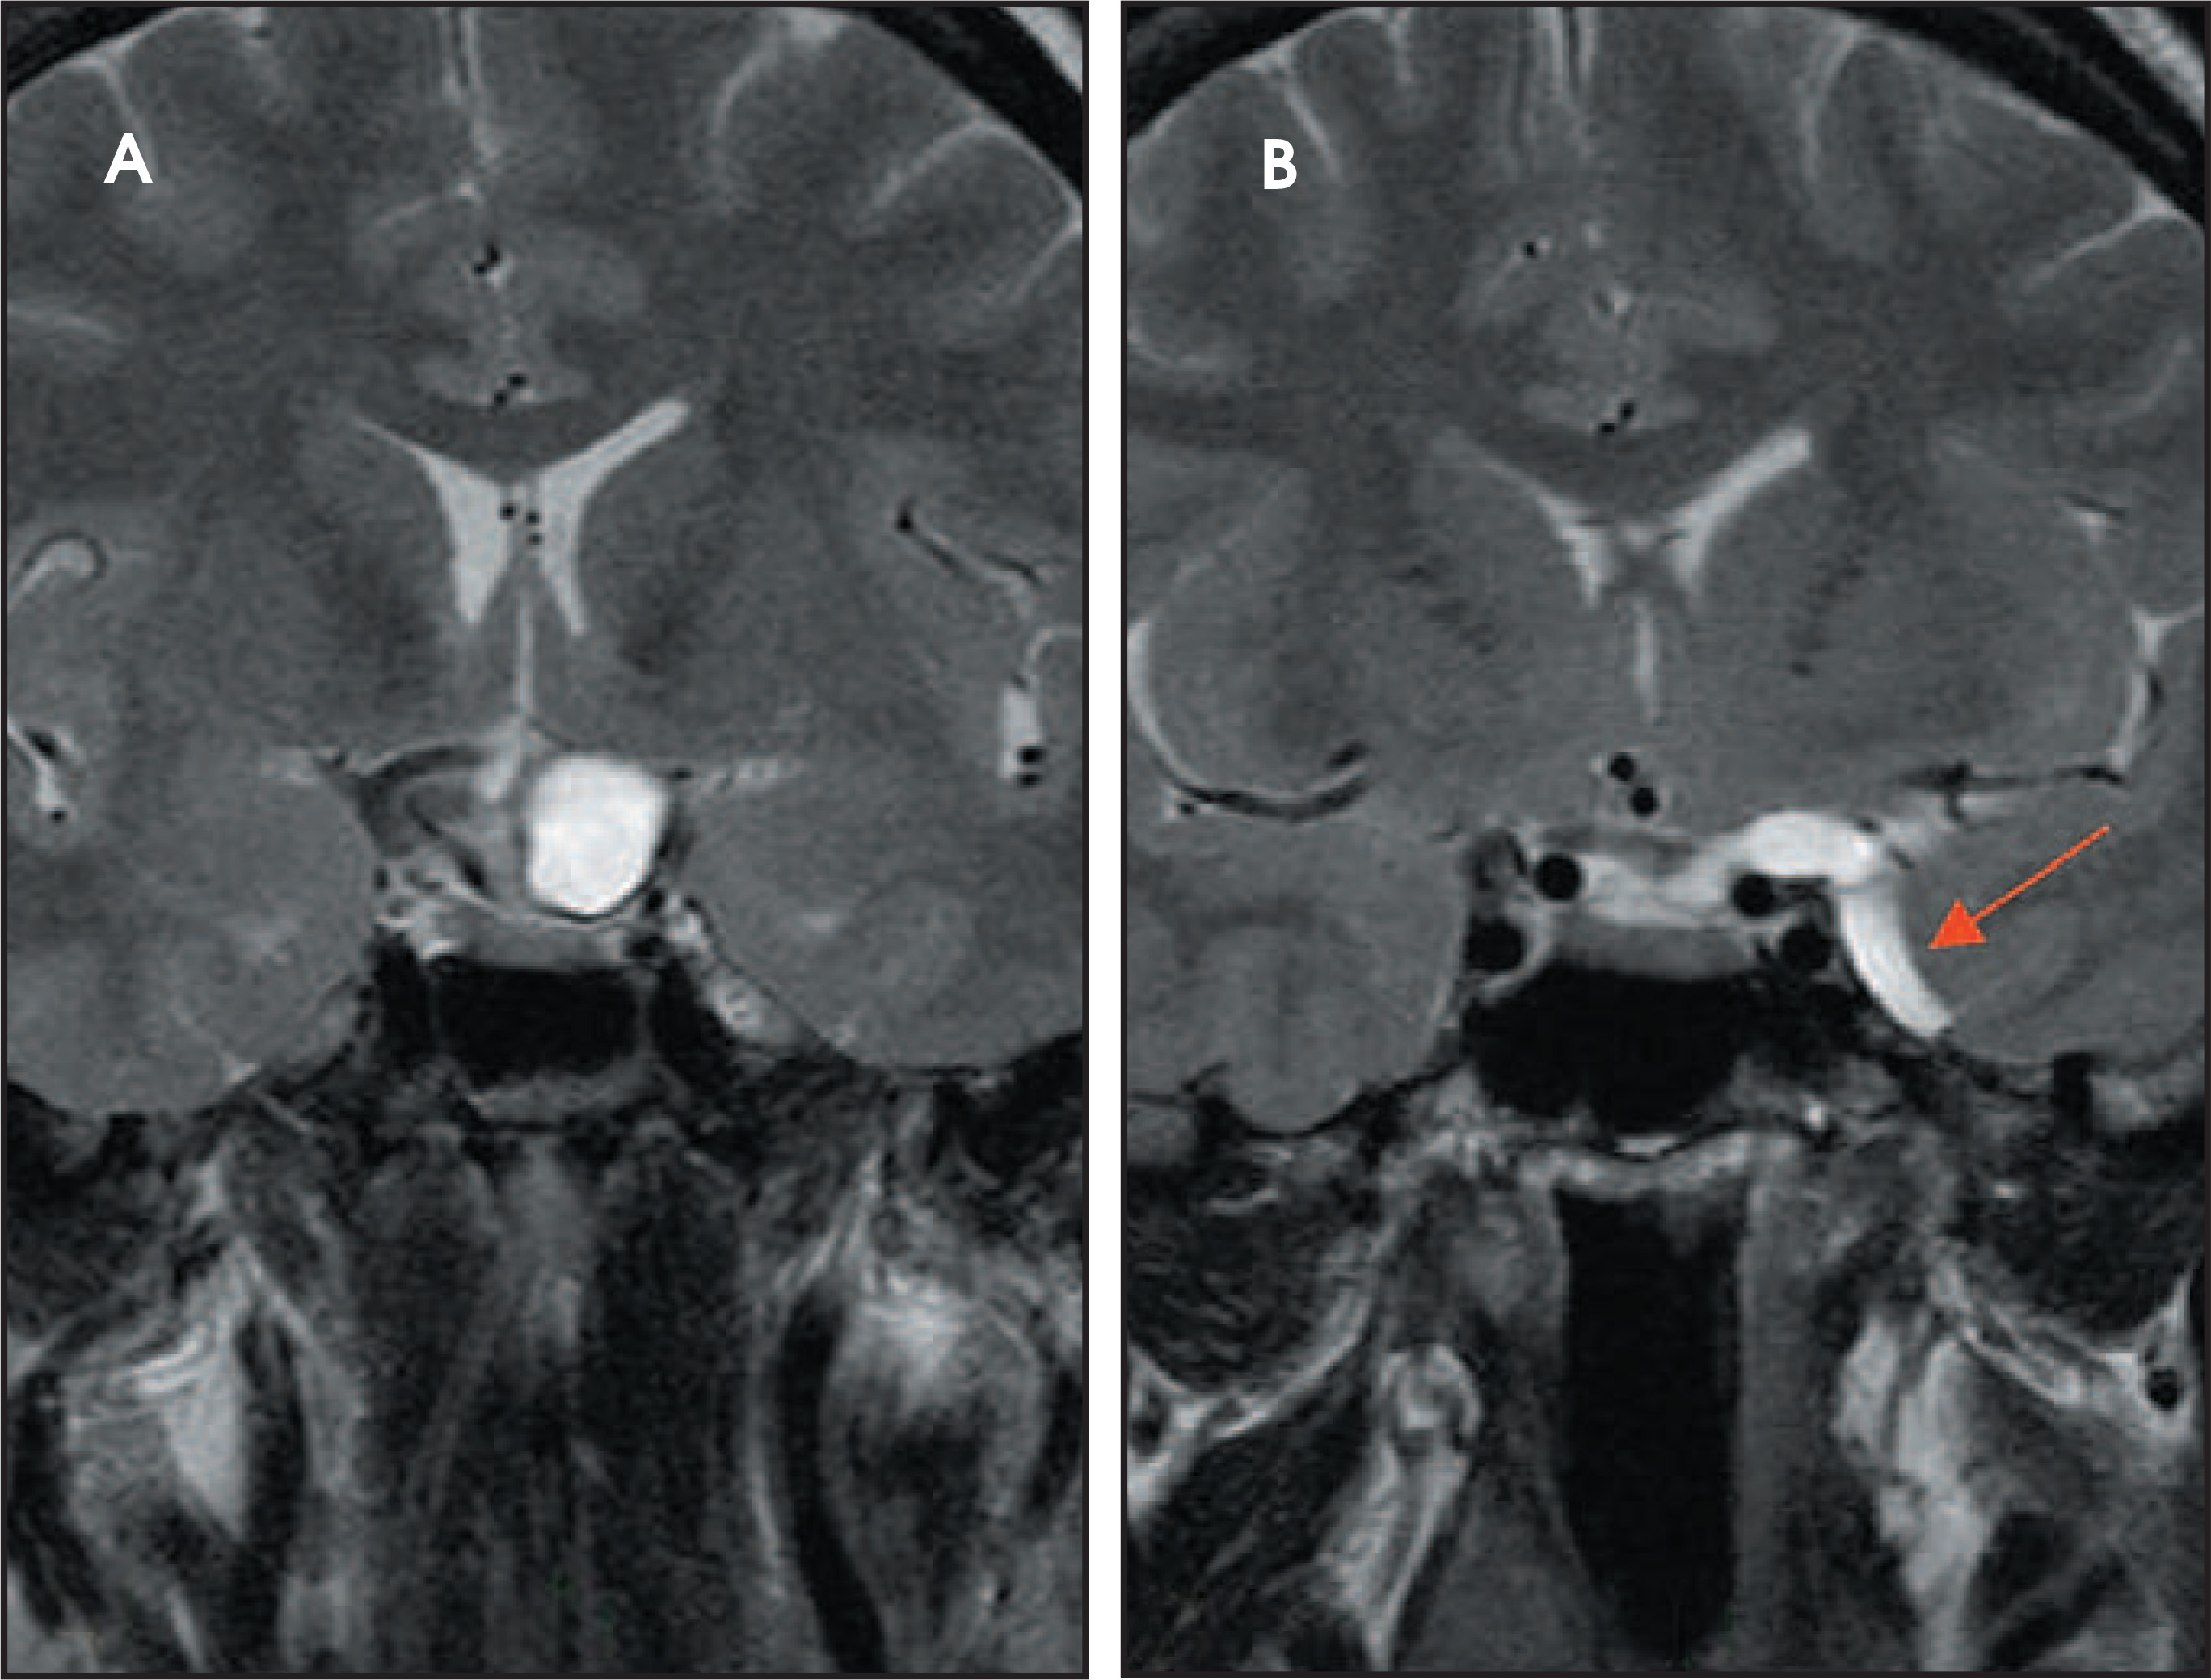
Hamartoma of the tuber cinereum (Figure 21) is a developmental heterotopia, which presents in childhood as precocious puberty and seizures (i.e. characteristic gelastic seizures). Abnormalities of the corpus callosum and optic tracts can be seen in these patients. These suprasellar masses are isodense on CT, isotense on T1-weighted MRI, and hyperintense and nonenhancing on T2-weighted MRI.
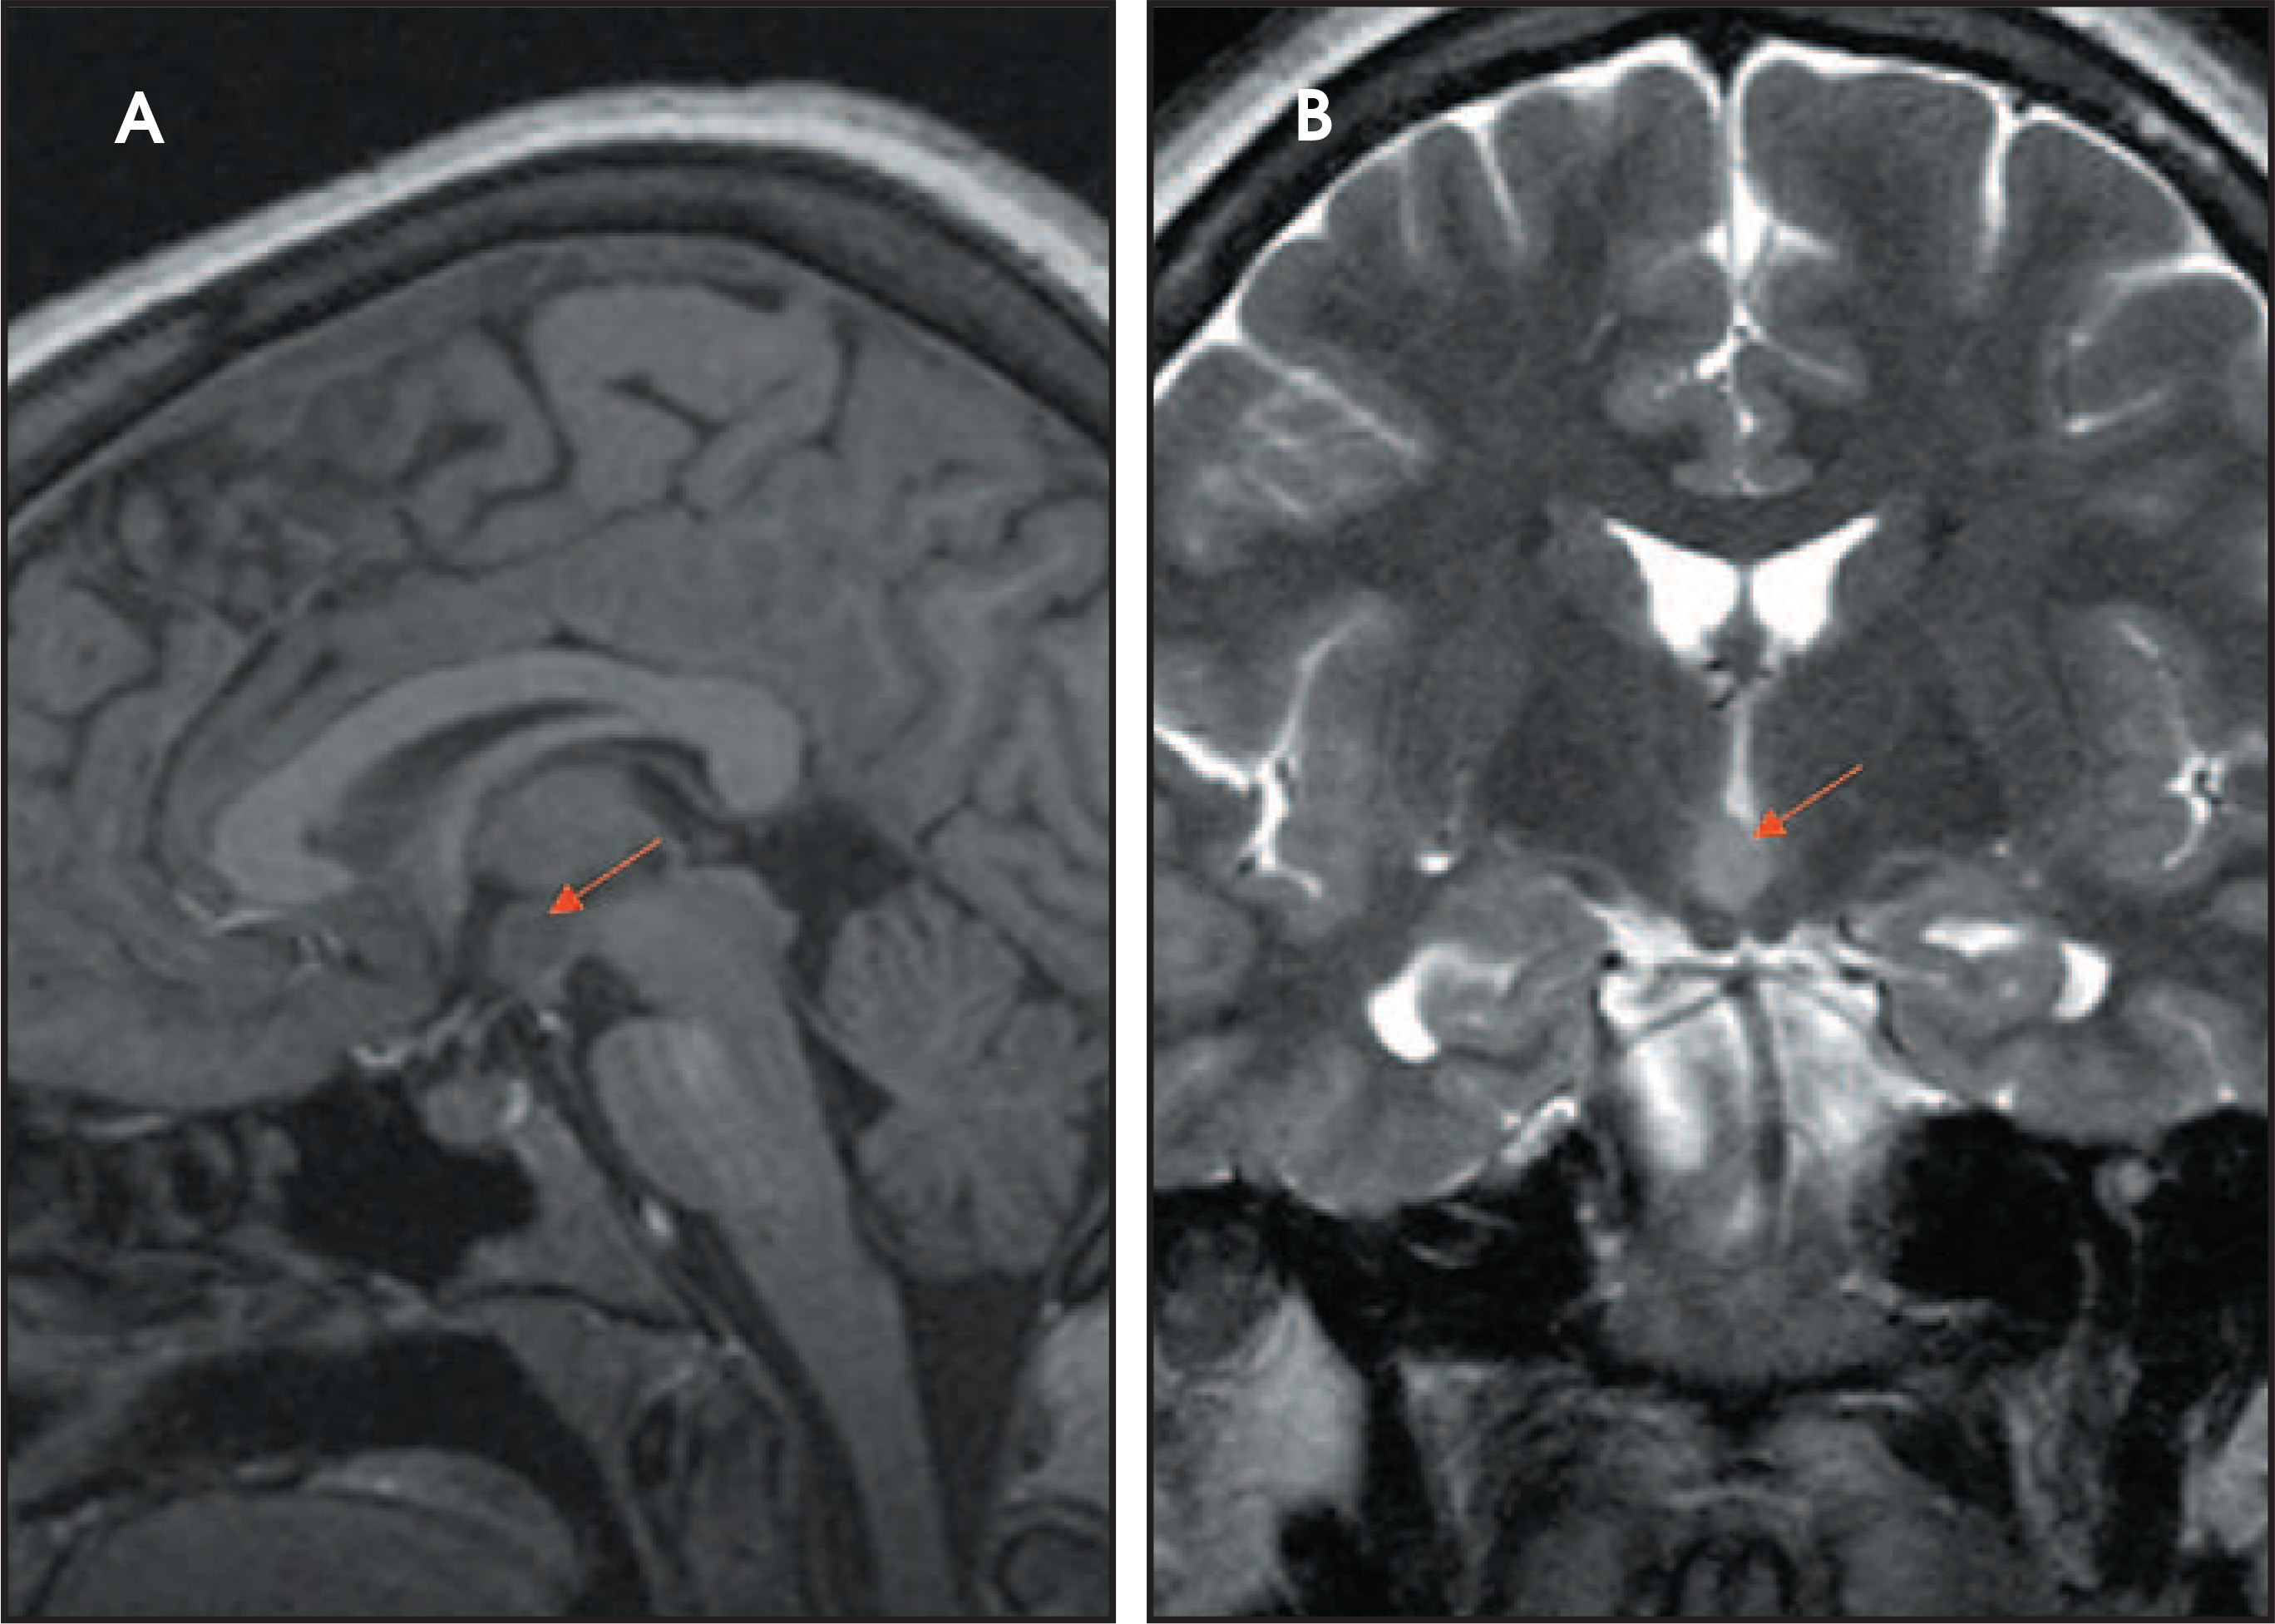
Other lesions involving the suprasellar cistern include epidermoid (Figure 22), teratoma and lipoma. Epidermoids can be differentiated from arachnoid cysts on fluid attenuated inversion recovery (FLAIR) and diffusion-weighted imaging as they tend to appear slightly hazy on the first sequence and bright on the latter. Mucocele of the sphenoid sinuses can extend into the suprasellar cisterns. Chiasmatic and hypothalamic gliomas (Figure 23) are seen predominantly in the first decade of life and 20-50% of these patients have neurofibromatosis I.1 These lesions may be difficult to distinguish from hypothalamic astrocytomas or gangliogliomas. They demonstrate variable enhancement and appear T1 hypointense and T2 hyperintense; this signal intensity can extend along the optic tracts.
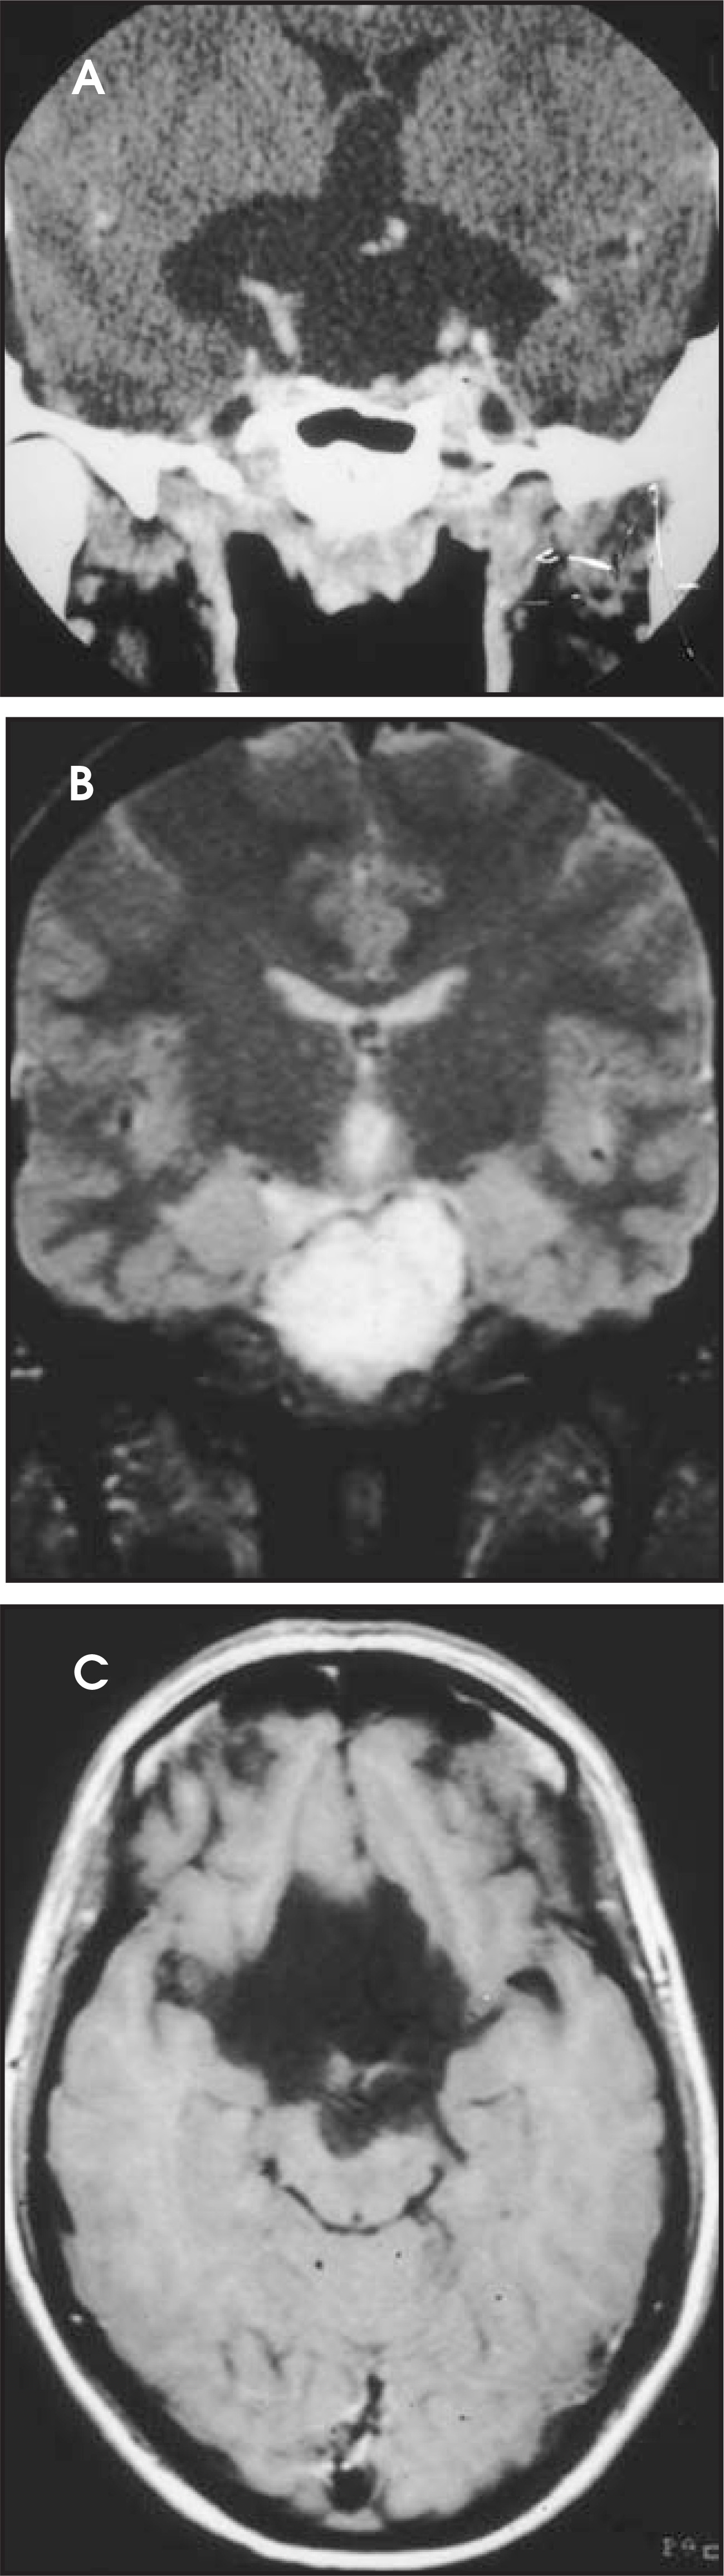
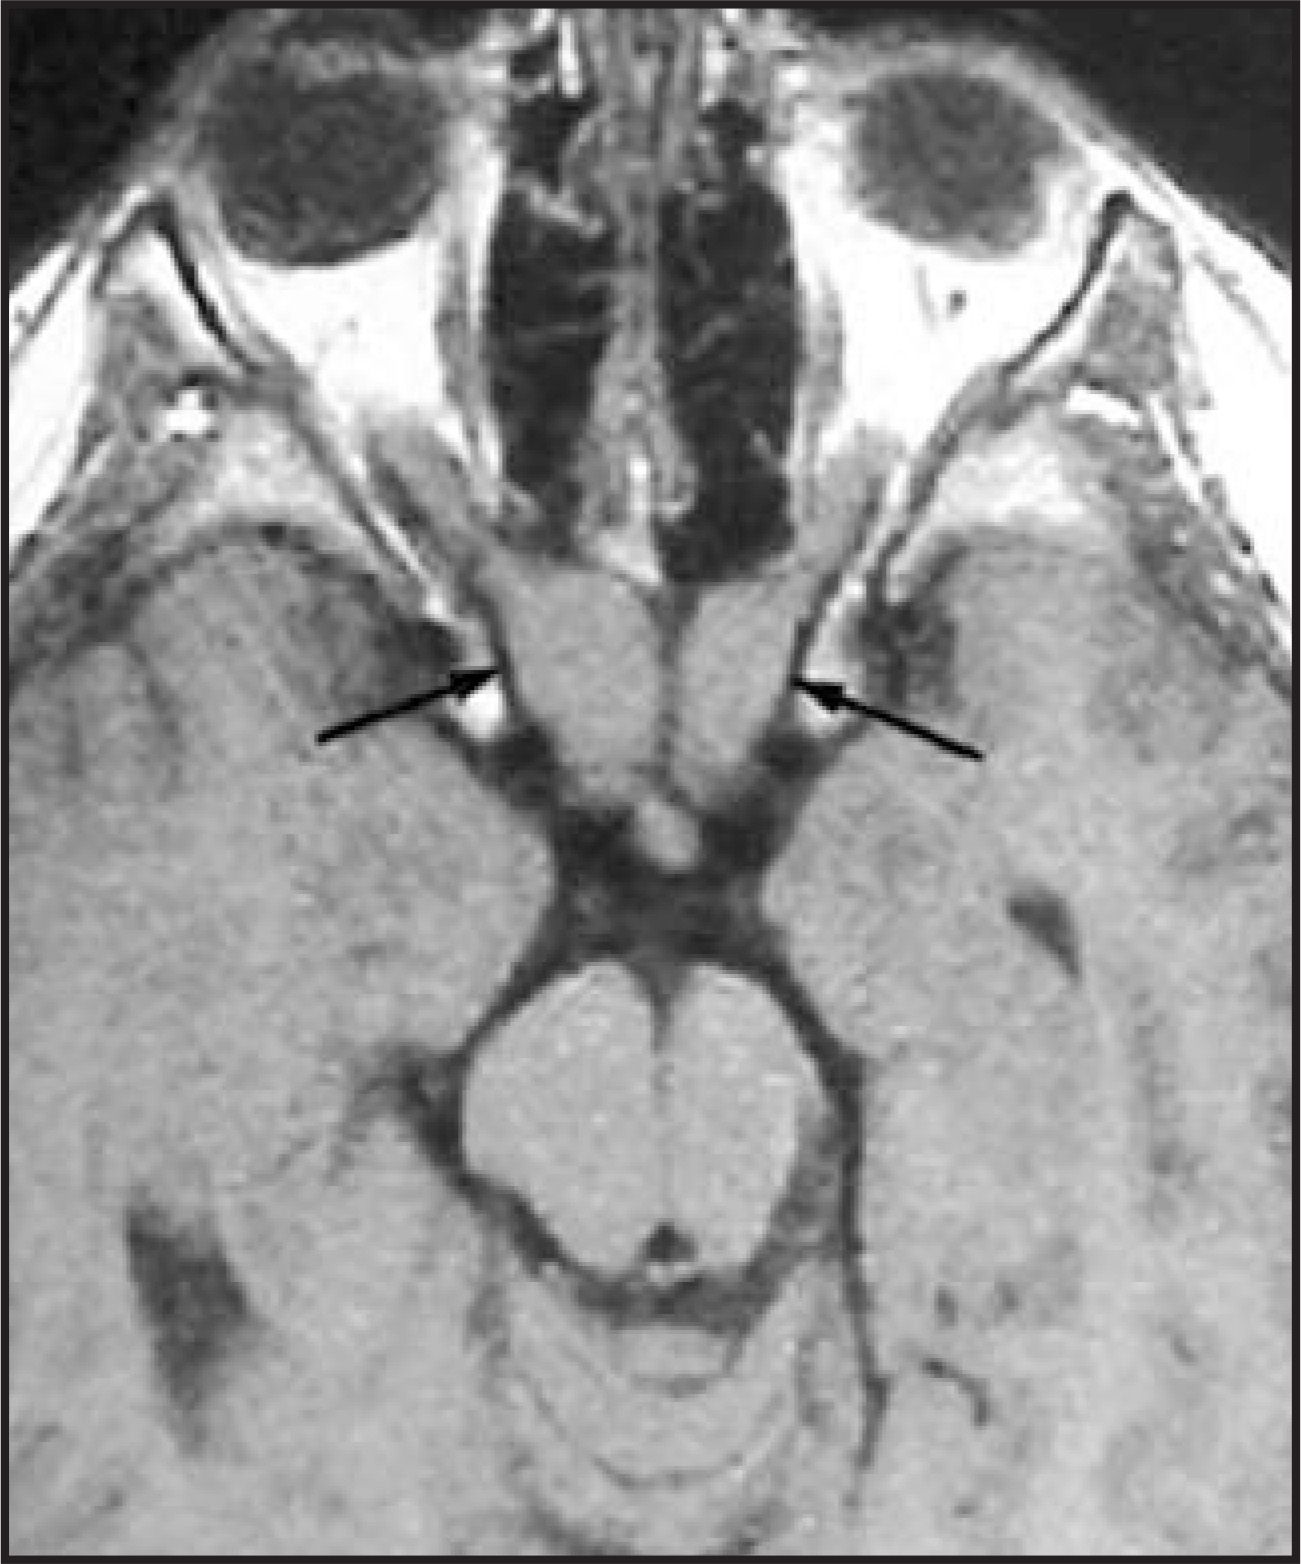
Vascular lesions such as aneurysms and cavernous carotid fistula (Figure 24) and cavernous sinus thrombosis or thrombophlebitis can be seen in the cavernous sinus region. Aneurysms can produce mass effect on the intracavernous cranial nerves. Rupture of aneurysms of the cavernous segment of the internal carotid arteries can result in cavernous-carotid fistulas. Paramedian internal carotid aneurysms can mimic an intrasellar aneurysm and cause mass effect on the pituitary gland.
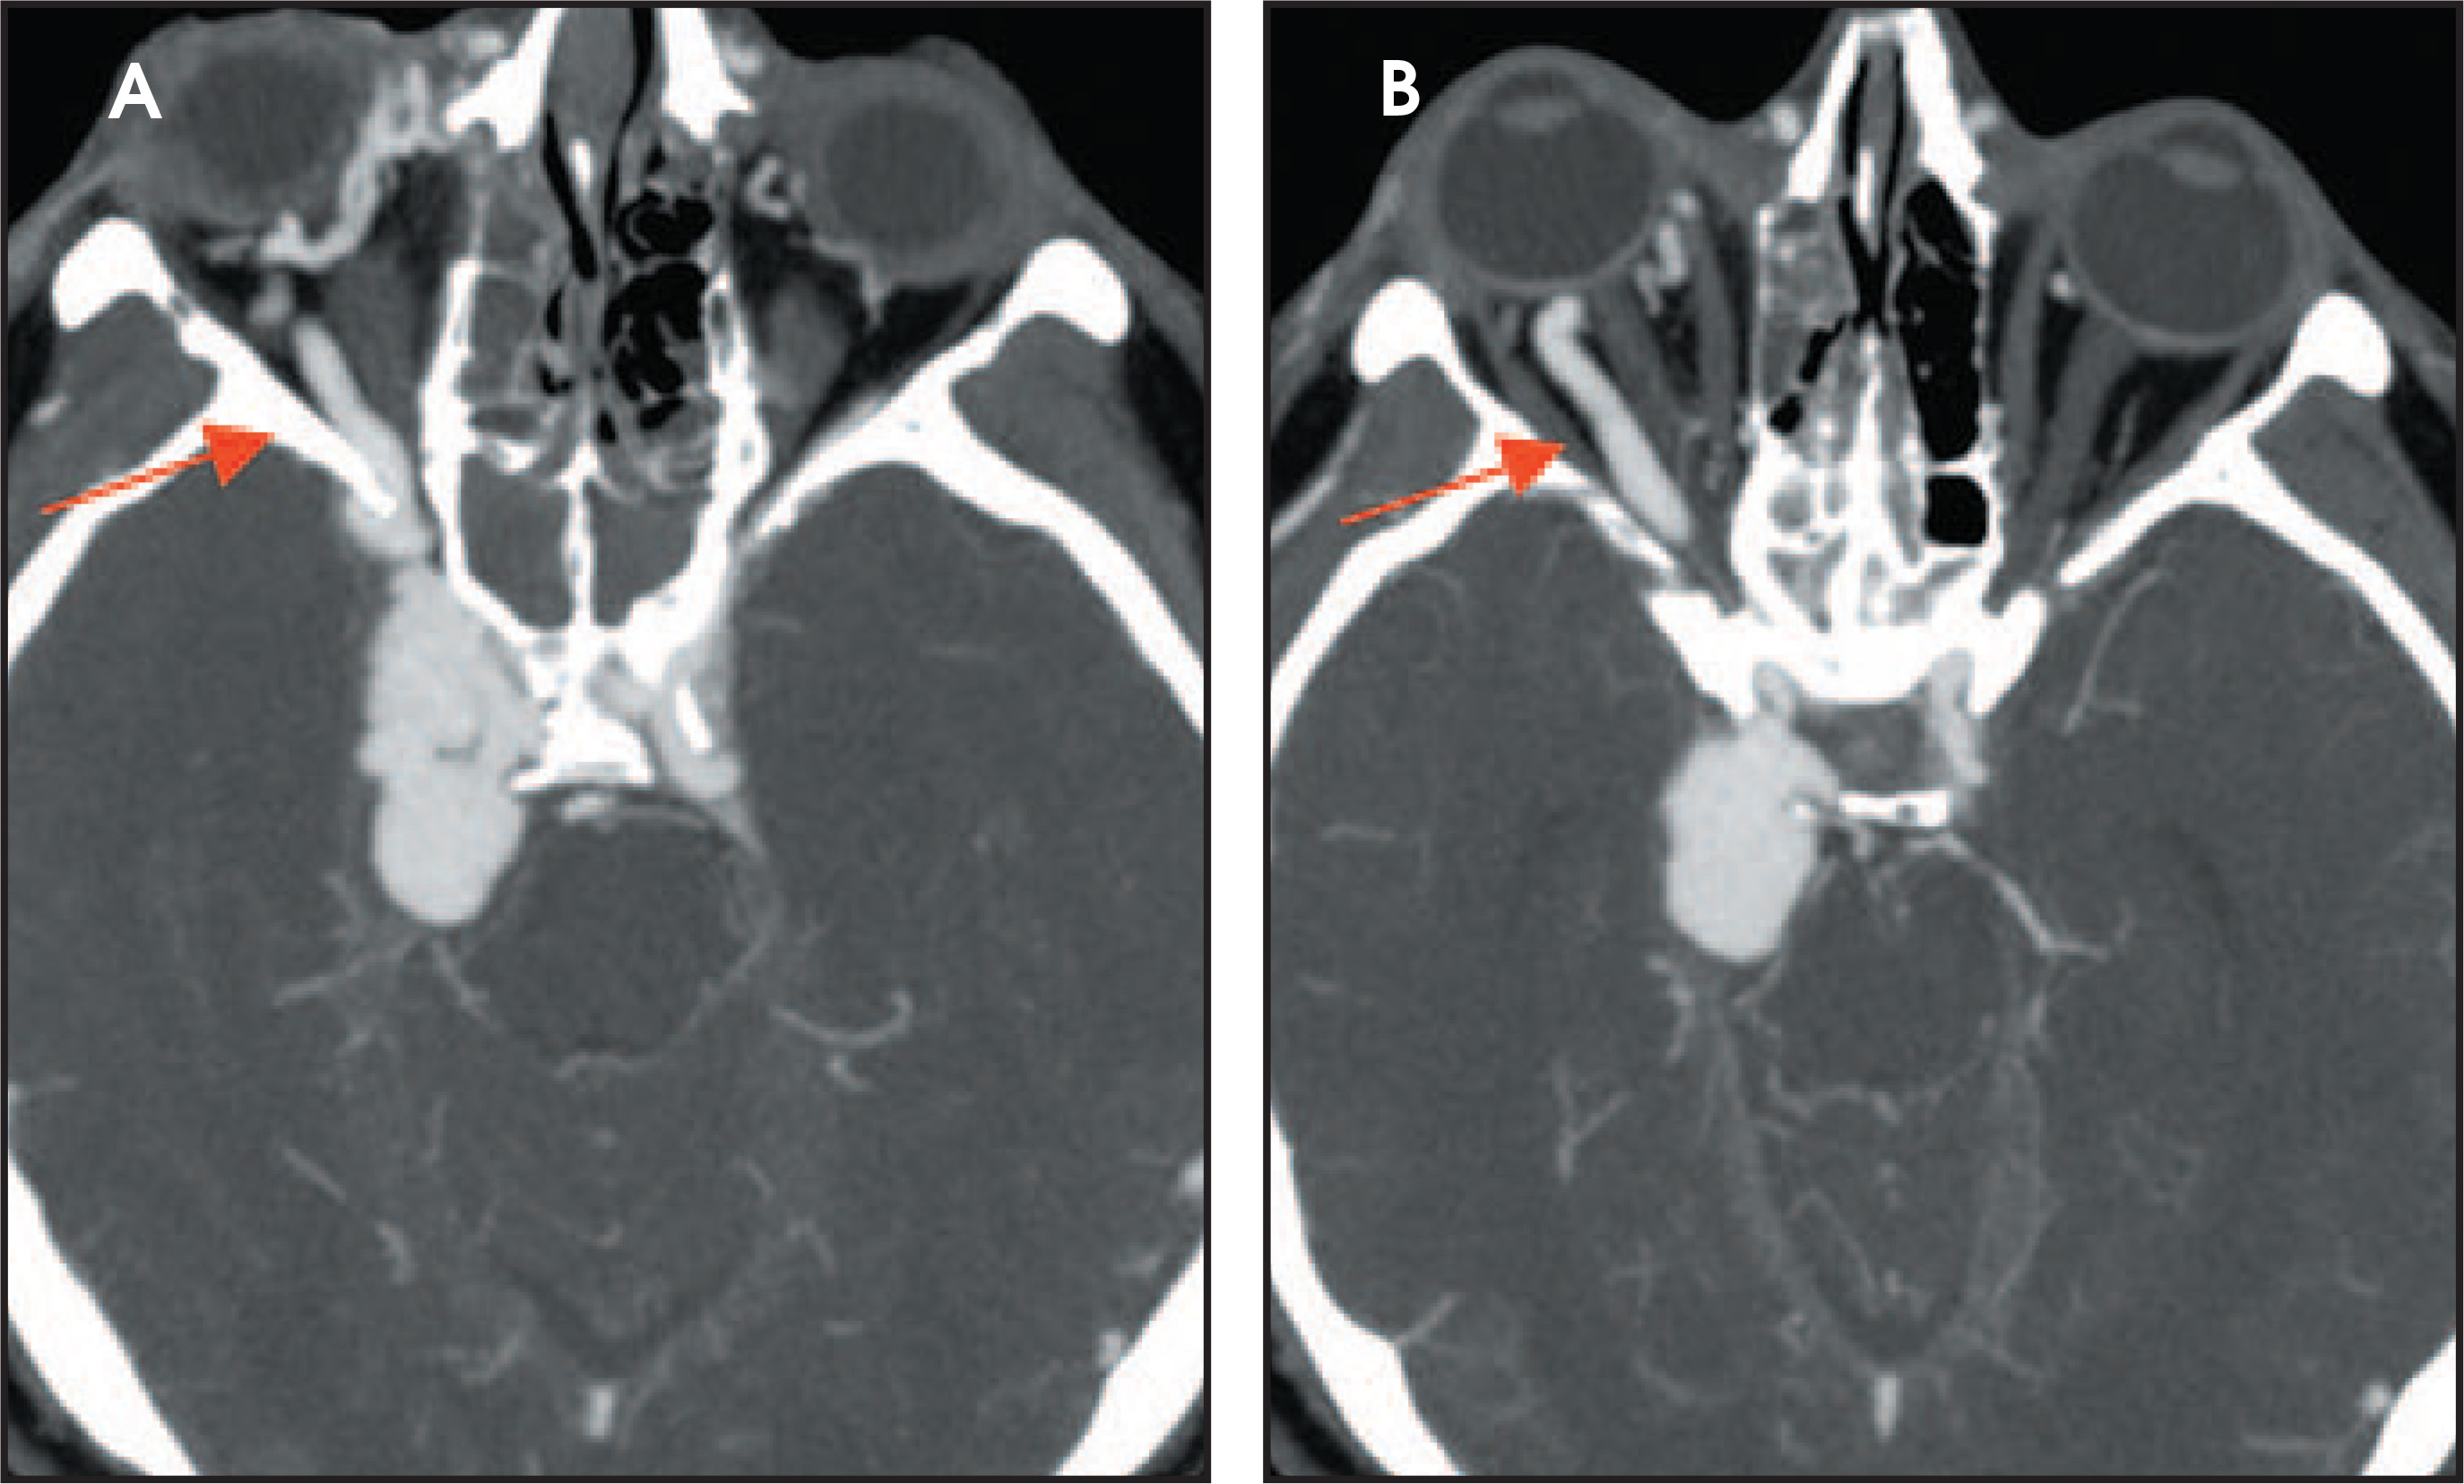
Meningiomas in this region can narrow the adjacent internal carotid artery. Schwannomas of the trigeminal nerve are more common than those originating from cranial nerves III, IV and VI.
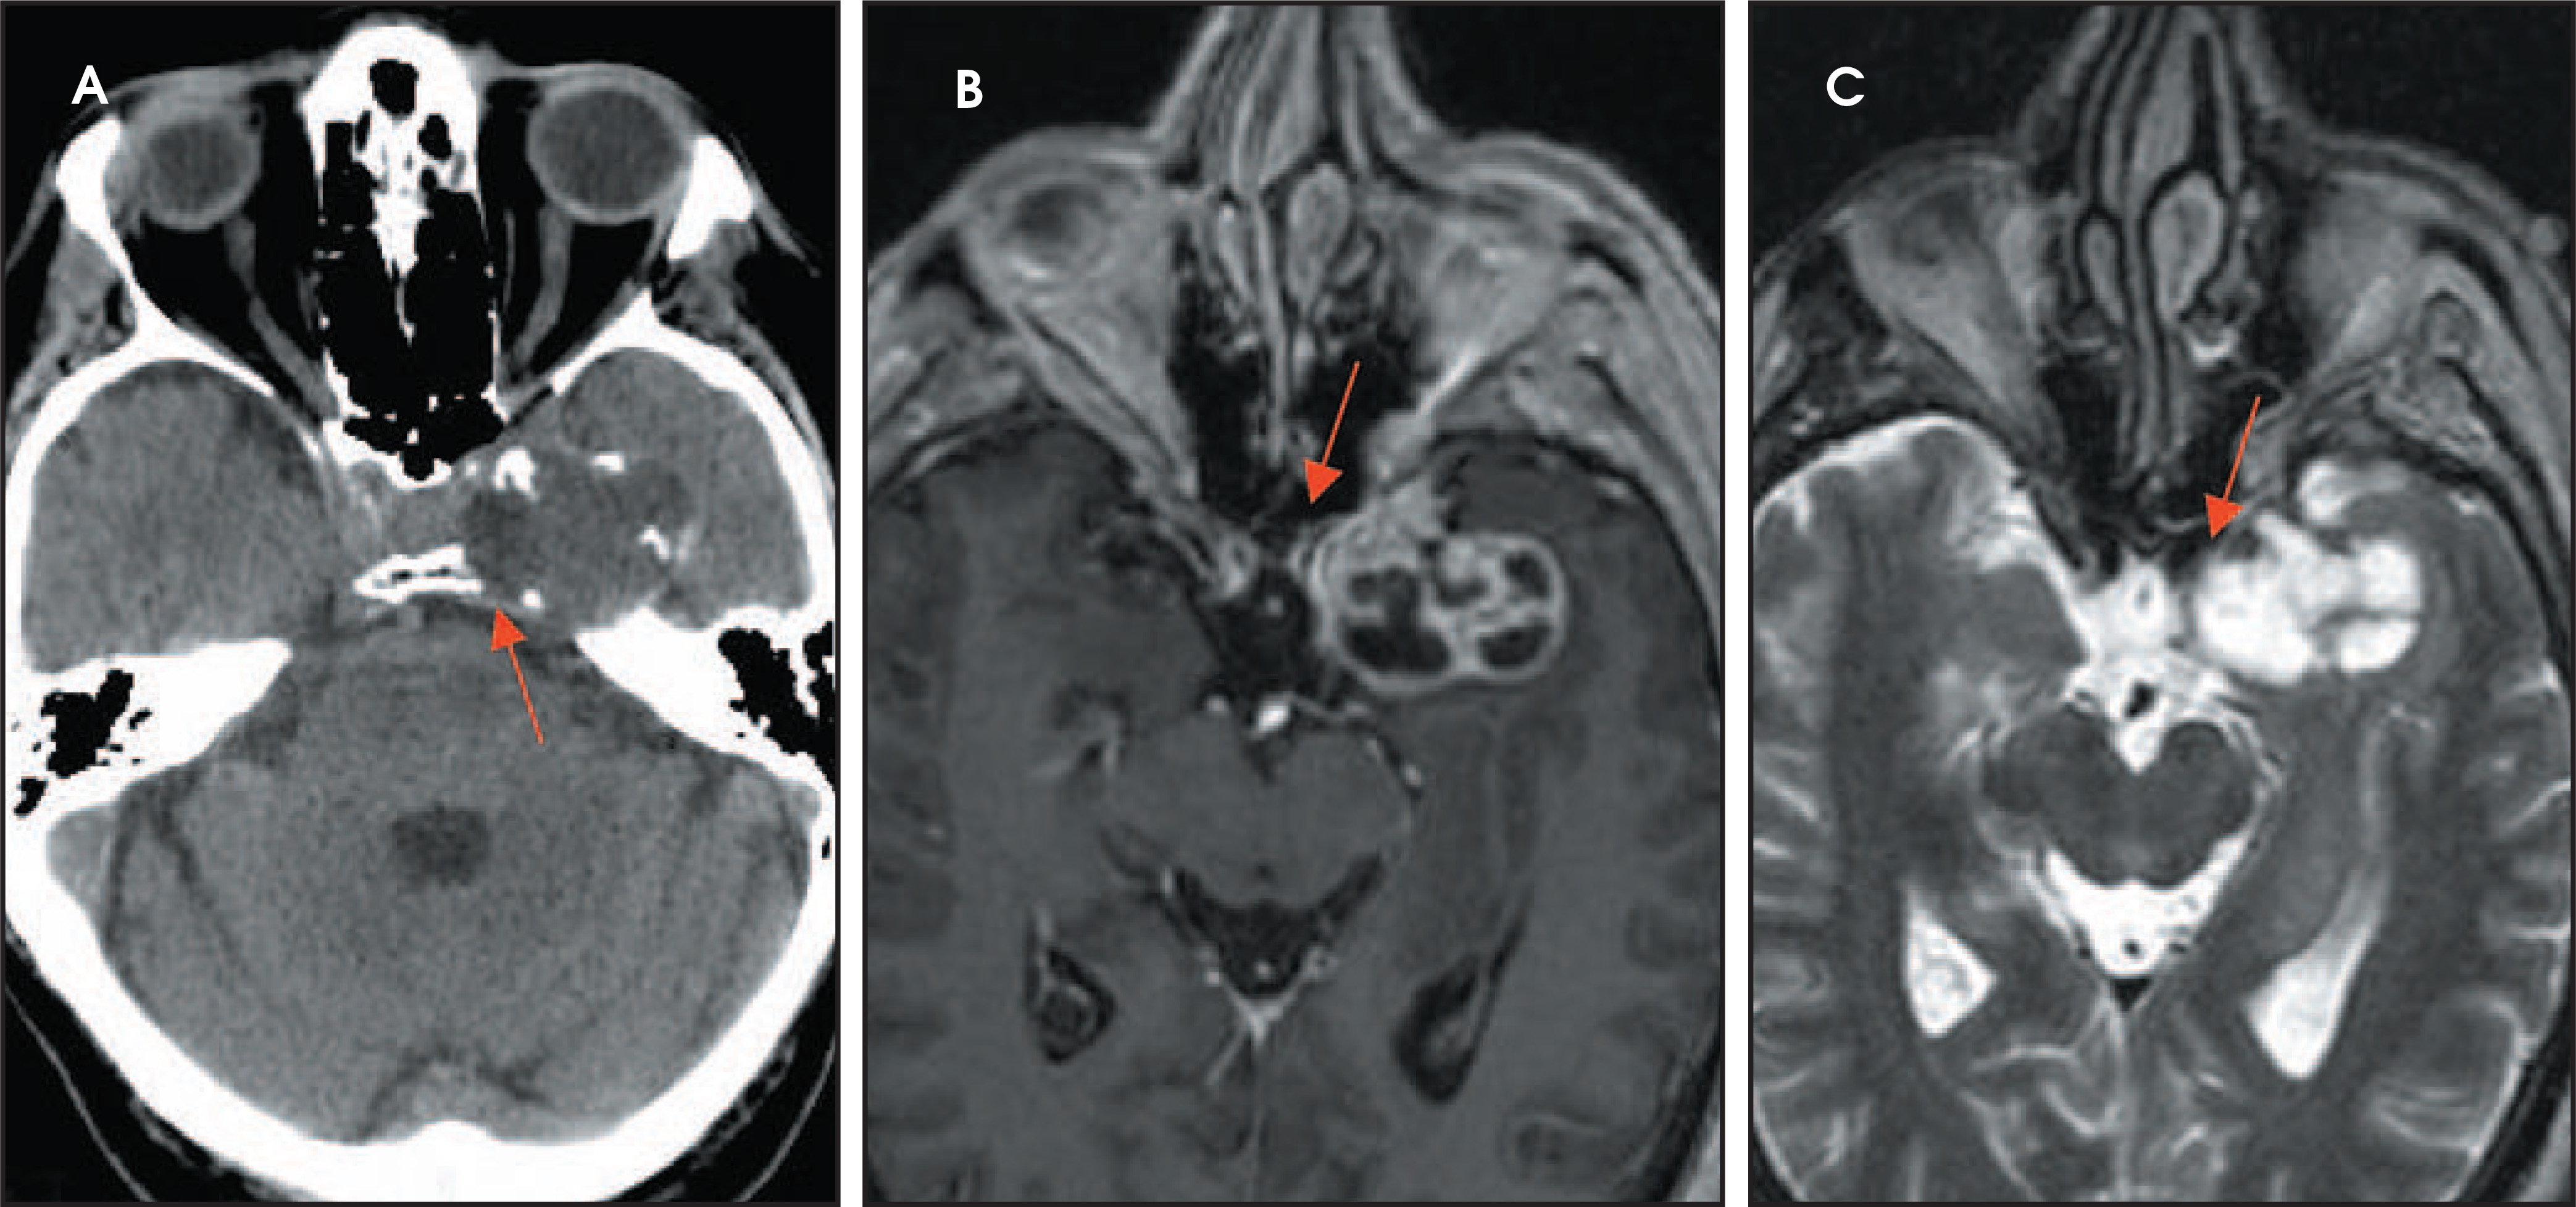
Osteocartilagenous tumors (Figure 25) arising from the basicranium can extend into the cavernous sinus or suprasellar region.
Conclusion
The sellar and parasellar regions hold complex neurovascular structures. Understanding the anatomy can help in developing a differential diagnosis and in correlating the clinical manifestations.
References
- Osborn A, Blaser S, Salzman K. Diagnostic Imaging: Brain. 2004.
- Zagardo M, Cail W, Kelman S, Rothman M. Reversible empty sella in idiopathic intracranial hypertension: An indicator of successful therapy?. AJNR Am J Neuroradiol. 1996;17:1953-1956.
- Swanson J, Sherman B, Van Gilder J, Chapler F. Coexistent empty sella and prolactin-secreting micoradenoma. Obstet Gynecol. 1979;53:258-263.
- Shimono T, Hatabu H, Kasagi K. Rapid progression of pituitary hyperplasia in humans with primary hypothyroidism: Demonstration with MR imaging. Radiology. 1999;213(2):383-388.
- Connor S, Penney C. MRI in the differential diagnosis of a sellar mass. Clin Radiol. 2003;58(1):20-31.
- FitzPatrick M, Tartaglino L, Hollander M. Imaging of sellar and parasellar pathology. Radiol Clin North Am. 1999;37(1):101-121.
- Friedman T, Zuckerbraun E, Lee M. Dynamic pituitary MRI has high sensitivity and specificity for the diagnosis of mild Cushing's syndrome and should be part of theinitial workup. Horm Metab Res. 2007;39(6):451-456.
- Simonetta A. Imaging of suprasellar and parasellar tumors. Neuroimaging Clin N Am. 1999;9(4):717-732.
- Knosp E, Steiner E, Kitz K, Matula C. Pituitary adenomas with invasion of the cavernous space: A magnetic resonance imaging classification compared with surgical findings. Neurosurgery. 1993;33(4):610-618.
- Sartoretti-Schefer S, Wichmann W, Aguzzi A, Valavanis A. MR differentitatiation of adamantinousand squamous-papillary craniopharyngiomas. AJNR Am J Neuroradiol. 1997;18(1):77-87.
- Hamilton B, Salzman K, Osborn A. Anatomic and pathologic spectrum of pituitary infundibulum lesions. AJR Am J Roentgenol. 2007;188(3):W223-232.
- Prayer D, Grois N, Prosch H. MR imaging presentation of intracranial disease associated with Langerhans cell histiocytosis. AJNR Am J Neuroradiol. 2004;25(5):880-891.
- Schubiger O, Haller D. Metastases to the pituitary—hypothalamic axis: An MR study of 7 symptomatic patients. Neuroradiology. 1992;34(2):131-134.
- Vijayanand P, Mahadevan S, So Shivbalan. Pituitary stalk interruption syndrome (PSIS). Indian J Pediatr. 2007;74(9):874-875.
- Quencer R. Lymphocytic adenohypophysitis: Autoimmune disorder of the pituitary gland. AJNR Am J. Neuroradiol. 1980;1(4):343-345.
- Grossman R, Yousem D. Neuroradiology: The Requisites. 2003.
Citation
. Imaging sellar and suprasellar pathology. Applied Radiology. 2009;38(4):9-21. doi:10.37549/AR1686.