Intestinal mural stratification: Etiopathology, etiology, and the extreme
Applied Radiology — Vol. 30 , Issue 9 , pp. 33 -45
DOI: 10.37549/AR1035
Published: September 1, 2001
Categories
An all-encompassing term, “mural stratification” means simply the abnormal separation of the contrast-enhancing outer gut margin (serosa/muscularis propria) from the contrast-enhancing inner gut margin (mucosa/muscularis mucosa) (figure 1). Normally not distinguishable, these two enhancing, concentric rings can be made visible by interposing blood, pus, water, cells, or fat. Although a very sensitive sign of gut abnormality, this radiographic finding is nonspecific. One must be aware that this nonspecific appearance may have different clinical implications depending on the disease process with which it is associated. For example, with gut ischemia, its presence suggests a surgical, as opposed to a medical, approach. With idiopathic inflammatory bowel disease, its presence indicates medical, as opposed to surgical, management. It is important to learn of the many diseases that can present with mural stratification and to be able to categorize them by their underlying cause for intestinal wall thickening. The pathophysiology of such thickening is the key to suggesting the clinical management of this finding in any particular disease setting.
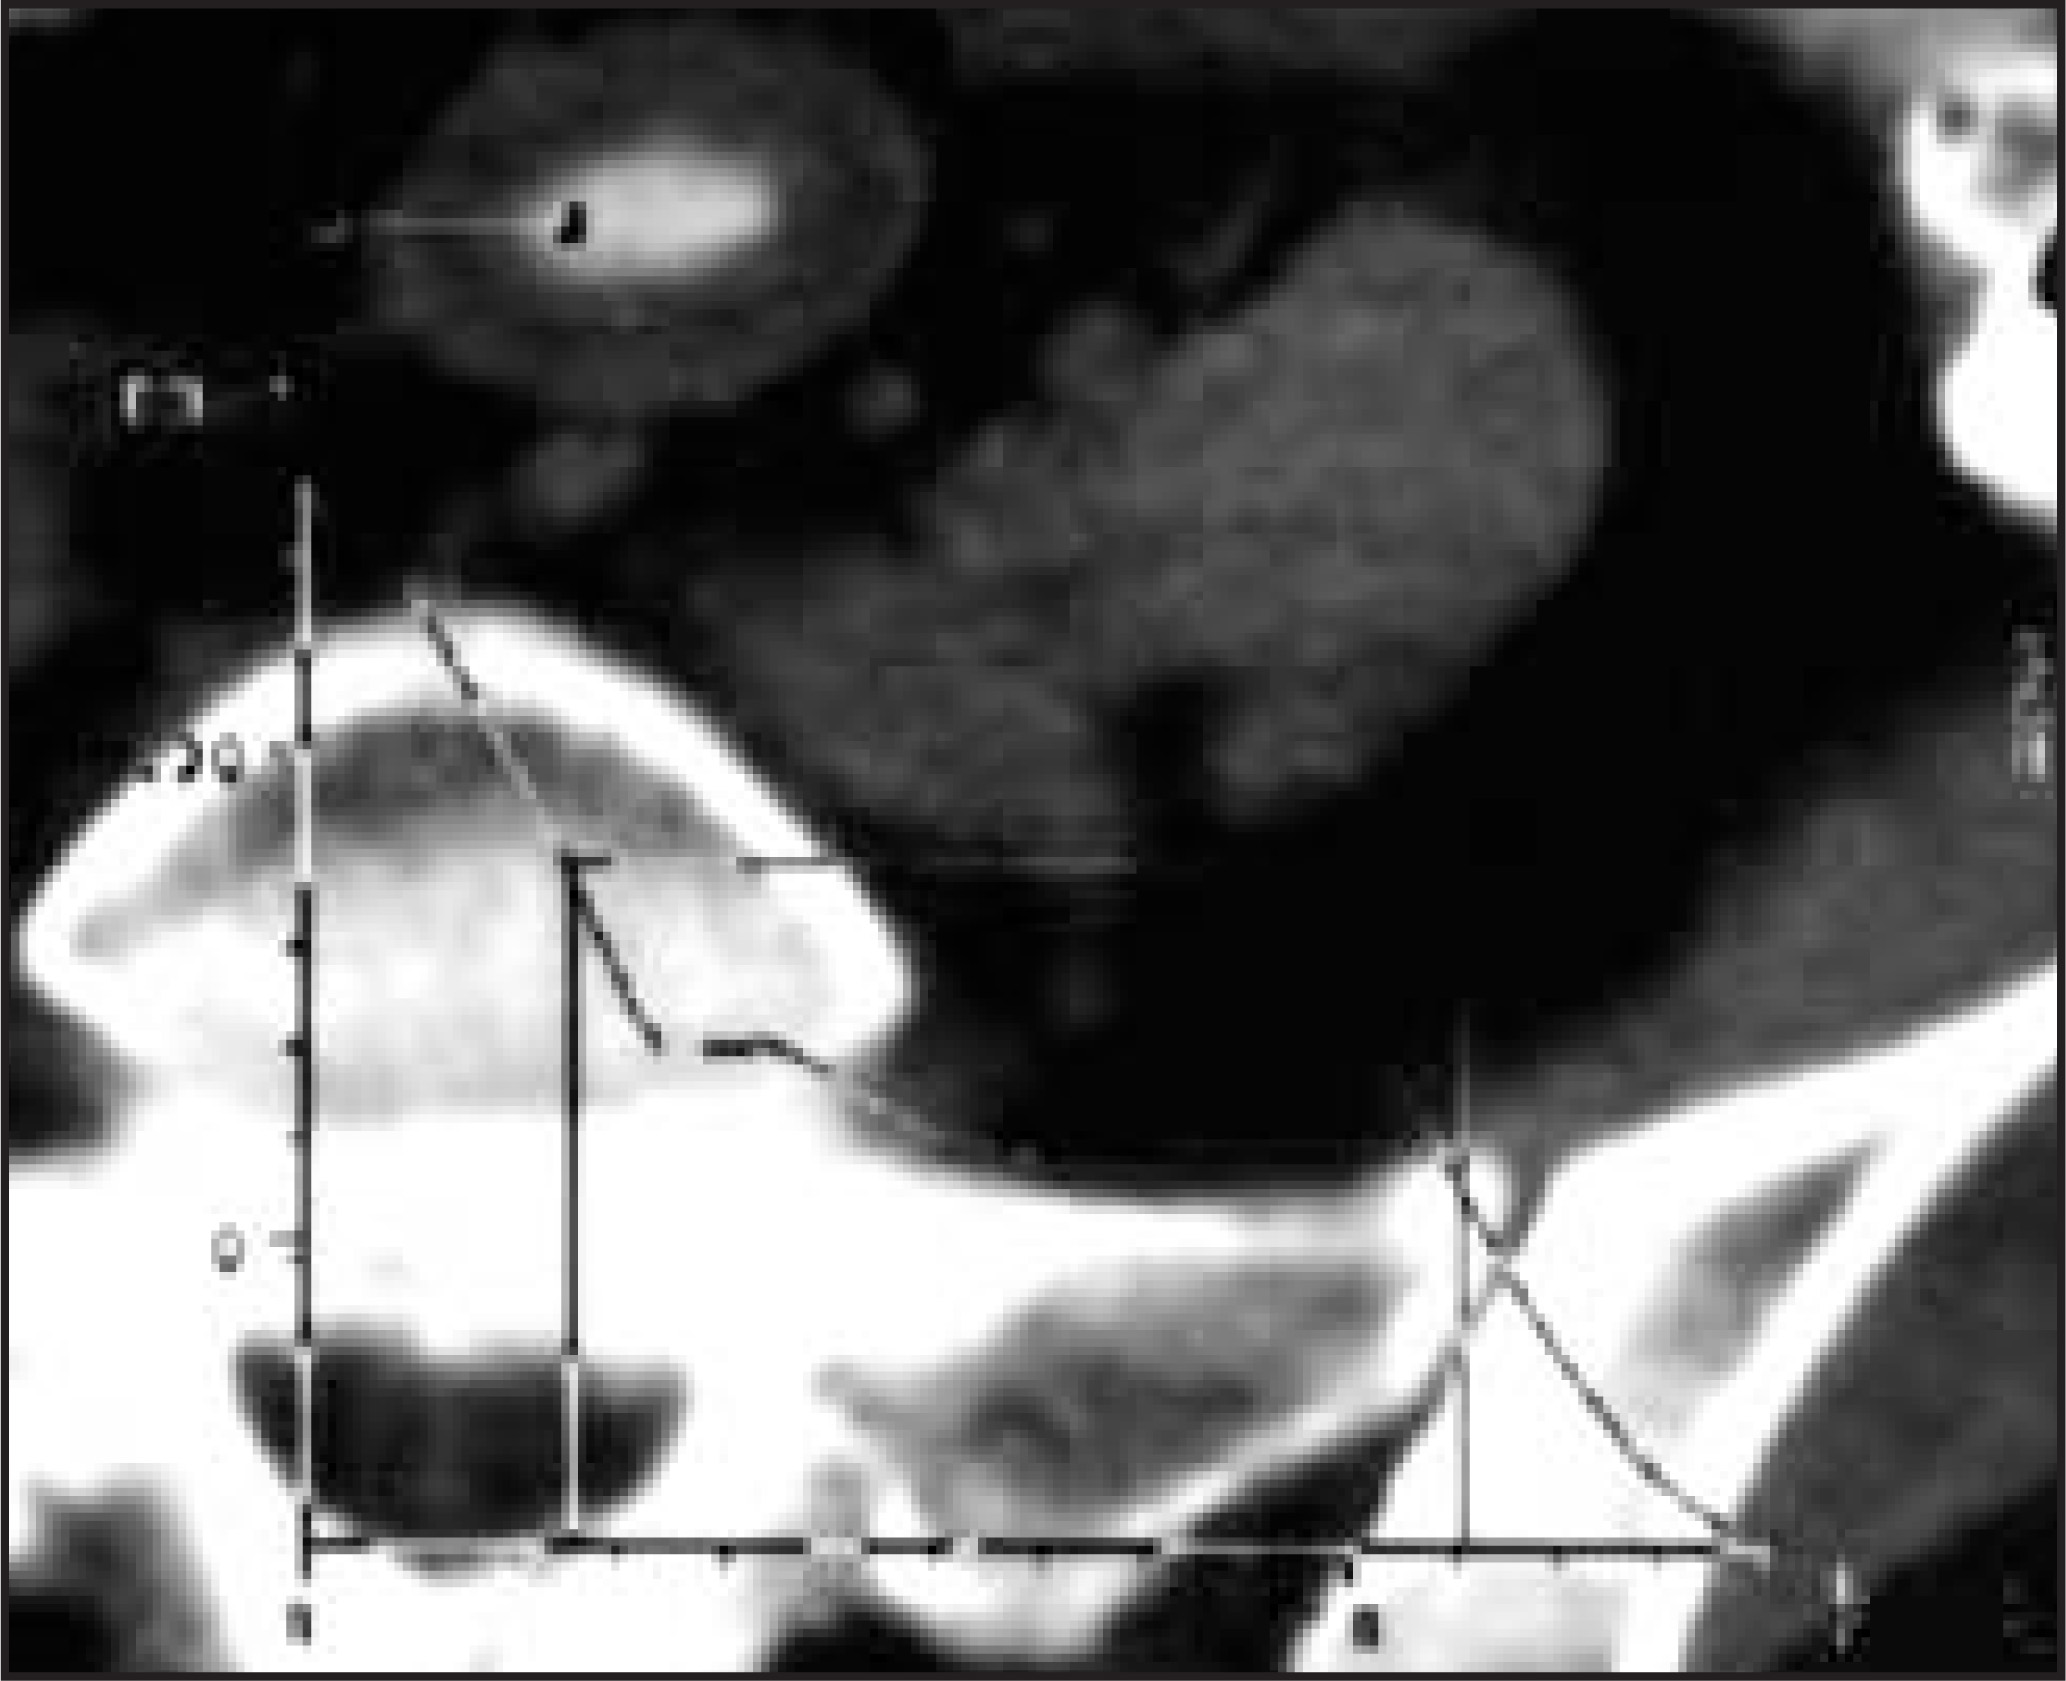
Etiopathology
The original description of mural stratification, called the “double halo” sign by Frager et al in 1983, was placed into modern context in a landmark review by Balthazar in 1991. 1 This appearance is visible only with cross-sectional imaging. “Homogenous wall thickening,” the double halo, and the “target sign” are the only direct pieces of evidence radiologists have of intestinal wall thickening. 1,2 With the widespread use of arterial phase abdominal computed tomography (CT), which optimally demonstrates the target or double halo sign, Gore et al 1,3 coined the phrase “mural stratification” in 1996.
The normal bowel wall resembles a wafer of five layers, which is rarely visible on abdominal CT. The inner two layers (mucosa/muscularis mucosa) and the outer two layers (muscularis propria/serosa) contain a vascular architecture that consists of a plethora of freely anastomosing vessels. There is a relative paucity of bridging vessels that penetrate the submucosal fat and course from the outer to the inner layers (figure 2).
4
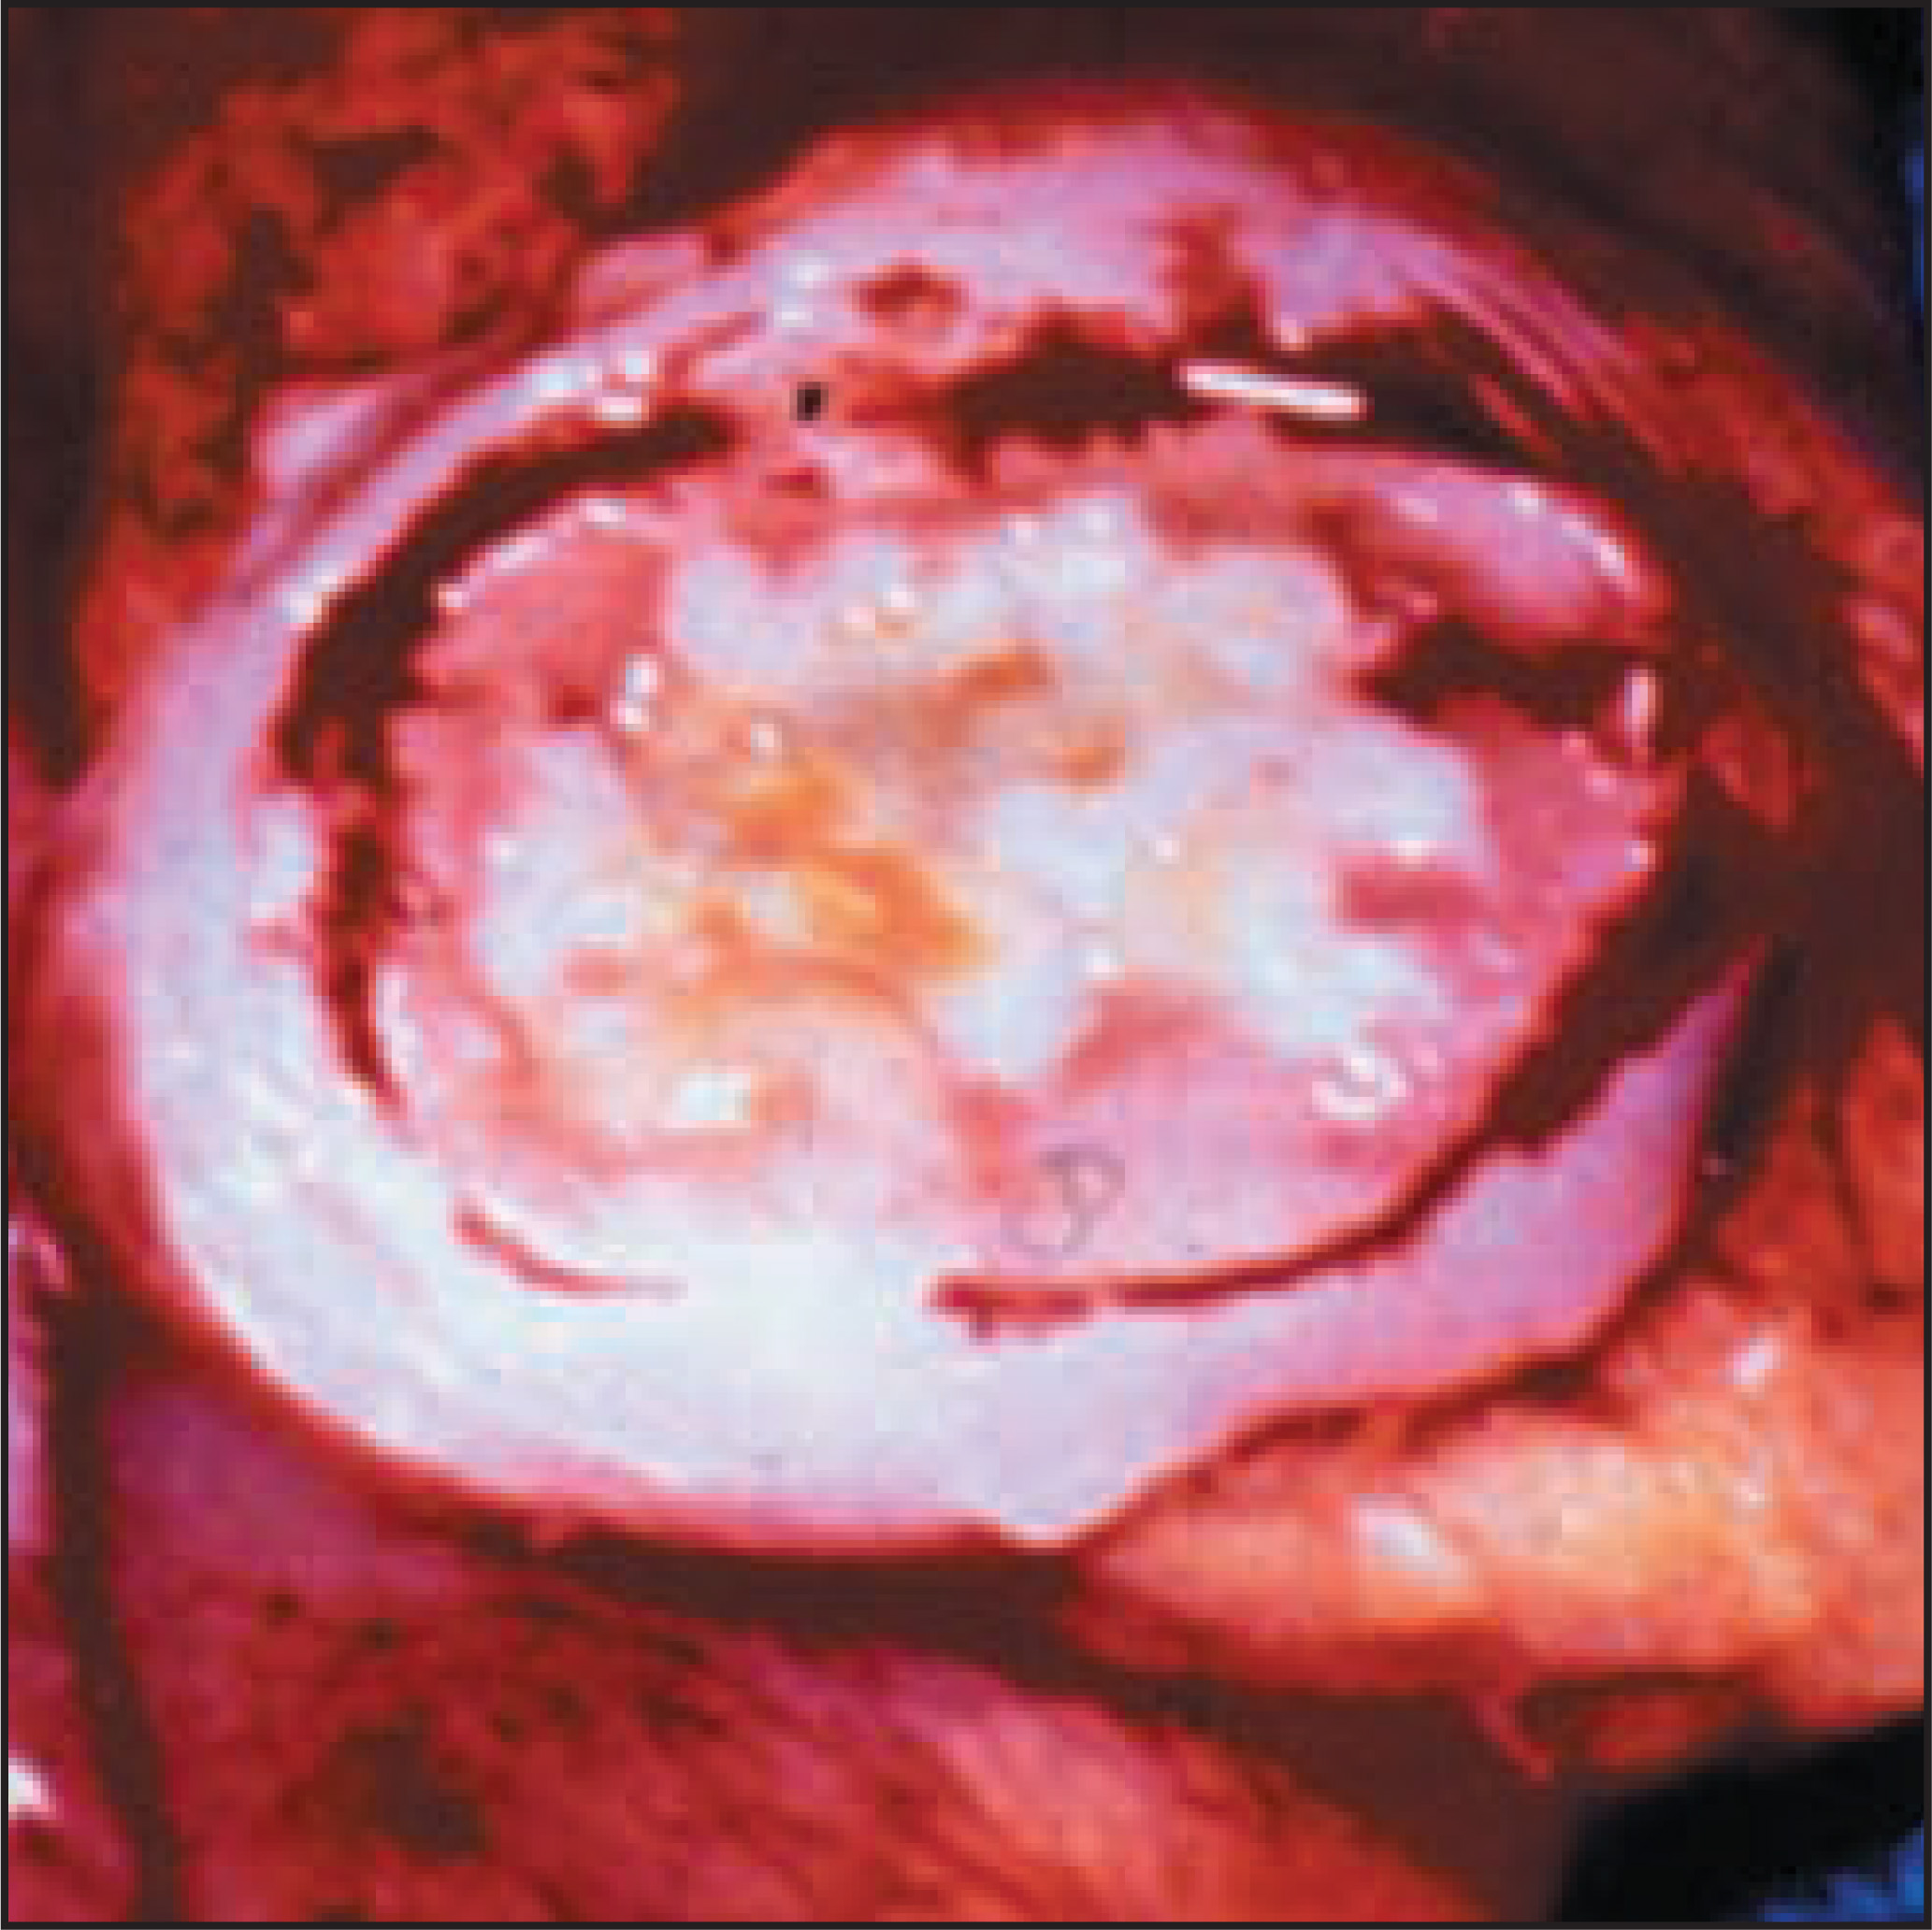
Contrast enhancement of abnormally thickened gut appears as a separate single inner and outer layer, or double halo, which corresponds to these anastomotic beds. Logic suggests that the target sign should be best seen during the arterial phase (figure 3).
1
Mural stratification occurs when the two contrast-enhancing layers are separated by a process that can widen the submucosal space, such as edema, hemorrhage, inflammatory cell infiltration, or submucosal fatty proliferation.
1,3,5
To date, in the Armed Forces Institute of Pathology (AFIP) archives, there are no documented cases of malignancy directly causing this smooth ring-like appearance. However, mural stratification from ischemia, hemorrhage, or edema proximal to an obstructing carcinoma or intussuscepting tumor may occur.
Categories of mural stratification
Low-density separation of the rings
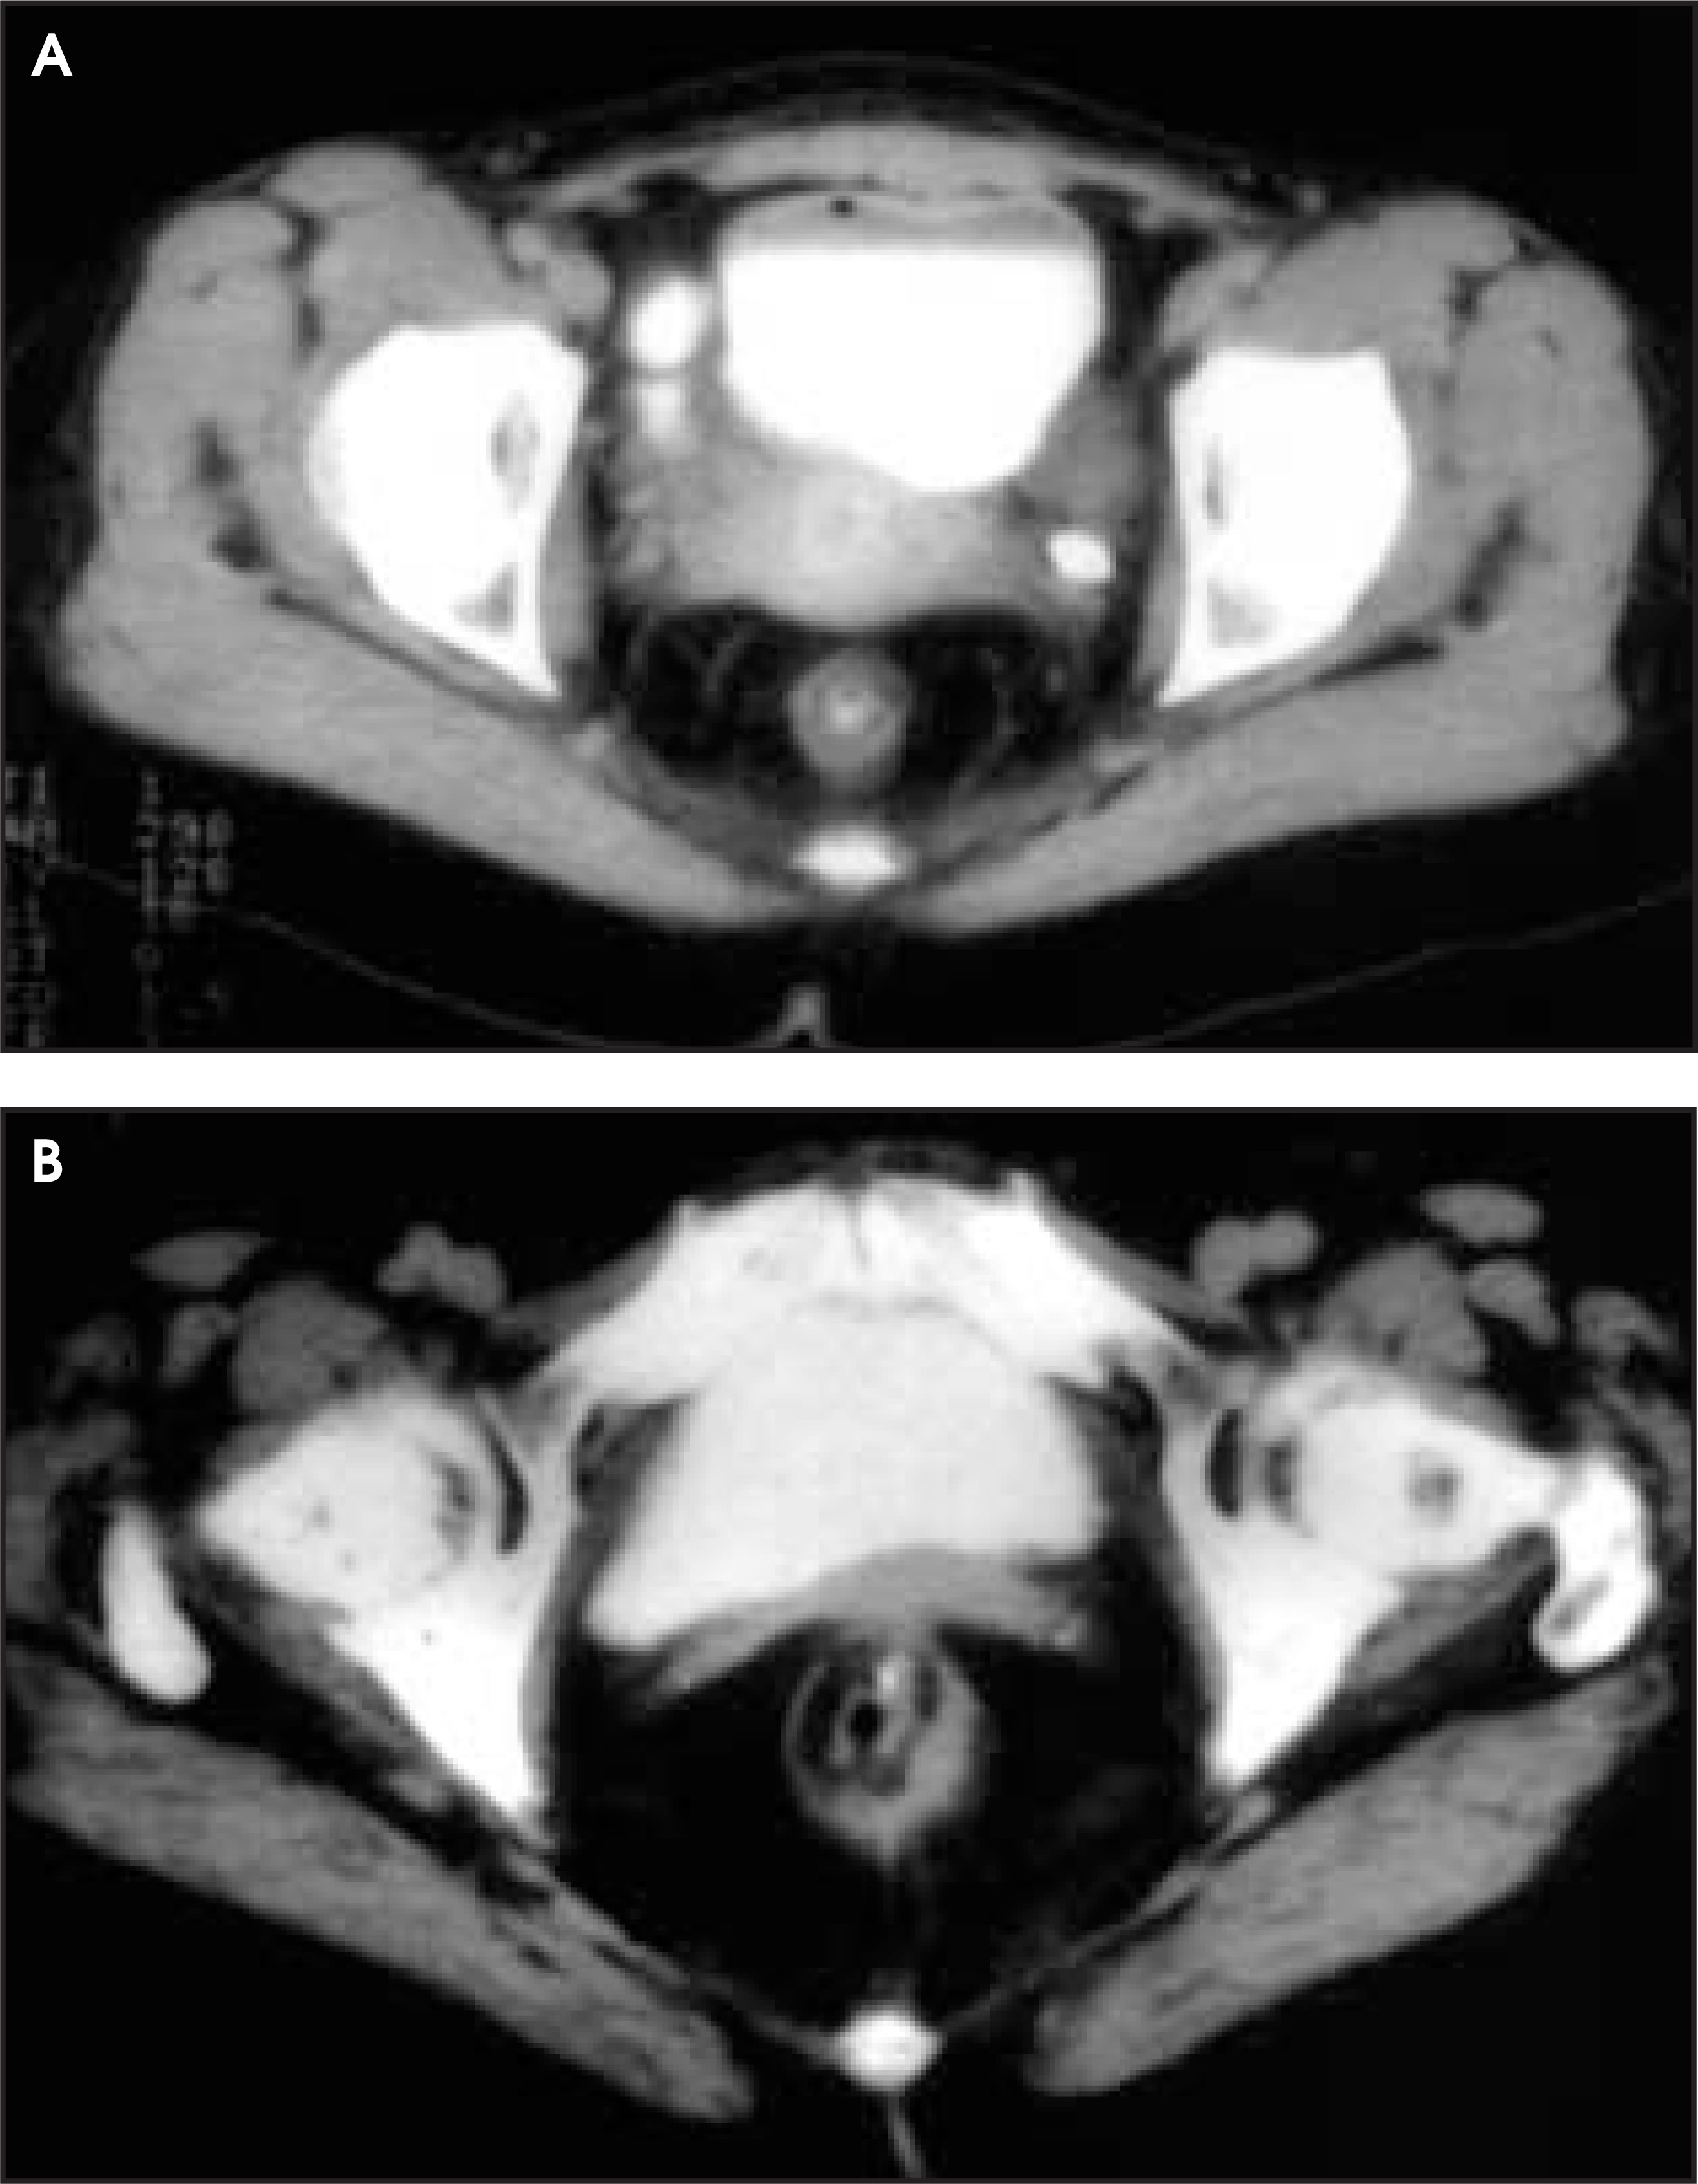
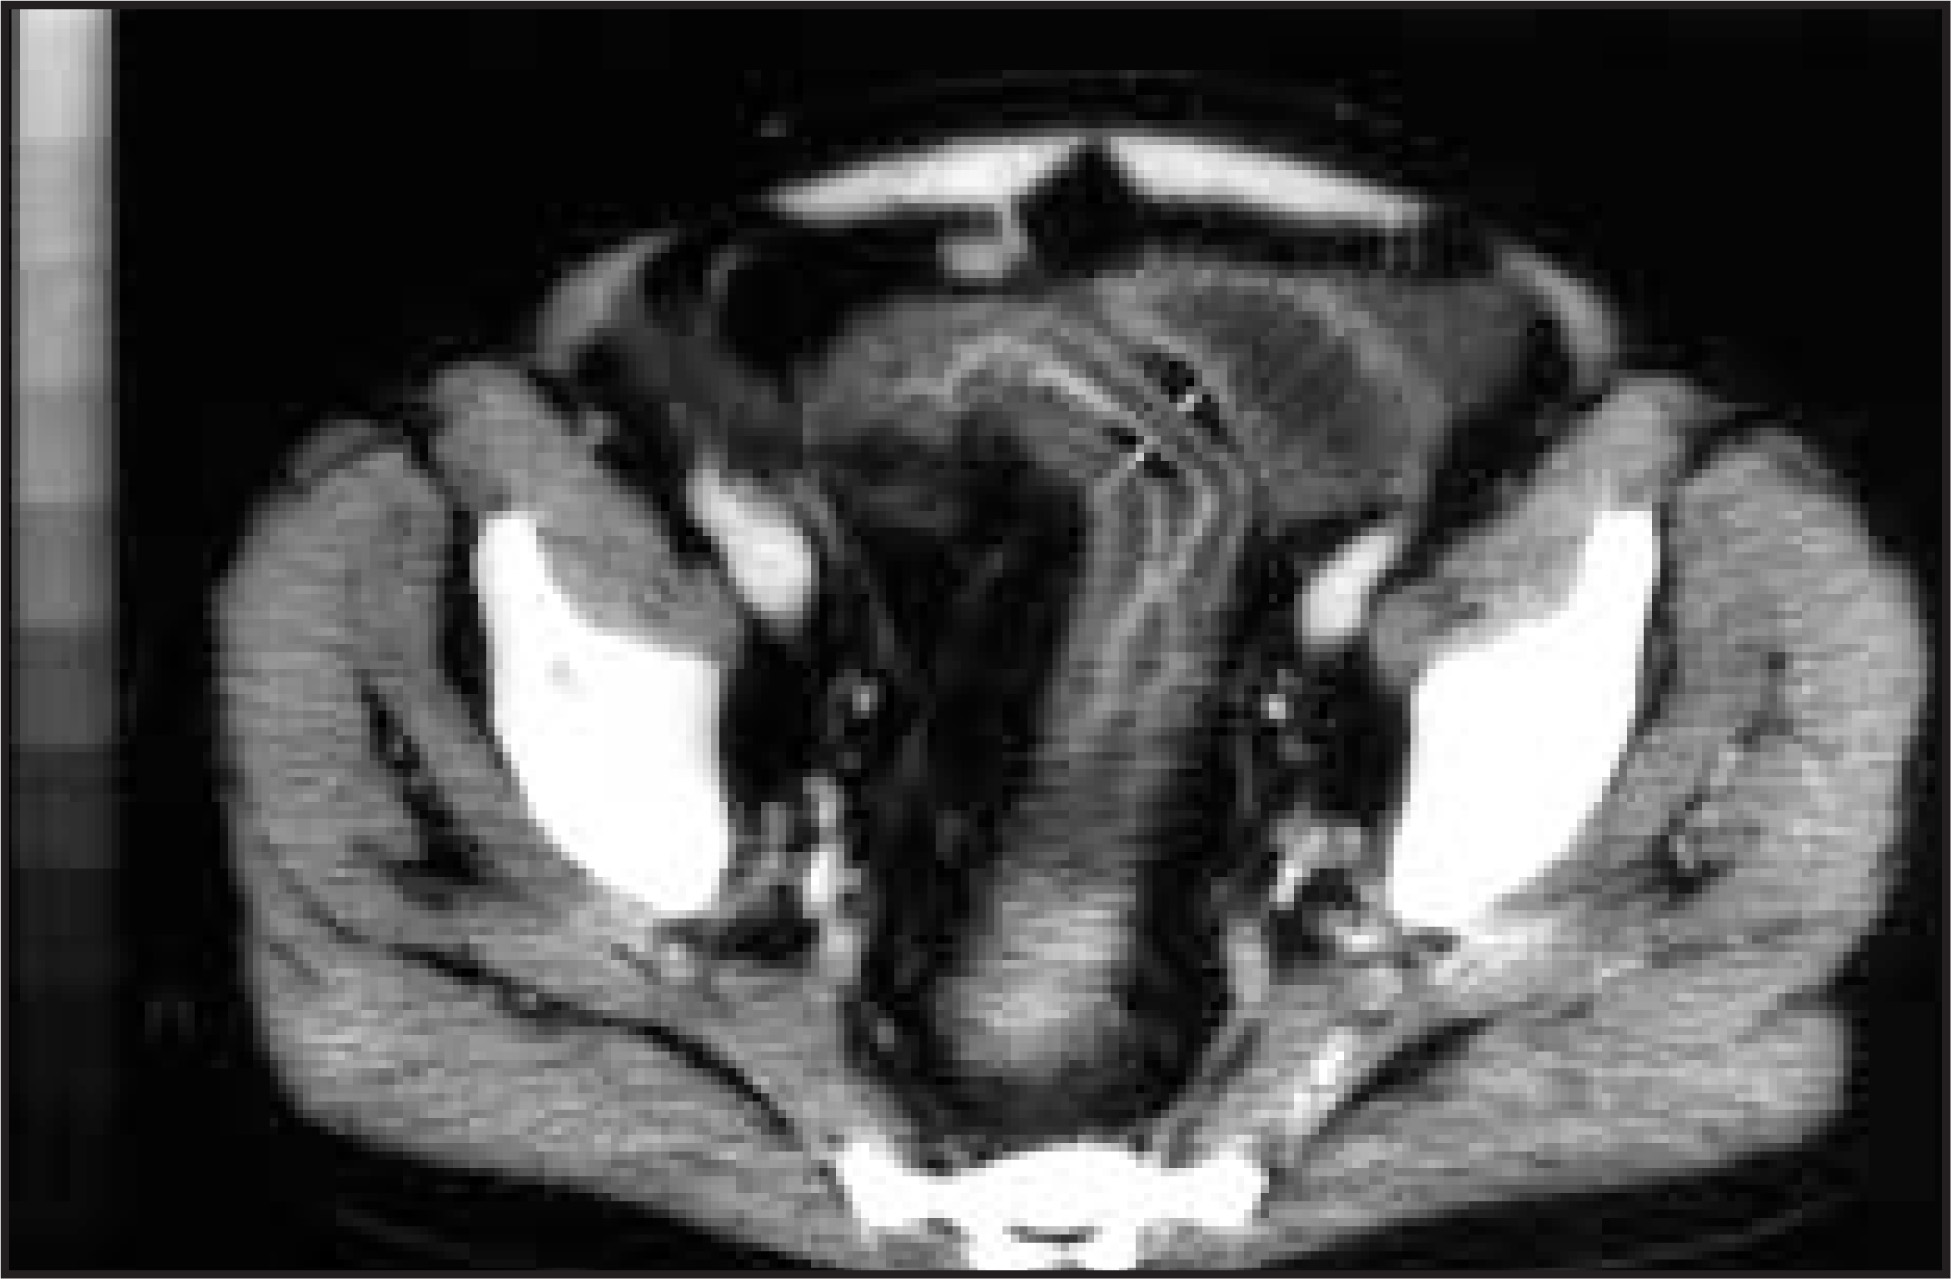
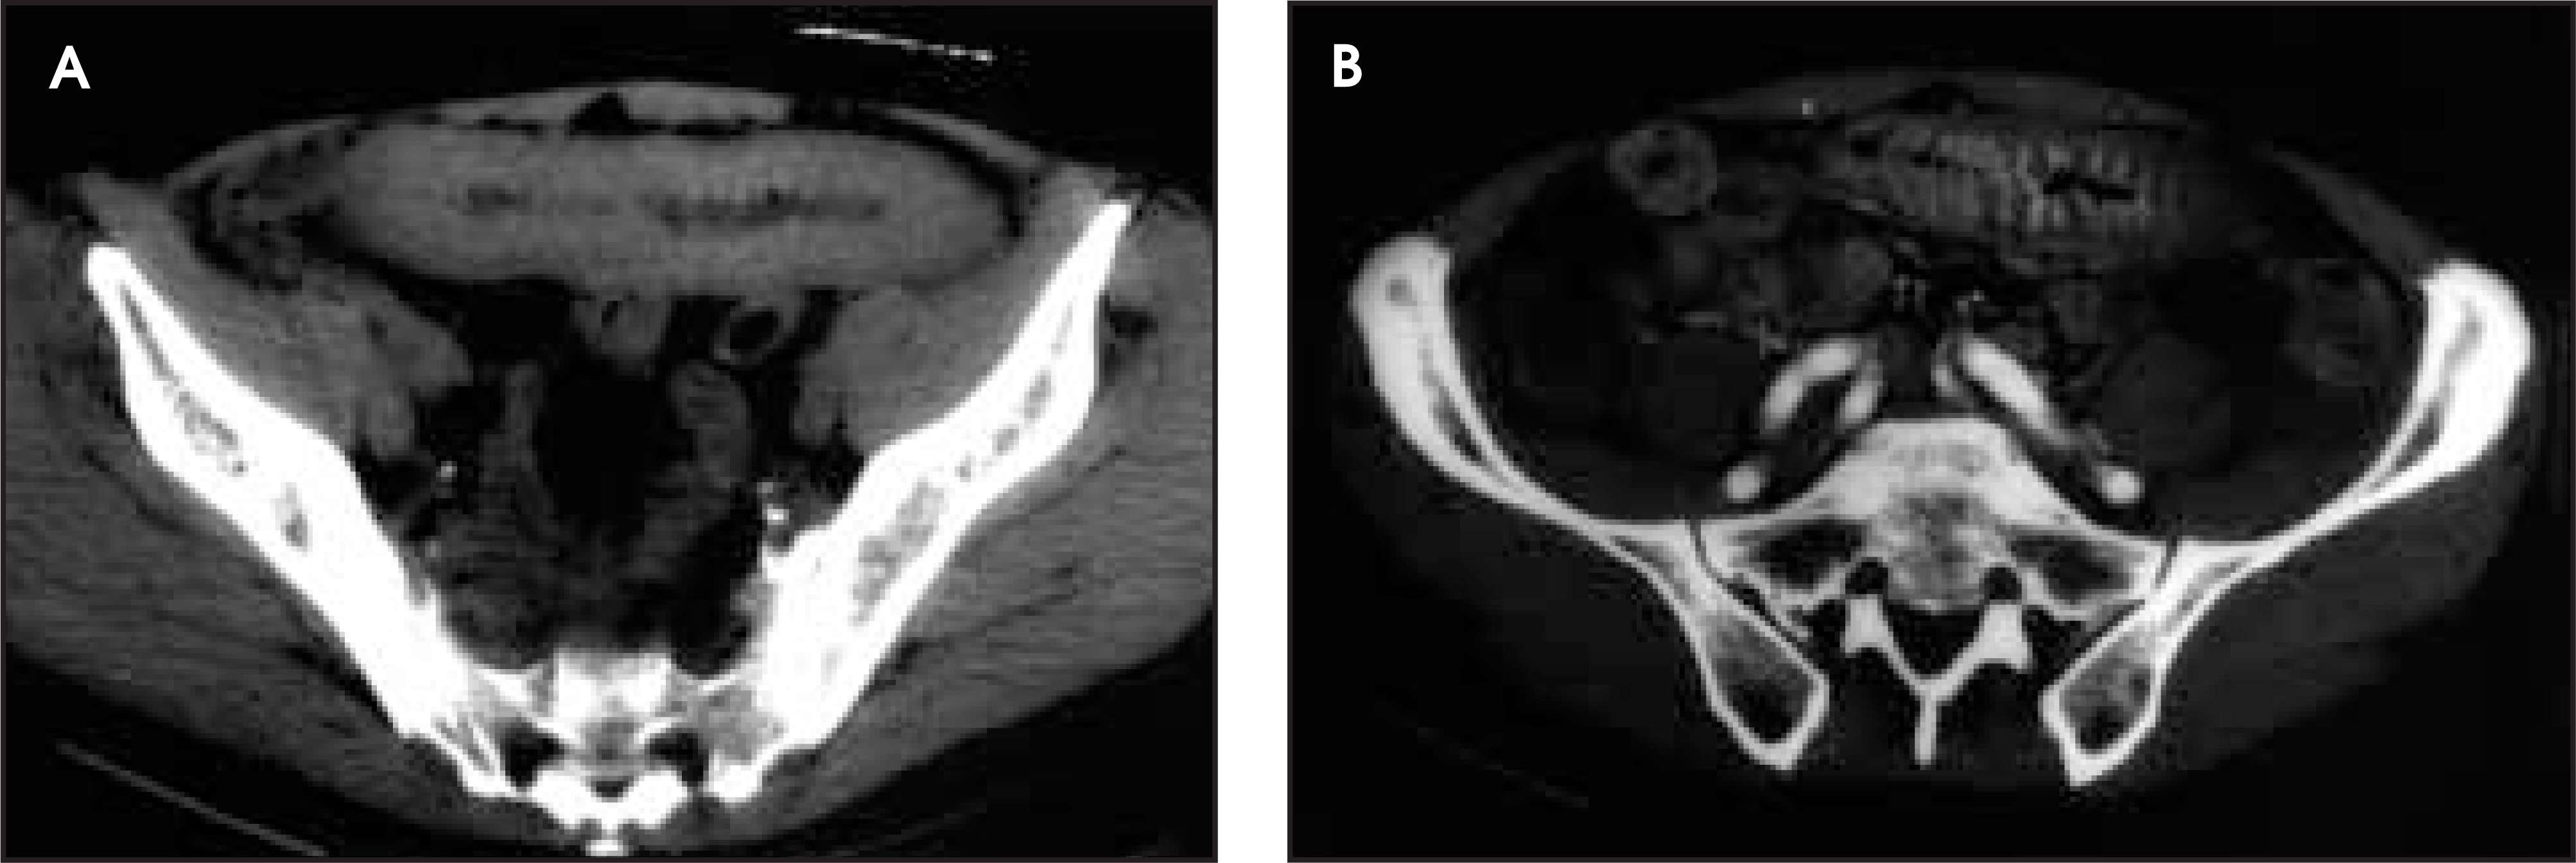
The classic appearance of mural stratification, seen in approximately 50% of patients with ulcerative colitis, is the separation of the inner and outer contrast-enhancing layers by low-density or water-density tissue (figure 4).
3,6
Low-density separation was reported as a finding highly characteristic of ulcerative colitis.
6
It is postulated that fatty proliferation in the submucosal tissues gives this highly characteristic appearance of mural stratification to the rectum. The fat thought to be separating these layers is recognizable on CT by its very low density, which is often equal in density to the surrounding perirectal fat. The pathologists at the AFIP have not been able to confirm the fatty nature of this low-density tissue. Regardless, with contrast enhancement of the inner and outer rings, there is no difficulty in recognizing the marked contrast difference seen with mural stratification in this low pelvic location.
3
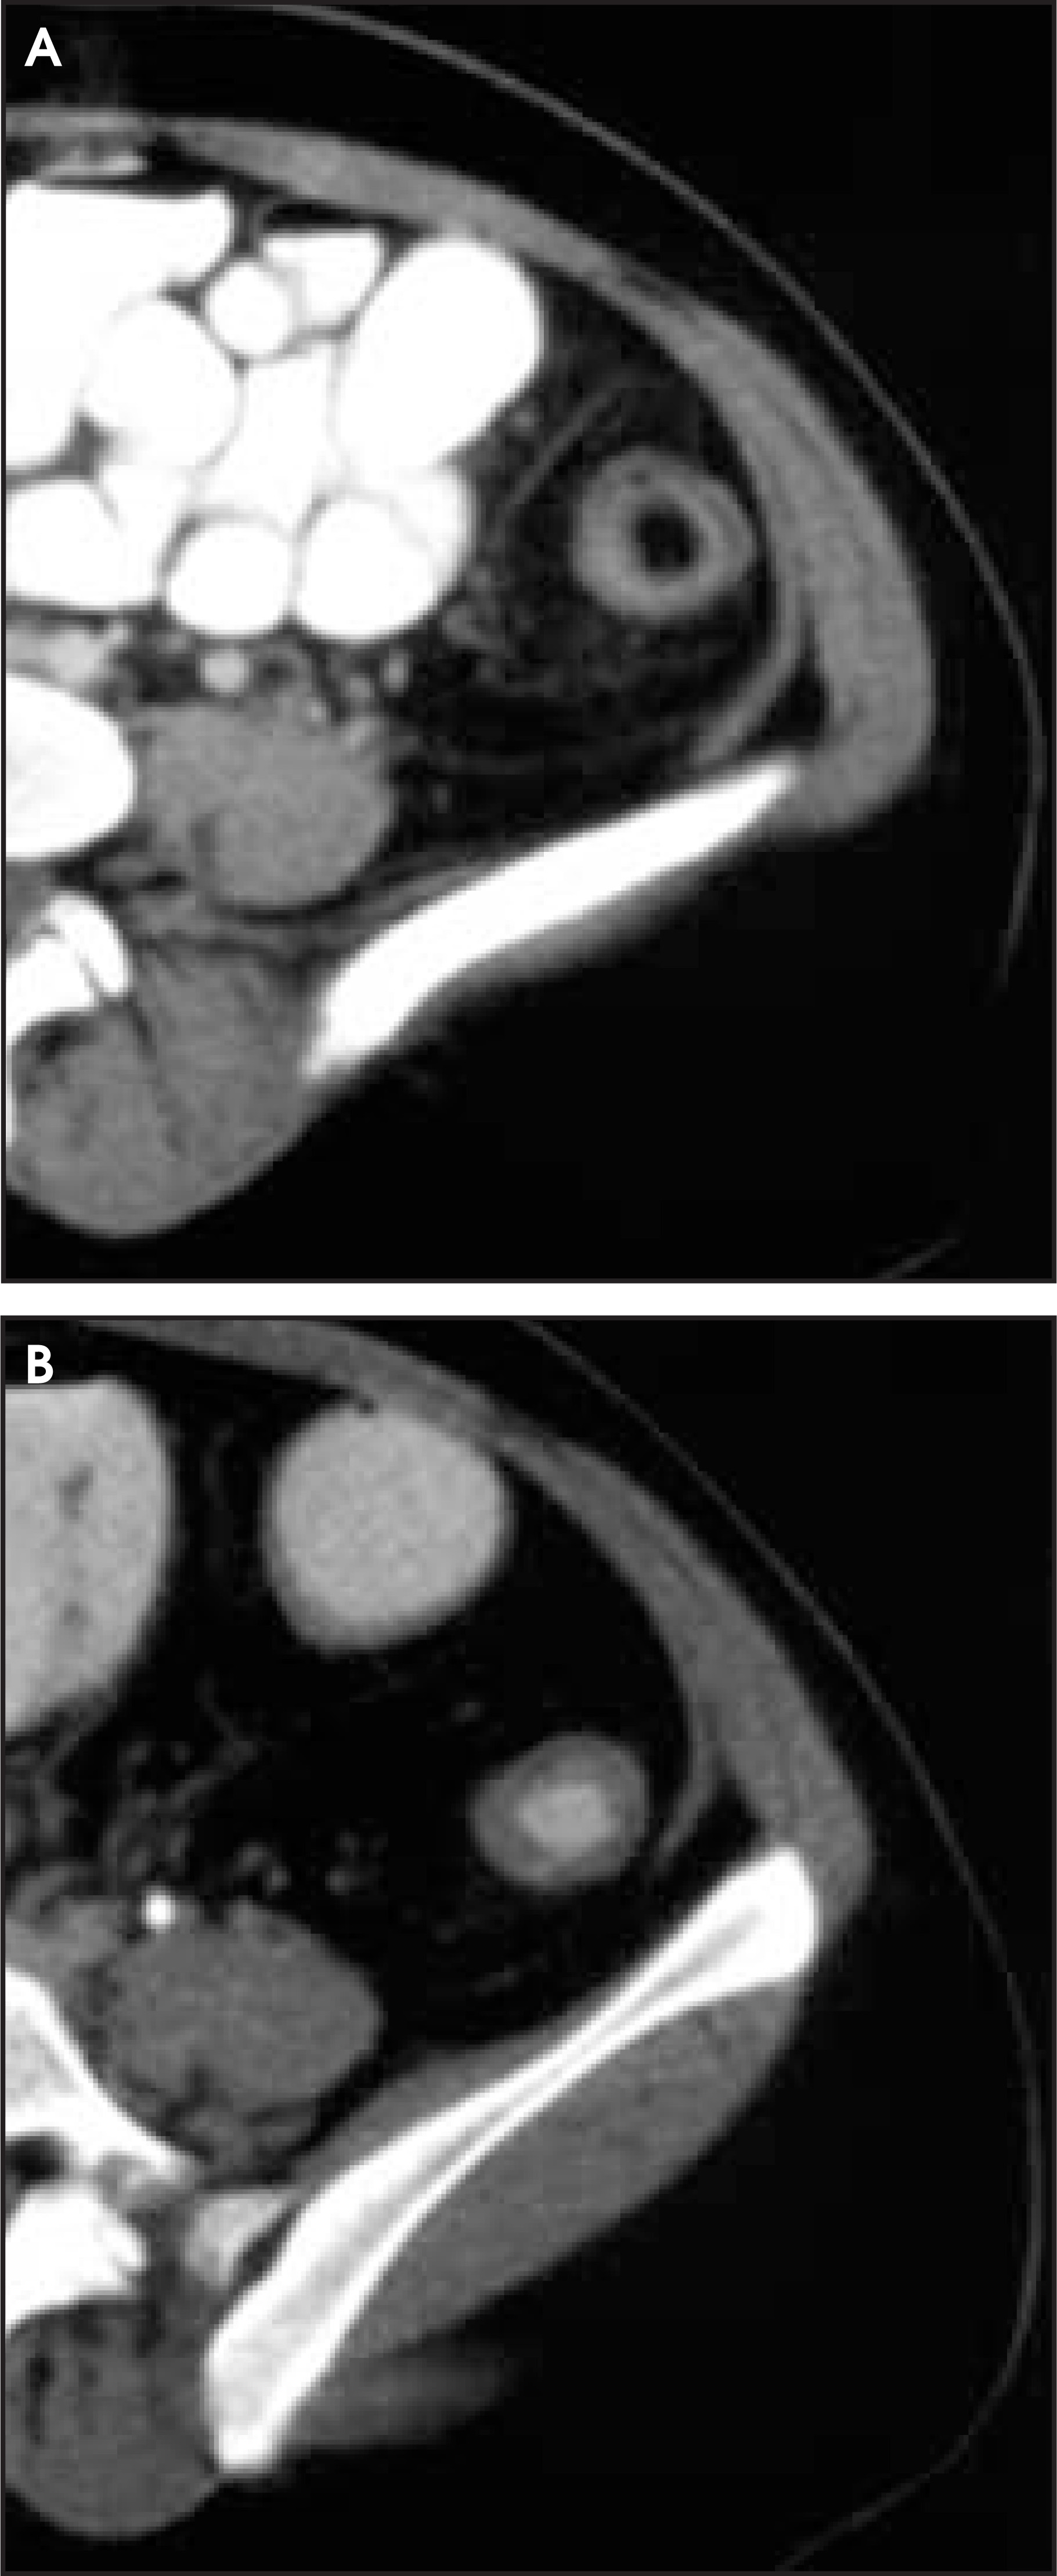
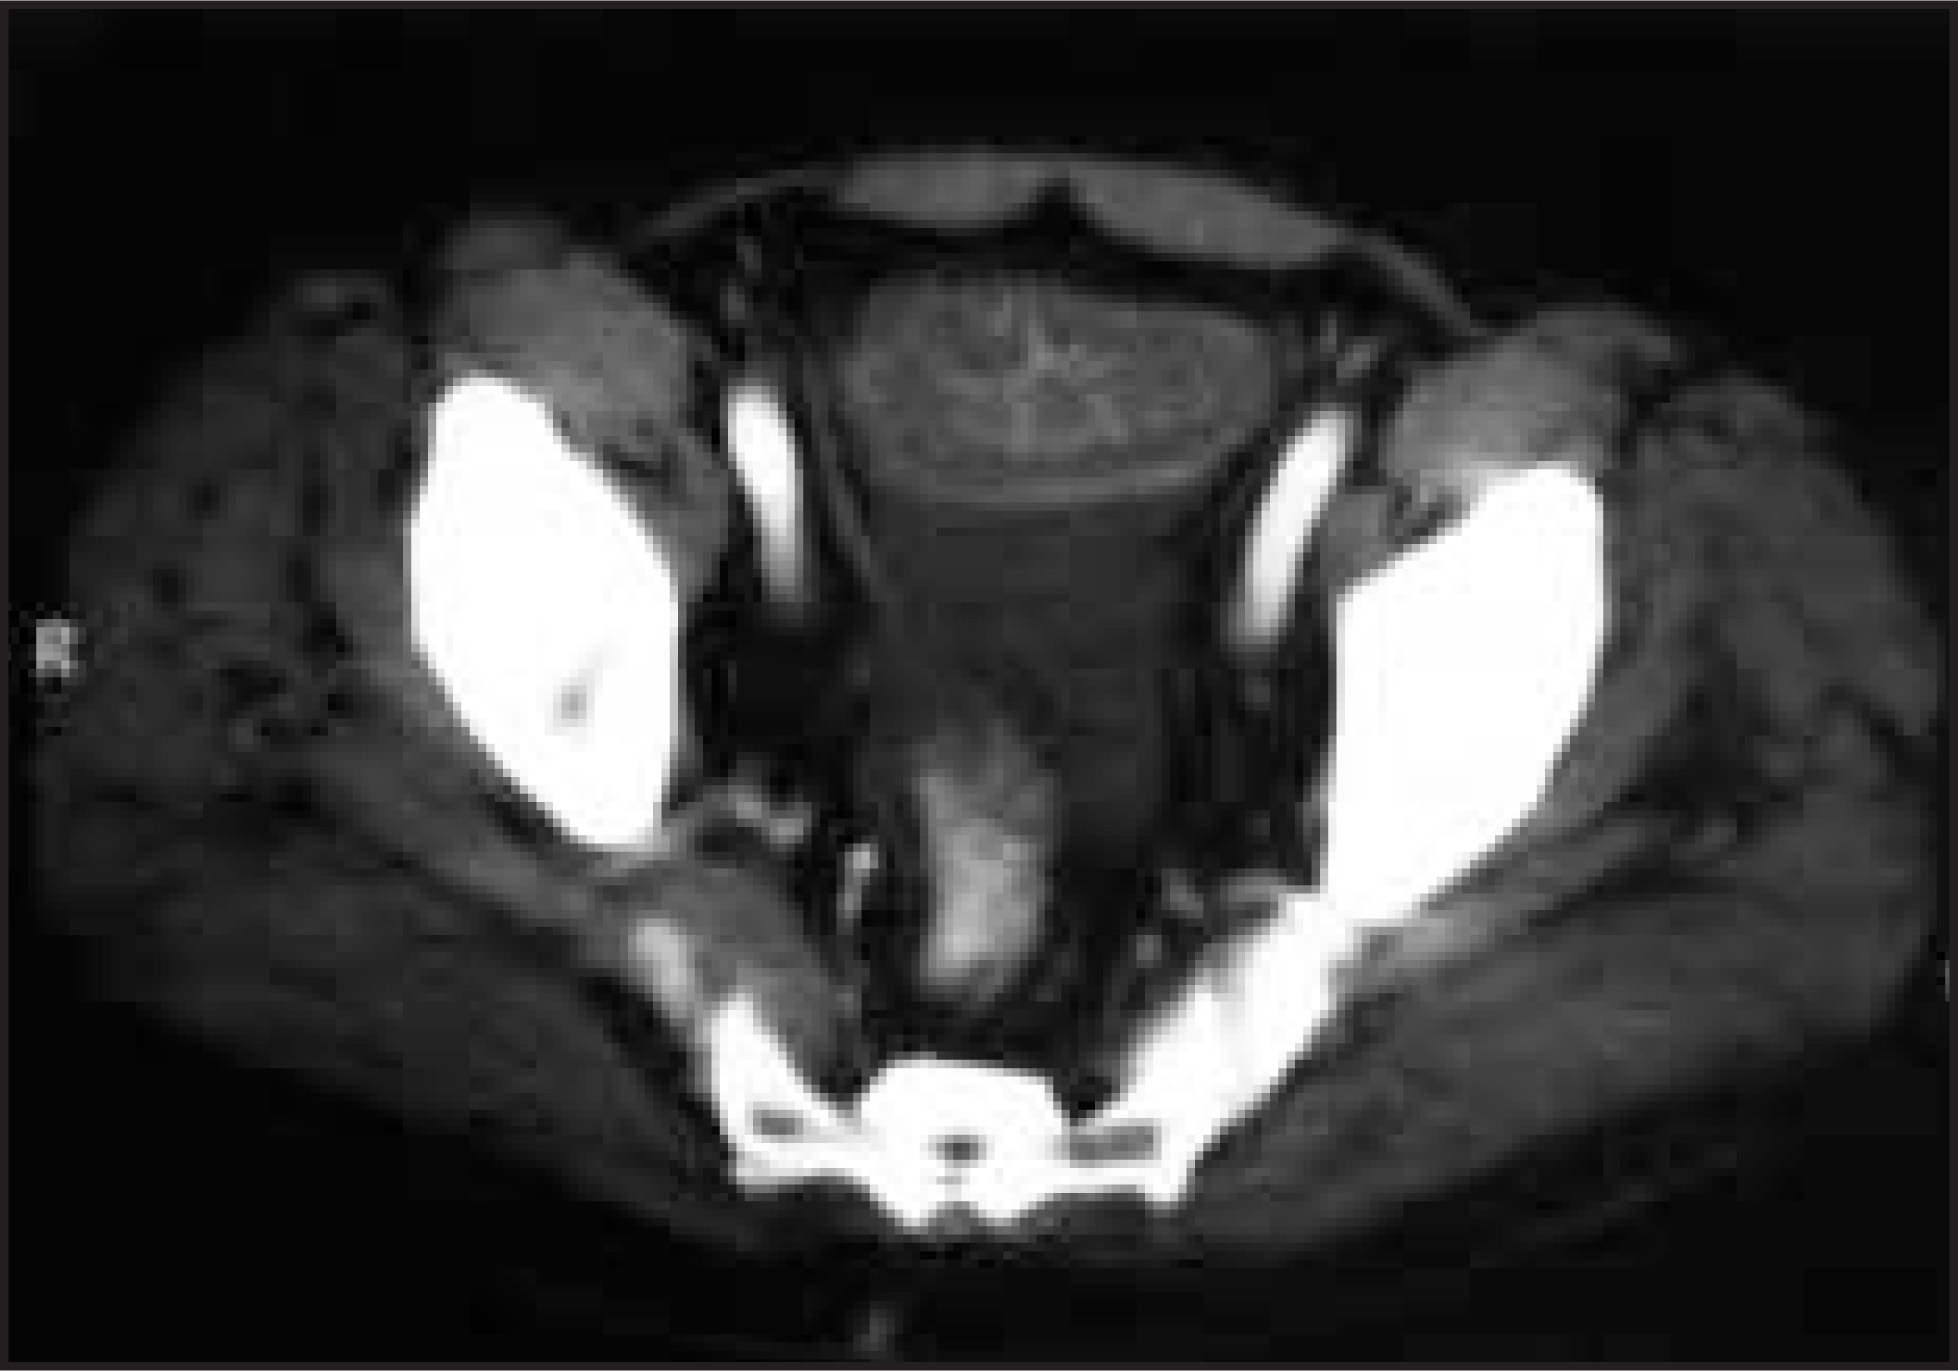
The knowledge that this appearance is most often seen in ulcerative colitis alerts radiologists to any asymmetric thickening of these otherwise thin, concentric rings, which is suspect for lymphoma or adenocarcinoma (figure 4B). Similar asymmetry is seen with intussusception, which may also mimic mural stratification due to the fat drawn into the lumen with the inner ring of involved gut. Fortunately, intussusception is generally focal, and the more proximal extent of the intussusception may show the lumen filled with fat without an inner-enhancing margin (figure 5).
Inflammatory cell infiltration (intact and broken rings)
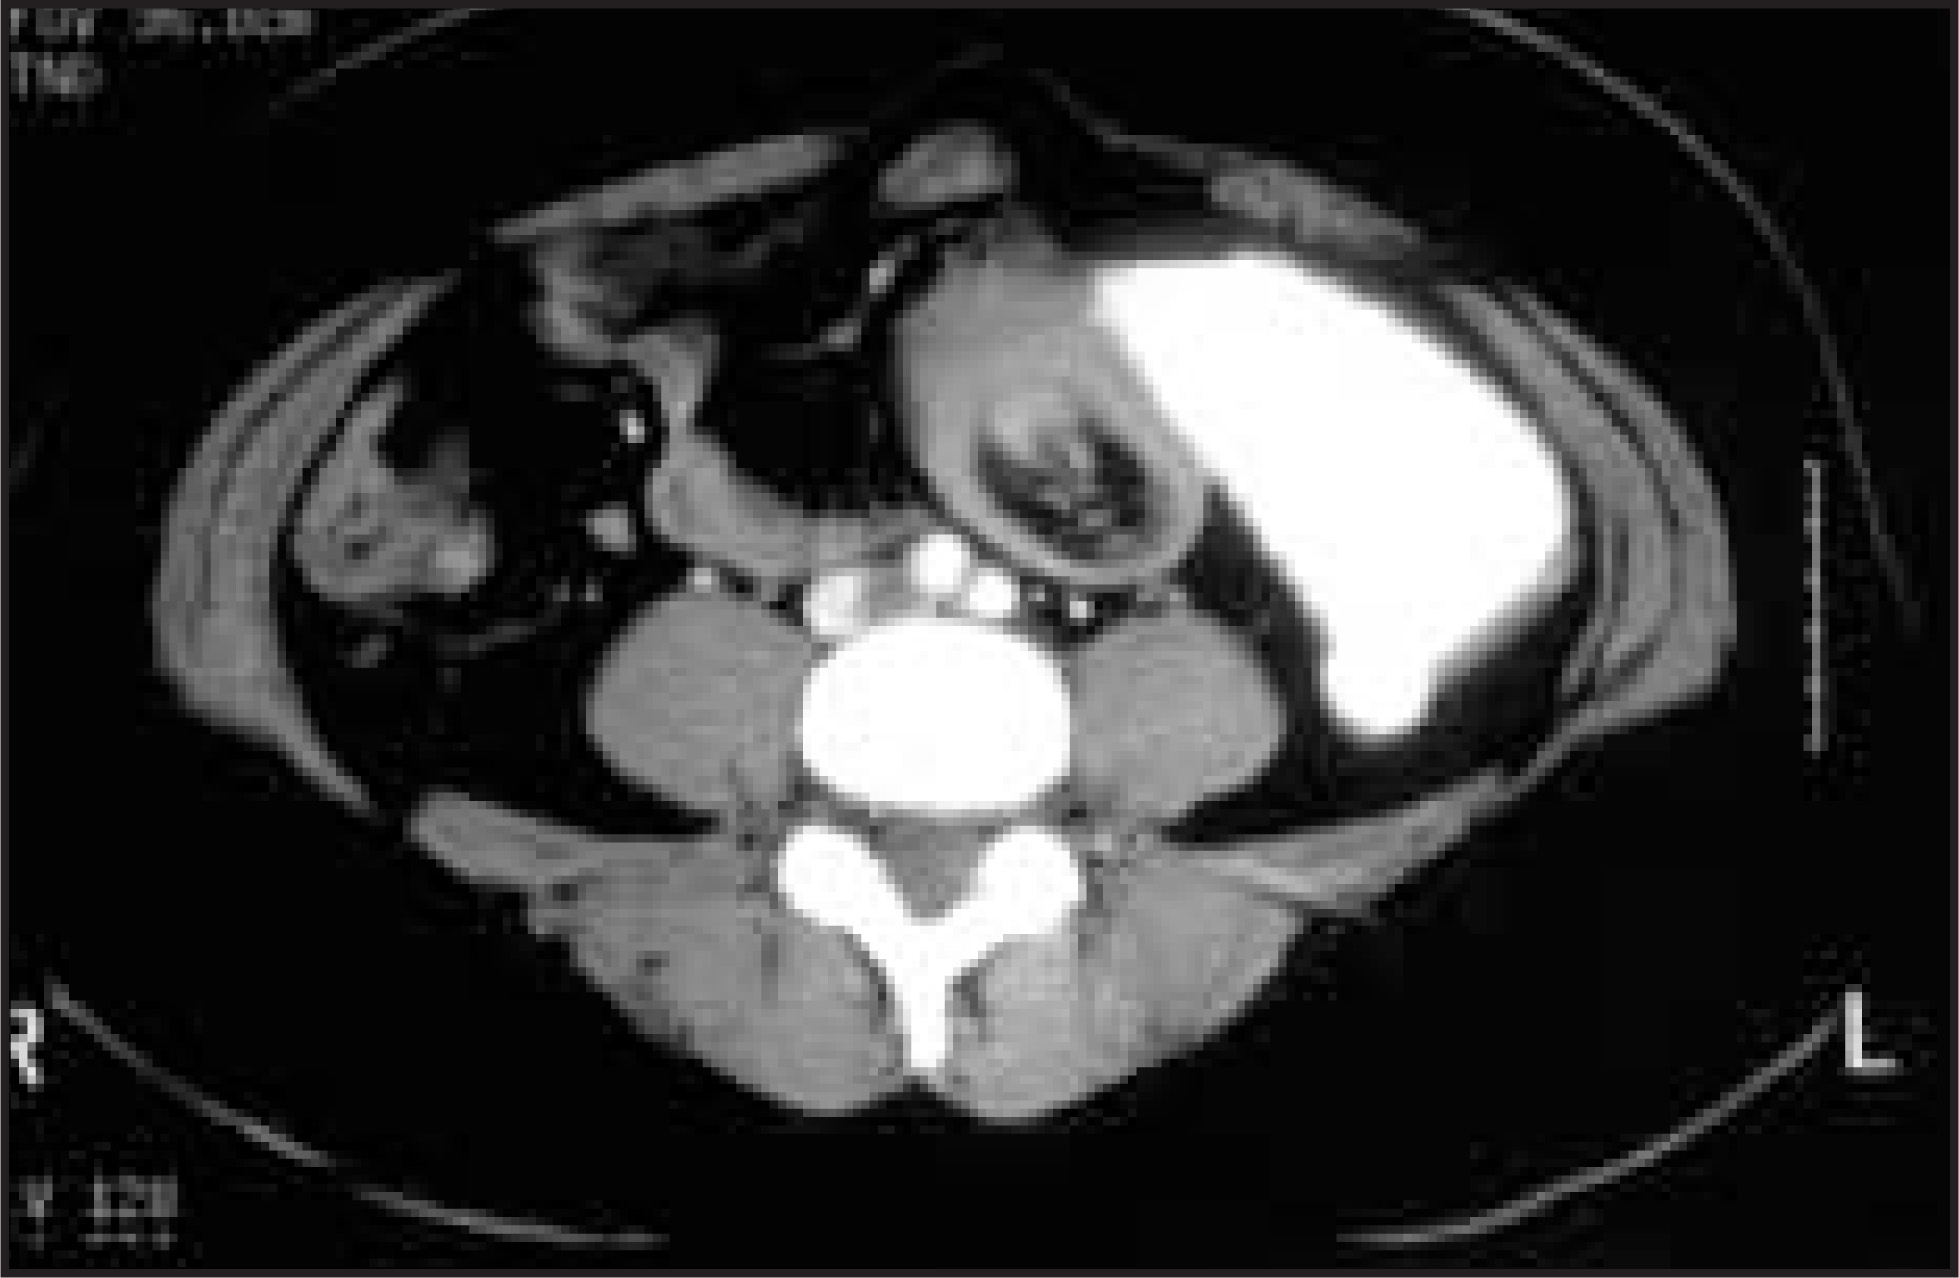
Inflammation of the bowel wall can separate the enhancing inner from the outer wall layers. Although not typically seen in conditions with inflammation limited to the mucosal surface, it does occur in ulcerative colitis, as discussed above. Mural stratification typically occurs when the inflammatory process is transmural (figure 6).
3
The prototype is Crohn’s disease, of which transmural inflammation is a hallmark. Although initially reported as being seen in only 15% of patients with Crohn’s disease, others report the presence of mural stratification in up to 50% of cases, which has also been the authors’ experience with CT-enteroclysis (figure 1).
3,7
The intact, concentric rings of mural stratification represent active inflammation on both CT and MR, and suggest a state of disease amenable to medical therapy (figure 3).
3
The opposite condition of unenhancing, thickened gut wall usually represents scar tissue that no longer contains enhancing vessels. When found in patients with high-grade or complete obstructive symptoms, stricturoplasty or surgical resection is often required (figure 7).
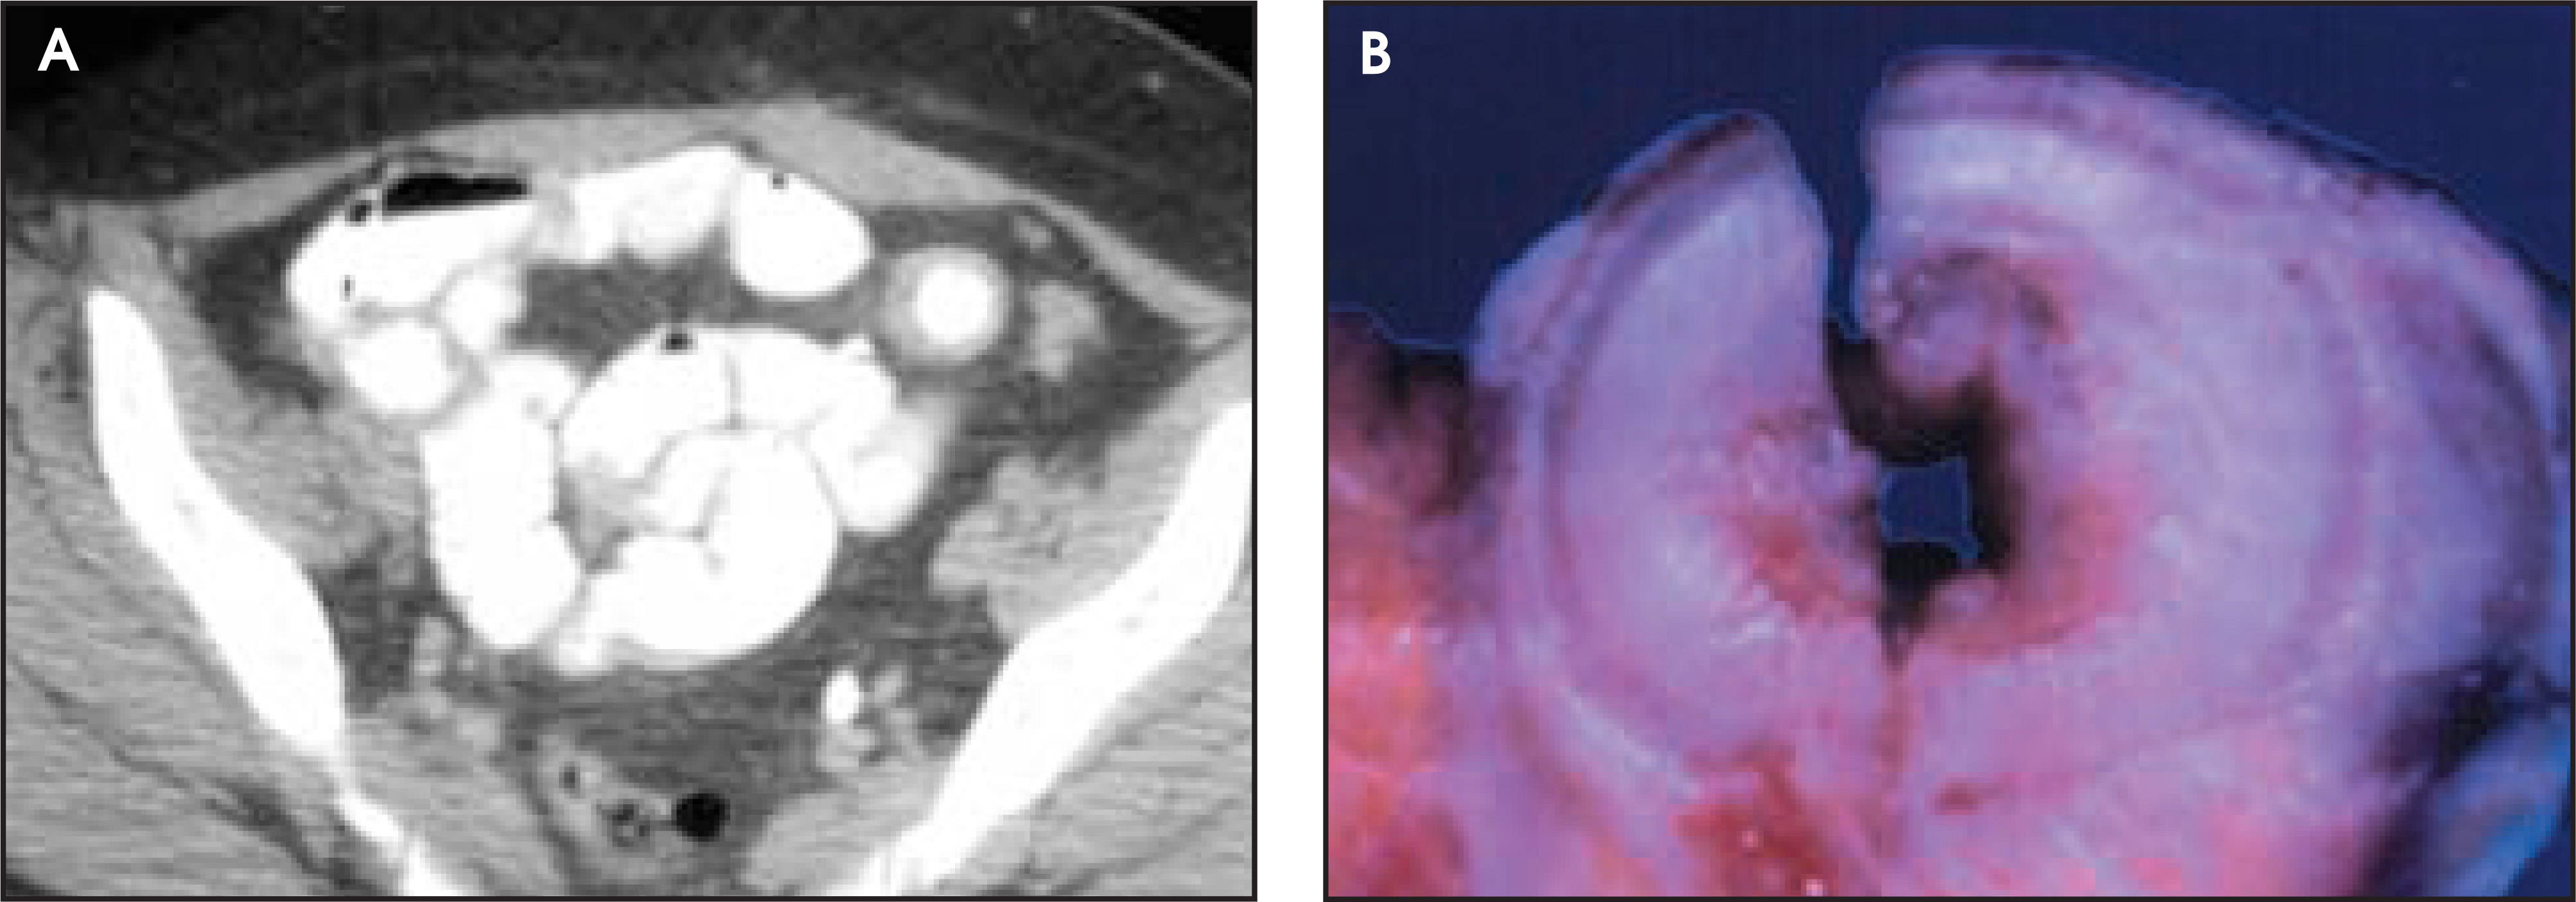
Transmural inflammation can be seen in many other inflammatory or infectious diseases. From the AFIP archives, other examples that have been found include Mycobacterium tuberculosis, eosinophilic enteritis, cytomegalovirus, Clostridium difficile, Entamoeba histolytica, Vibrio cholera, Shigella, Staphylococcus aureus, and Escherichia coli (figure 8). In cases of overwhelming infection, severe inflammation causes blurring or loss of the usually sharp inner and outer contrast-enhancing rings (figure 9),
1,3
which is indicative of a surrounding phlegmon or abscess.
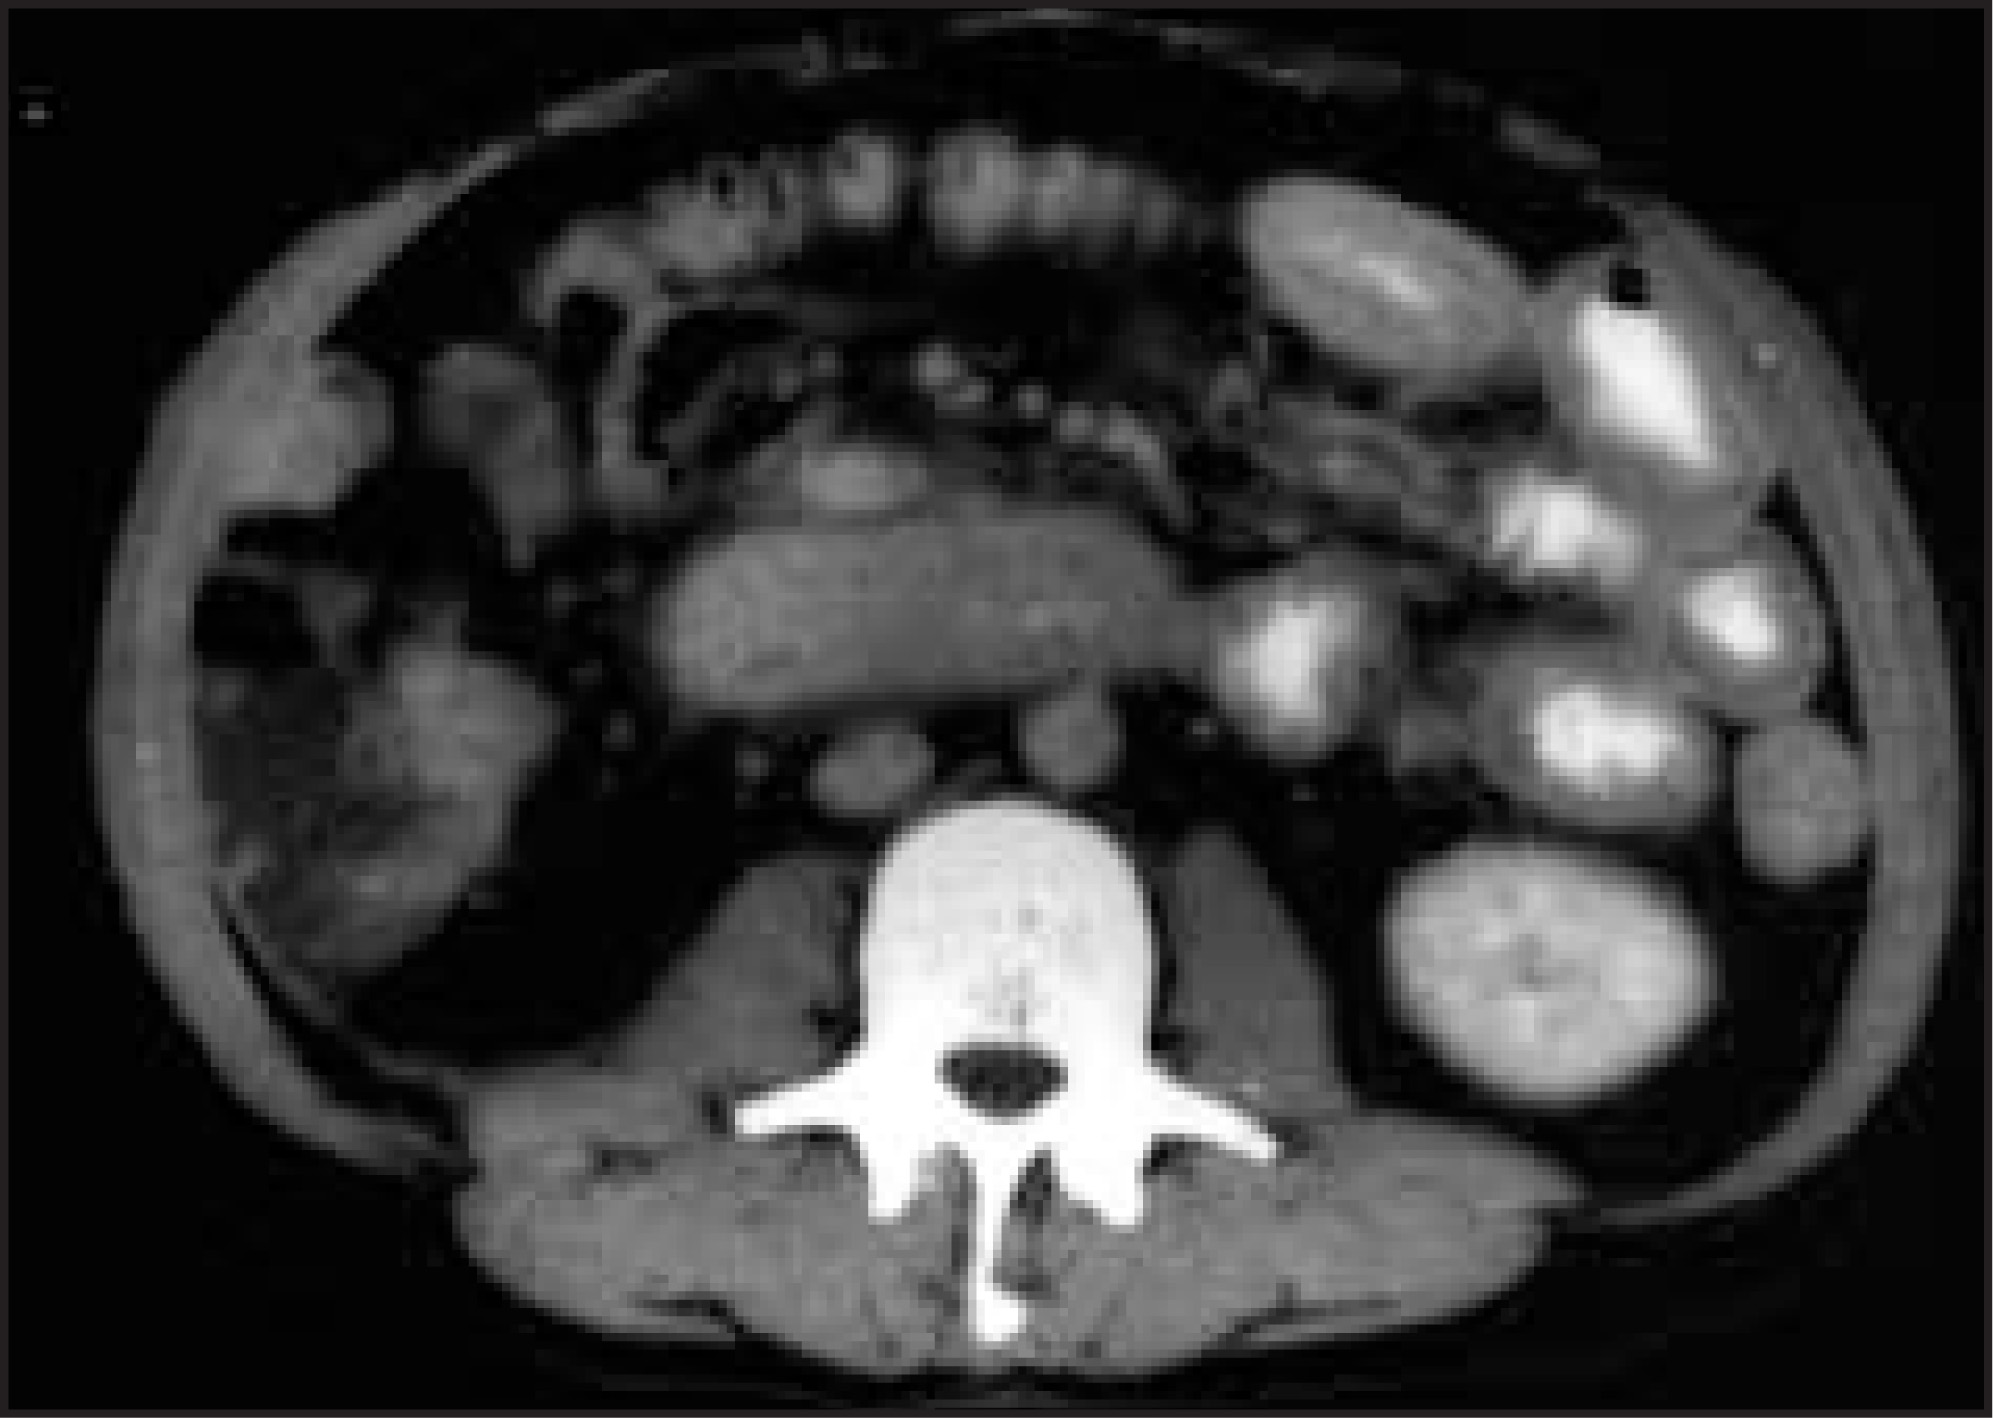
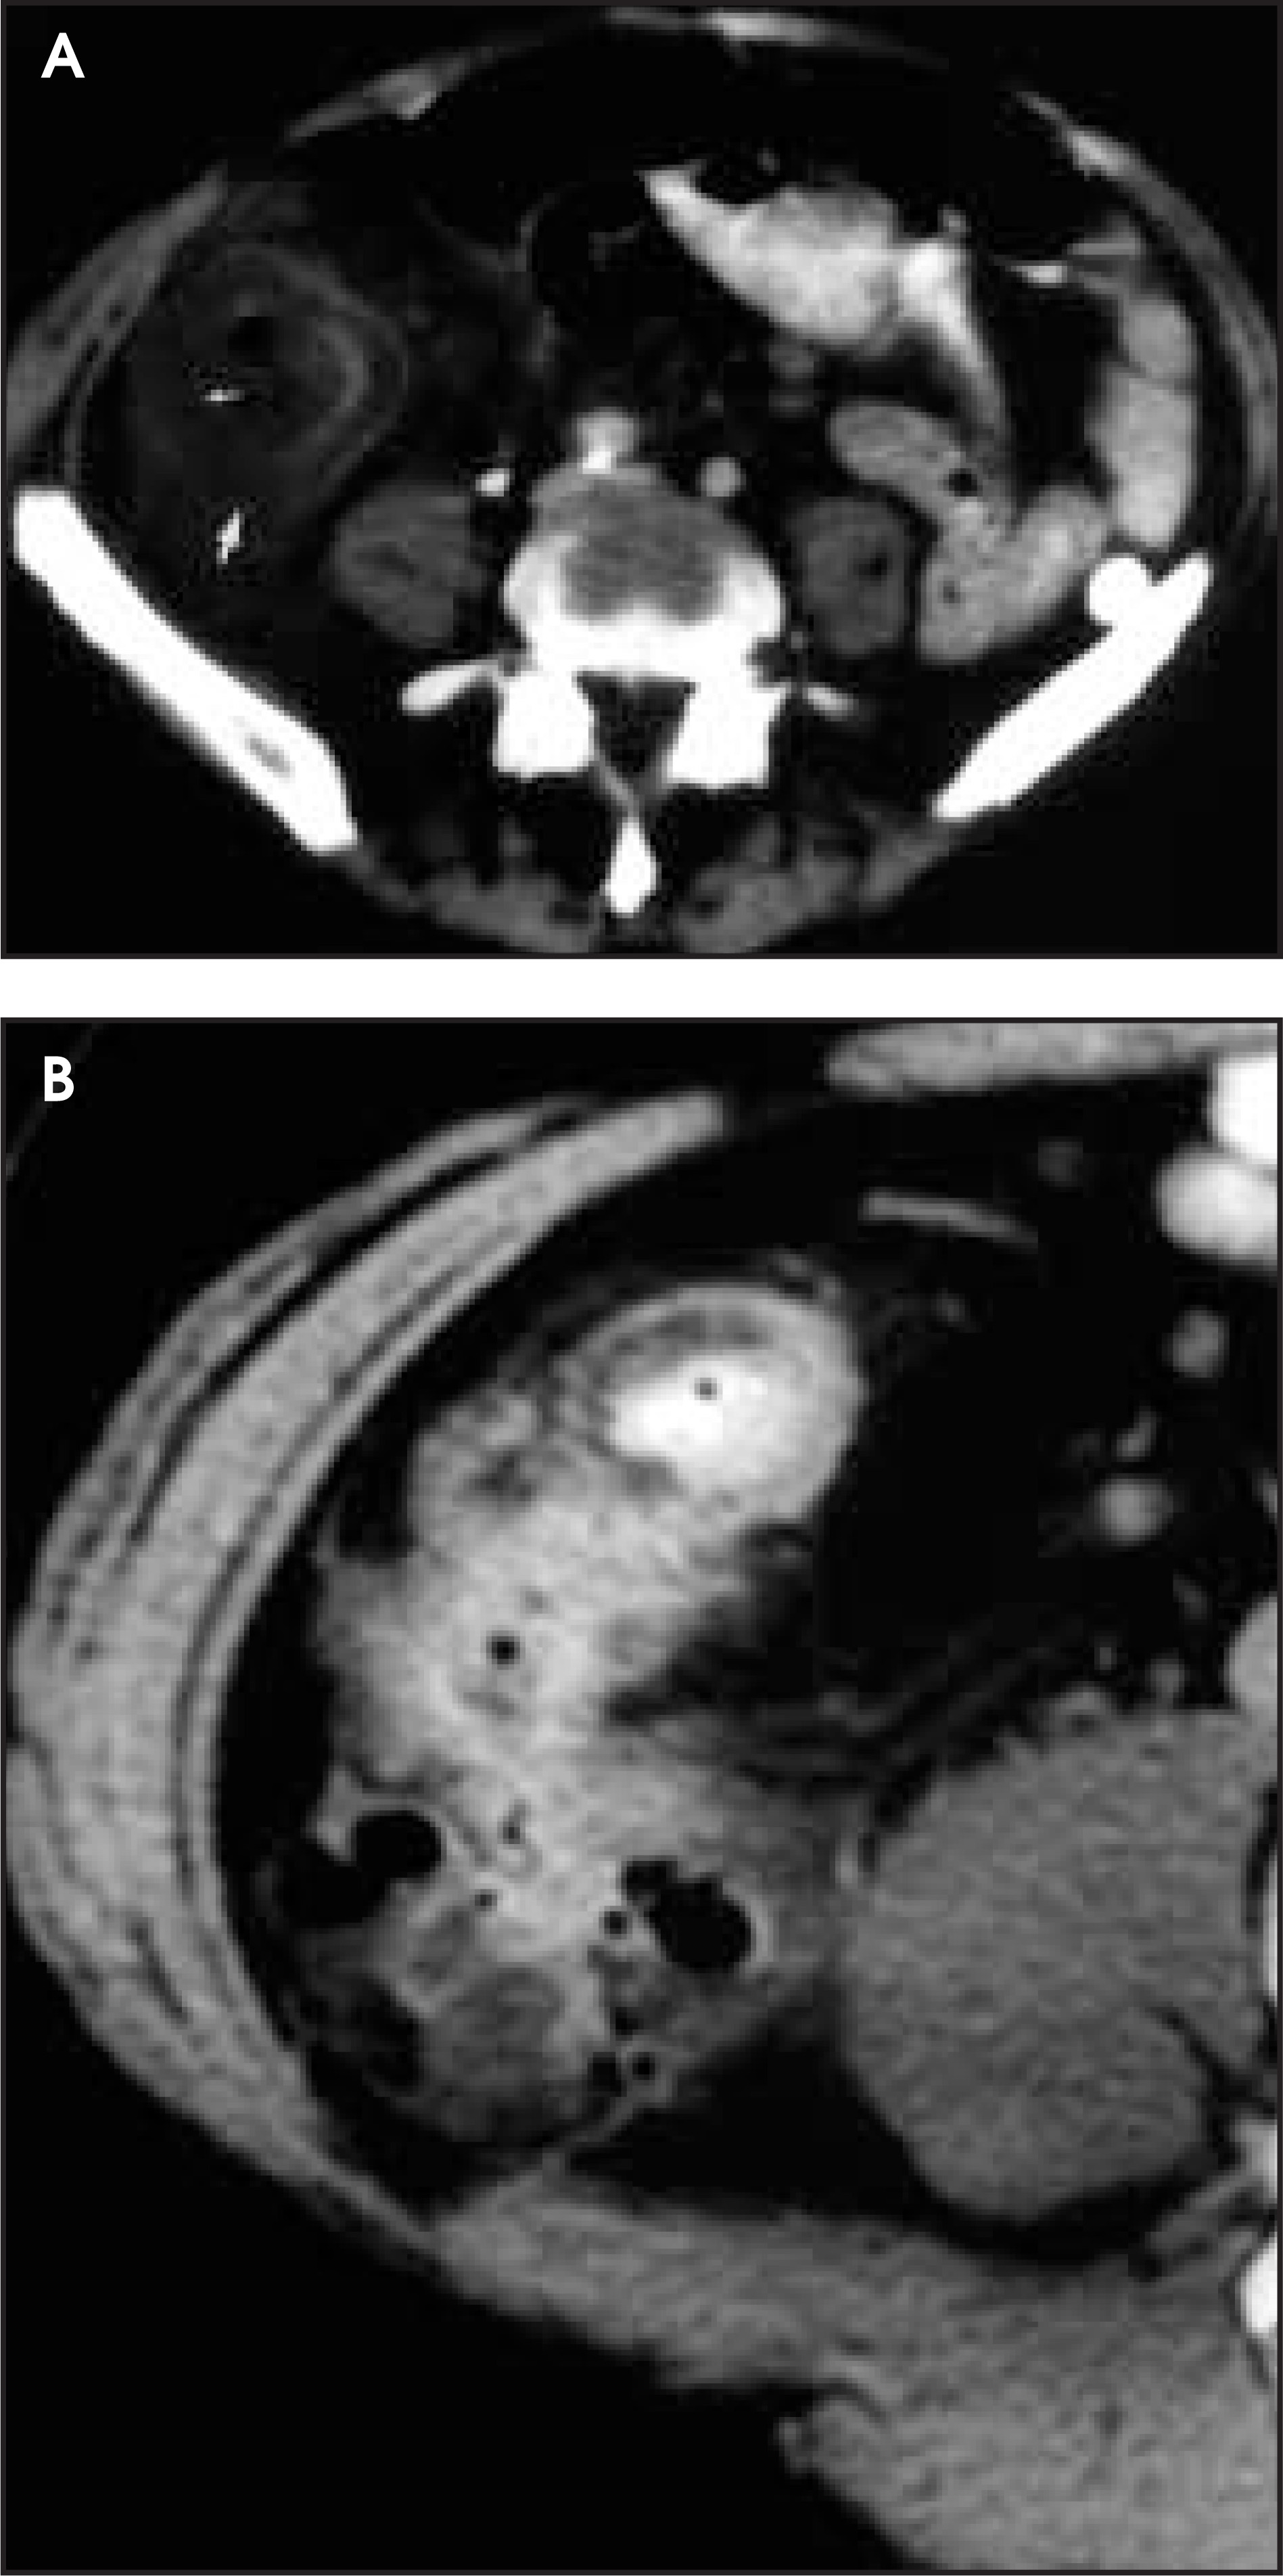
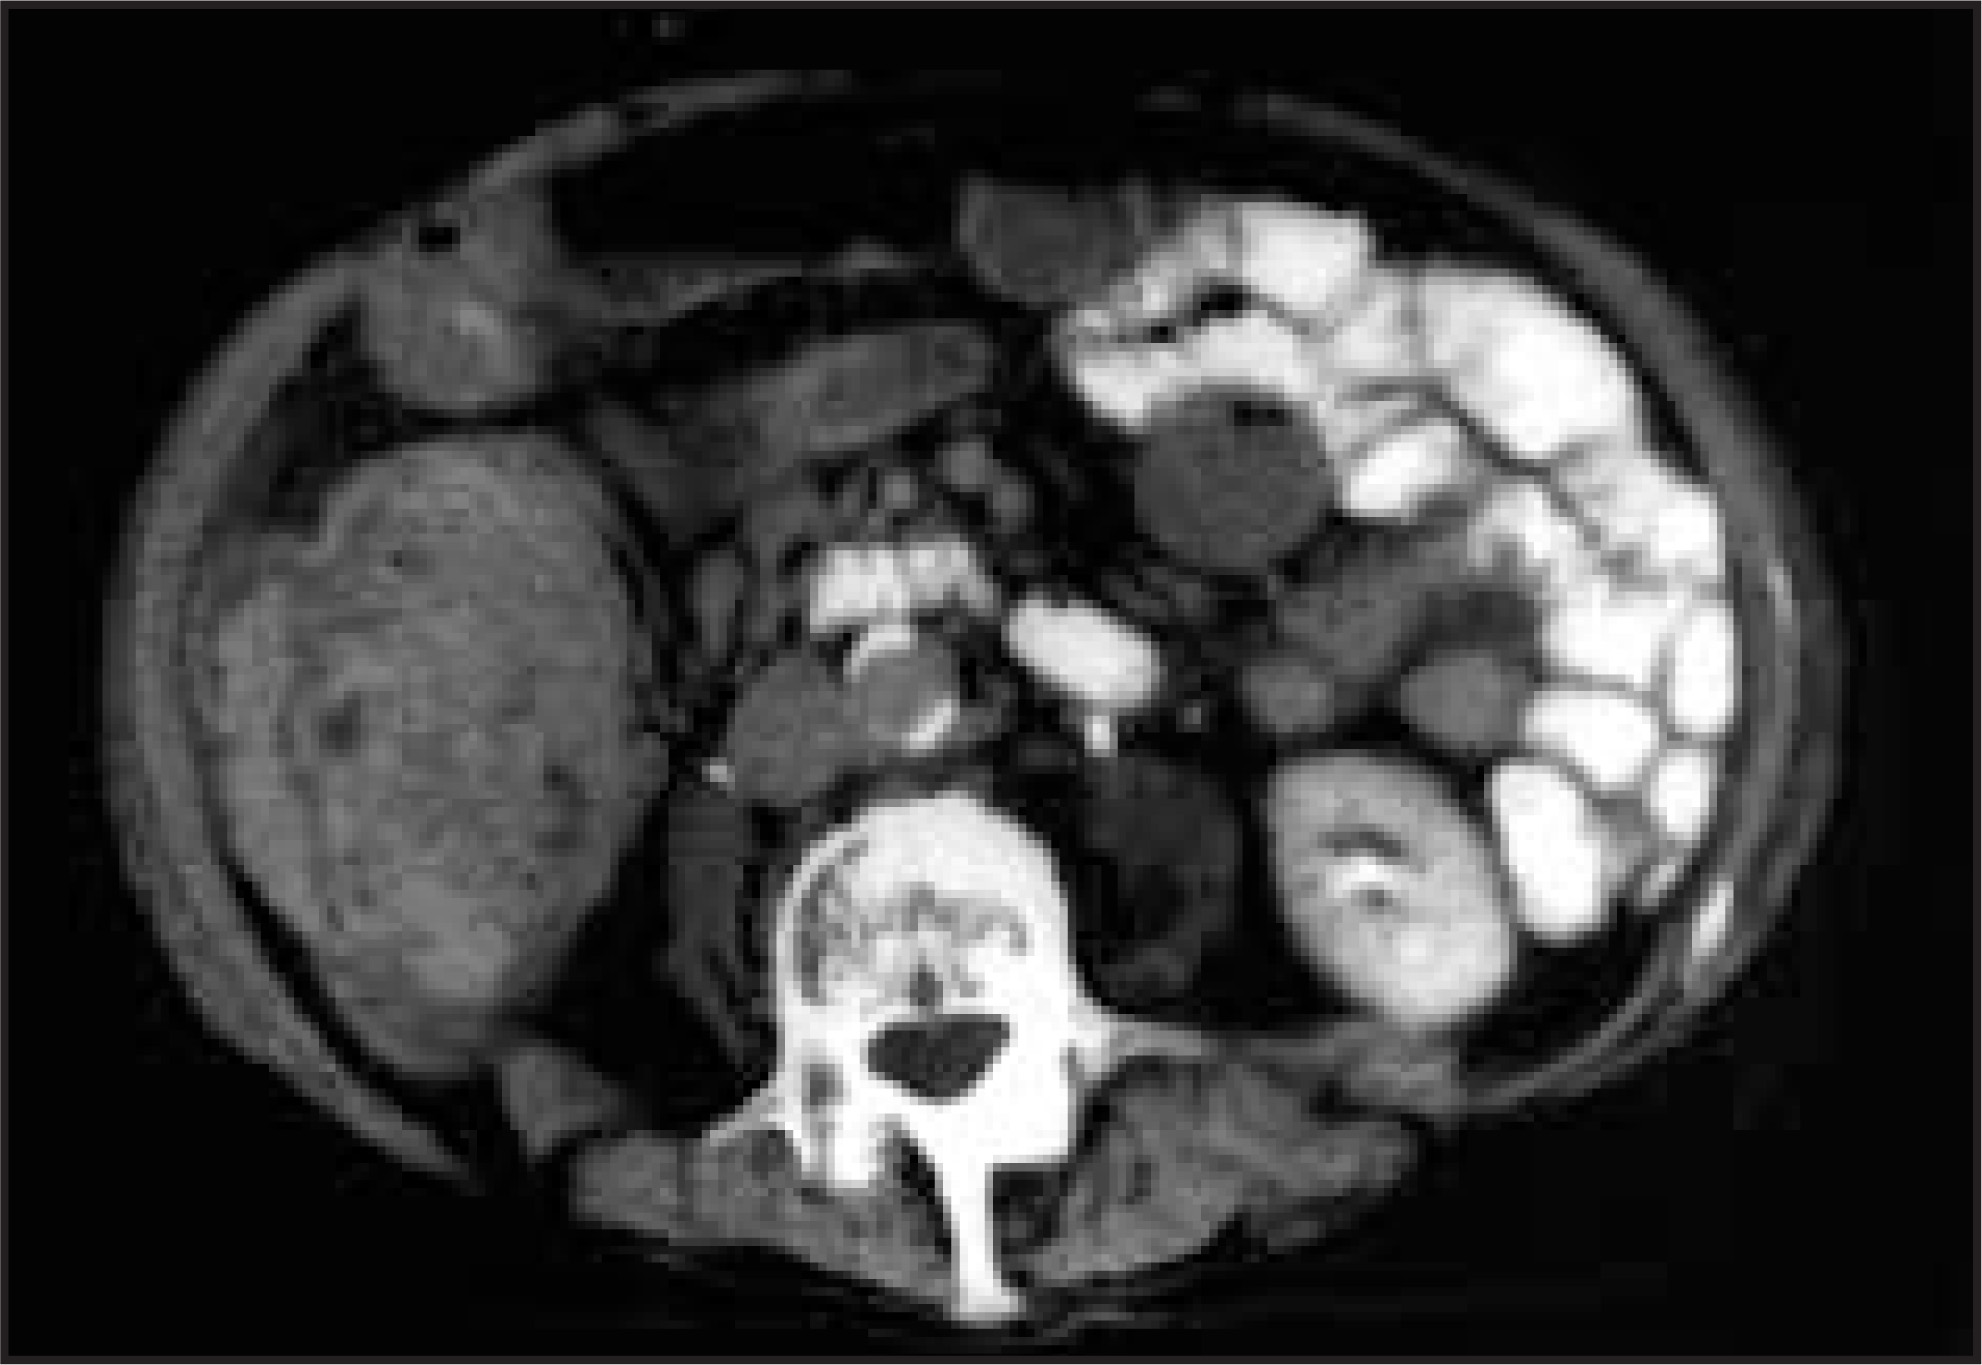
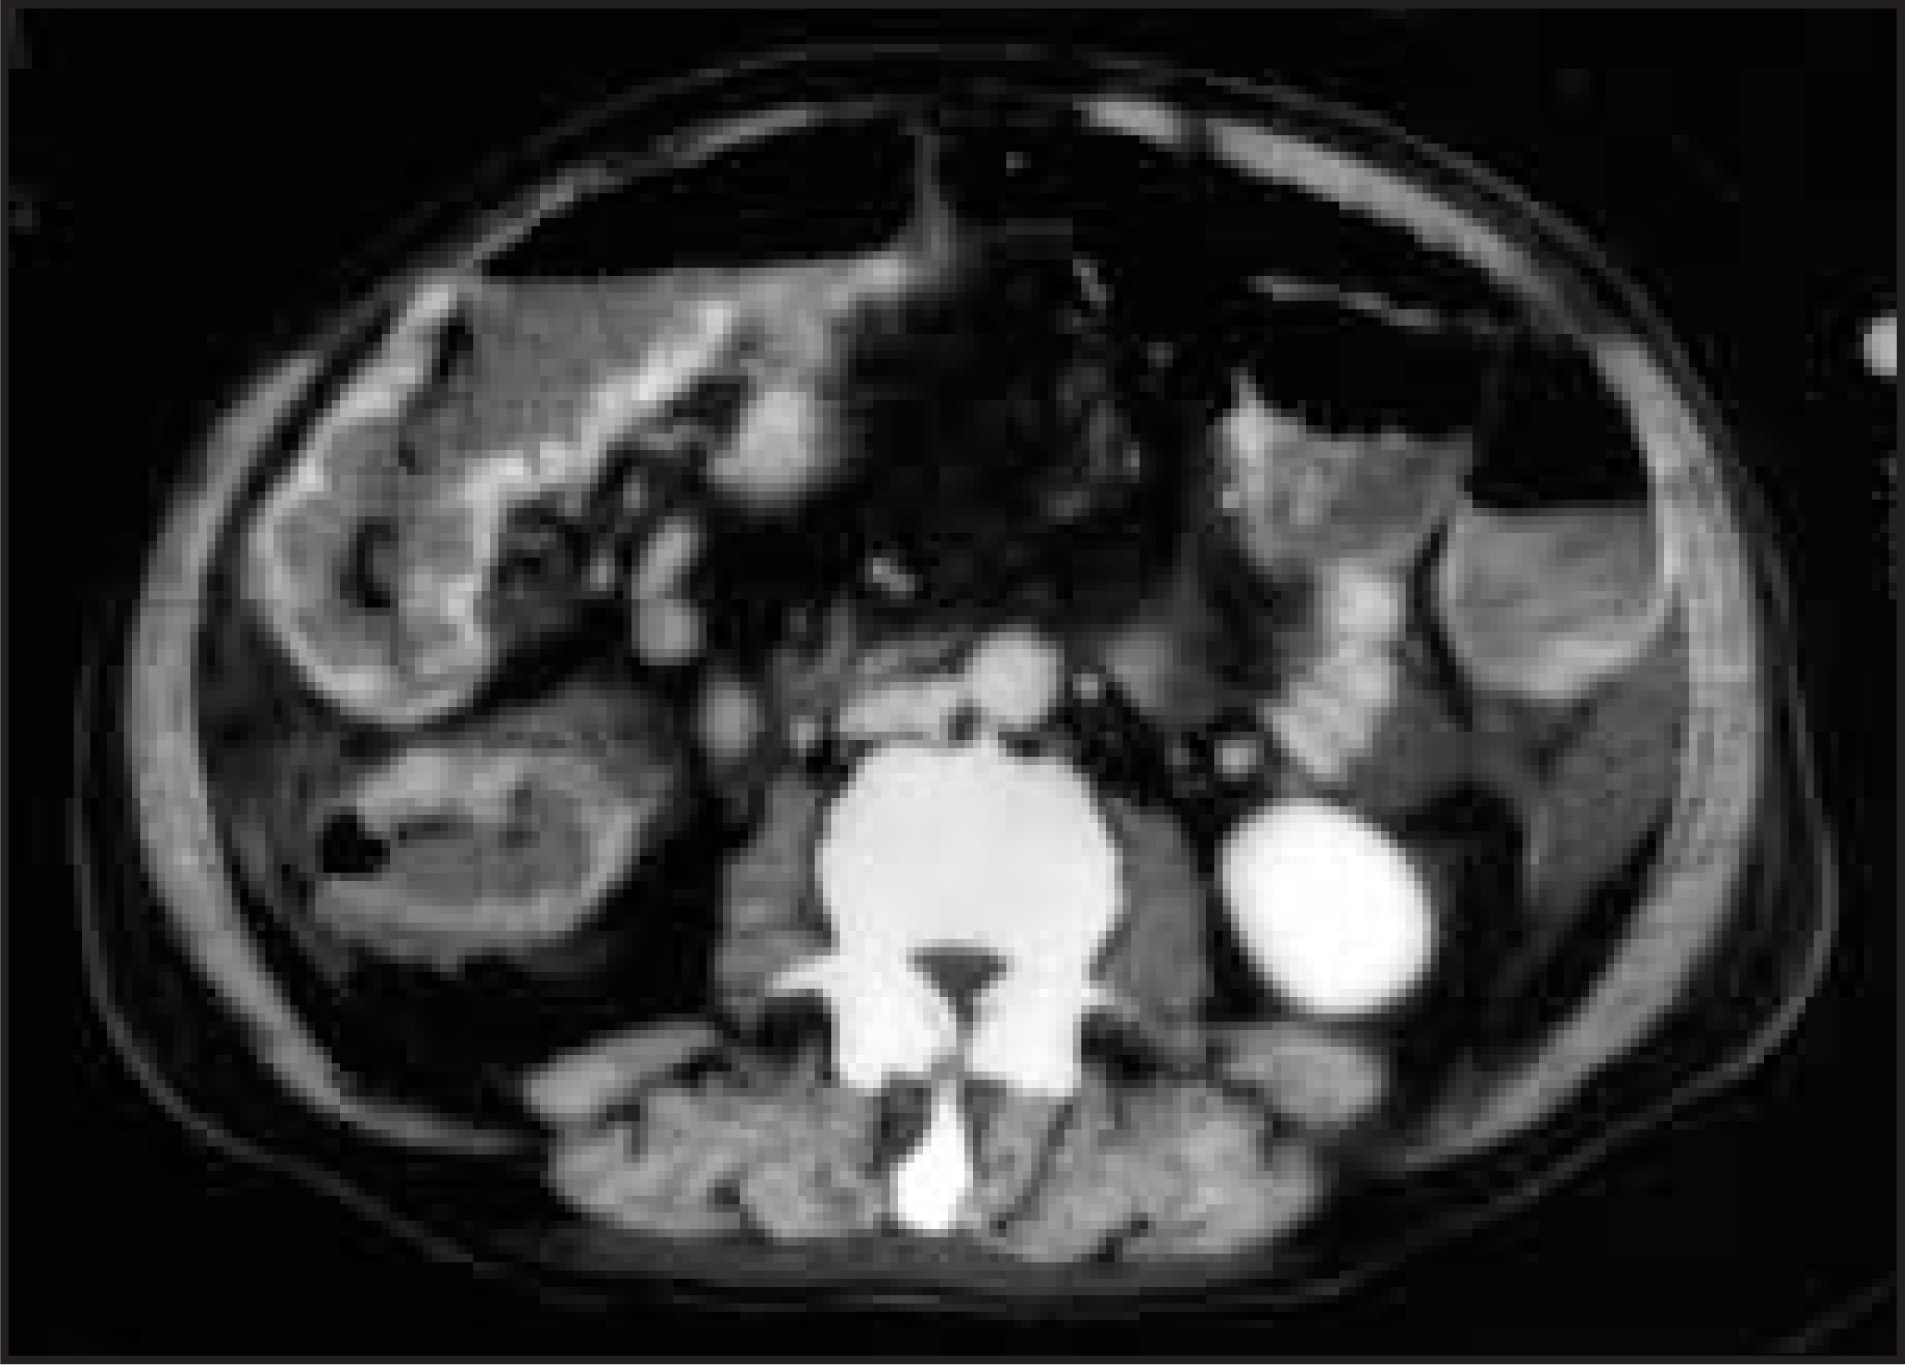
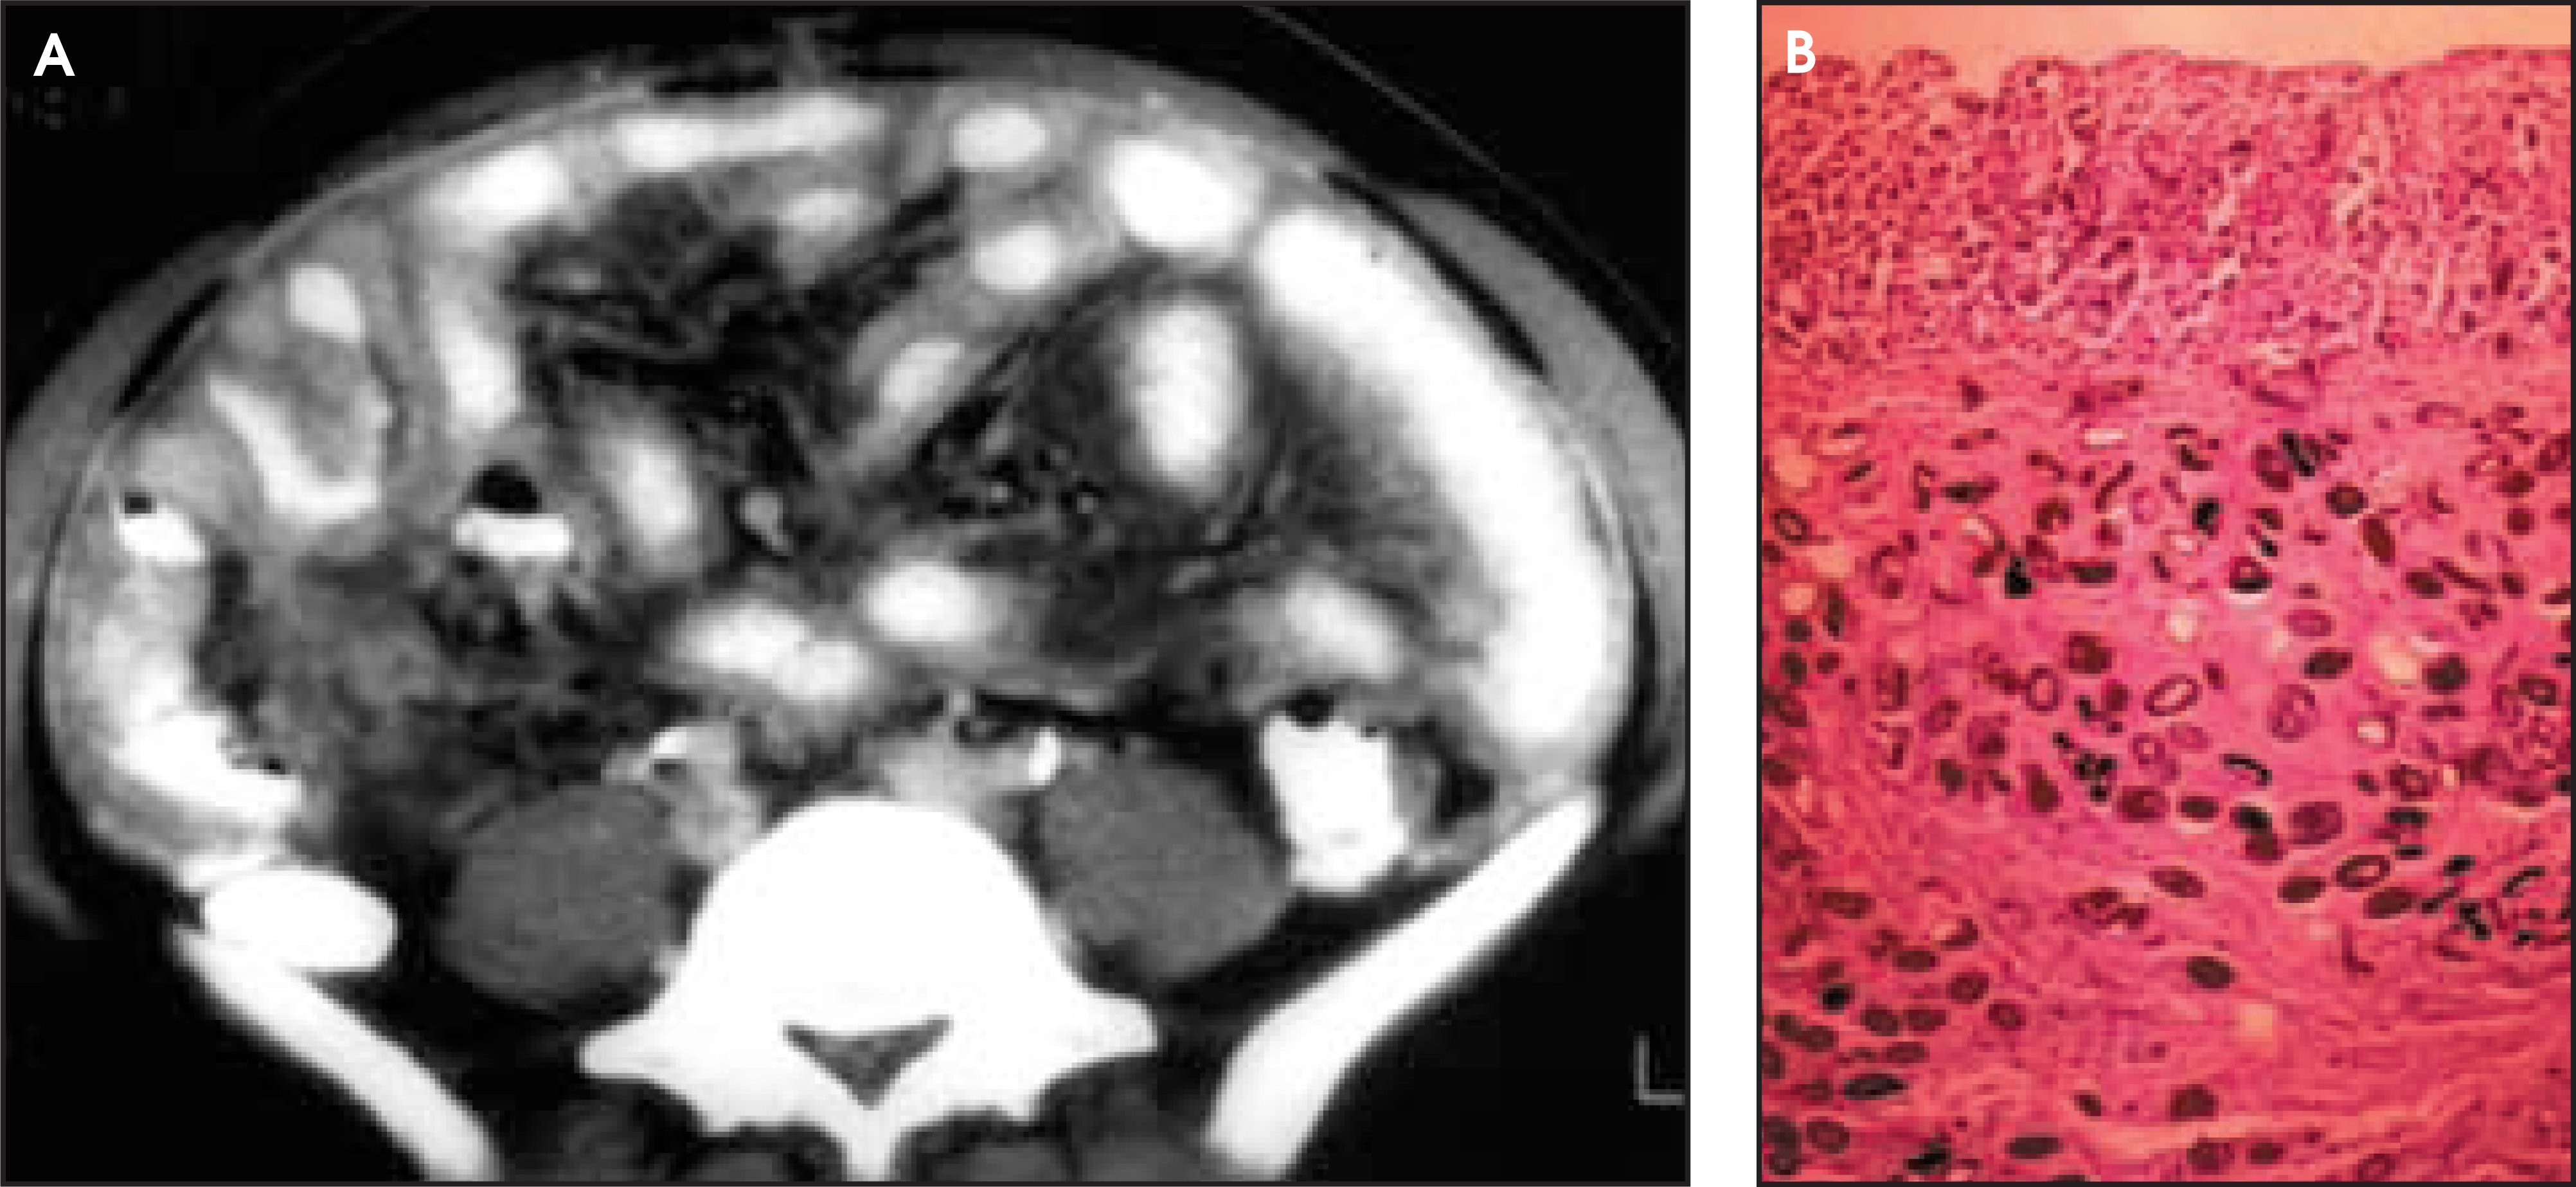
There are three notable variations of mural stratification in patients with inflammatory cell infiltration of the bowel wall that have been found in the archives. First, as previously mentioned, in cases of overwhelming infection, breakdown of the usually complete concentric ring structure may occur, signaling that surgical or interventional management may be necessary (figure 9B). This “broken-ring appearance” can be mimicked by lymphoma and adenocarcinoma. whether or not it is associated with inflammation (figure 10). Second, with overwhelming infectious disease, an intense, “shaggy-wall” appearance can be seen. Examples of this appearance have been noted in the archive with pseudomembranous colitis secondary to C difficile, amebiasis, tuberculosis (both M tuberculosis and avium complex) and cytomegalovirus (CMV) (figure 11). Third, patients with intestinal parasites with wall inflammation caused by Strongyloides stercoralis and Schistosoma mansoni or S japonicum have a “fuzzy-gut” enhancing pattern instead of distinct mural stratification (figure 12). It is the authors’ opinion that the eggs of schistosomiasis that are discharged into the portal venous system and come to lie within the intestinal wall cause a generalized, partial obstruction of the small peripheral venules. In combination with a mild inflammatory response, venule obstruction may account for the shaggy, slightly enhancing, obliteration of the stratified rings.
Ischemia/infarction (edema and hemorrhage)
The most important causes of ischemia infarction are: arterial occlusion from thrombus or plaque; hypoperfusion in the face of proximal arterial stenosis potentiated by myocardial infarction, dehydration, bradycardia, etc.; proximal venous thrombosis or venous occlusion from torsion or closed loop obstruction; and peripheral vasculopath.
1,8,9
Edema and hemorrhage expand the submucosal tissues following capillary breakdown and create the classic appearance of mural stratification.
1
Described as homogeneous wall thickening or the target sign, mural stratification can be seen in both cross-section and in longitudinal fashion as a set of enhancing rings or lines separated by tissue 10 to 40 HU in density (figure 13).
1,2,8,9
Although the interposed tissue is usually of slightly higher density because of hemorrhage, the appearance may be identical to that seen in inflammatory or infectious enteritis/colitis.
8,10
It is important to remember that intestinal ischemia/ infarction is more often a surgical, as opposed to a medical, condition (figure 6 and figure 14).
8
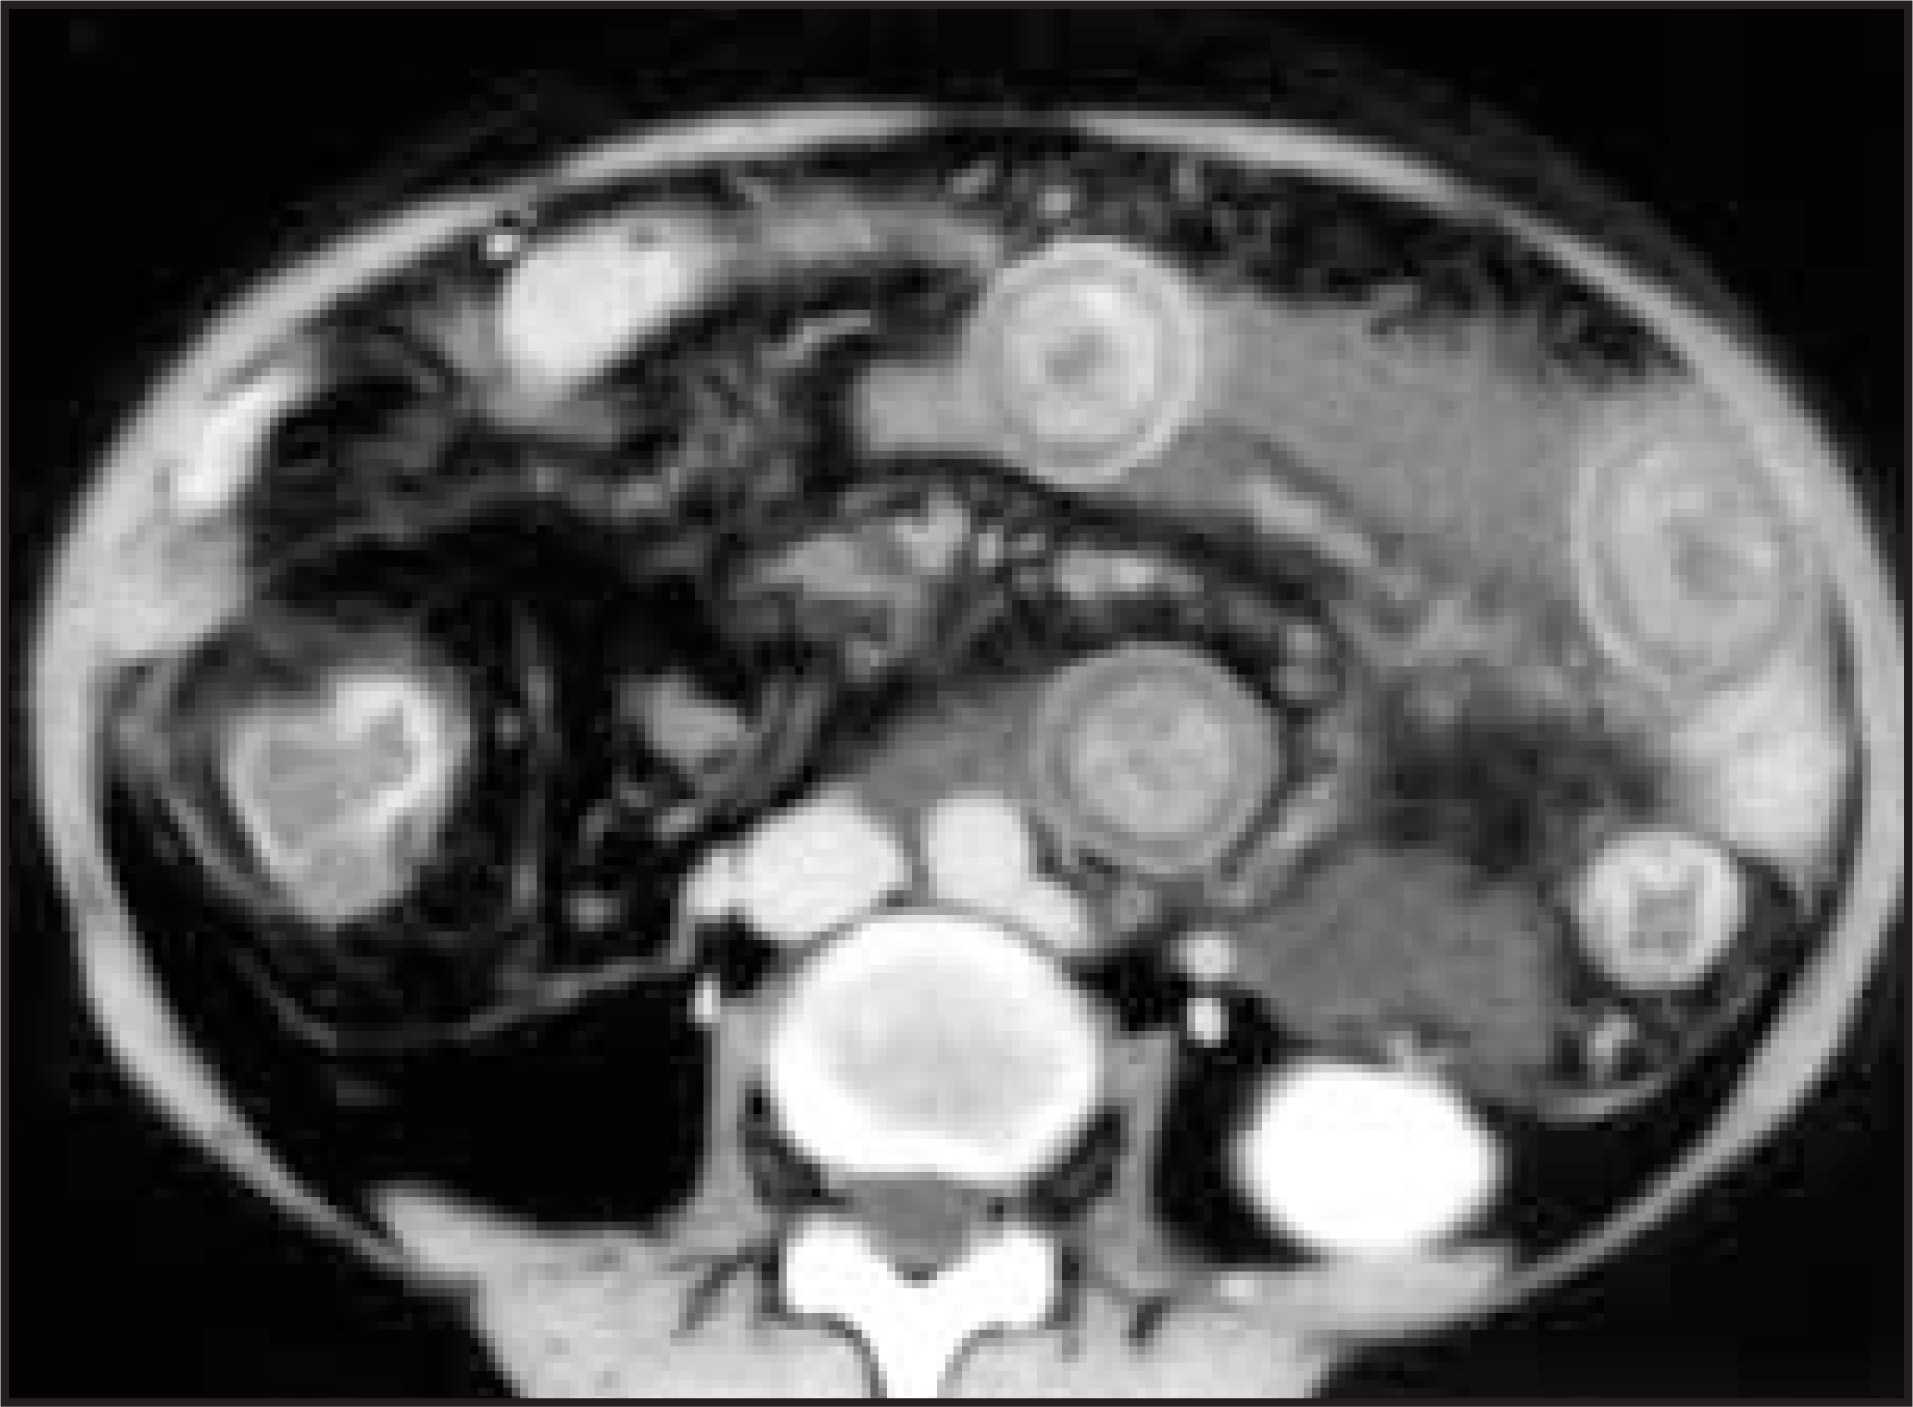
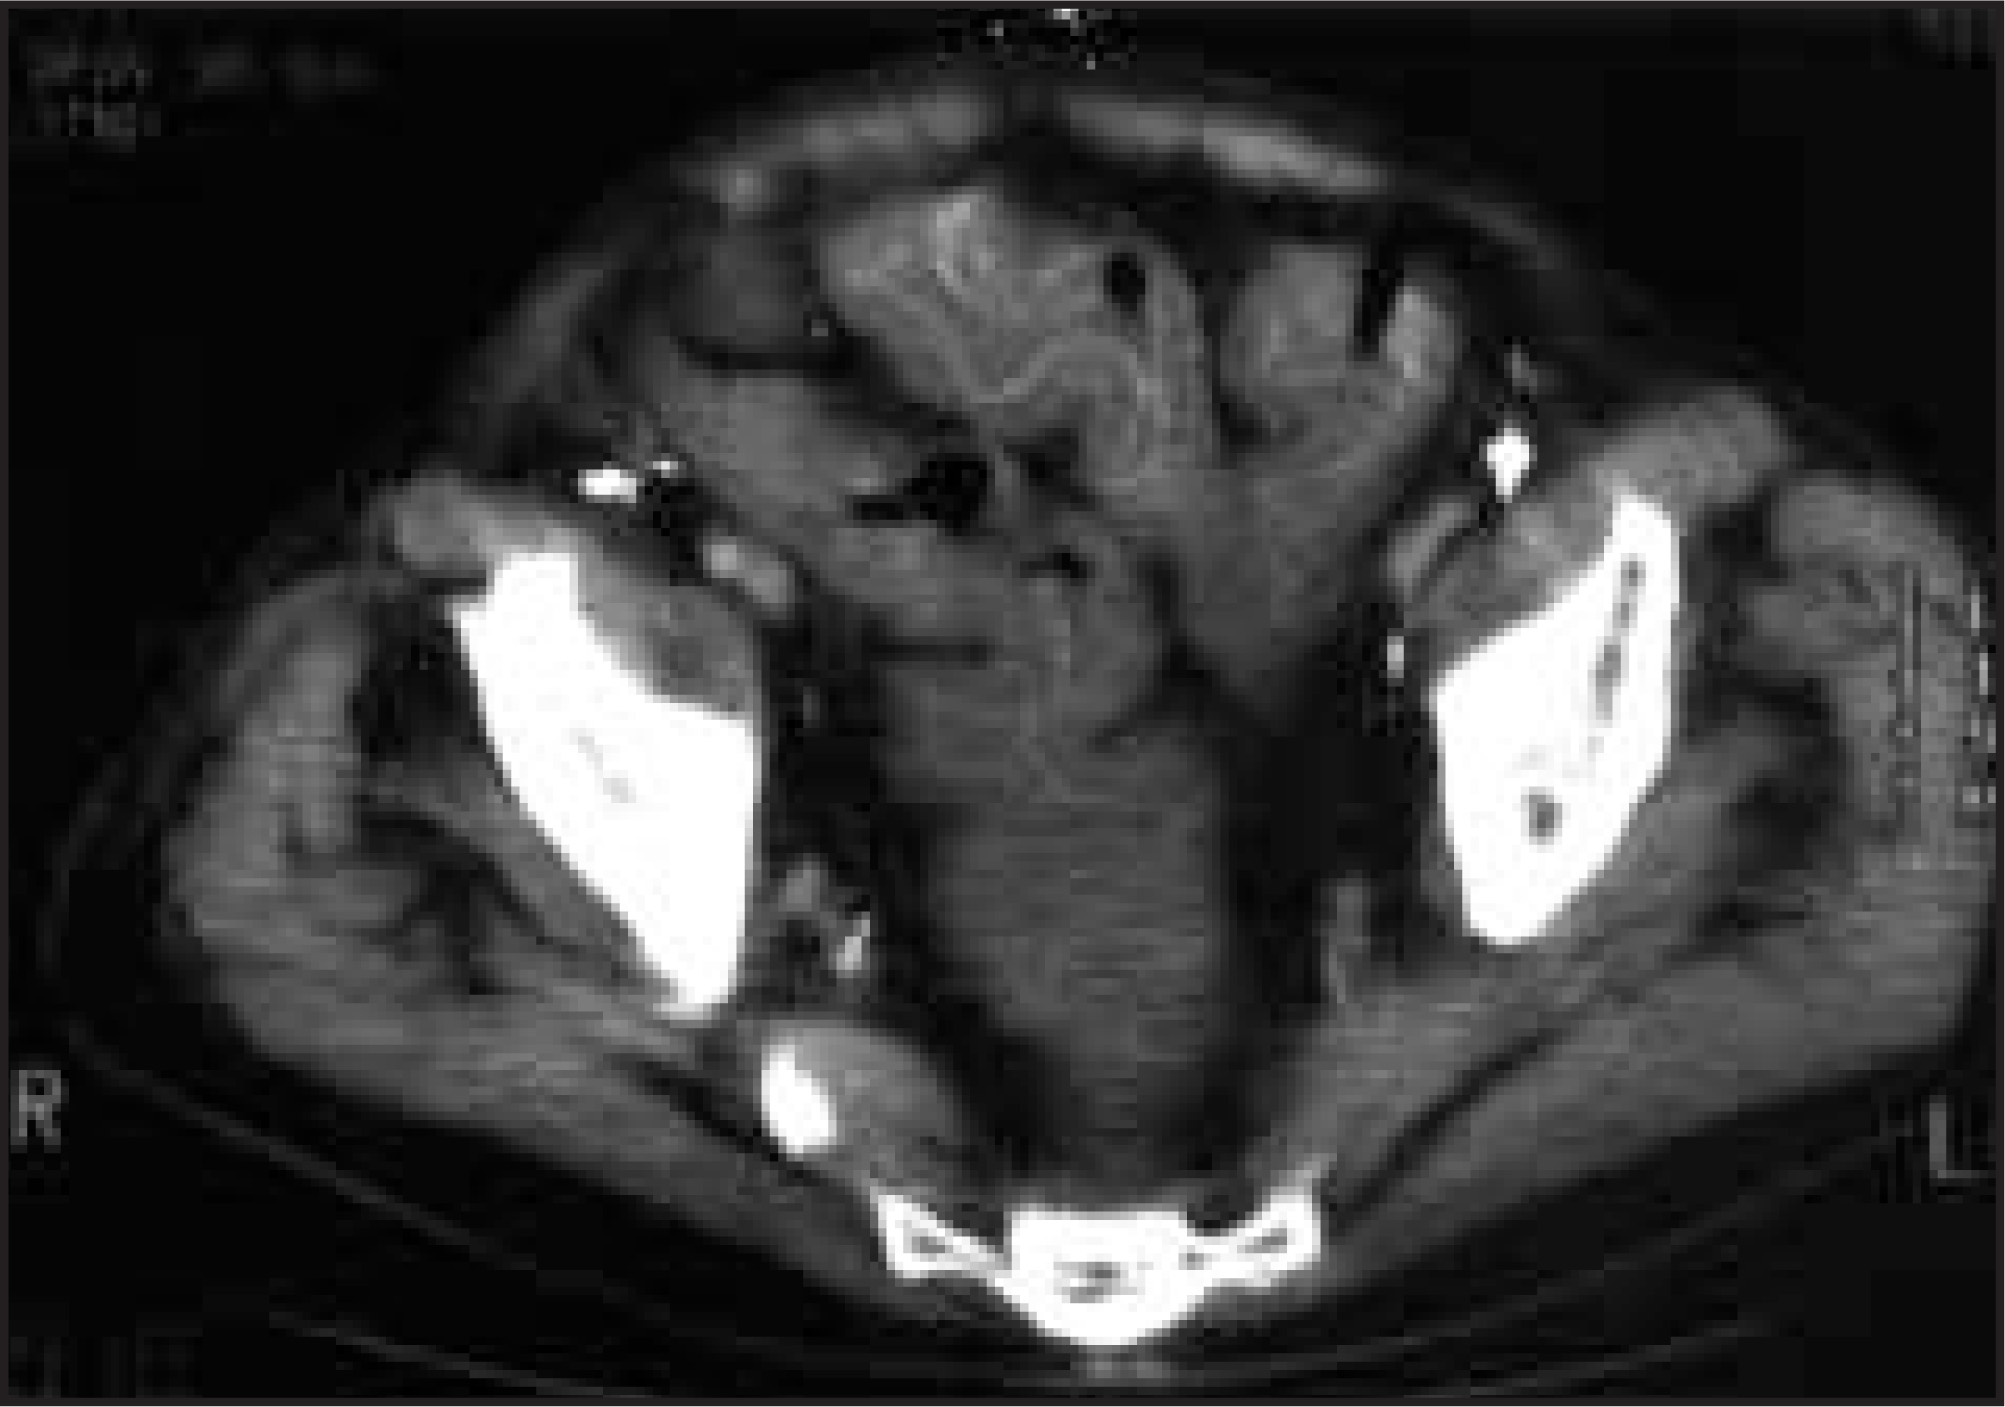
In combination with the other signs of gut ischemia listed below, mural stratification has a sensitivity of 90% for gut infarction. The specificity is only 70% to 80%, as it can be seen with varying degrees of ischemia prior to actual bowel infarction.
8,9
Therefore, emergent exploratory laparotomy is indicated in any patient with signs of ischemia, especially with closed-loop obstruction.
9
The clinical goal is to avoid resection of infarcted gut by surgically relieving the cause while the gut is still viable (figure 15).
9
The association of mural stratification with free peritoneal fluid, variable or asymmetric bowel wall enhancement, persistent enhancement of the bowel wall or segmental arteries, visible arterial or venous filling defects, increased density of the mesentery, or bowel obstruction increases the sensitivity and specificity for bowel infarction (figure 16).
8,9,11
Not well established in the literature is the usefulness of visible wall hemorrhage on noncontrast CT studies in patients with ischemic bowel (figure 17).
8,12
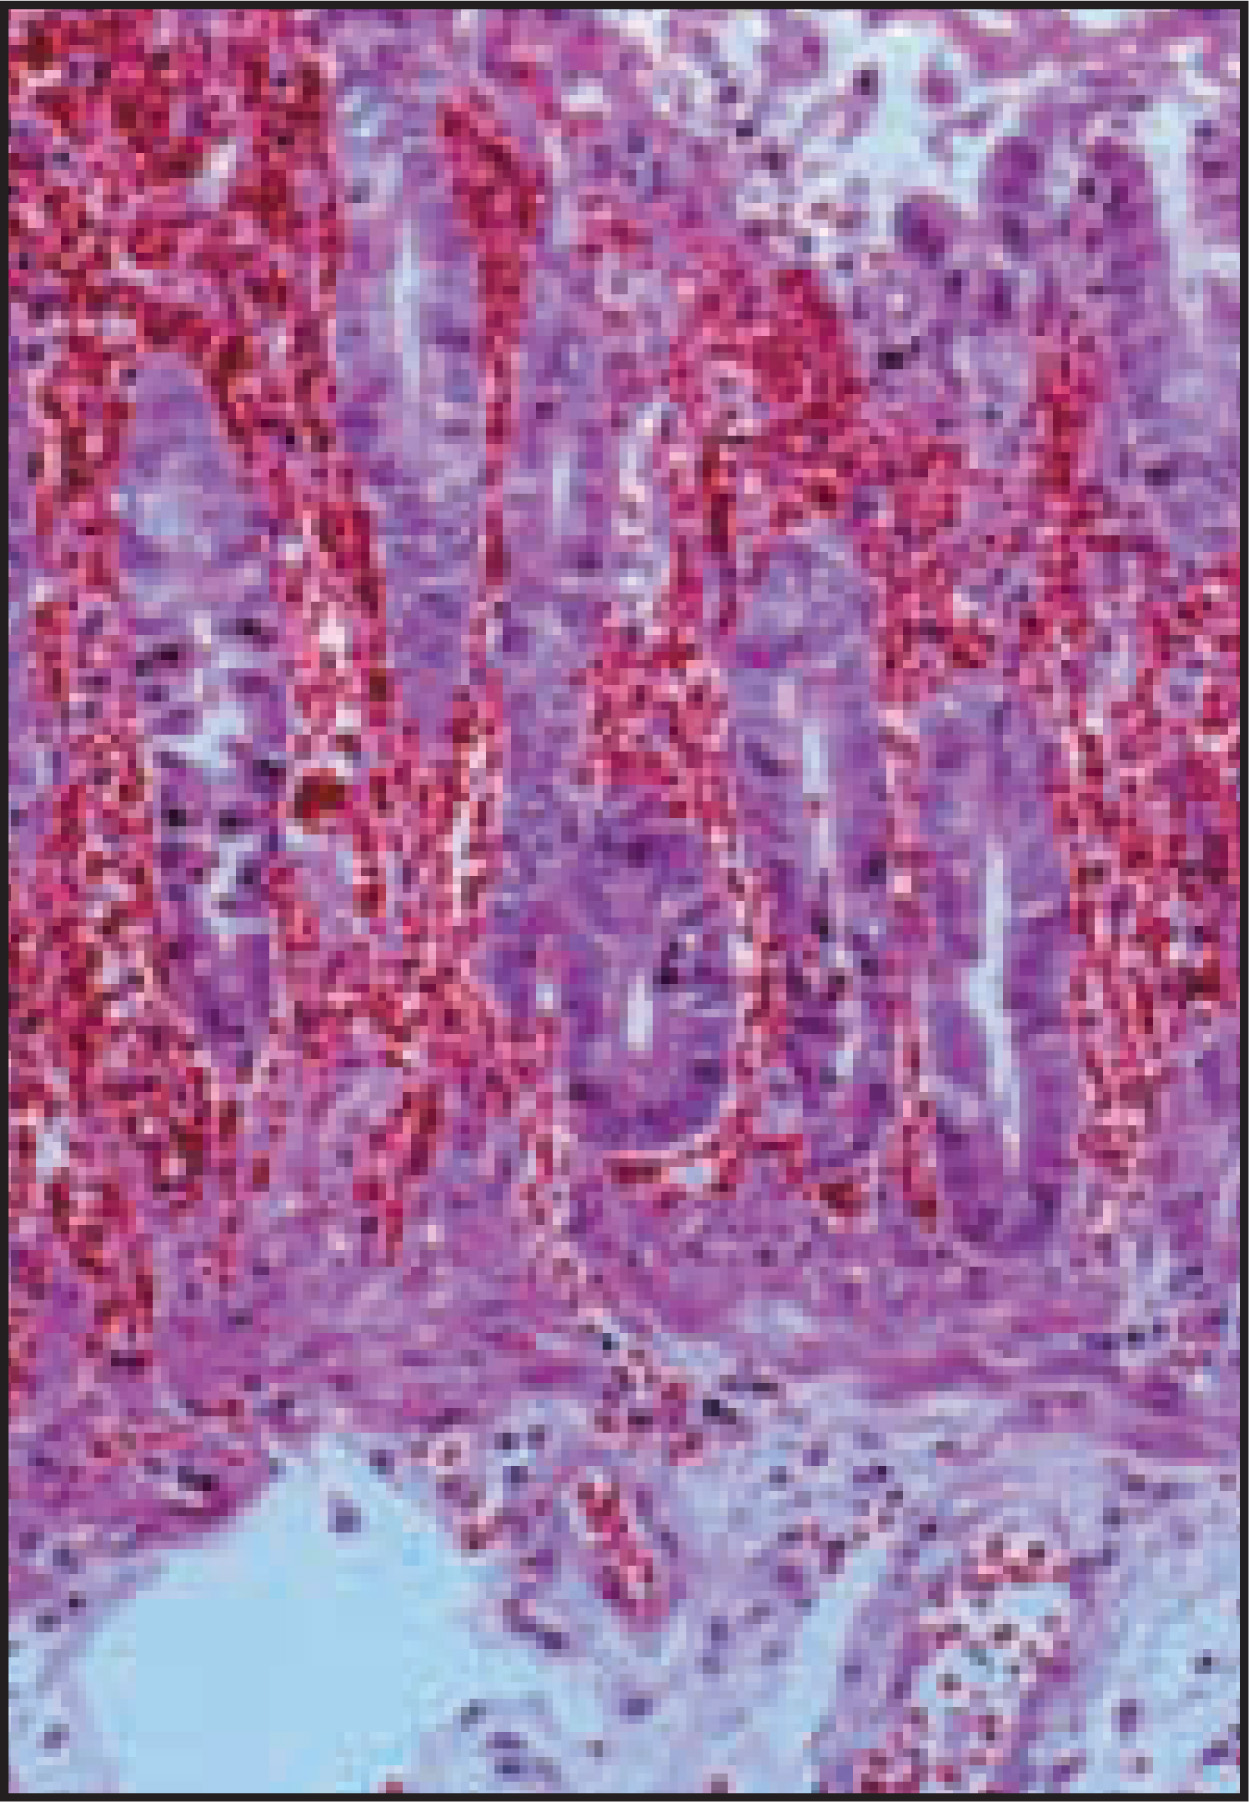
This appearance corresponds to the microscopic findings of ischemia when capillary breakdown and hemorrhage are seen in the mucosal and submucosal tissues (figure 18). It is not known to what extent bowel can recover after such ischemic changes have begun. Unfortunately noncontrast CT is rarely performed in patients with suspected gut ischemia, which would be necessary to study this interesting and potentially useful sign.
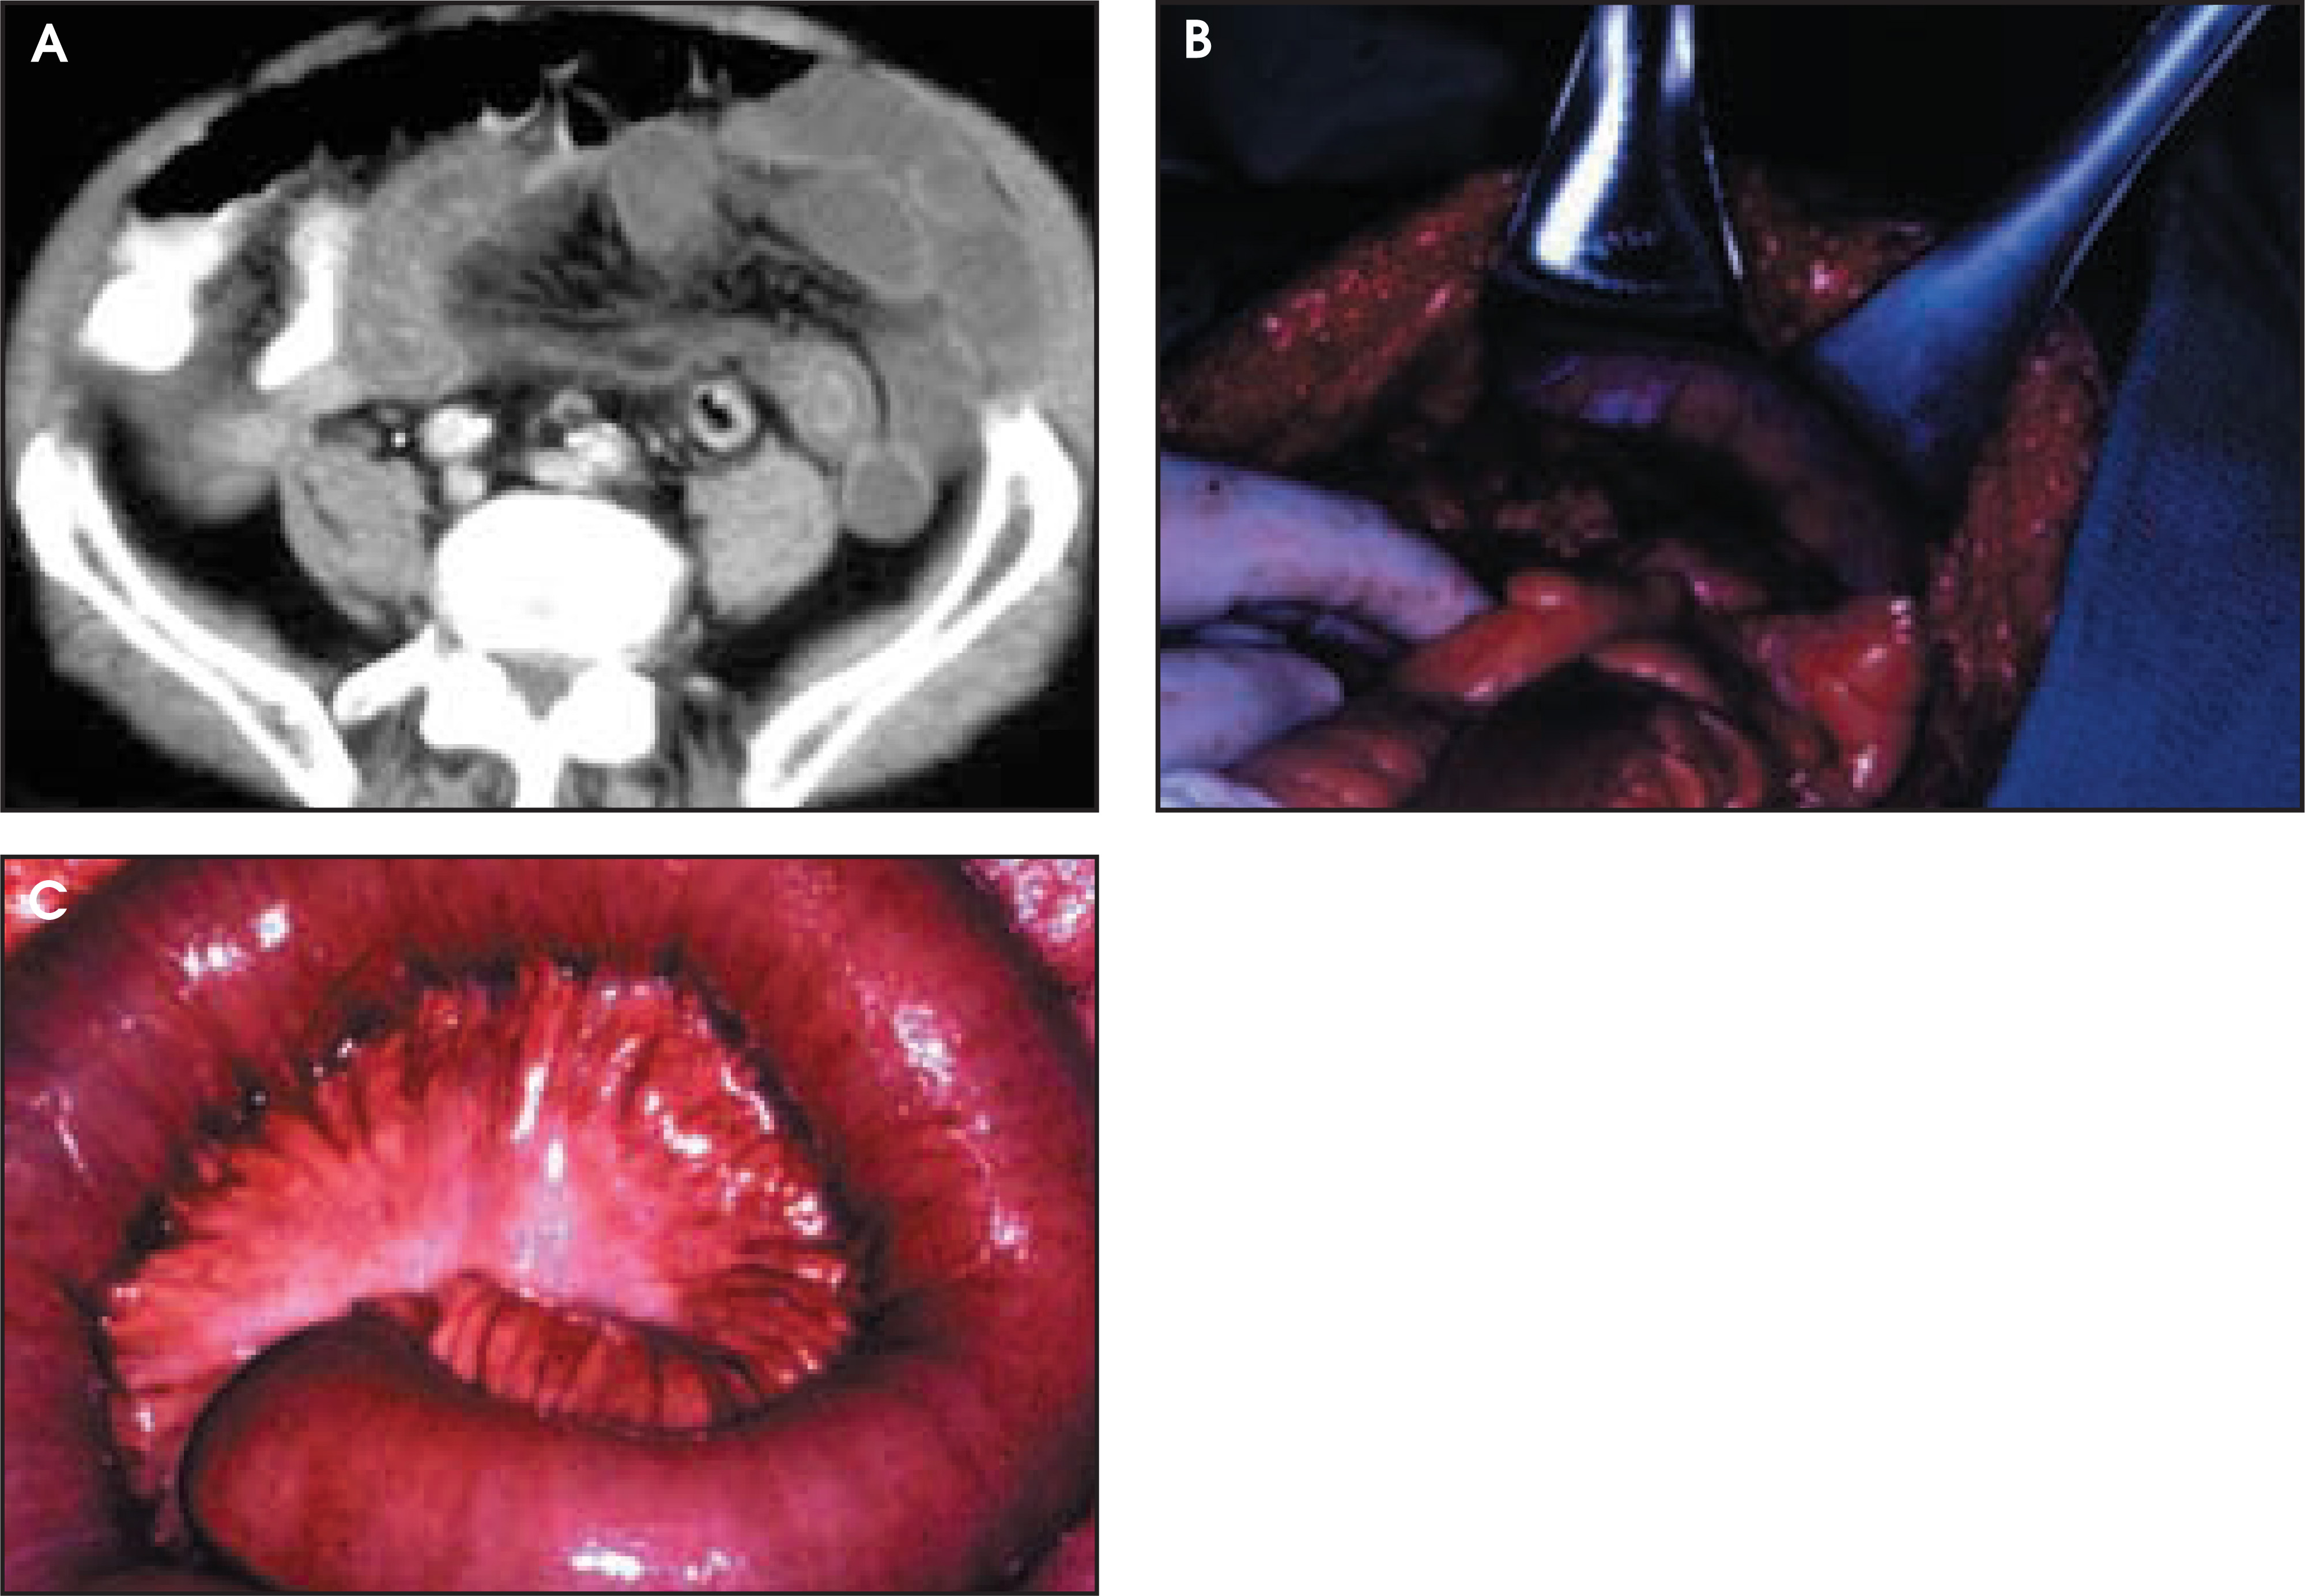
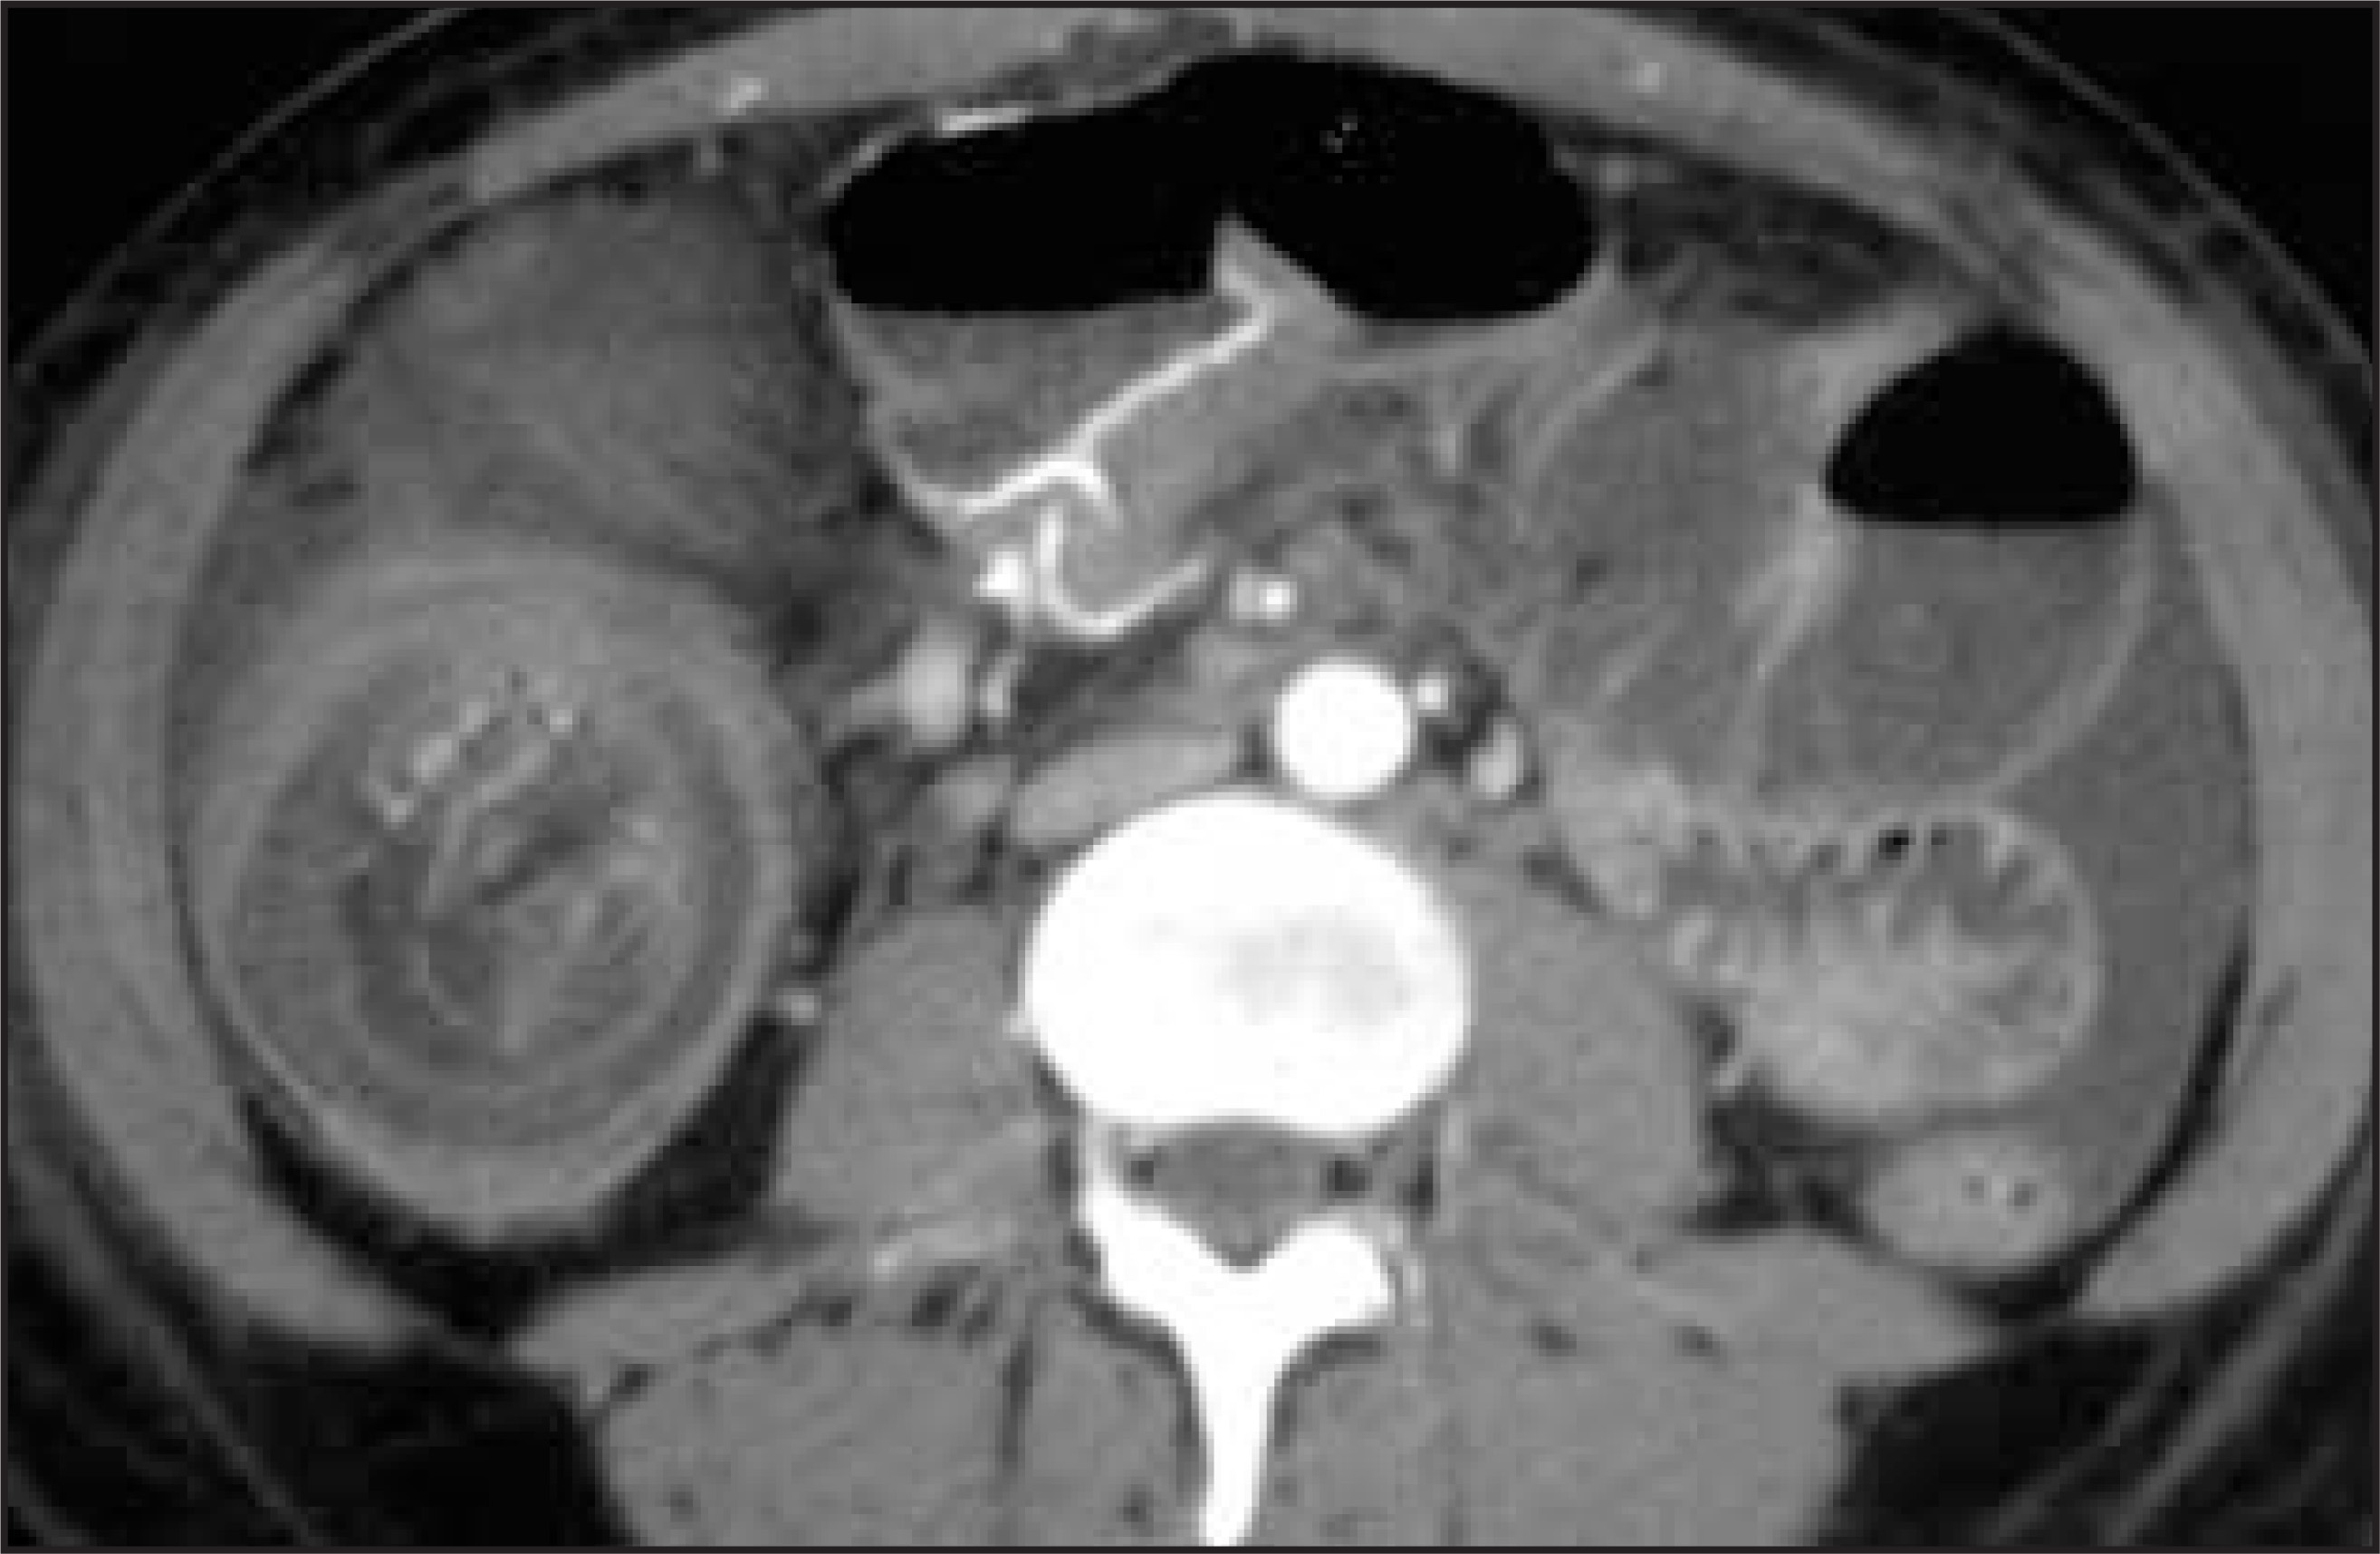
Hemorrhage
Frank hemorrhage into the gut wall has the potential to expand the loosely organized submucosa and separate the contrast-enhancing mucosa/muscularis mucosa from the muscularis propria/serosa. Patients who have been anticoagulated are well known to be at increased risk for intestinal wall hemorrhage.
8
Blunt trauma is another well-known cause, with submucosal hemorrhage causing the classic “snow-cone” appearance of the duodenum at CT.
5
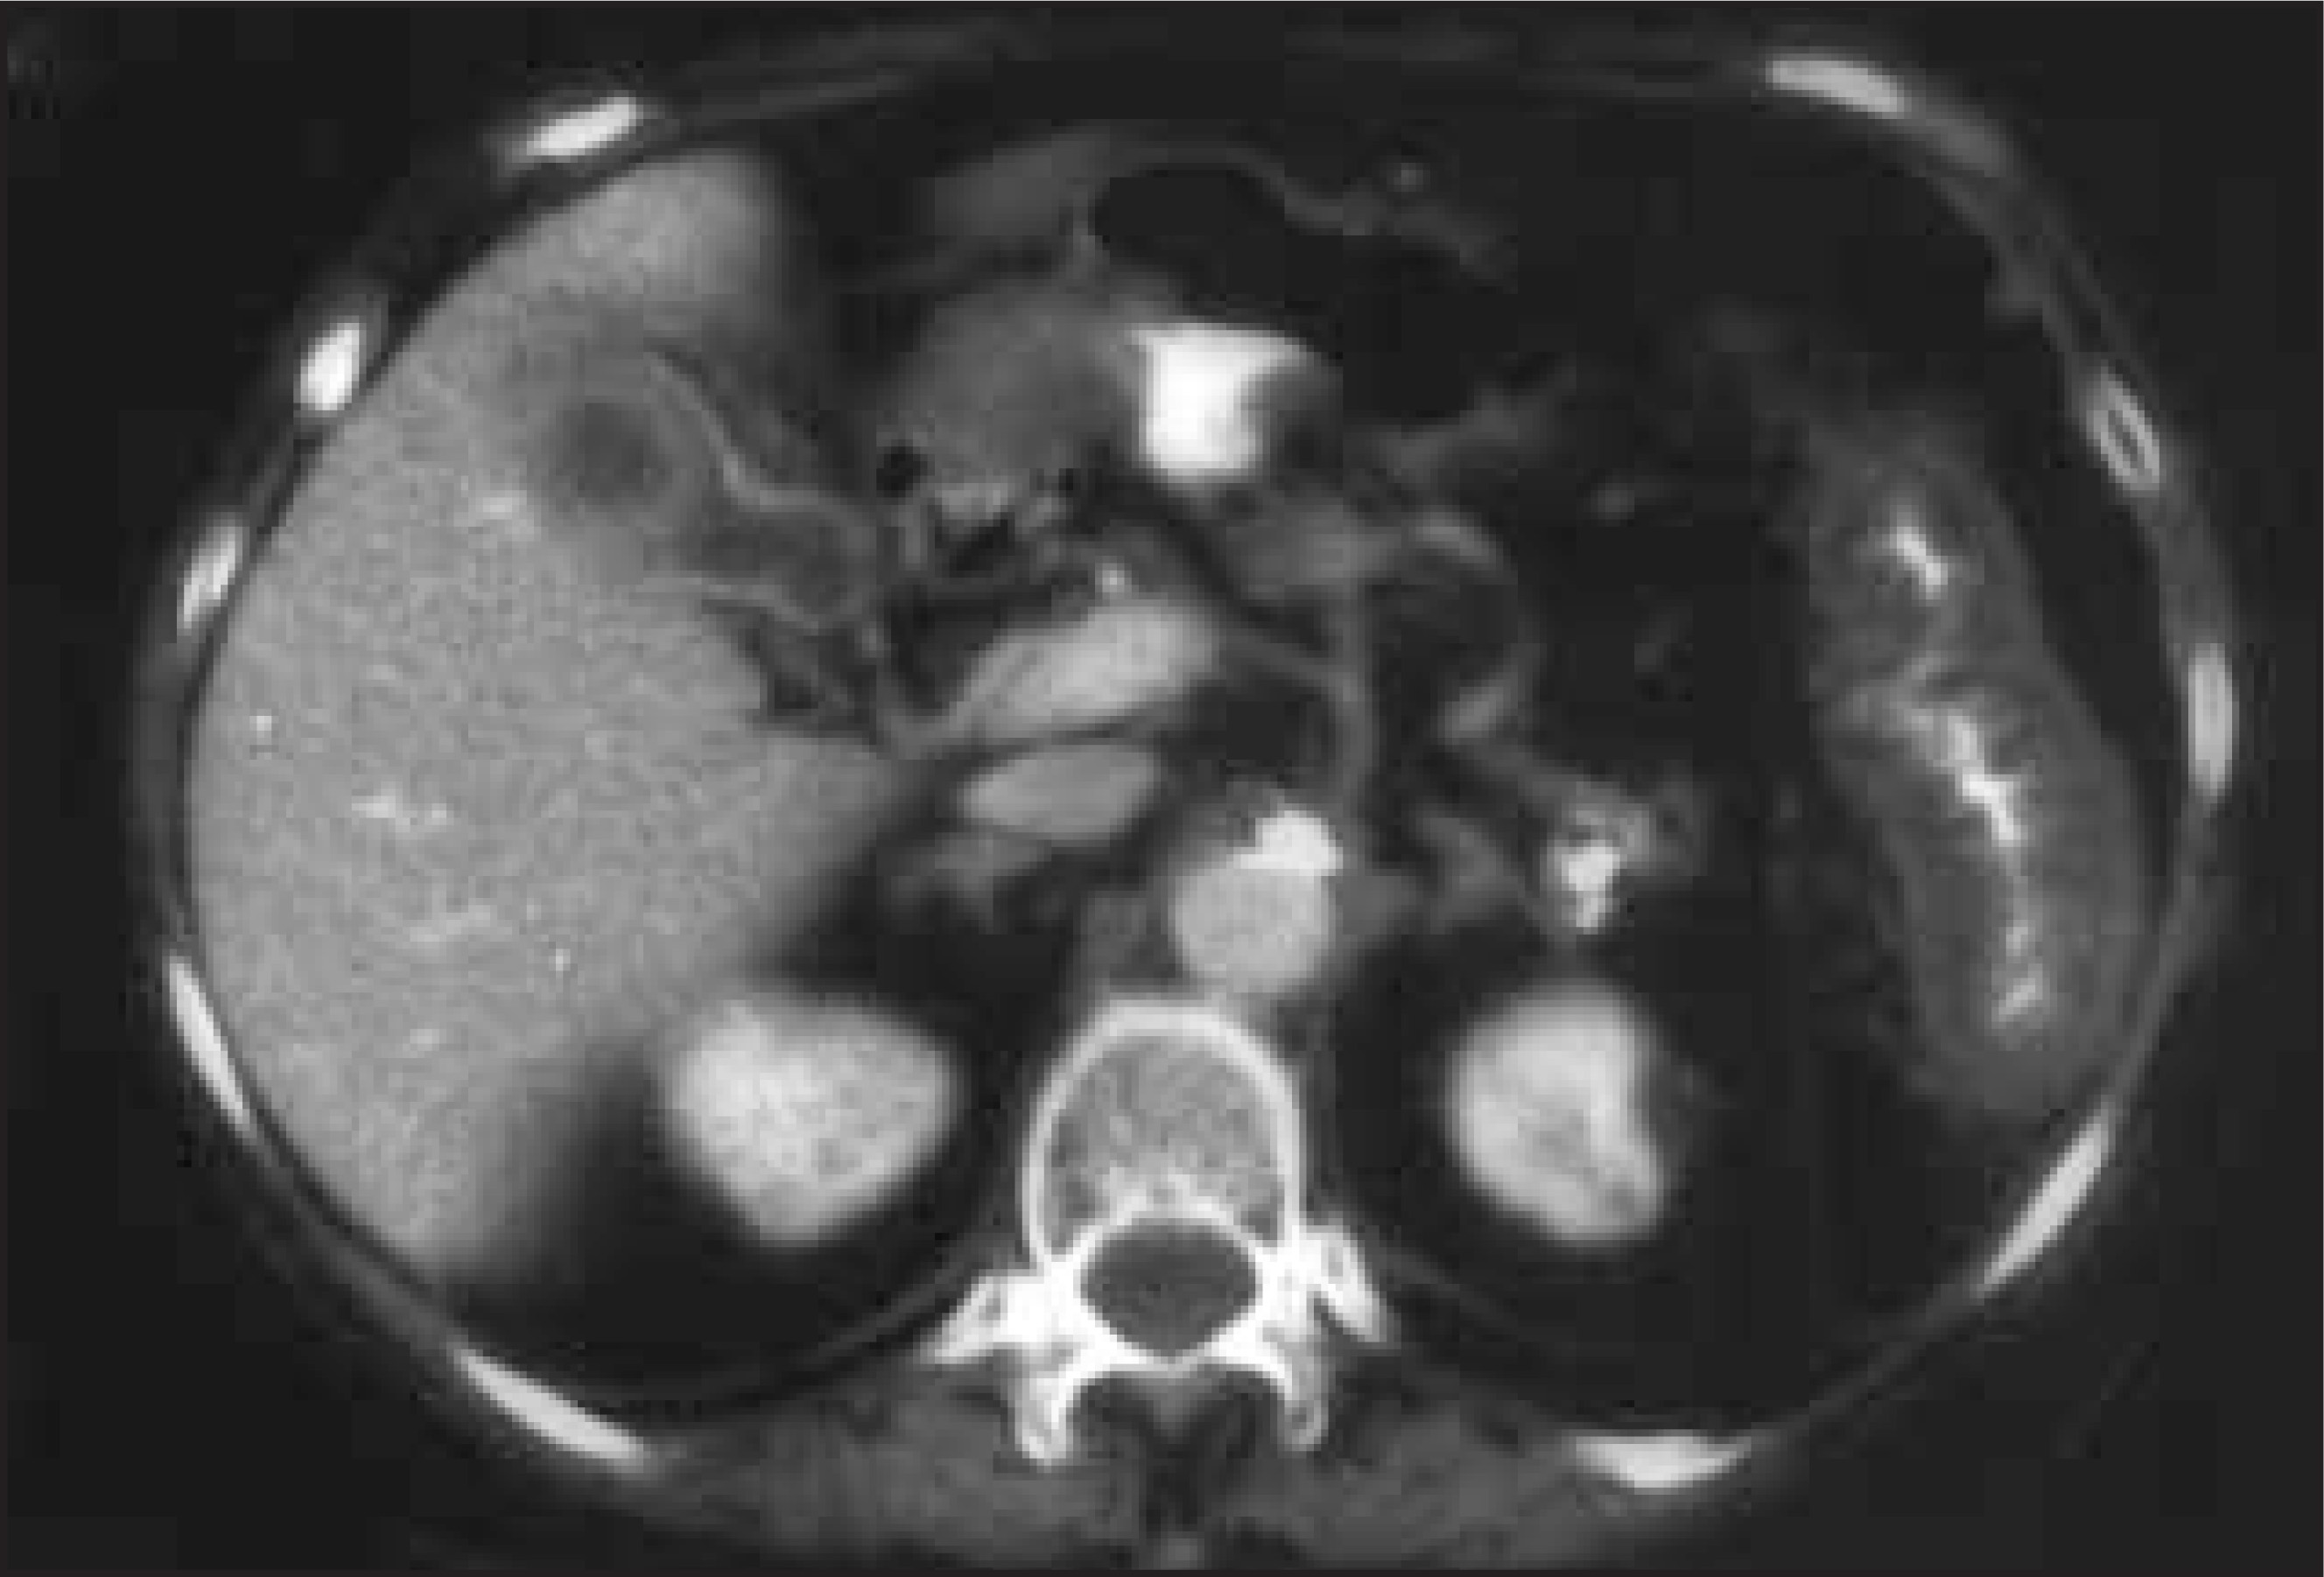
The appearance of mural stratification as a result of blunt trauma, although certainly possible, has not been reported. Bleeding into the gut wall causing mural stratification has been found in the AFIP archives among cases of thrombotic thrombocytopenic purpura (figure 19). In the event of hemorrhage, unrelated to ischemia, mural stratification would again suggest medical management rather than surgical intervention. Such hemorrhagic conditions generally resolve spontaneously with medical therapy.
The extreme of mural stratification
The accordion sign
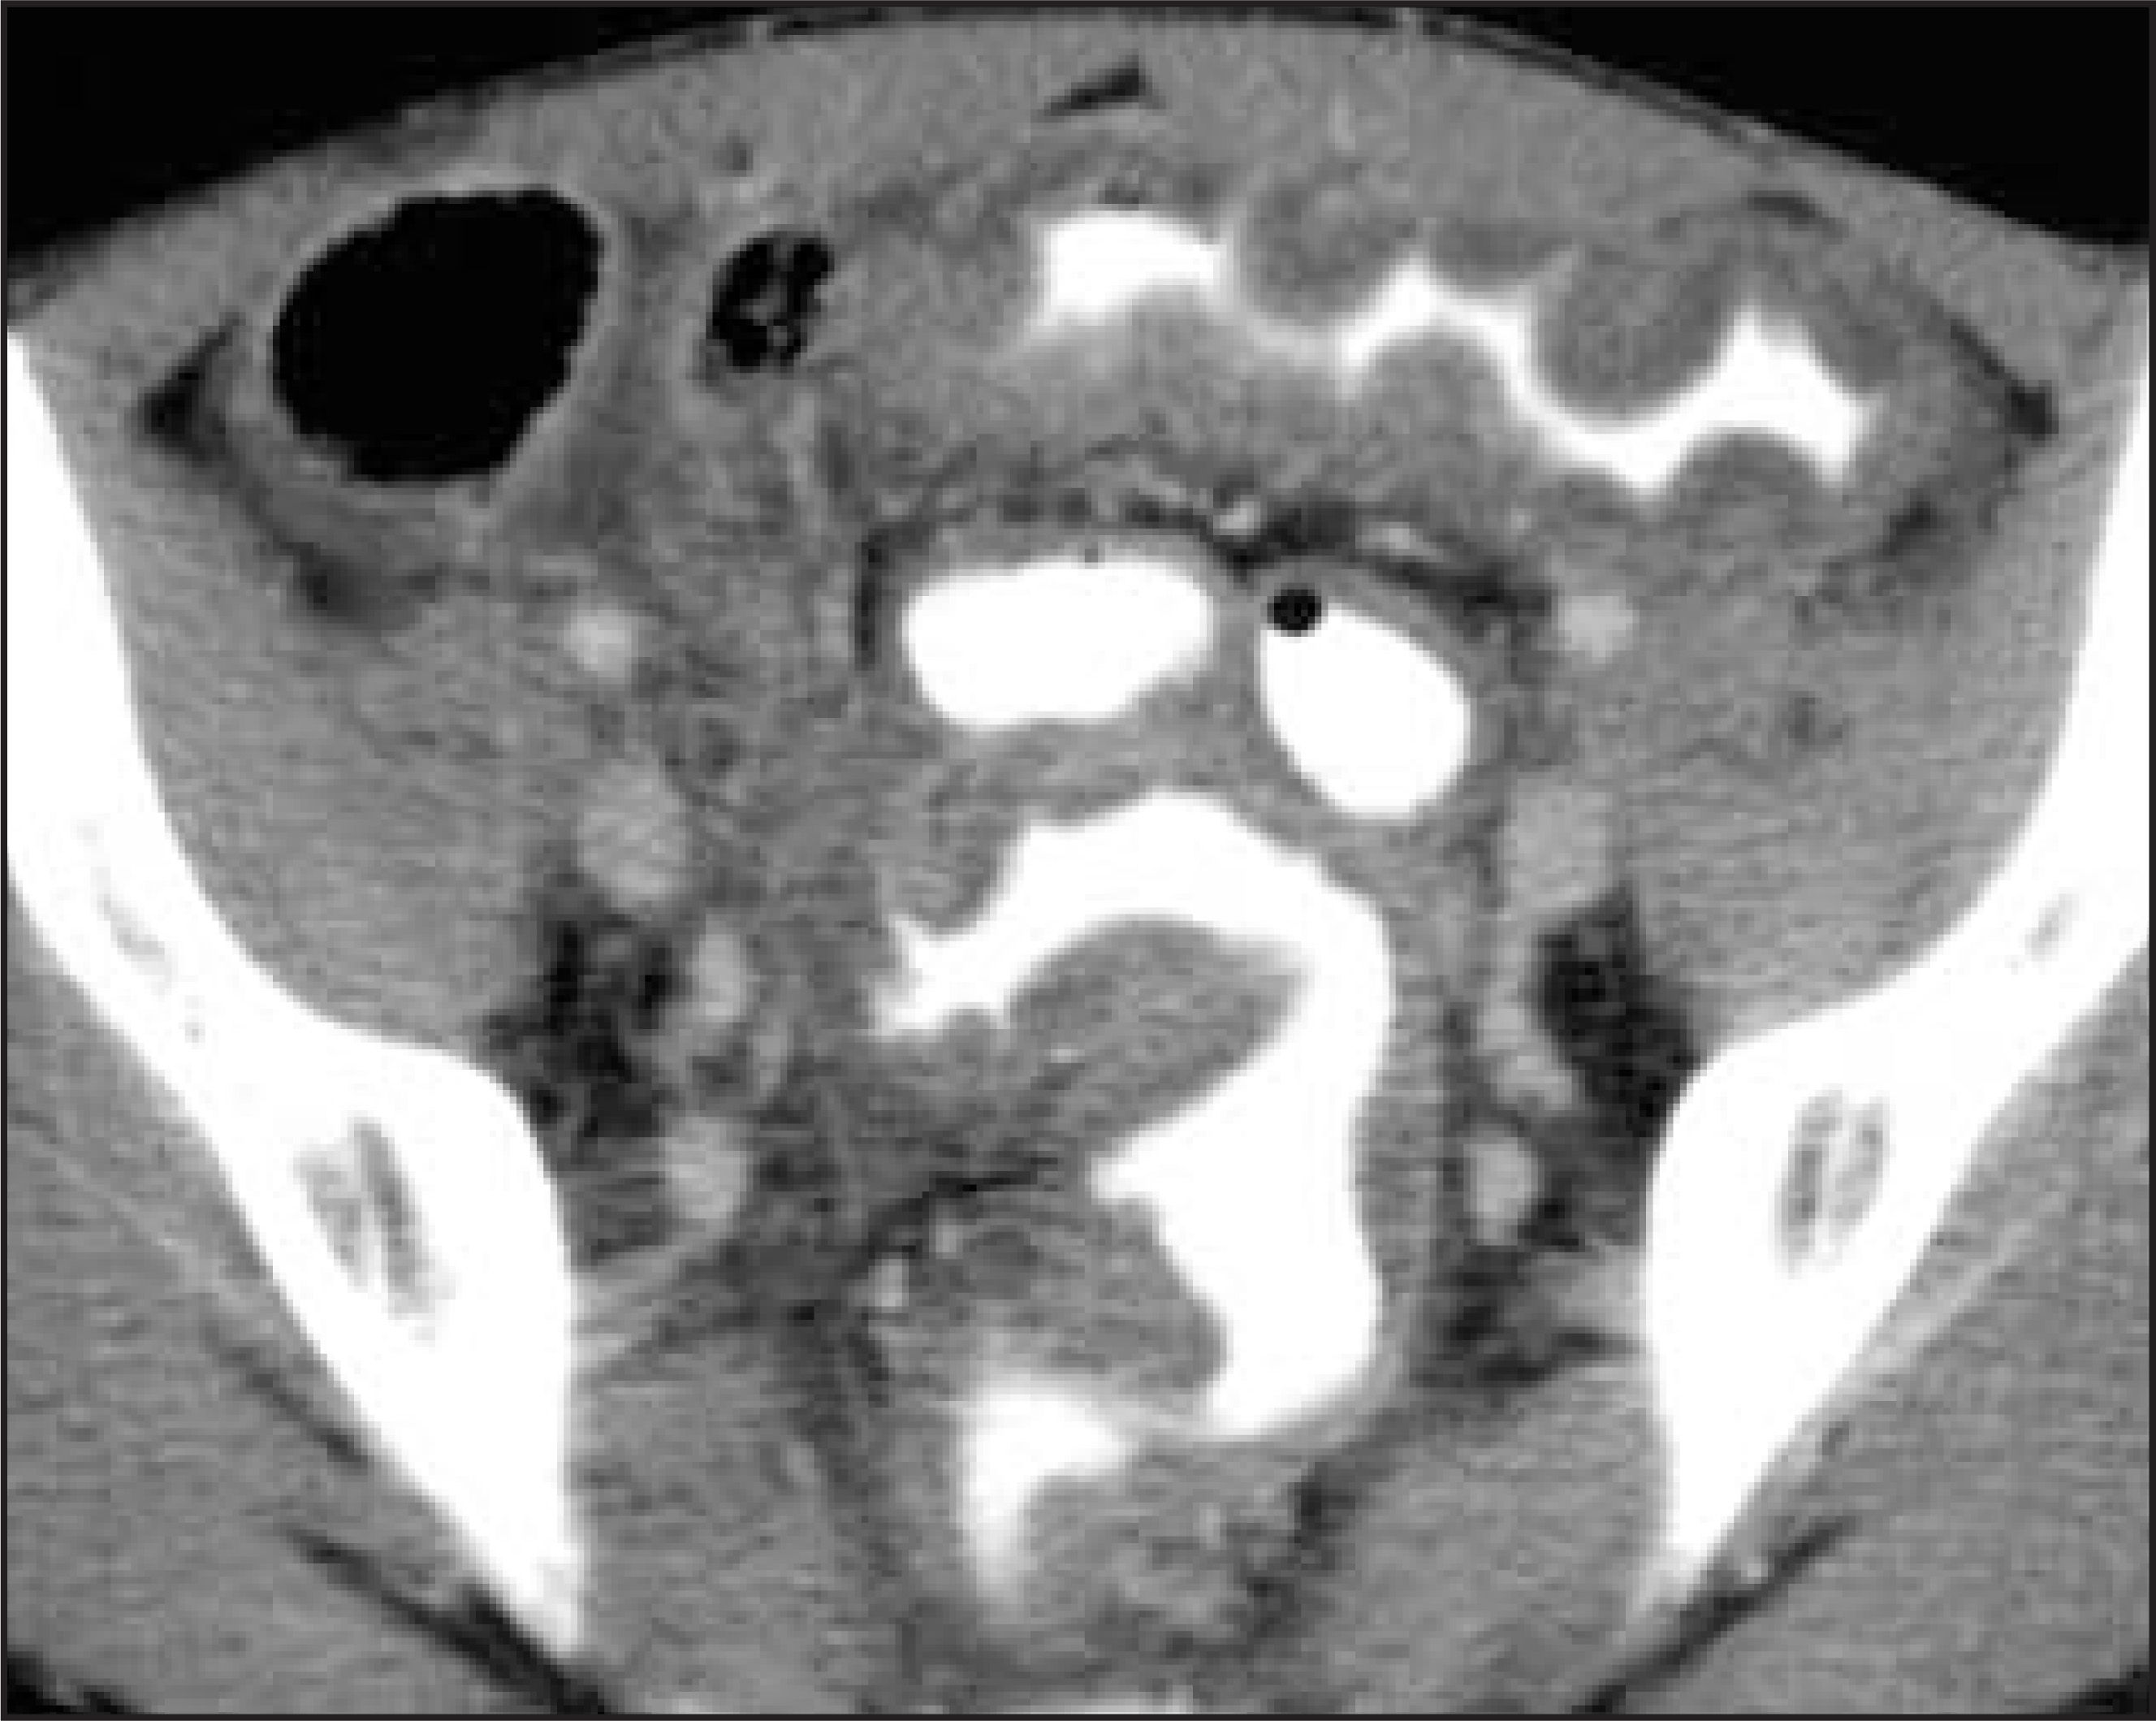
The “accordion sign” was first described in 1991 by Fishman et al
13
and has been used as an axial CT finding characteristic of pseudomembranous colitis (PMC) (figure 20). Goodman
14
first reported this gross, irregular, polypoid thickening of the colon wall as an axial CT finding in 1980 in a case report of PMC. A review in 1998 by O’Sullivan
15
carefully spelled out the CT criteria, which this finding describes: "The accordion sign is a finding that may be seen on [axial] computed tomographic (CT) scans in patients who have received oral contrast material. It comprises alternating bands of lower soft-tissue attenuation and higher contrast material attenuation within the large bowel."
The author further remarked that “the accordion sign is relatively unique to PMC [secondary to C difficile]” and that “The sign has been further reported...as a finding specific for PMC [secondary to C difficile].”
15
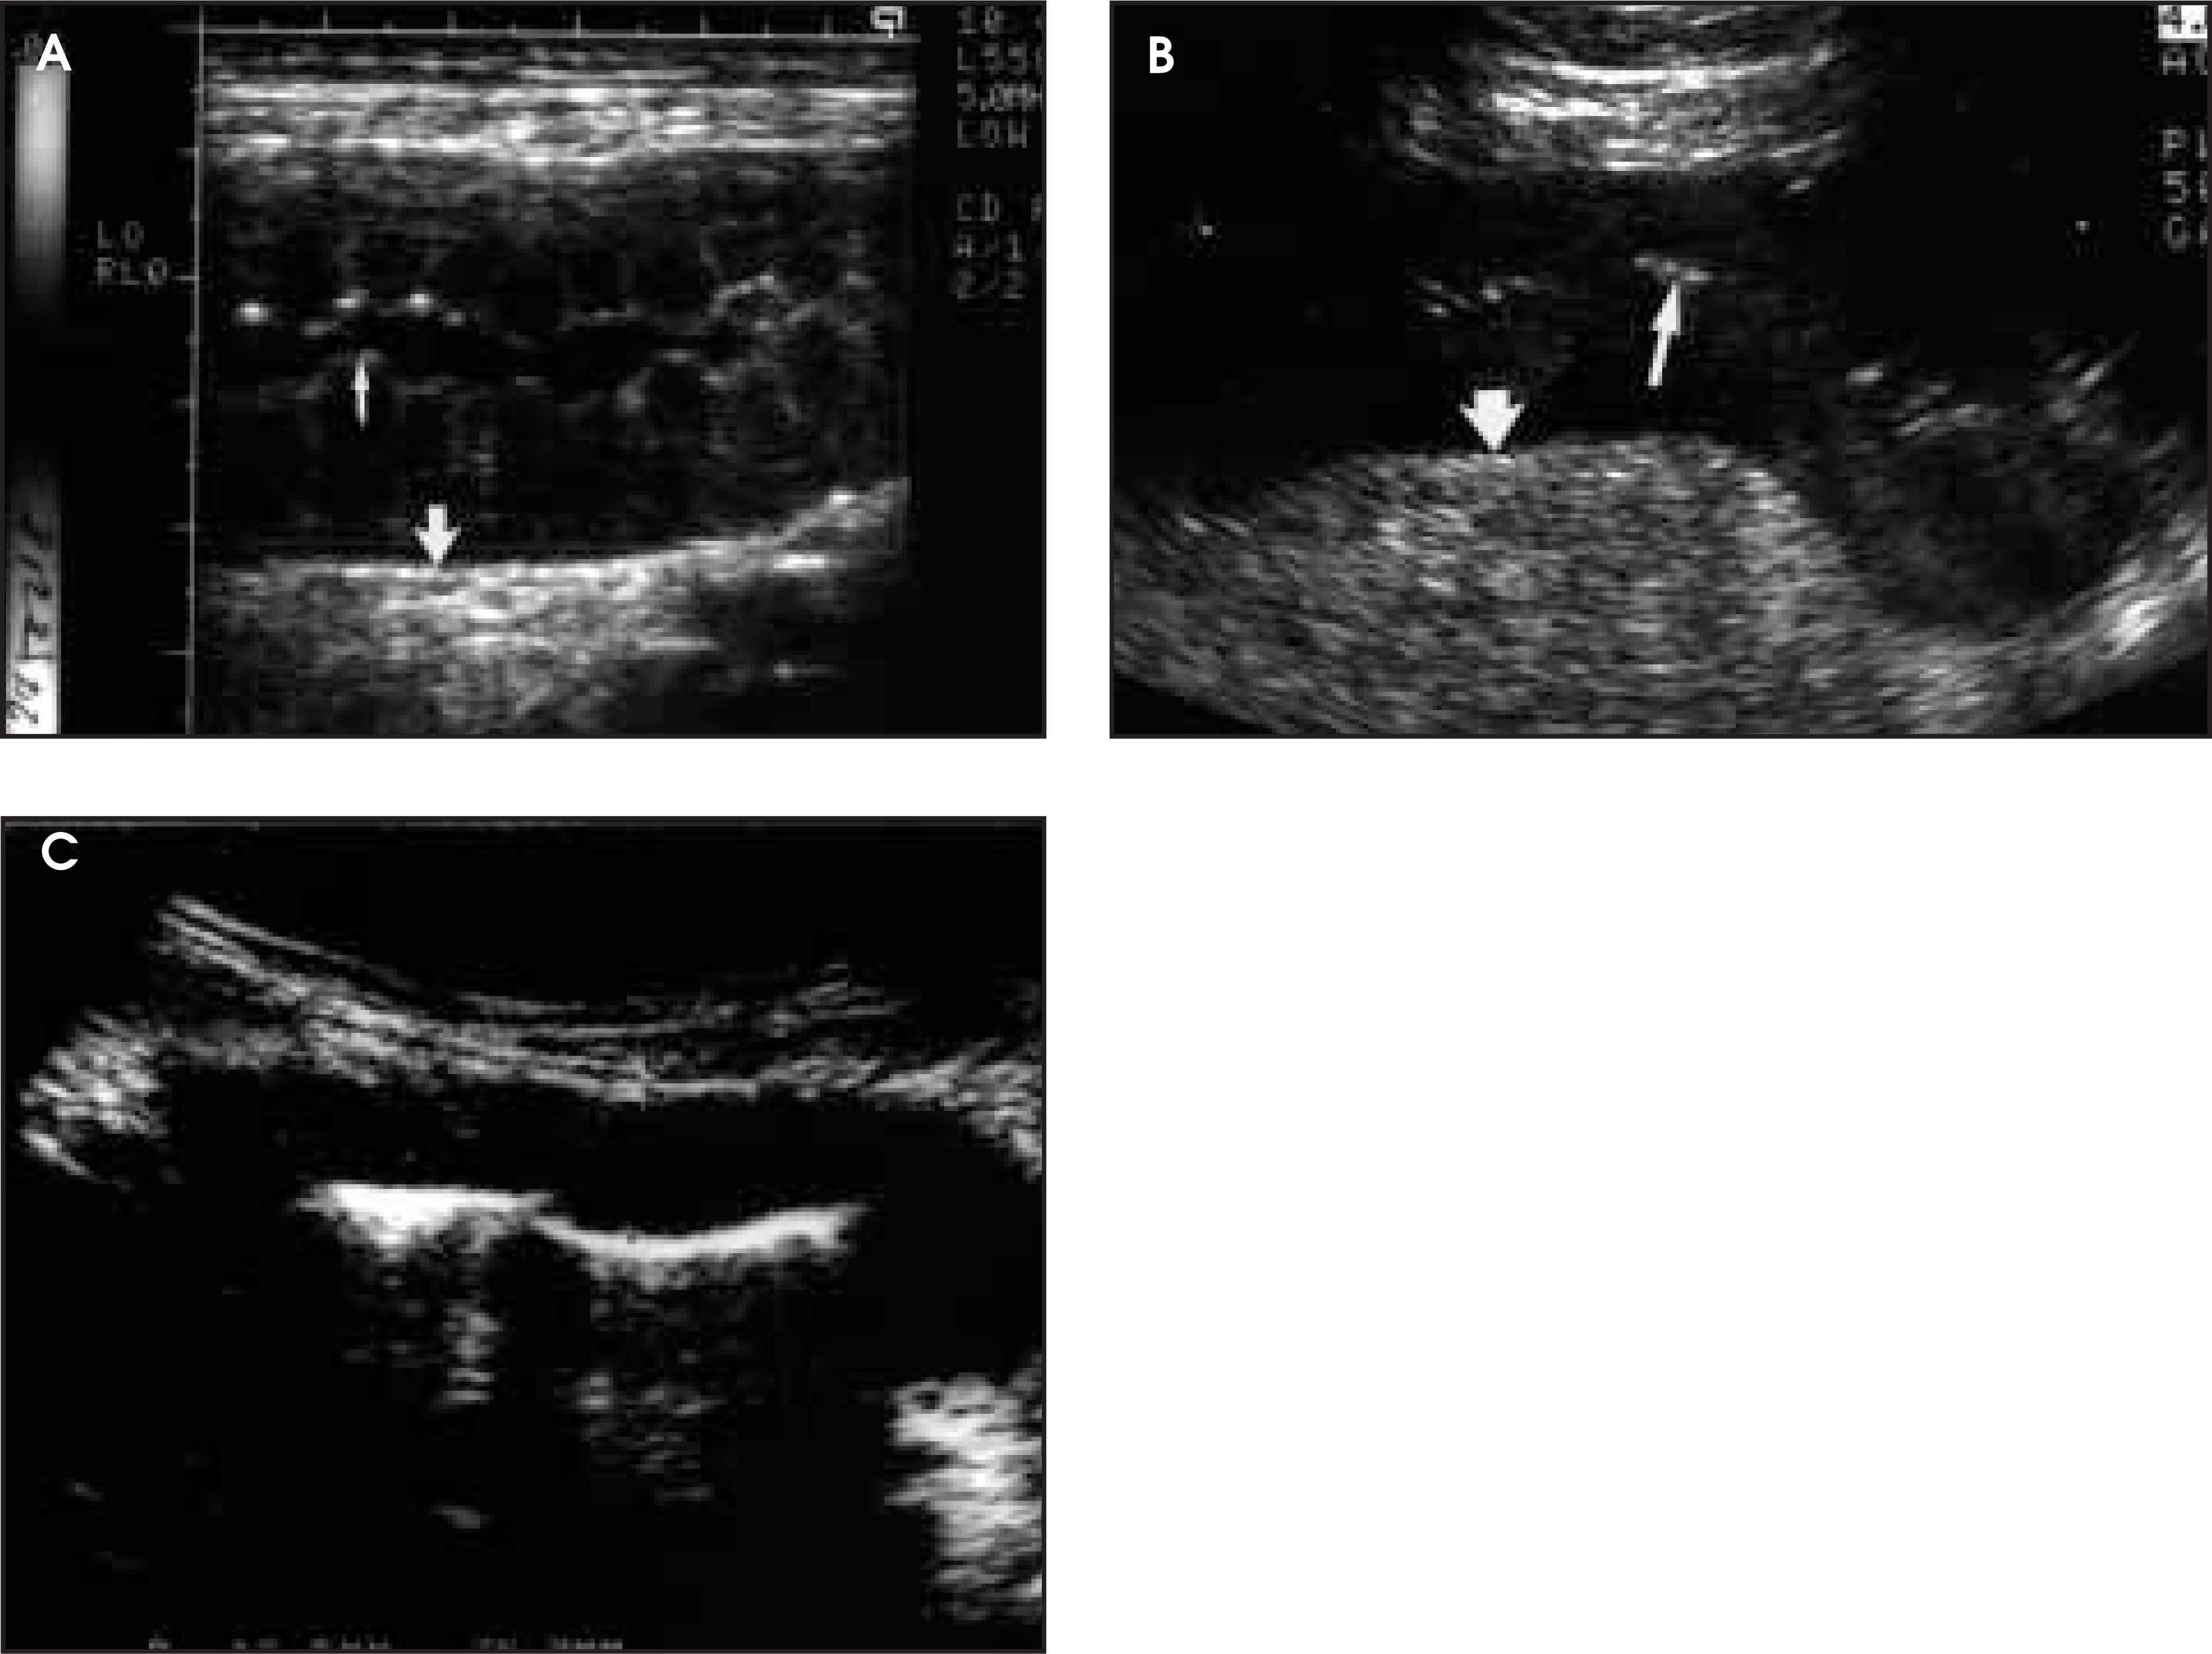
An extension of this definition has been attributed to the ultrasound findings of pseudomembranous colitis, which could be labeled the “ultrasound accordion sign” (figure 21A).
16,17
These authors postulated that the three-layer appearance corresponds to “the inner hypoechoic layer [being] the edematous mucosal layer, while the submucosal layer and muscularis propria retain a more normal sonographic signature.”
16
Here, the three-layered appearance of the swollen gut has resulted in the echogenic mucosa, which resemble the bright inner margins previously discussed as the contrast-enhancing inner layer seen during the arterial phase on CT. From endoscopic endoluminal ultrasound, we have learned that the echogenic inner layer represents the mucosa, to include both its mucin surface coating (or pseudomembrane) and the underlying lamina propria.
18
As severe edema extends below the mucosa, penetrating through to the muscularis propria or serosal tissues, the usual five-layer appearance becomes three as the echogenicity of the submucosal fat is replaced by relatively hypoechoic edema or hemorrhage. Ischemia and the “pseudokidney sign” of lymphoma can mimic this appearance (figure 21C). It was originally thought that the ultrasound appearance, in the presence of pancolitis, made the diagnosis of pseudomembranous colitis secondary to C difficile a high probability. Balondi et al
16,17
was the first of only two authors to include other specific entities in the differential diagnosis. A review of colitides at the AFIP found several cases of specific entities other than PMC caused by C difficile that demonstrated an accordion sign, whether or not oral contrast was given.
Oral contrast is not necessary to demonstrate an accordion sign—It is true that the original accordion sign described in 1991
13
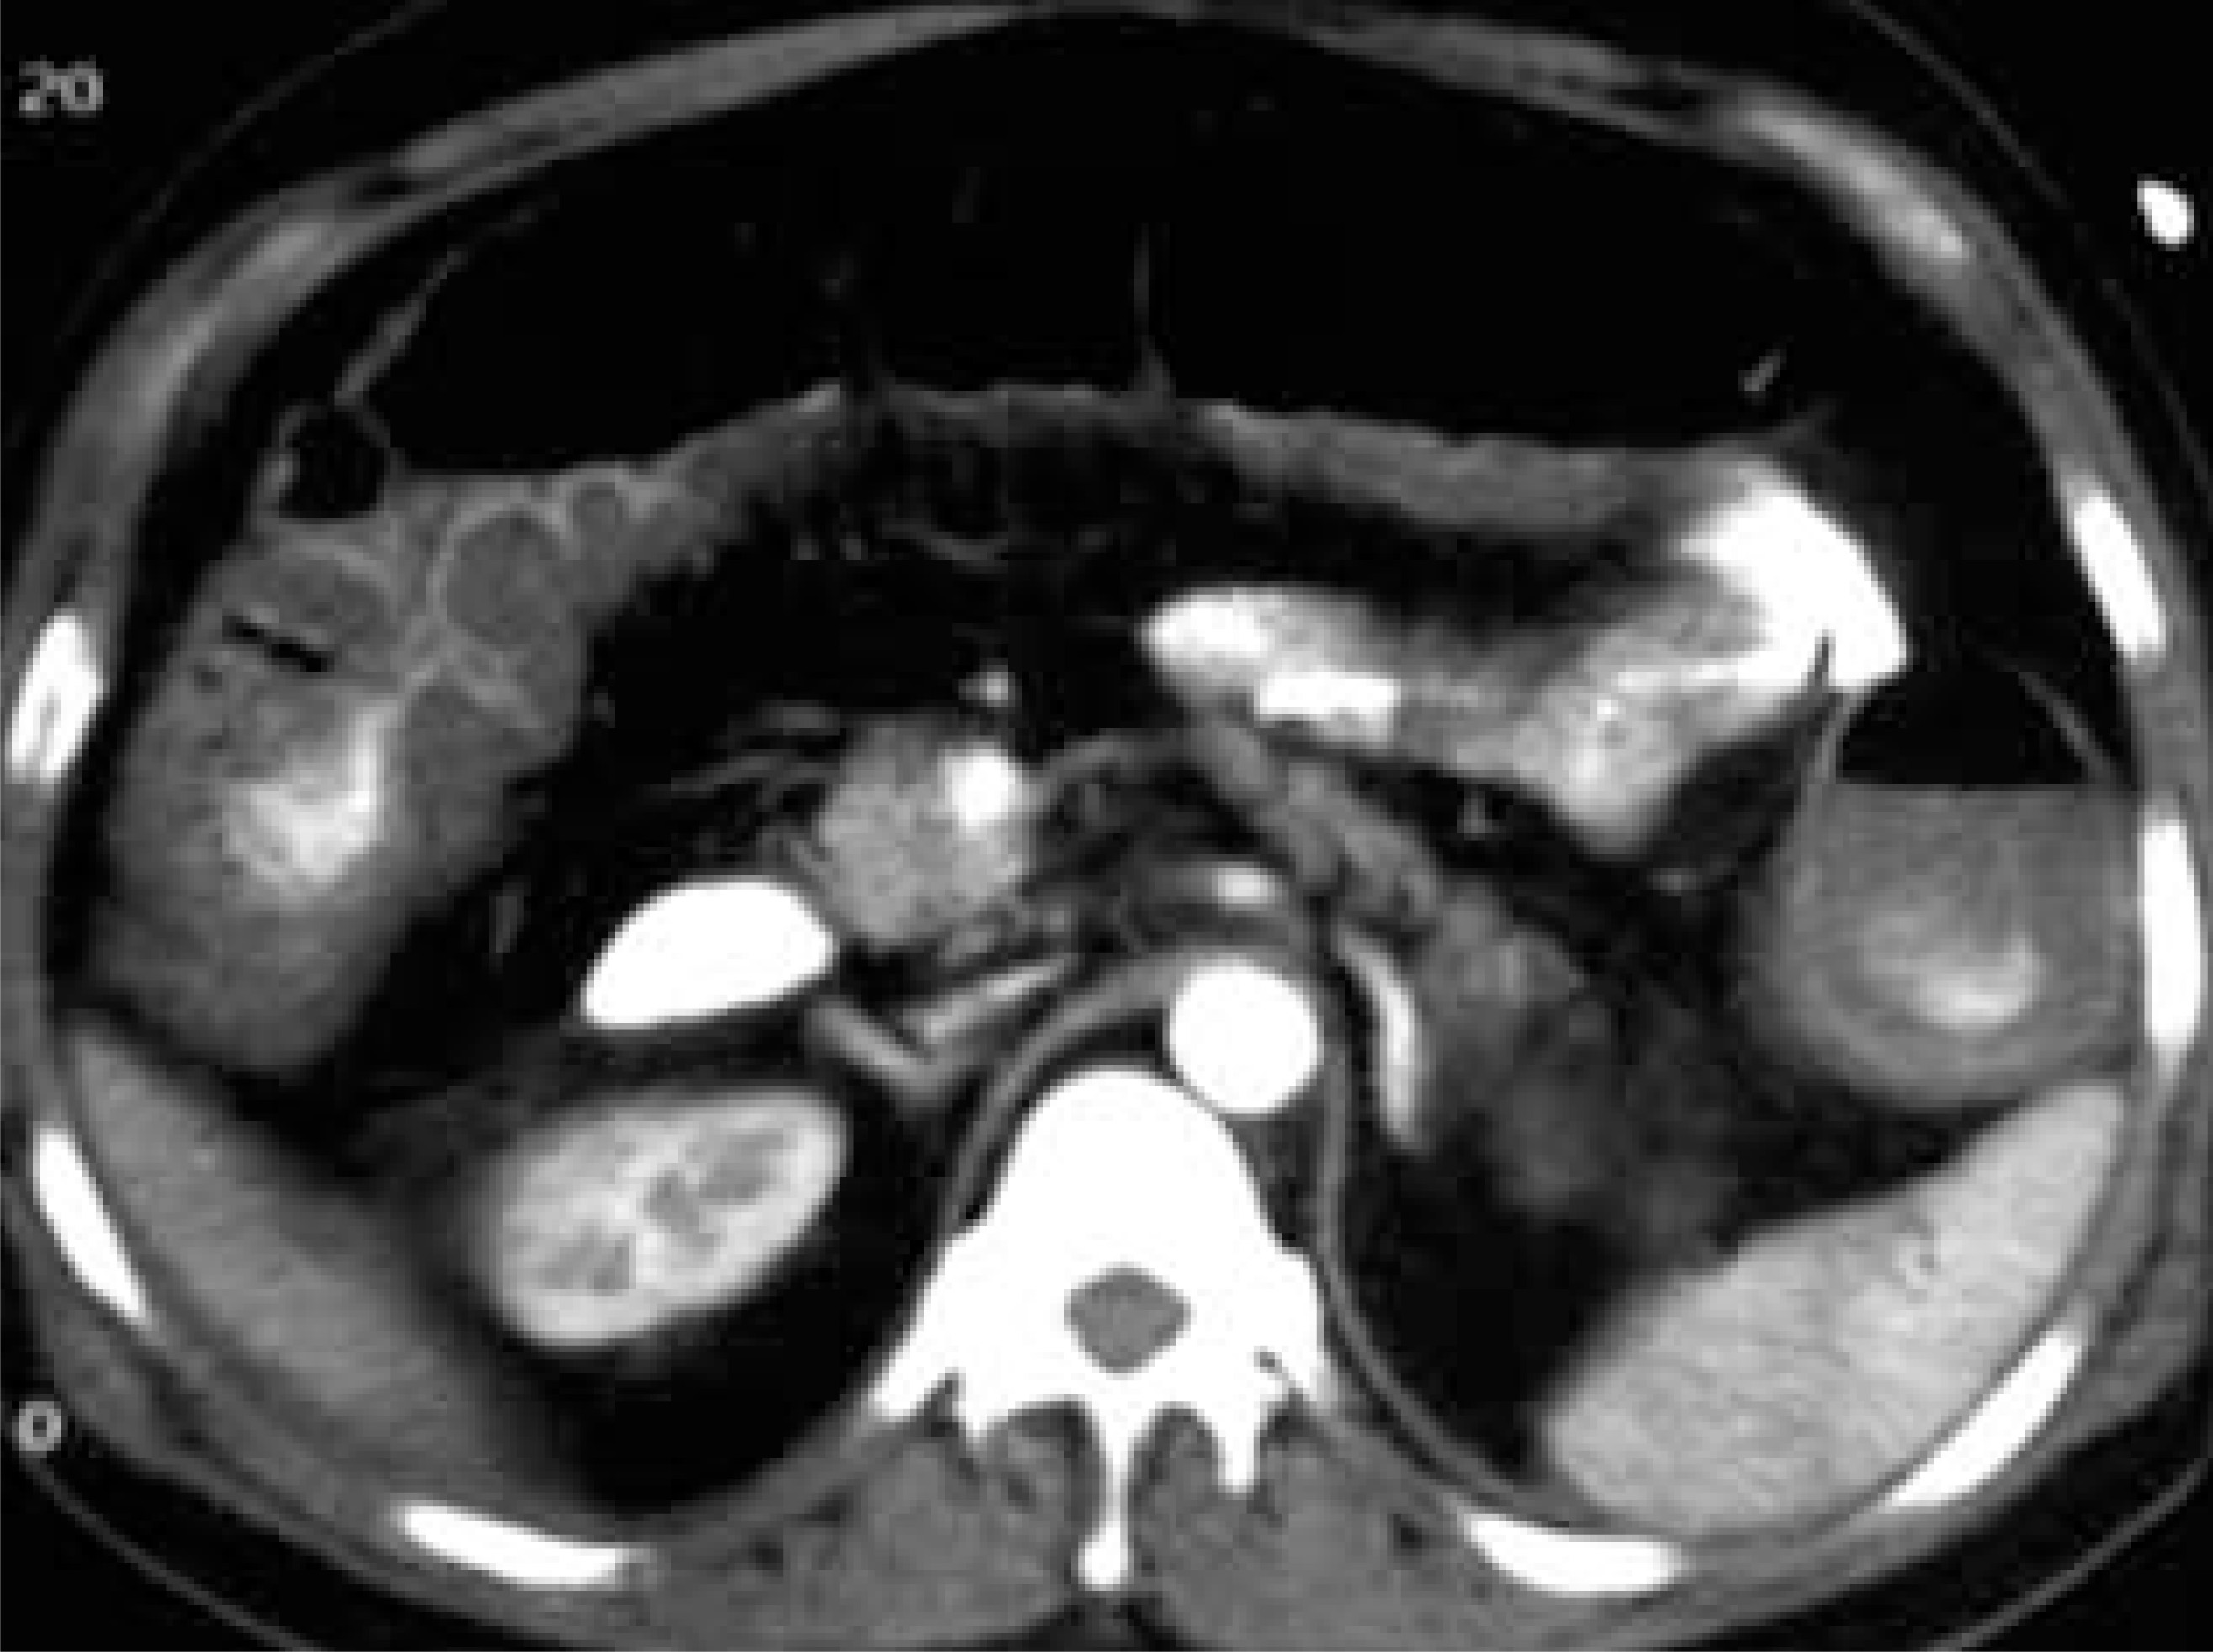
was limited to intraluminal contrast insinuated between edematous folds. The inner margin was delimited by intraluminal contrast and the outer margin by the mesenteric fat surrounding the gut. An identical appearance is seen without intraluminal contrast when intravenous contrast enhances the inner and outer highly perfused margins of the gut. It is best seen during the arterial phase with spiral CT but can be seen on traditional axial scanning early during contrast administration (figure 22).
3,7
During the arterial phase of intravenous contrast injection, intense edema or inflammation of the gut wall causes a wide separation between the enhancing inner and outer layers of bowel wall. This appearance is so similar to the original description of the accordion sign that it should be assimilated into the definition. As less oral or rectal contrast is used with spiral CT in patients with acute intestinal disorders, this extreme appearance of mural stratification may completely replace that which was previously described on traditional axial scanners, regardless of whether large or small bowel is involved.
C difficile is not the only cause of pseudomembranous colitis —In the radiology literature, PMC is frequently used as a synonym for colitis secondary to C difficile. Boland et al, 19 however, correctly labeled their discussion of the CT findings as found with “Clostridium difficile disease of the colon,” apparently realizing other entities could cause the same appearance. This is important, as there are other disease entities that cause pseudomembrane formation in the colon, most notably ischemic disease of the gut. 20
Radiologists must not confuse or mislead their clinical colleagues by simply using the term PMC alone even though the diagnosis suspected is PMC secondary to C difficile. Without a physician-to-physician agreement over such usage, the colonoscopist can be misled! This is especially true with teleradiology programs where a lack of familiarity with the local physicians could lead to such a serious mistake. The critical error concerns mistaking C difficile PMC for ischemic PMC, which not infrequently presents with pseudomembrane formation both in the acute and subacute phases (figure 23).
19,20
A delay in the diagnosis of ischemia while waiting for cultures or while conducting a pharmaceutical trial for C difficile PMC can be devastating.
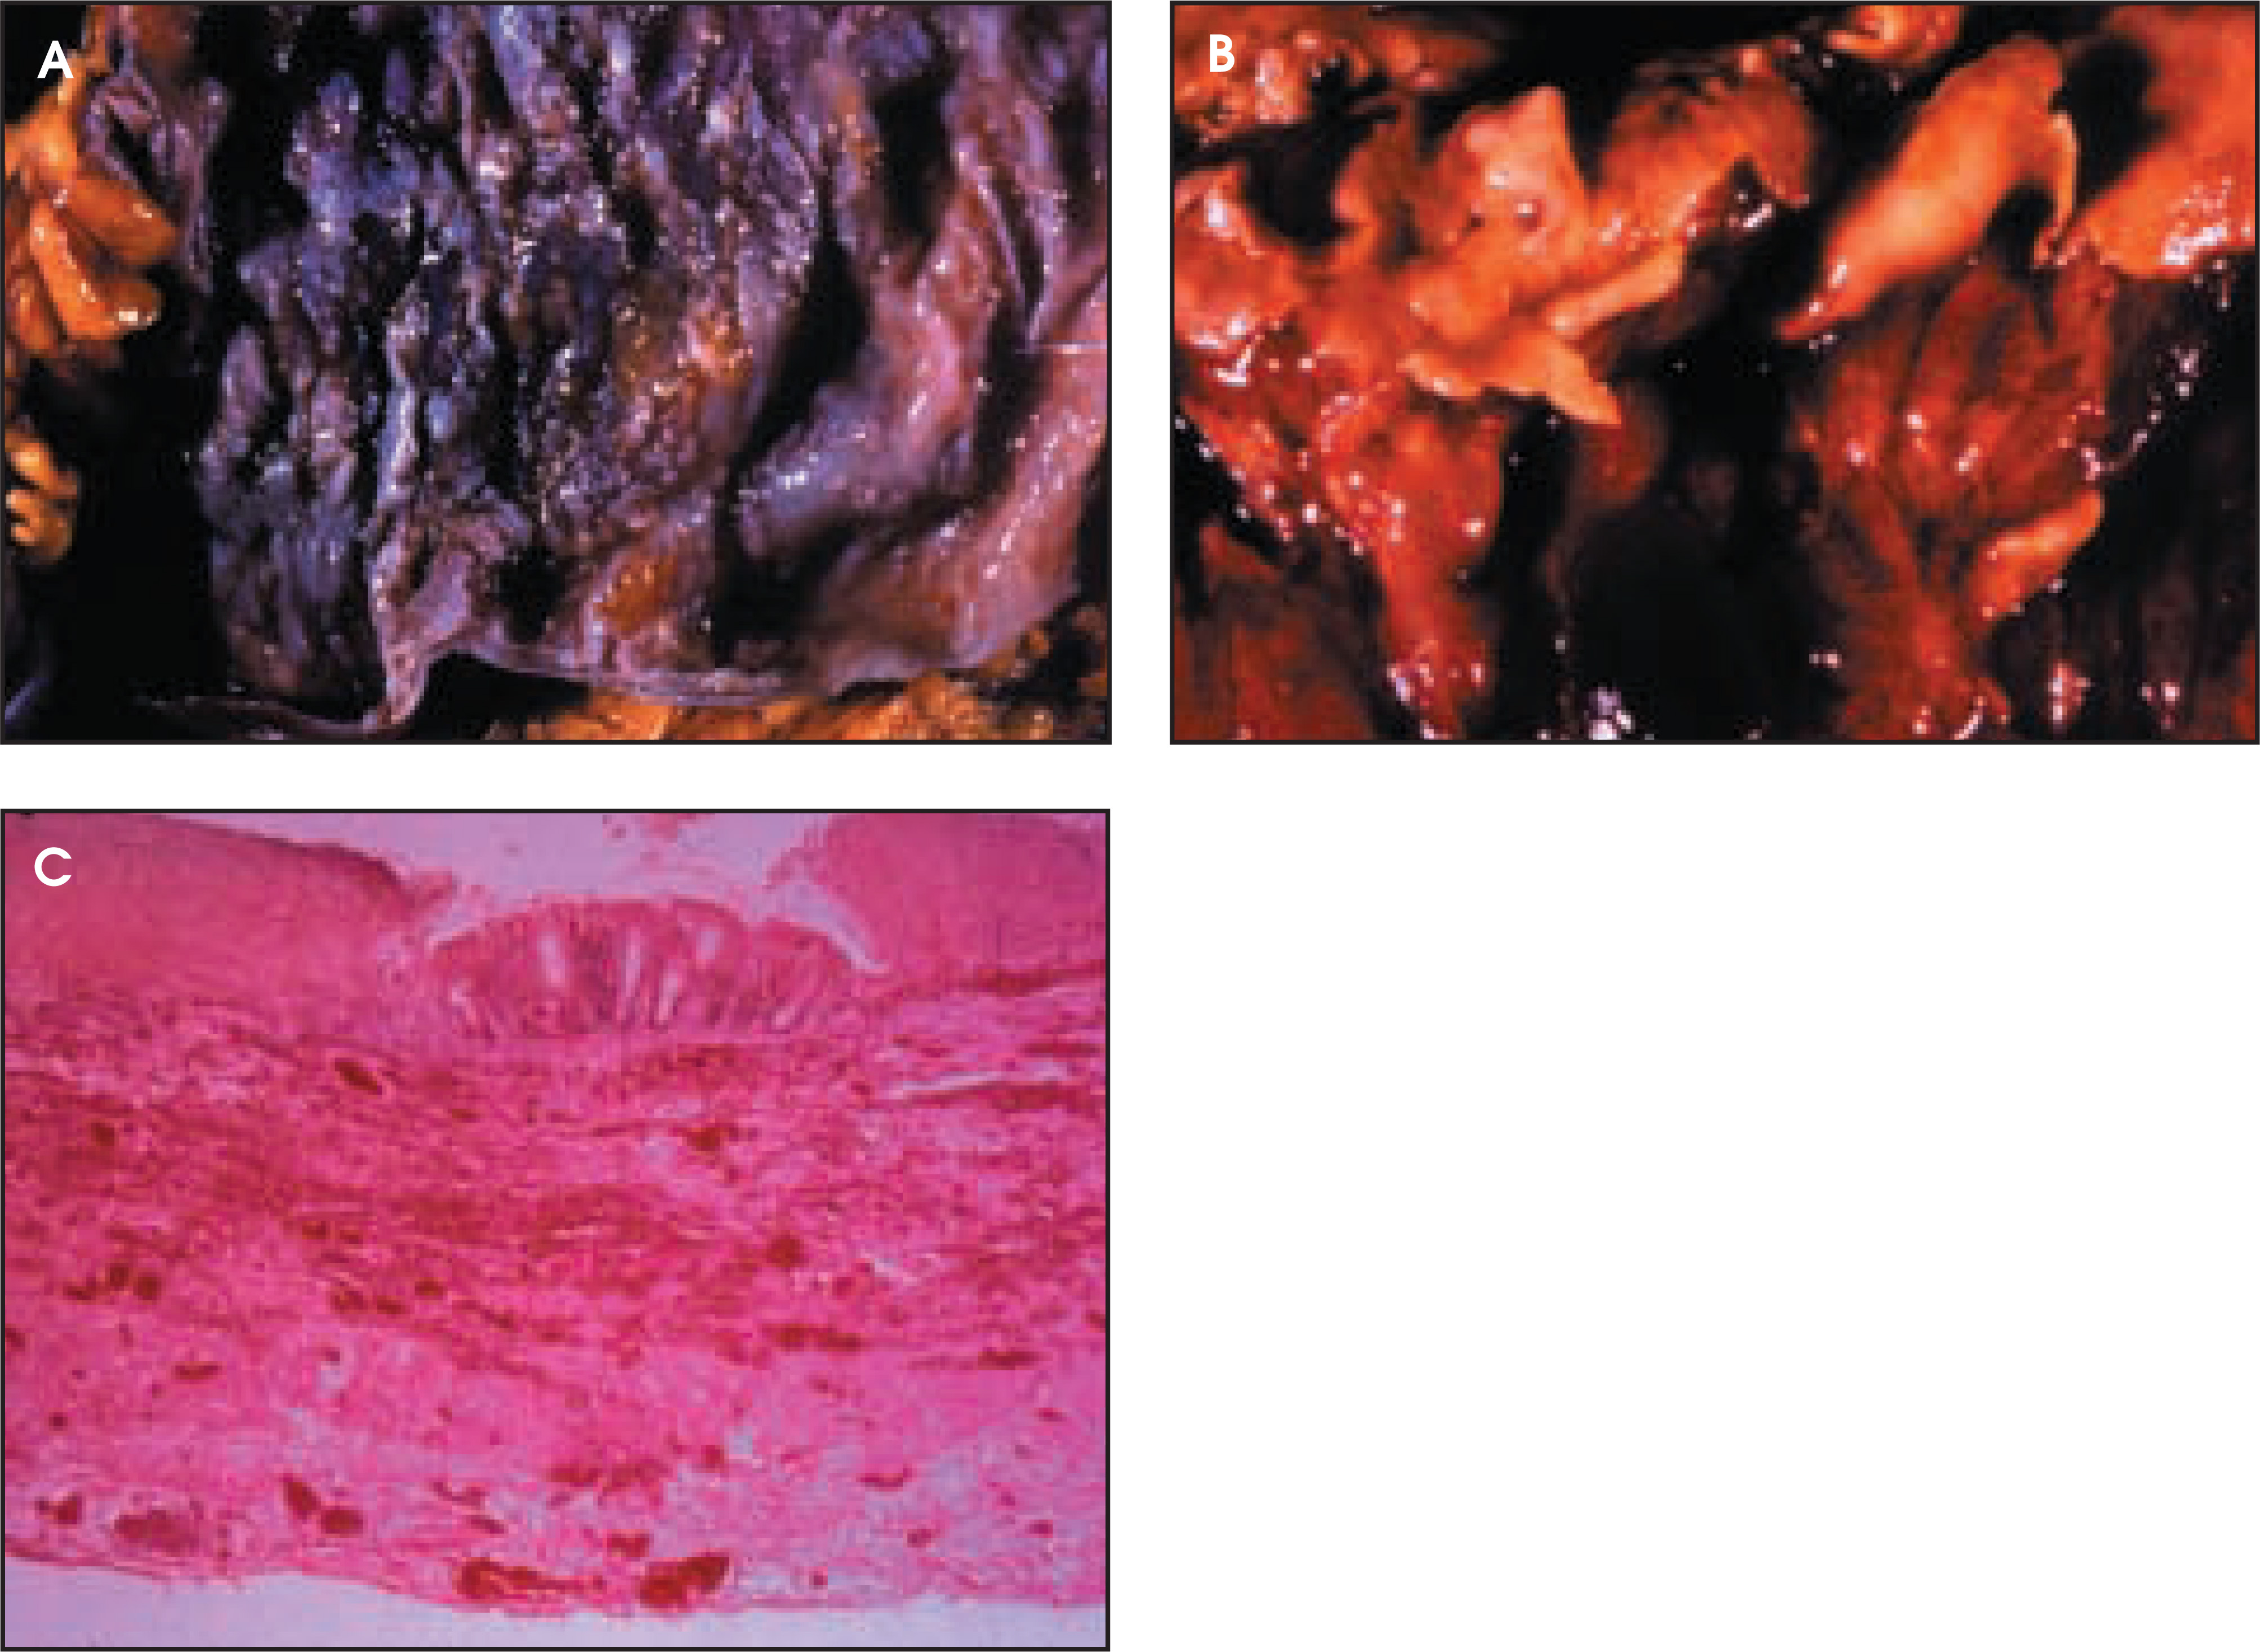
The causes of PMC are grouped by pathologists into three categories. 20 The first is the condition known to be caused by C difficile. The second group consists of those entities where there is no documented role for C difficile in the disease process. Early ischemia, which is typically pseudomembranous, is the standout in this group. Verotoxin-producing organisms, Clostridium perfringens and unidentified Clostridia species round out this group possibly because of a more ischemic-related pathophysiology than an inflammatory one. The third group is composed of organisms, substances, or procedures with an indeterminate relationship to C difficile that have been known to cause PMC. Organisms such as Staphylococcus, Shigella, and Pseudomonas aeruginosa can be associated with pseudomembrane production, ostensibly because of associated antibiotic therapy. The use of chlorpropamide, mercuric compounds, nonsteroidal anti-inflammatory drugs, or gold has also been reported to produce a pseudomembranous colitis. Pseu-domembrane production may even occur after colonoscopy. 20
The accordion sign is not diagnostic of C difficile PMC —The only authors to indicate clearly that other entities might show a similar acute appearance were Fishman et al 13 and Downey and Wilson. 16 The former included only typhlitis or neutropenic colitis in their differential diagnosis, 13 while the latter used the more complete differential diagnosis of inflammatory bowel disease, tuberculosis, lymph-angiectasia, intramural hemorrhage, leukemic infiltration, and ischemic colitis. 16 The findings of Ros et al 6 help to limit this differential diagnosis. Of the group of diseases they listed (i.e., radiation-induced colitis, infectious colitis, ulcerative colitis, Crohn’s disease, and [C difficile] PMC), only the latter two had bowel wall thickening >1.0 cm. 6 It is present, however, in only the most severe of cases. 6,14
The pathophysiology of such an extreme in mural stratification is thought by the authors to be caused by the rapidity of onset and the fulminant nature of the inciting process in overcoming the usual immune defenses, while leaving the anatomic structure of the colon wall intact. If this is true, then any process that can progress with great rapidity and overwhelm the homeostasis of intestinal immunity and expand the gut wall while regarding the normal boundaries should cause a similar appearance. Ischemia and/or intramural hemorrhage are the most emergent examples, with a significant potential to present in this fashion (figure 14,figure 17,figure 19, and figure 23). As with C difficile PMC, ischemia and hemorrhage can greatly expand the gut wall but usually in only the most advanced of cases. Certainly other infectious diseases and inflammatory enteritides demonstrate this potential (figure 24 and figure 25). The relative incidence of these entities as encountered by the radiologist has remained stable while that of C difficile PMC has fallen with the advent of prophylactic treatment for PMC in the intensive care setting. Whether or not an accordion sign results may well depend on the time to an accurate diagnosis.
Conclusion
Distinct mural stratification of the intestinal tract is a very sensitive sign of bowel wall abnormality. Although not specific, with certain disease processes it has significant clinical implications and can suggest whether medical or surgical management should be considered first. Understanding which process (i.e., blood, pus, water, cells, or fat), is causing the separation of the contrast-enhancing inner and outer gut layers helps considerably in suggesting an appropriate category of management.
The most extreme form of mural stratification is the accordion sign. With the advent of spiral CT and the routine acquisition of arterial-phase images during emergency CT of the gut without oral contrast, an extended definition of the accordion sign is appropriate (figure 22). Radiologists should stress that the differential diagnosis of the accordion sign includes ischemic and other infectious or inflammatory enteritides as a minimum. Simply stating that the accordion sign is characteristic, unique, or even specific for C difficile PMC can be misleading and opens the potential for a delayed diagnosis of ischemia. AR
References
- Balthazar E. CT of the gastrointestinal tract: Principles and interpretation. AJR Am J Roentgenol.. 1991;156:23-32.
- Federle M, Chun G, Jeffery R. Computed tomographic findings in bowel infarction. AJR Am J Roentgenol.. 1984;142:91-95.
- Gore R, Balthazar E, Ghahremani G, Miller F. CT features of ulcerative colitis and Crohn’s disease. AJR Am J Roentgenol.. 1996;167:3-15.
- Lewin K, Riddell R, Weinstein W. Gastrointestinal pathology and its clinical implications. 1992:35-46.
- Balthazar E, Hulnick D, Megibow A. Computed tomography of intramural intestinal hemorrhage and bowel ischemia. J Comput Assist Tomography.. 1987;11:67-72.
- Ros P, Buetow P, Pantograg-Brown L. State of the art: Pseudomembranous colitis. Radiology. 1996;198:1-9.
- Bender G, Malginte D, KlöppeI Von R, Timmons J. CT-enteroclysis: A superfluous diagnostic procedure or valuable when investigating small-bowel disease?. AJR Am J Roentgenol.. 1999;172:373-378.
- Bartnicke B, Balfe D. CT appearance of intestinal ischemia and intramural hemorrhage. Radiol Clin N Am. 1994;32:845-860.
- Balthazar E, Liebeskind M, Macari M. Intestinal ischemia in patients in whom small bowel obstruction is suspected: Evaluation of accuracy, limitations, and clinical implications of CT in diagnosis. Radiology.. 1997;205:519-522.
- Teefey S, Roarke M, Brink J. Bowel wall thickening: Differentiation of inflammation from ischemia with color Doppler and duplex US. Radiology. 1996;198:547-551.
- Ha H, Kim J, Lee M. Differentiation of simple and strangulated small bowel obstruction: Usefulness of known CT criteria. Radiology.. 1997;204:507-512.
- Frager D, Baer J, Medwid S. Detection of intestinal ischemia in patients with acute small-bowel obstruction due to adhesions or hernia. AJR Am J Roentgenol.. 1996;166:67-71.
- Fishman E, Kavuru M, Jones B. Pseudomembranous colitis: CT evaluation of 26 cases. Radiology.. 1991;180:57-60.
- Goodman P, Federle M. Case report: Pseudomembranous colitis. J Comput Assist Tomogr.. 1980;4:403-404.
- O’Sullivan S. The accordion sign. Radiology.. 1998;206:177-178.
- Downey D, Wilson S. Pseudomembranous colitis: Sonographic features. Radiology.. 1991;180:61-64.
- Balondi L, Ferrentino M, Trevisani F. Sonographic appearance of pseudomembranous colitis. J Ultrasound Med. 1985;4:489-492.
- Botet J, Lightdale C. Endoscopic sonography of the upper gastrointestinal tract. AJR Am J Roentgenol.. 1991;156:63-68.
- Boland G, Lee M, Cats A. Antibiotic-induced diarrhea: Specificity of abdominal CT for the diagnosis of Clostridium difficile disease. Radiology.. 1994;191:103-106.
- Lewin K, Riddell R, Weinstein W. Gastrointestinal Pathology and Its Clinical Implications. 1992:1033-1035.
Citation
. Intestinal mural stratification: Etiopathology, etiology, and the extreme. Applied Radiology. 2001;30(9):33-45. doi:10.37549/AR1035.