Magnetic resonance imaging of benign hepatic lesions
Applied Radiology — Vol. 30 , Issue 9 , pp. 23 -31
DOI: 10.37549/AR1039
Published: September 1, 2001
Categories
Magnetic resonance imaging (MRI) has become a mainstay for the detection and characterization of hepatic lesions. A common indication is for further evaluation of a mass detected at computed tomography or ultrasound, particularly discrimination of benign masses from metastases in a patient with a known extrahepatic malignancy. This article will review the MR imaging features of benign hepatic lesions.
MRI technique
At the Hospital of the University of Pennsylvania in Philadelphia, abdominal MRI is performed on 1.5 Tesla systems with high-performance gradients. Use of a phased-array multicoil provides improved image quality and lesion detection in comparison with the conventional body coil. 1 T1-weighted images are obtained with breath-hold fast gradient echo pulse sequences with the echo time (TE) varied to provide both in-phase and opposed-phase images. These gradient echo sequences provide the equivalent information of a T1-weighted spin-echo sequence and also allow for the detection and characterization of hepatic steatosis and the presence of lipid within hepatocellular neoplasms. 2,3 T2-weighted images are acquired using a respiratory-triggered, fat-saturated, fast-spin echo pulse sequence, which has been shown to be the optimal technique for obtaining breathing-averaged T2-weighted abdominal images. 4-6 A heavily T2-weighted pulse sequence is acquired using a breath-hold, single-shot, fast spin-echo pulse sequence with an effective TE of at least 160 milliseconds. Supplementing moderately T2-weighted pulse sequences with a heavily T2-weighed pulse sequence allows improved discrimination of benign cysts and hemangiomas from hepatic metastases. 7,8 A fat-saturated, two-dimensional or three-dimensional 9 gradient echo T1-weighted sequence allows breath-hold imaging of the entire liver for precontrast and gadolinium-enhanced images in the arterial, portal venous, and equilibrium phases. 10
Hepatic cysts
Simple hepatic cysts are congenital lesions seen in 2.5% of the population, increasing in prevalence with age and in females. 11 On MR imaging, hepatic cysts are well-demarcated, round or oval lesions of very low signal intensity on T1-weighted images and of very high signal intensity on T2-weighted images with no internal structures or gadolinium enhancement. 12
Patients with autosomal-dominant polycystic kidney disease (ADPCKD) may develop multiple intrahepatic cysts with potential complications of hemorrhage, infection, biliary obstruction, and, rarely, cholangiocarcinoma.
13
Patients with ADPCKD may also have peribiliary cysts, which represent cystic dilation of the peribilary glands that surround the central bile ducts and are thought to be congenital in etiology.
14
Peribiliary cysts may also be present with extrahepatic portal vein obstruction, idiopathic portal hypertension, cirrhosis, cirrhosis with hepatocellular carcinoma, and septicemia.
15
With severe liver disease, development of peribilary cysts is probably related to an impaired intrahepatic hemodynamic state, whereas in septicemia, inflammatory obstruction of glandular conduits is thought to be causal.
15
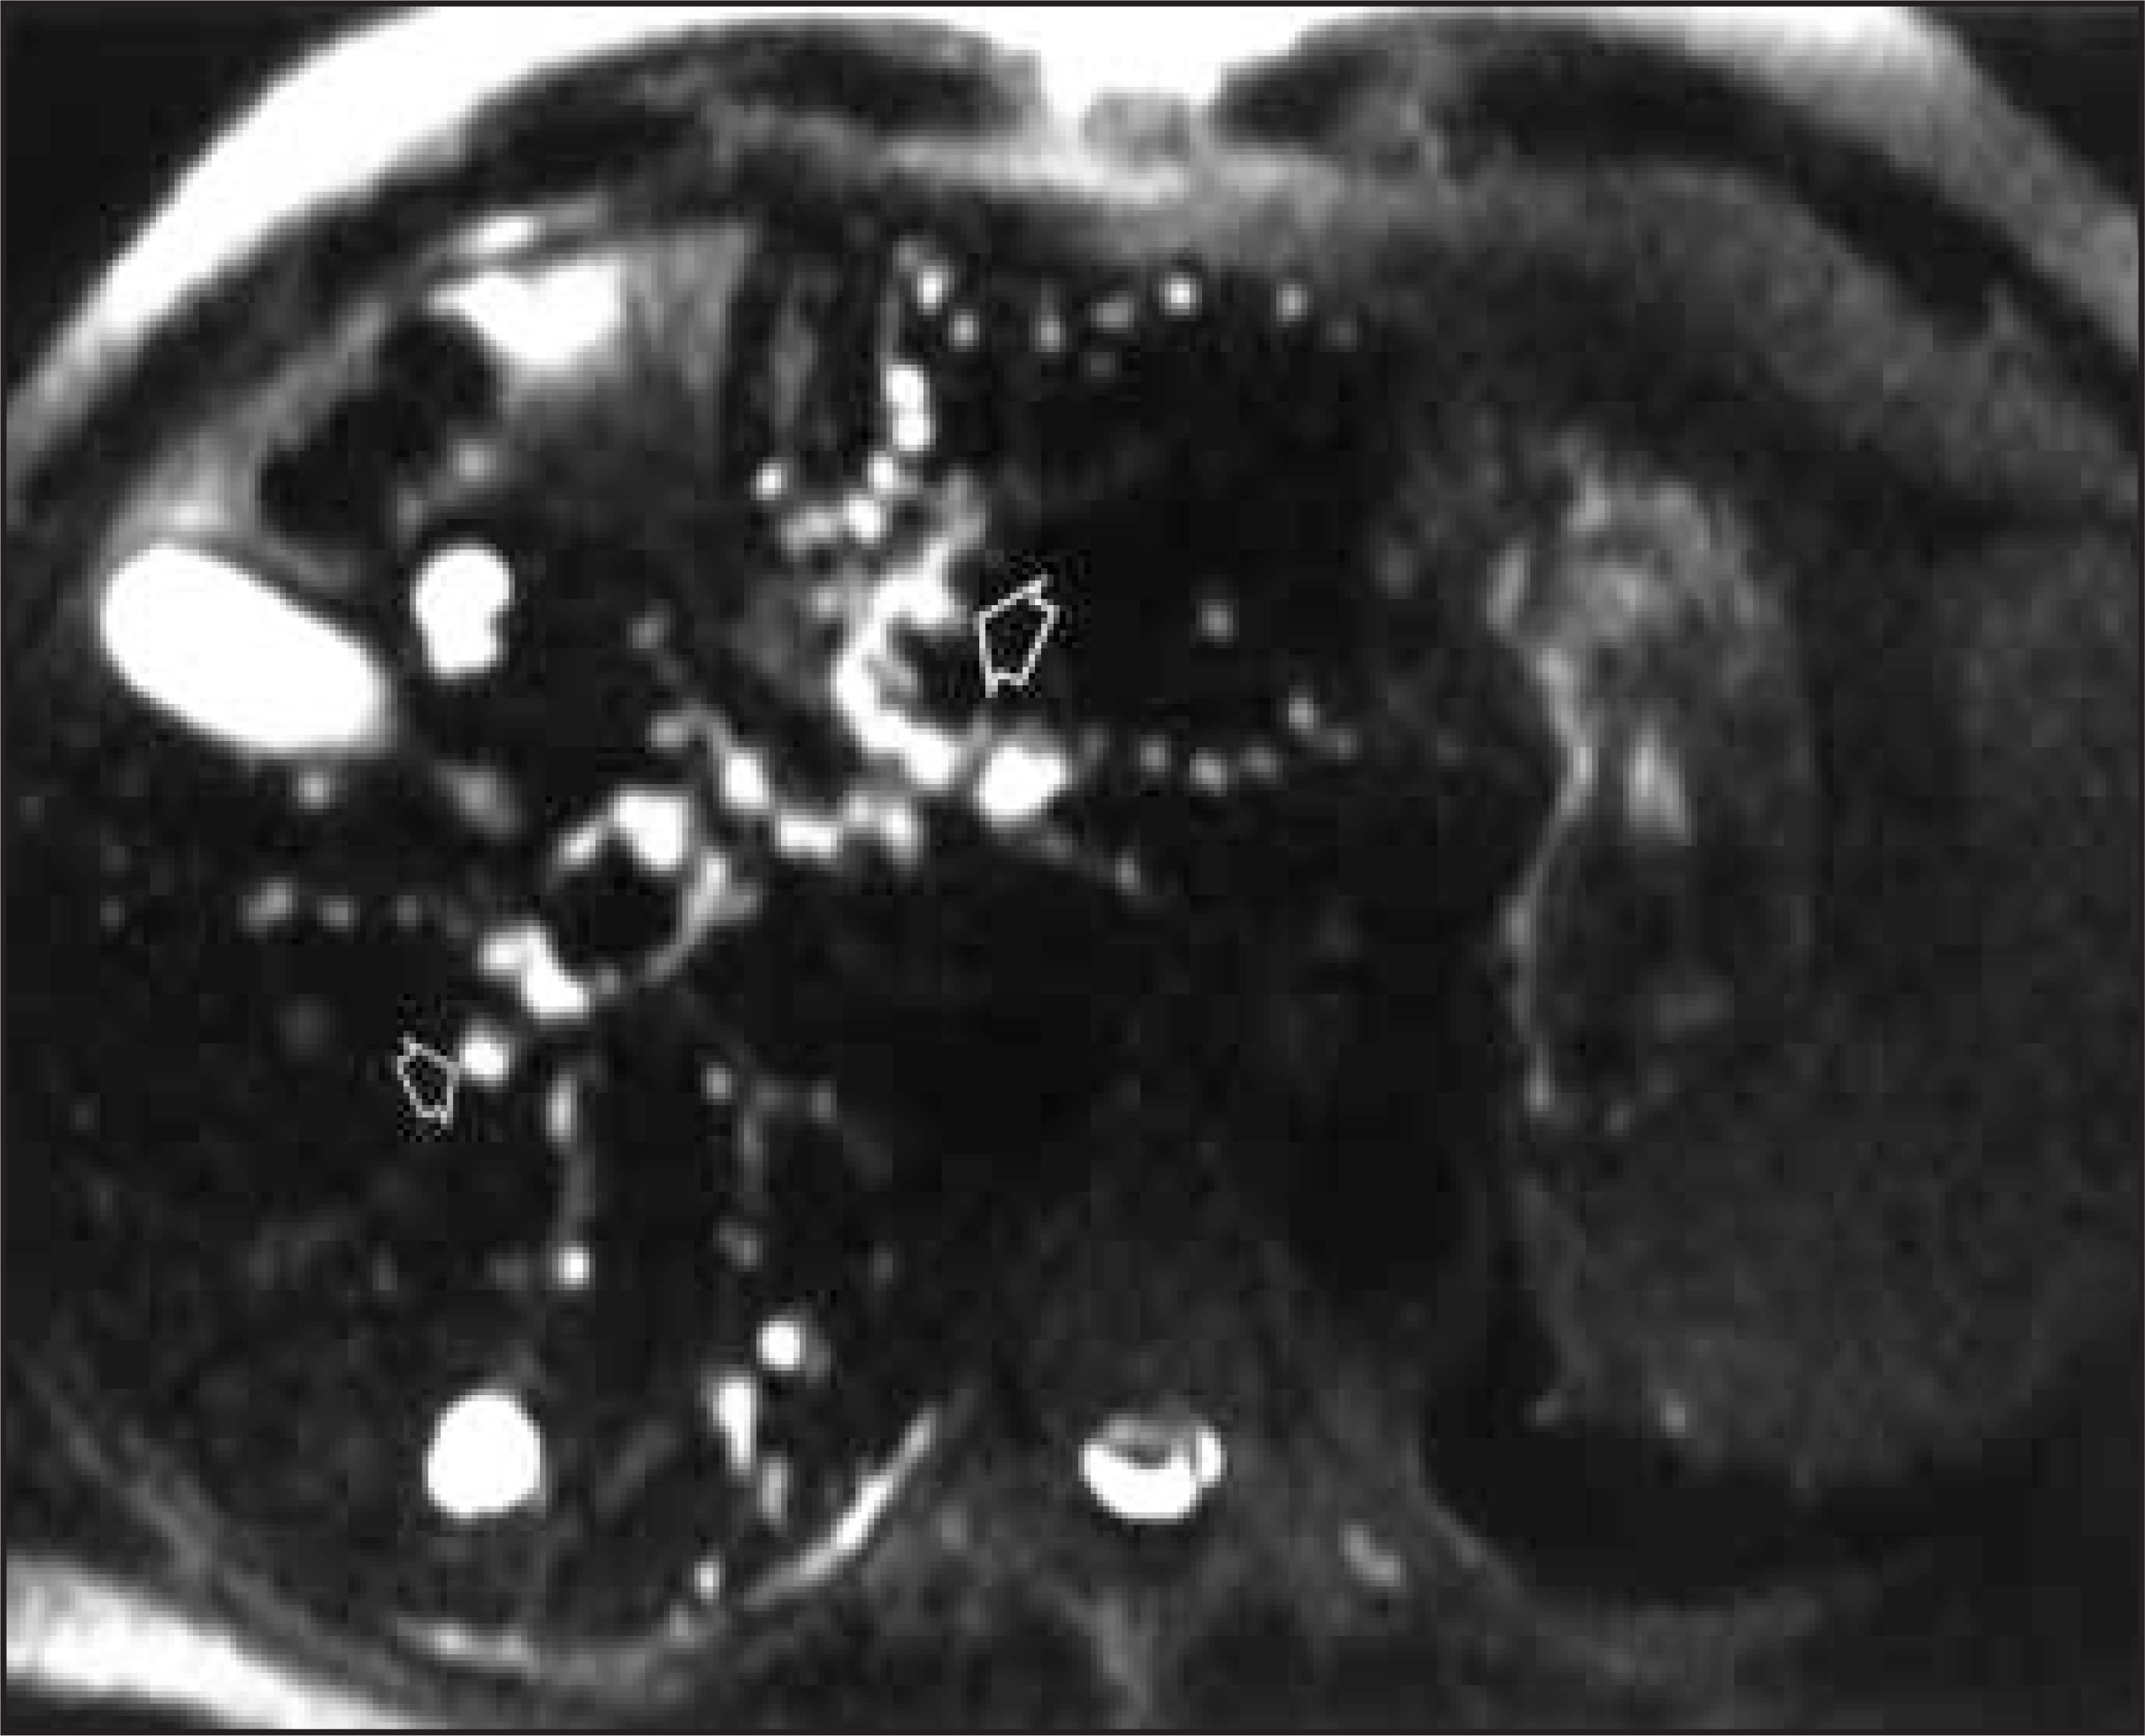
On cross-sectional imaging studies, peribiliary cysts parallel the portal tracts and may appear as either a string of beads (figure 1) or as a tubular structure if the individual cyst walls cannot be seen.
16
The presence of peribiliary cysts on both sides of the larger portal tracts allows differentiation from dilated bile ducts, which appear only on one side.
17
Hepatic hemangiomas
Hemangiomas, the most common benign hepatic neoplasm, are composed of endothelial-celllined vascular channels with a supporting fibrous stroma. Hemangiomas demonstrate smooth, round, or lobular margins.
18
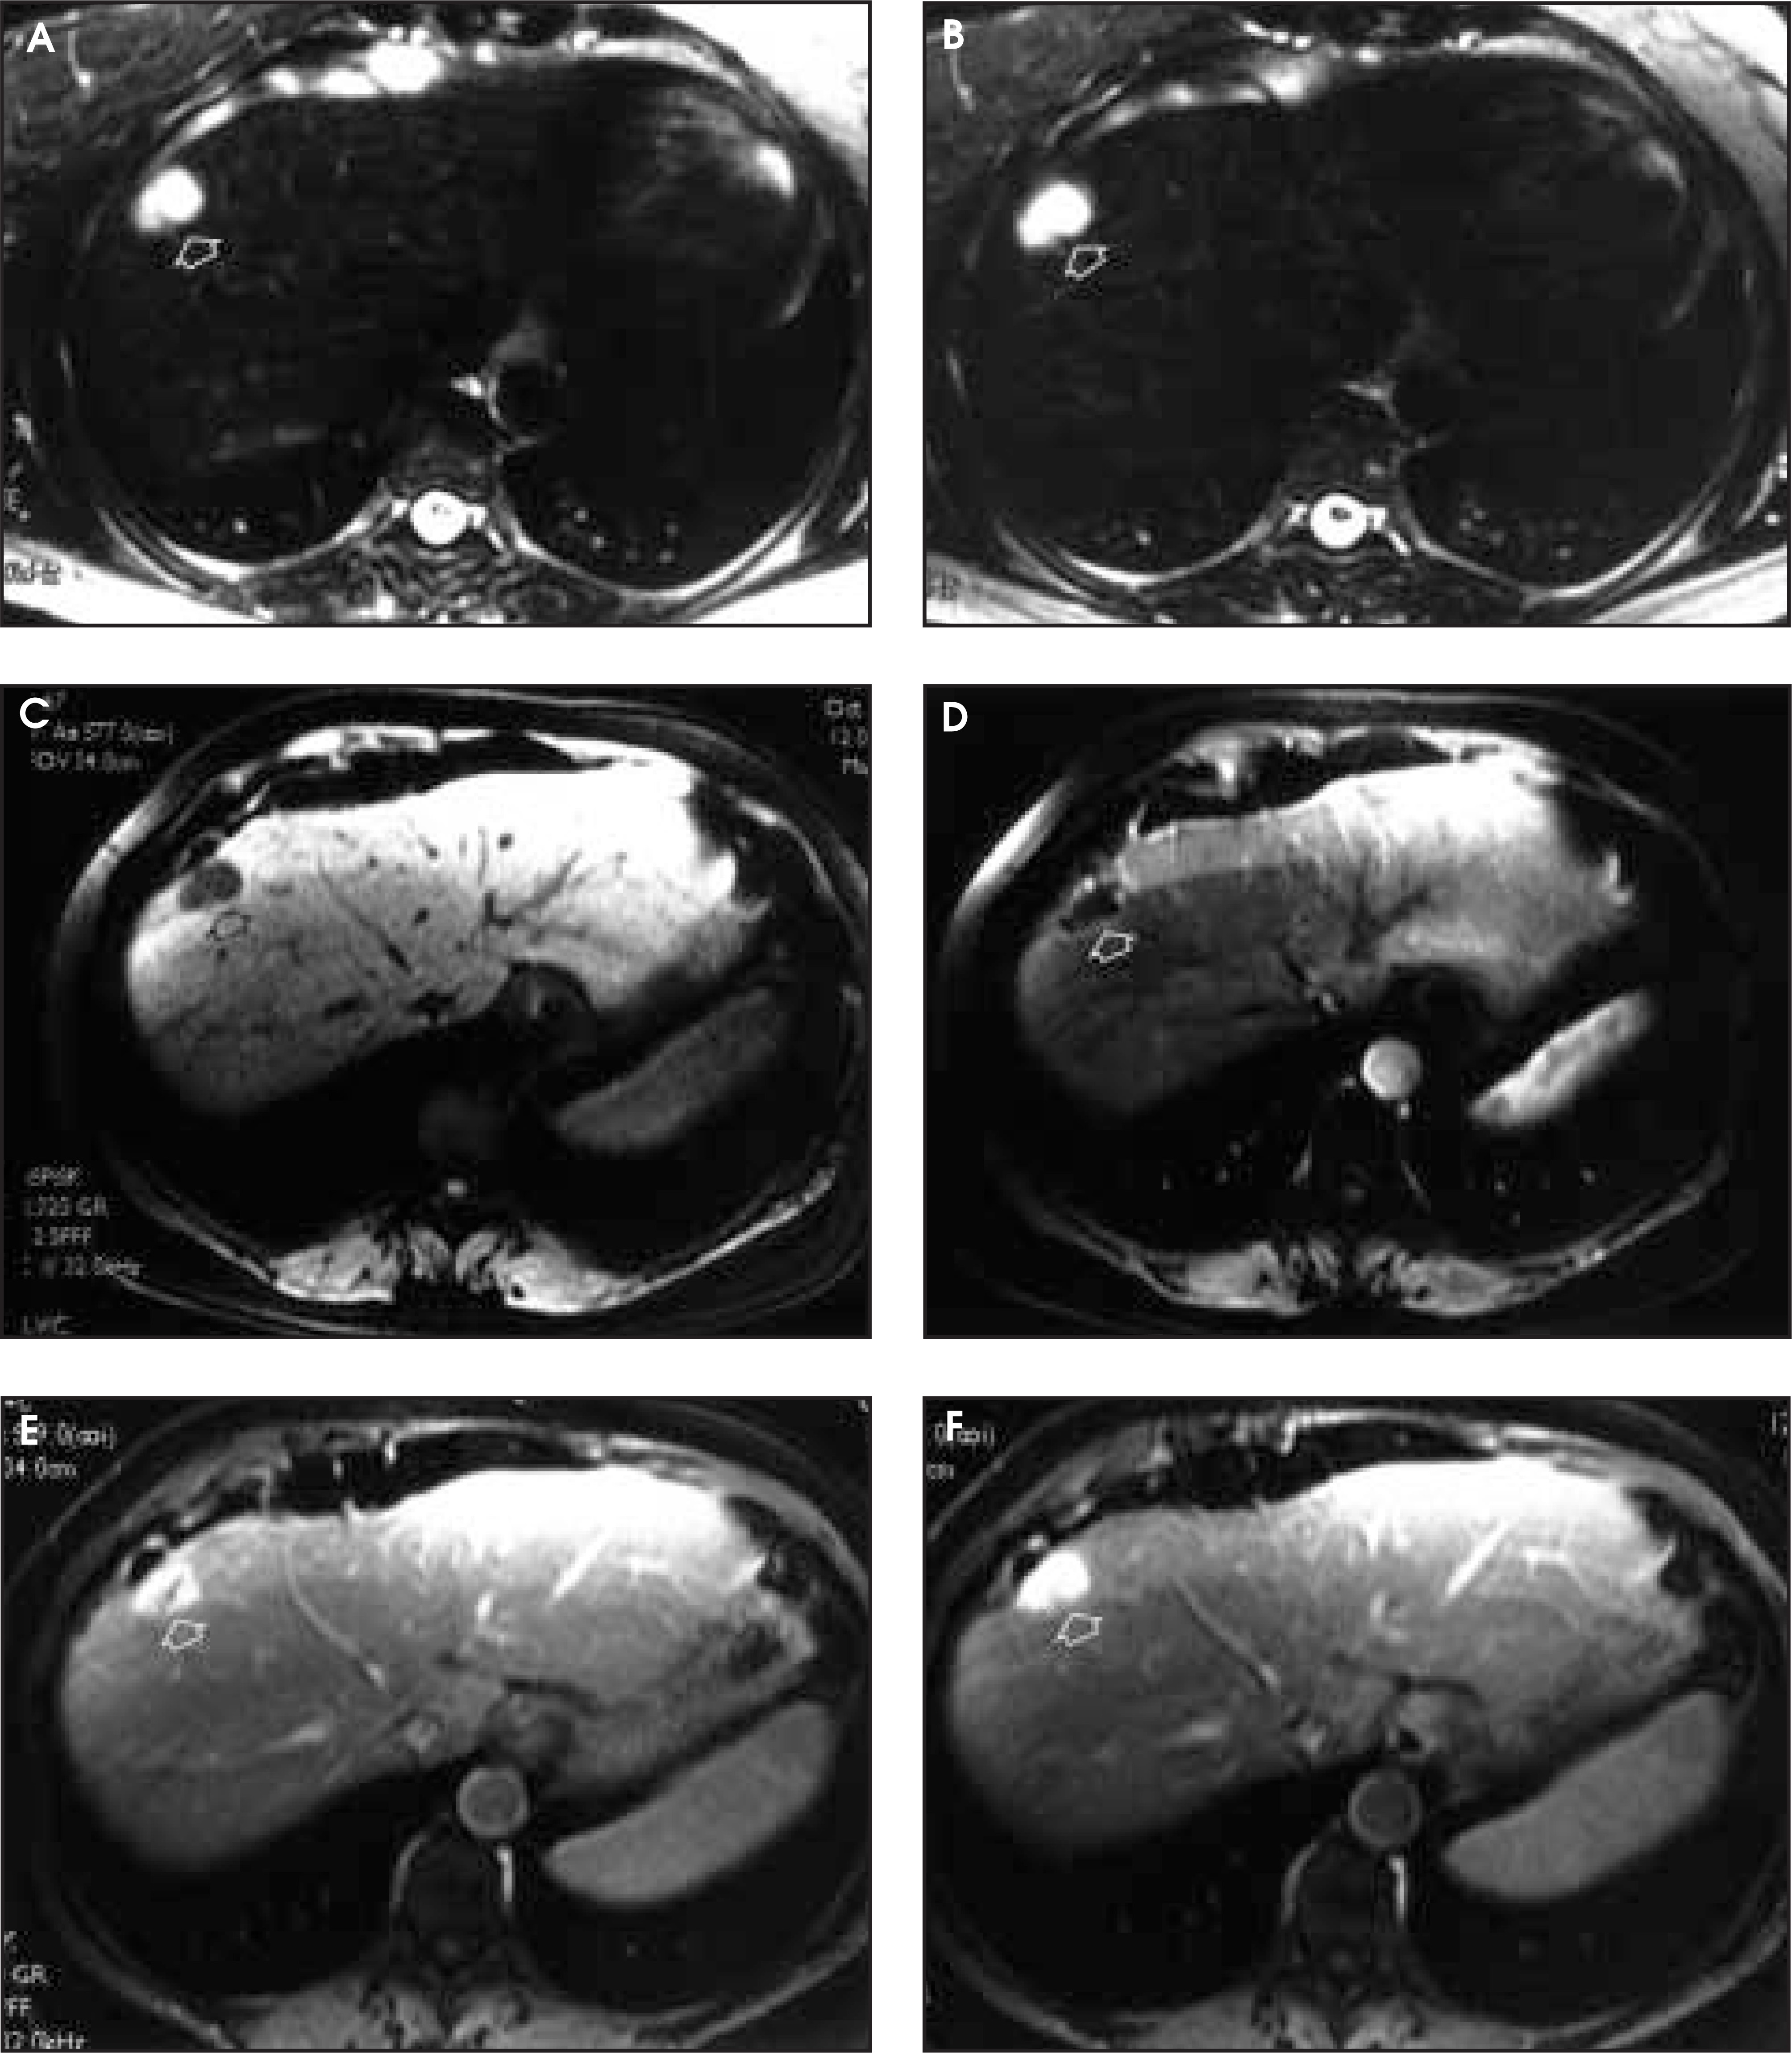
On T2-weighted images, hemangiomas are hyperintense, approaching the signal intensity of cerebrospinal fluid (figures 2A and B).
18
Three patterns of gadolinium enhancement have been described: immediate homogenous enhancement; peripheral, nodular, centripetal enhancement progressing to homogeneity; and peripheral nodular enhancement with a persistent hypointense central region.
18
Centripetal enhancement is the most common enhancement pattern (figures 2C through E).
18
Immediate homogenous enhancement is seen in some hemangiomas smaller than 1.5 cm.
18
Rapid filling-in of these smaller hemangiomas is thought to be related to the smaller vascular spaces and larger interstitium present in these lesions.
19
On delayed gadolinium-enhanced images, regions of persistent central hypointensity in comparison with liver may be present in hemangiomas larger than 5.0 cm.
18
Heterogeneity of large or giant hemangiomas is related to the presence of hemorrhage, thrombosis, extensive hyalinization, liquefaction, and fibrosis.
20
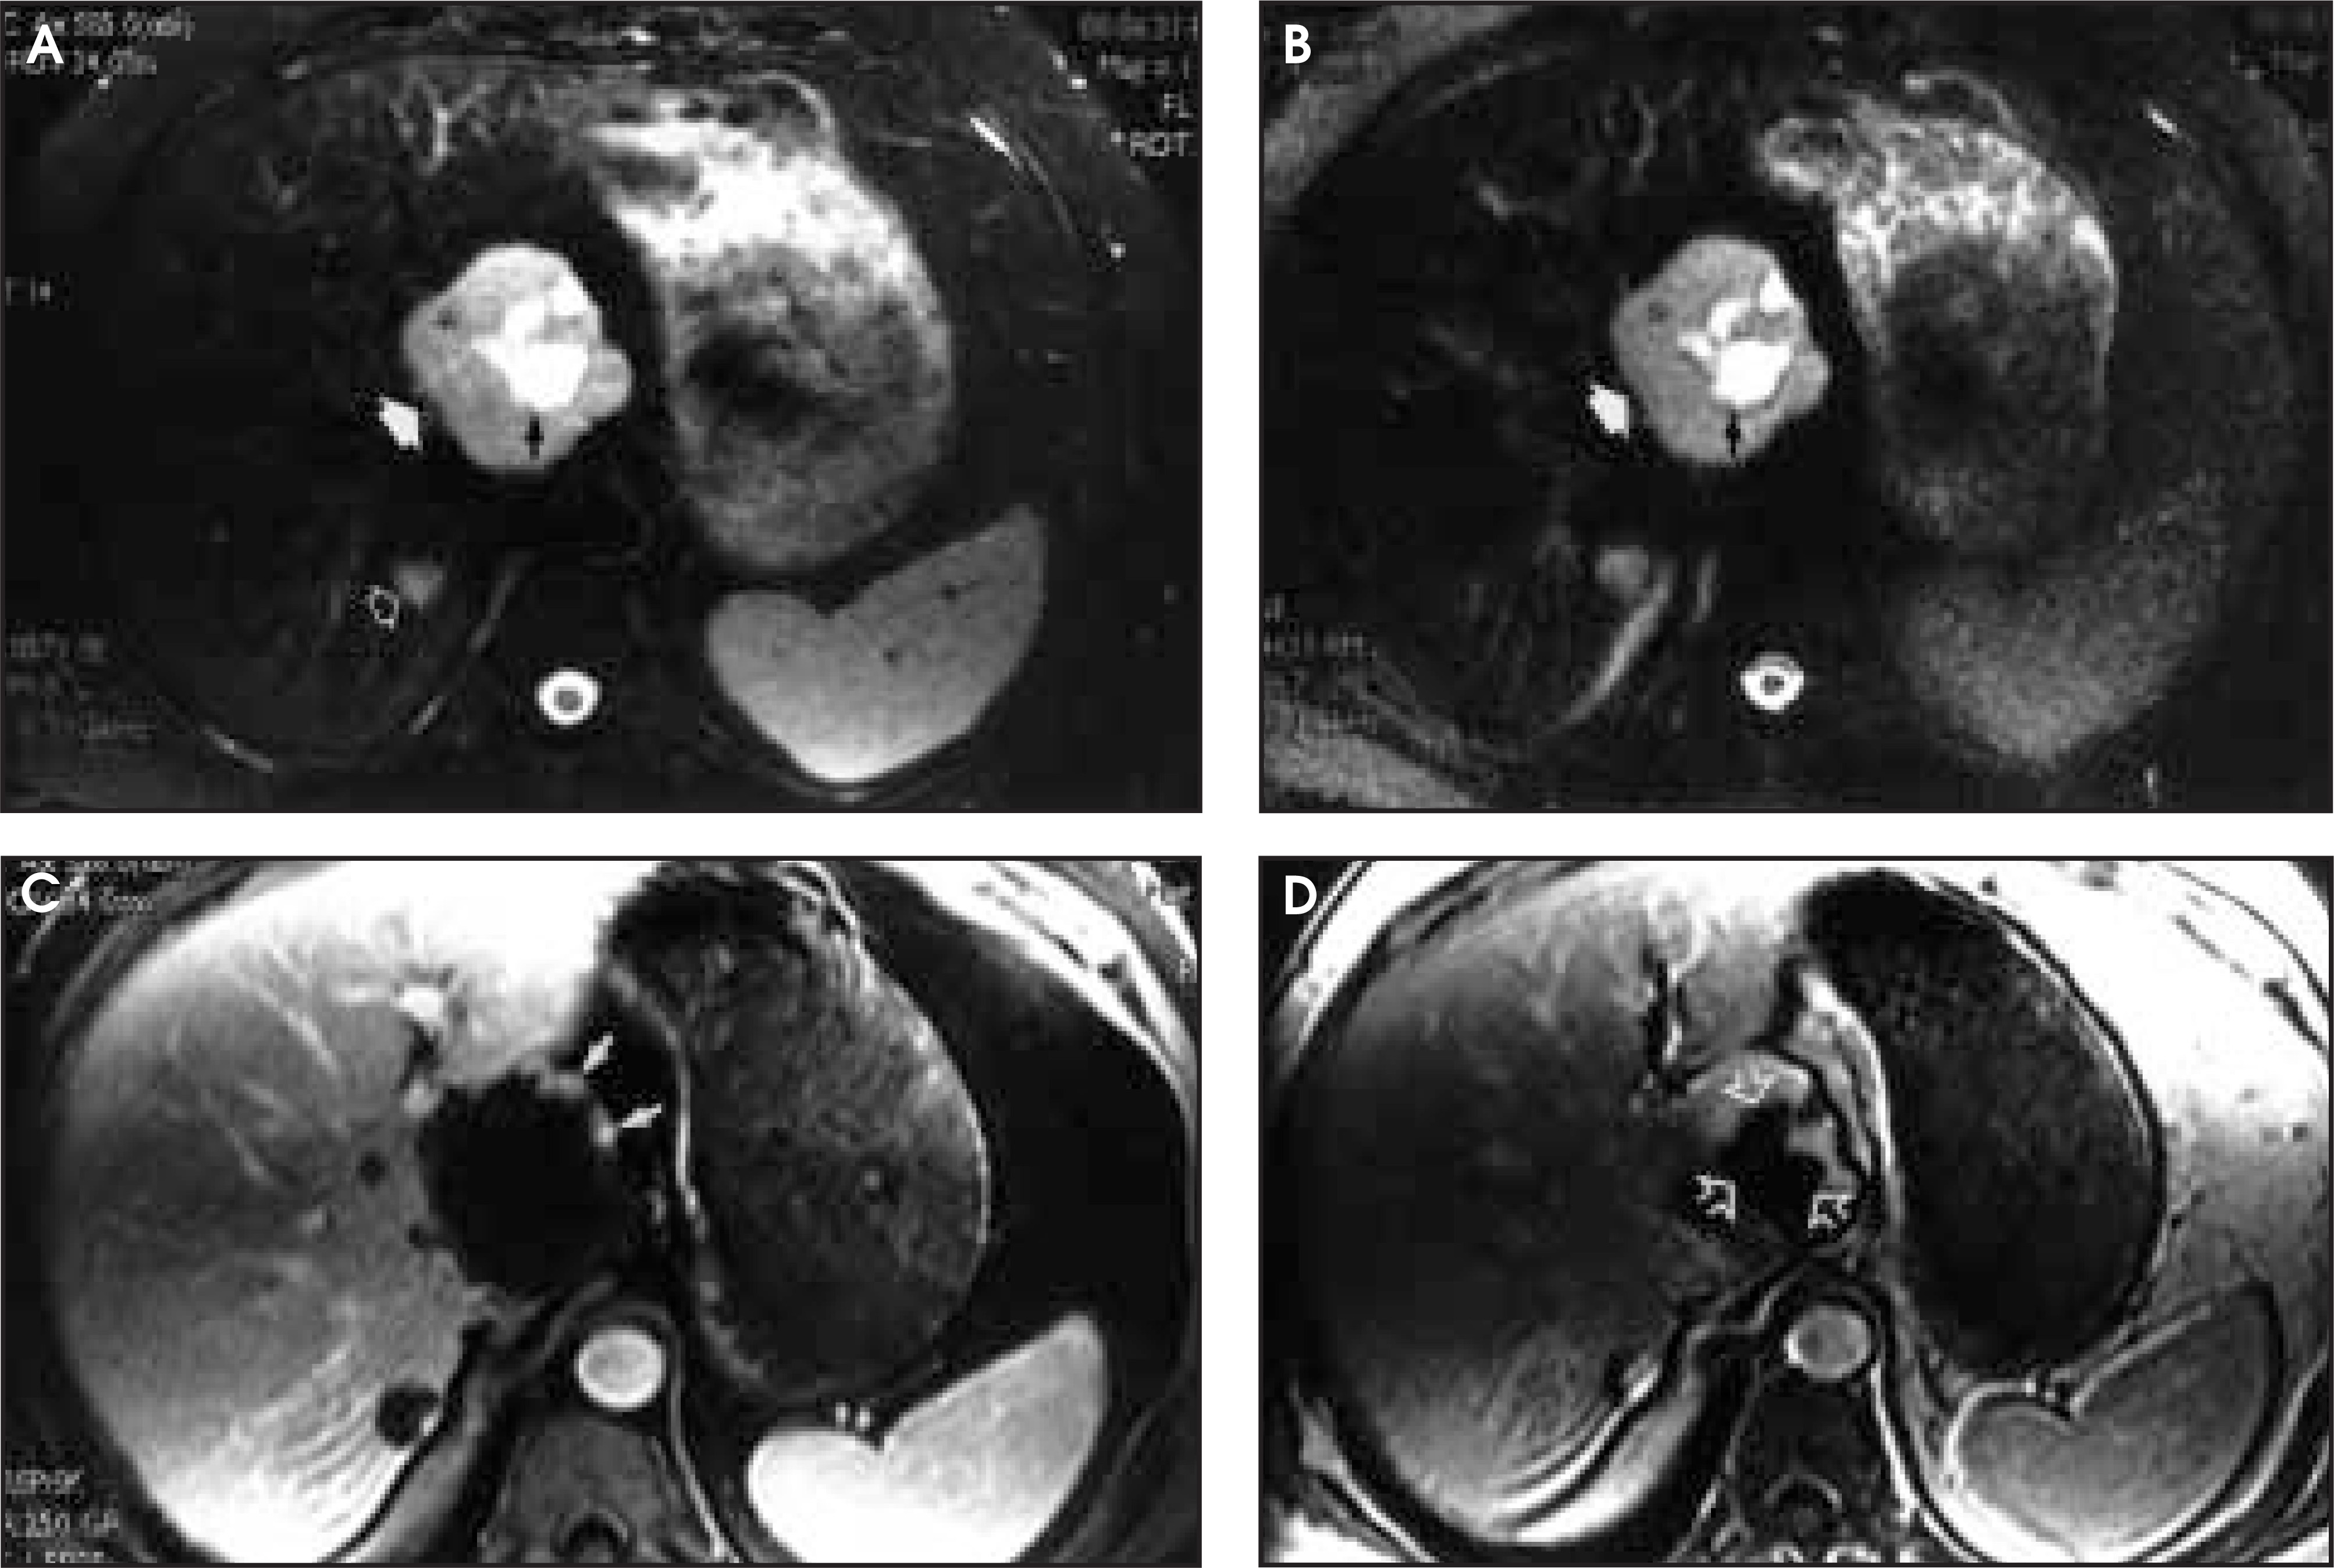
On T2-weighted images, the central cleft-like portion (figures 3A and B) of large hemangiomas is hyperintense in comparison with the remainder of the mass and corresponds to the region of hypointensity on the gadolinium-enhanced images (figures 3C and D); these findings reflect cystic degeneration or liquefaction.
21
Metastases from neuroendocrine tumors, mucinous adenocarcinomas, and leiomyosarcomas may mimic hemangiomas or cysts on T2-weighted images. 22-24 Dynamic gadolinium-enhanced images usually allow distinction of hypervascular or cystic metastases from hemangiomas and benign cysts. 18,23,24 Hypervascular hepatic metastases usually demonstrate intact ring enhancement on images obtained during the arterial phase of enhancement. 23 Peripheral enhancement of metastases may be thin-rim, thick-rind, or reticulated, 25 but not peripheral nodular, like hemangiomas. The peripheral washout sign, defined as a lesion with a peripheral rim of hypointensity relative to its center on delayed gadolinium-enhanced images, has a low sensitivity (24.5%) but 100% specificity for malignant liver lesions and would therefore exclude a diagnosis of hemangioma. 26 Outwater et al 27 found that the subset of rapidly and uniformly enhancing hemangiomas showed significantly increased signal intensity and contrast-to-noise ratios on a heavily T2-weighted pulse sequence allowing discrimination from hypervascular malignant liver lesions, which may appear identical to hemangiomas on dynamic gadolinium-enhanced images.
Benign hepatocellular neoplasms
Cysts, hemangiomas, and metastases appear hypointense to liver on T1-weighted images due to increased free water protons. Hepatic masses isointense or hyperintense to liver on T1-weighted images obtained with high-field magnets are usually of hepatocellular origin. 28-30 This specificity for hepatocellular masses does not necessarily apply for T1-weighted images obtained with low-field magnets or magnets with nonenhanced gradients that preclude use of a TE short enough to avoid T2-weighted contamination. 31
Focal nodular hyperplasia
Focal nodular hyperplasia (FNH) is considered to be a hyperplastic response of hepatic parenchyma to a preexisiting vascular malformation. 32 This benign tumor-like lesion contains disorganized nodules of hepatocytes and Kupffer cells without central veins or portal tracts. The nodules are separated by fibrous septa, which contain small bile ducts that lack communication with the normal biliary tree. 33 FNH is usually solitary (70% to 80% of cases) and is usually <5 cm in diameter. 34 FNH is most often found in women (80% to 95% of cases) in their third or fourth decades of life, but can occur at all ages and in men. 12 Oral contraceptive medications do not cause, but may promote, the growth of FNH. 33
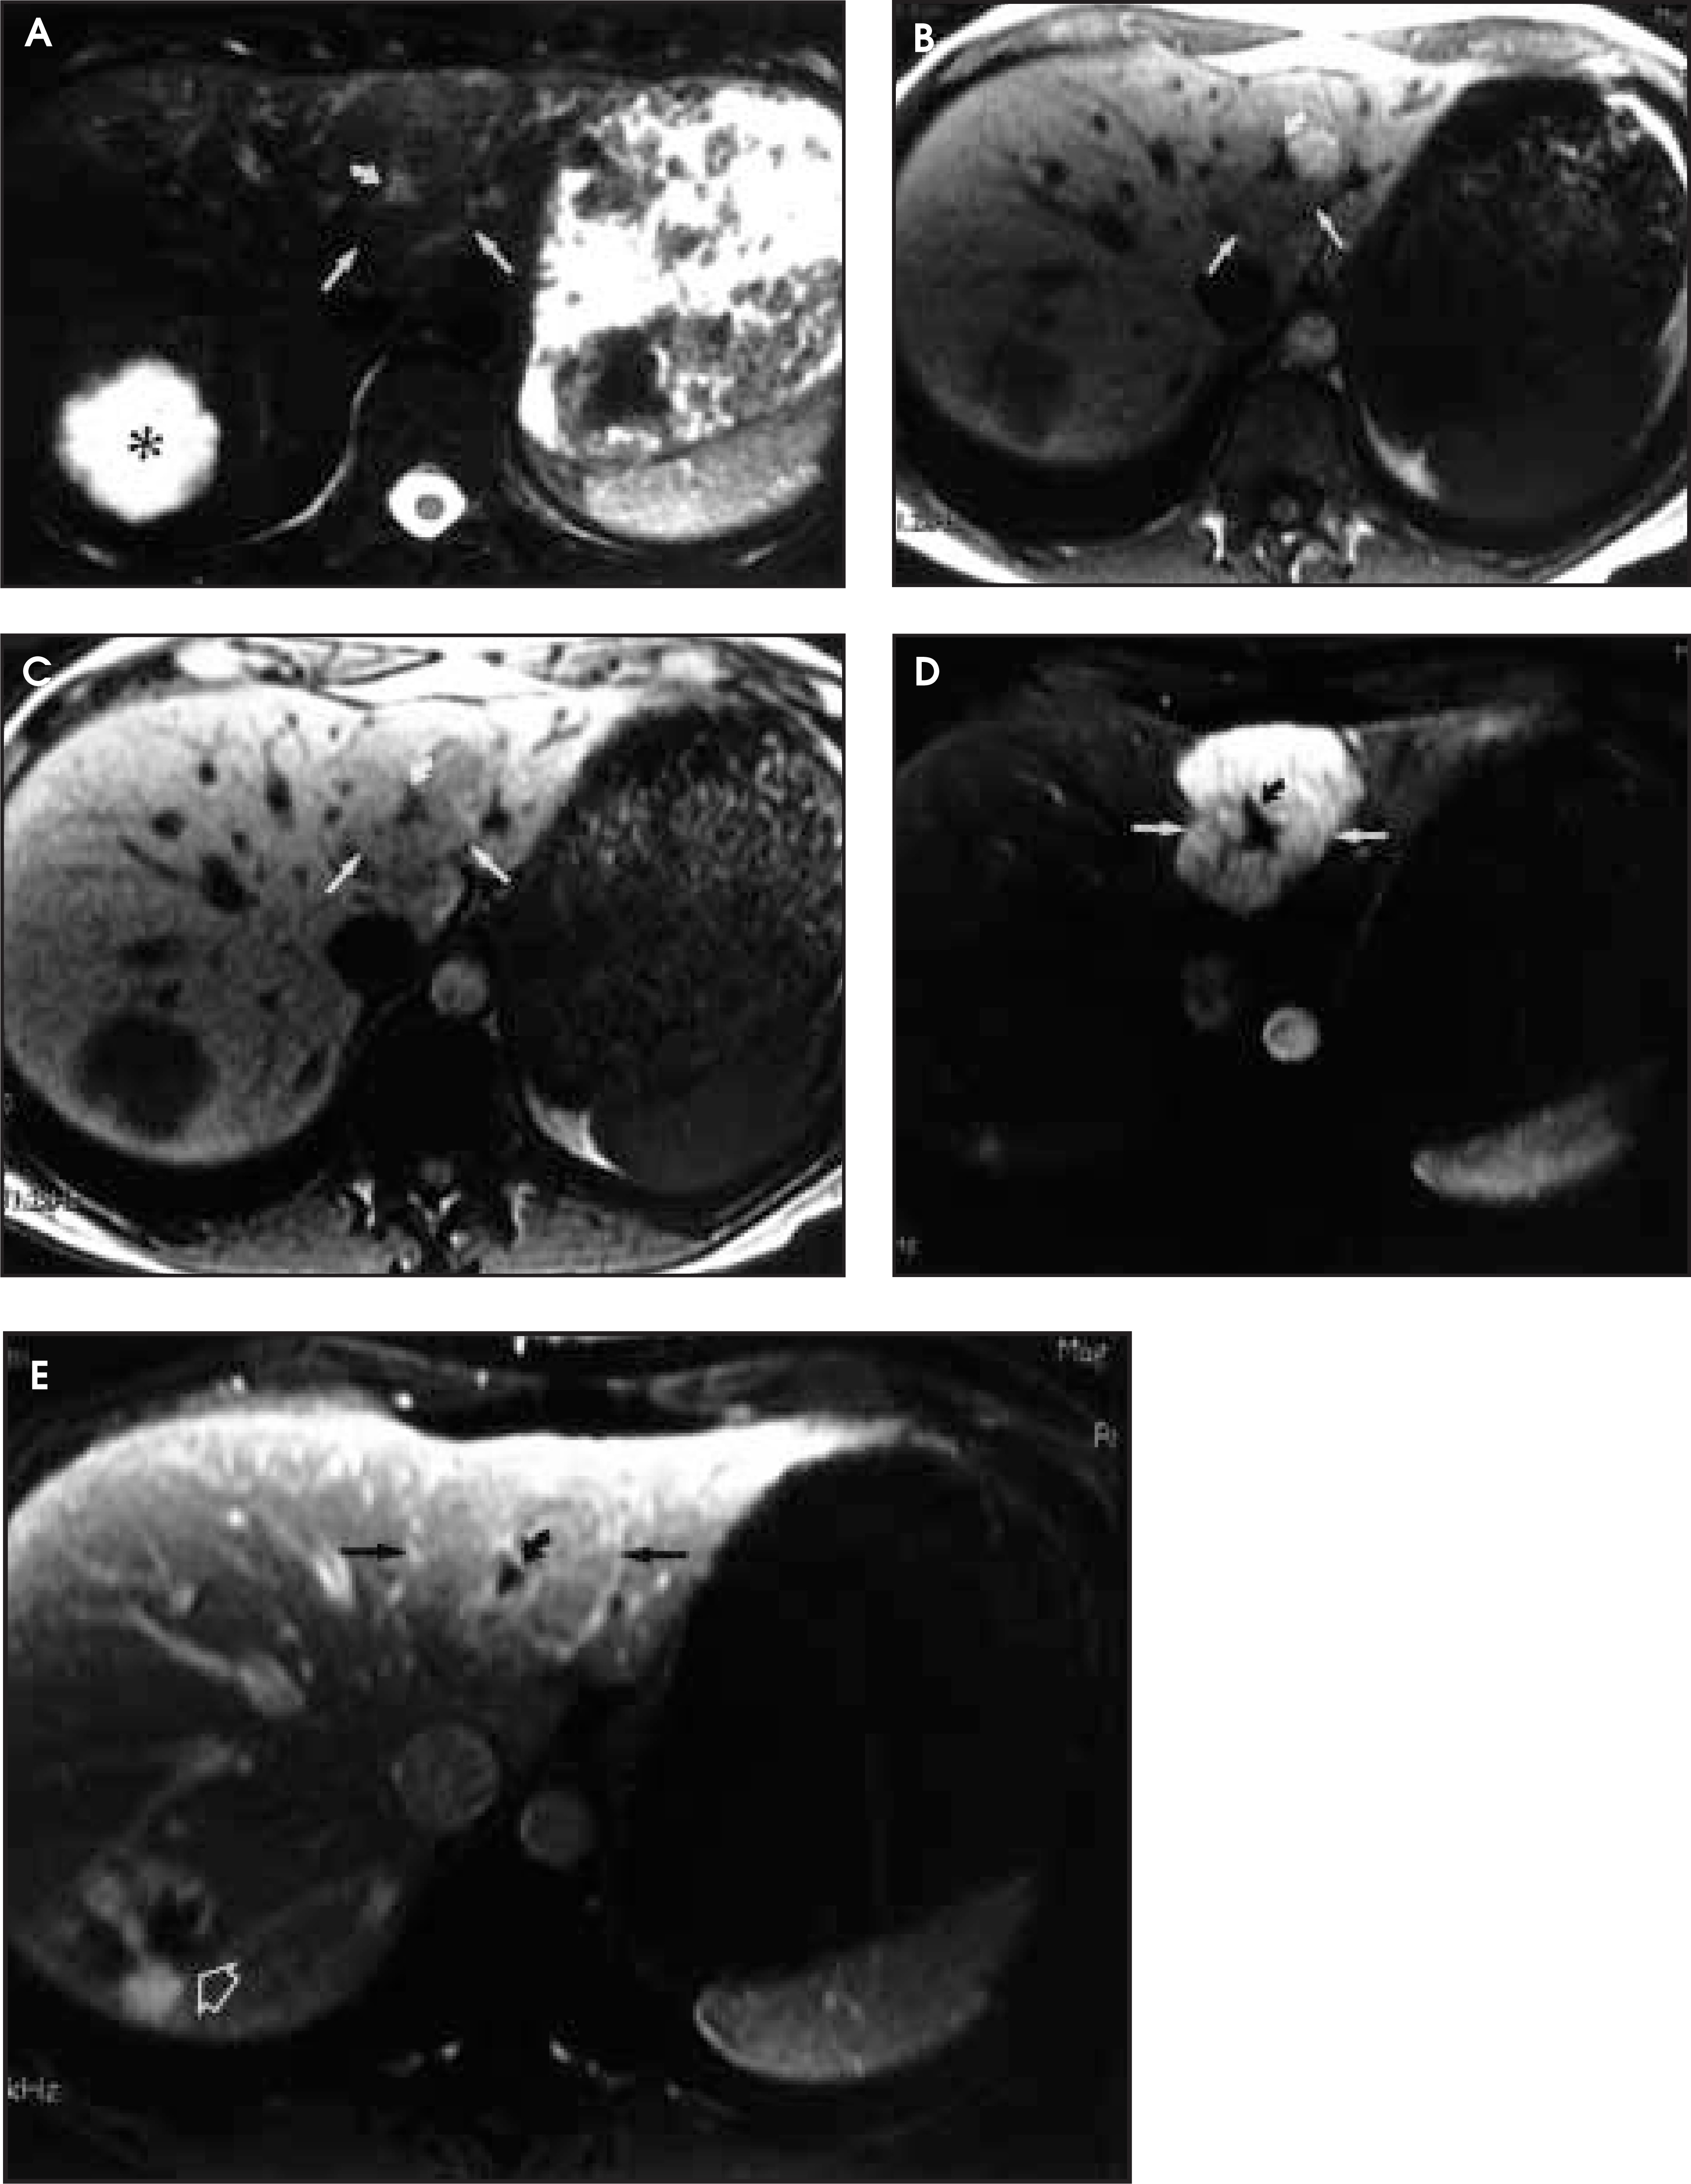
Typical MR imaging features of FNH include isointensity or slight hypointensity compared with liver on T1-weighted images and slight hyperintensity or isointensity compared with liver on T2-weighted images (figures 4A through C).
12,33
FNH is usually homogenous in signal intensity except for a central scar, which is hypointense to the lesion and surrounding liver on T1-weighted images and hyperintense on T2-weighted images.
12,33
After administration of gadolinium-chelates, FNH shows marked hyperintensity in the arterial phase and isointensity in the portal venous phase (figures 4D and E).
33
The central scar demonstrates late enhancement.
33
This characteristic pattern of MR imaging findings is seen in approximately 50% to 70% of these lesions.
35
Atypical imaging features of FNH include nonvisualization or nonenhancement of the central scar.
36
Hepatocellular adenoma
Hepatocellular adenoma is a benign neoplasm of hepatocytes with an absence of normal portal structures. 37 Hepatocellular adenomas are seen in association with use of oral contraceptives, 38 anabolic-androgenic steroids, 39 and glycogen storage disease types I and III. 40 Complications include acute hemorrhage (seen in 50% of patients in one series 41 ) and rare malignant transformation. 42
On MR imaging, hepatic adenomas have a variable appearance with heterogeneity often seen on either the T1-weighted or T2-weighted sequences.
37,43,44
On T1-weighted images, the majority of hepatic adenomas have portions that are hyperintense or isointense to the liver (figure 5A).
37
Hyperintensity on T1-weighted images can be due to the presence of intratumoral lipid, hemorrhage, or concentrated hepatocytes.
37,43,44
Chemical shift imaging can confirm the presence of lipid.
37,45
Most commonly, hepatic adenomas have components that are hyperintense to surrounding liver on T2-weighted images, although they can be isointense or hypointense (figure 5F).
37,44
Heterogeneity on T2-weighted images is related to hemorrhage or necrosis.
37,43,44
In the report by Chung et al,
44
13 of 15 adenomas showed early enhancement on dynamic breath-hold gradient echo imaging (figure 5B). Arterial enhancement of hepatic adenoma is not as great as that of FNH, and a central scar is not present.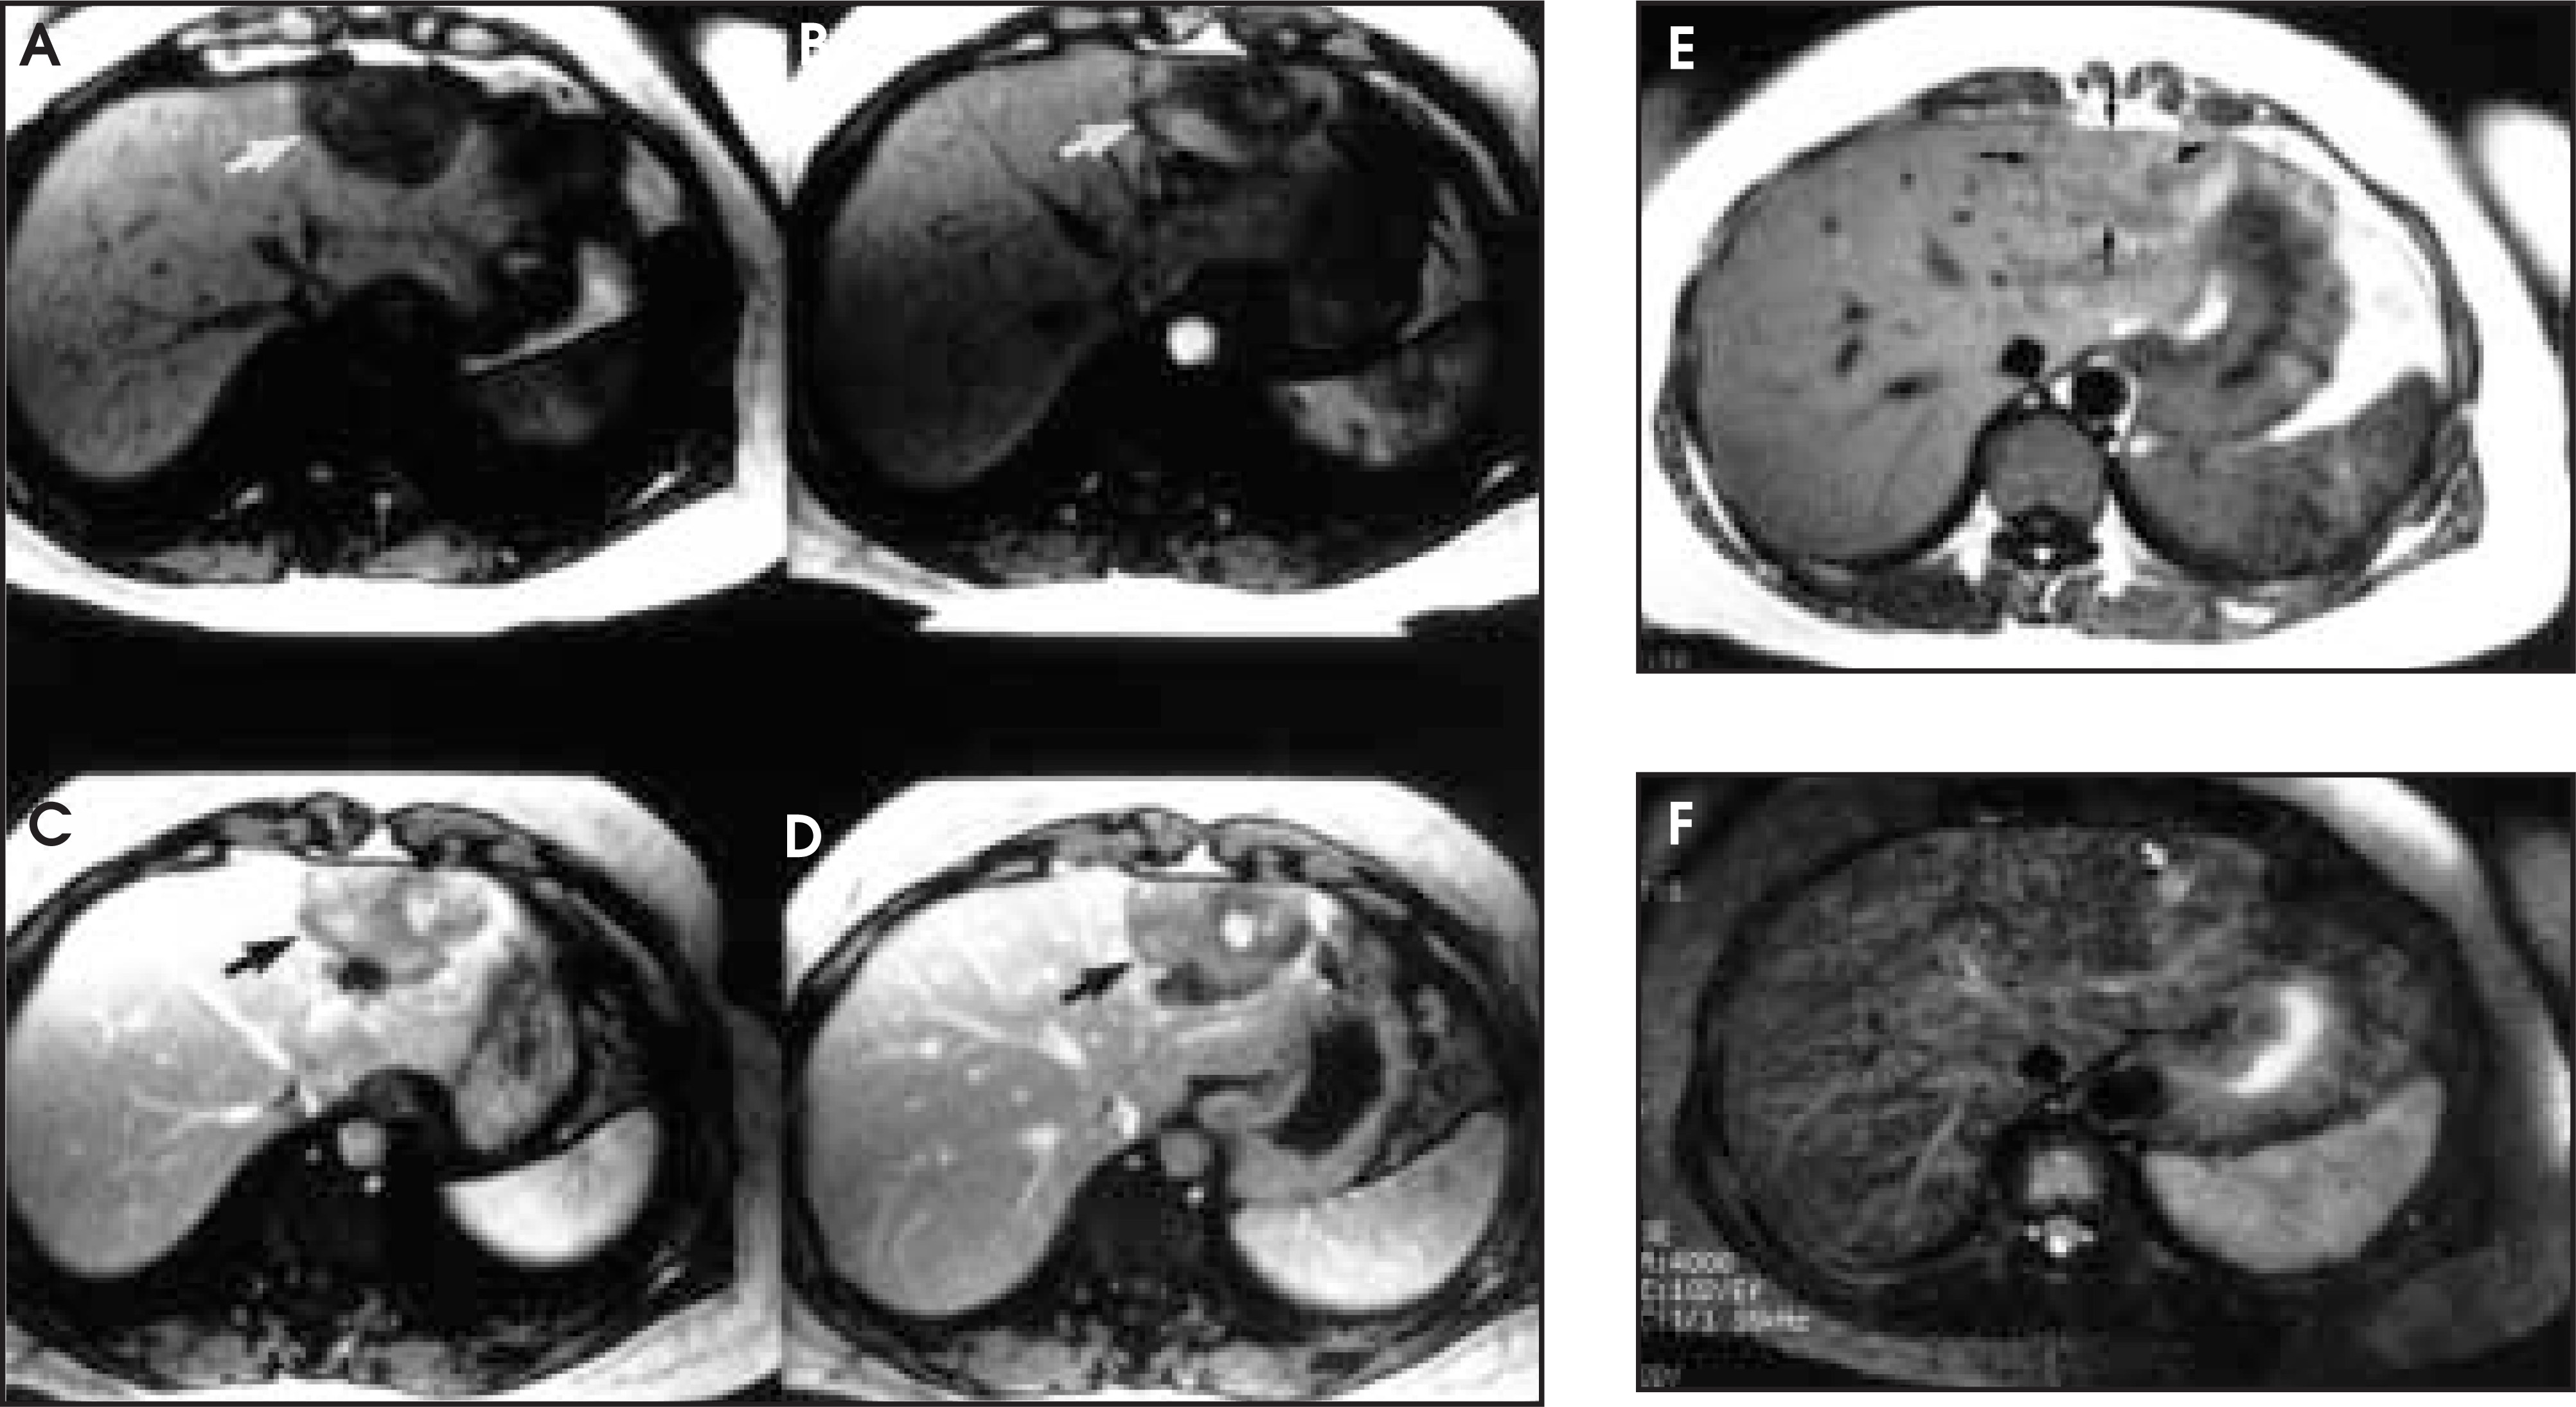
Arrive et al 43 identified a peritumoral rim in 31% of hepatic adenomas. Pathologic correlation in all cases revealed a pseudocapsule composed of compressed adjacent hepatic parenchyma and mild fibrosis. The peripheral rim was usually hypointense to liver on T1-weighted images. On T2-weighted images, the rim had variable signal intensity and was hypointense, isointense, or hyperintense to adjacent liver. In the 11 cases in which gadolinium was administered, only 2 showed enhancement of the rim.
At least one of the following three imaging features was found by Arrive et al 43 in 88% of hepatic adenomas: tumor heterogeneity, peripheral pseudocapsule, or hyperintensity on T1-weighted spin-echo images. These features may allow differentiation from FNH, but not from hepatocellular carcinoma, and pathologic evaluation is recommended. 43 The probability of a lesion representing either a hepatic adenoma or hepatocellular carcinoma can often be predicted based on the clinical setting, as hepatic adenomas usually occur in young women on oral contraceptive medications and hepatocellular carcinoma usually occurs in older men with chronic hepatitis cirrhosis.
Liver adenomatosis is a distinct clinical entity defined by the presence of multiple (arbitrarily >10) hepatic adenomas in an otherwise normal liver. 46 In contrast to liver adenoma, liver adenomatosis affects both men and women, is unrelated to use of oral contraceptive medications, and is commonly associated with increases in serum alkaline phosphatase and g-glutamyl transpeptidase. 46 The MR imaging characteristics of individual lesions in liver adenomatosis are similar to those occurring in women using oral contraceptive medications. 47
Hepatic abscesses
Hepatic abscesses may be pyogenic, fungal, or amebic in etiology. In the United States, most hepatic abscesses are pyogenic, but worldwide, amebic abscesses are the most common. 48 Pyogenic abscesses originate from biliary or hematogenous sources. 49 Biliary sources include cholecystitis or ascending cholangitis, as well as complications from biliary surgery or interventional procedures. 49 Hematogenous spread may occur through the portal vein from enteric sources or the hepatic artery in septicemia. 49
The MR imaging appearance of hepatic abscesses is nonspecific.
49
The clinical history is often contributory. The presence of multiple lesions demonstrating high T2-weighted signal, perilesional edema, and rim enhancement is suggestive of abscesses.
49
Mendez et al
49
reported a cluster of small abscesses found in 5 of 8 patients with pyogenic abscesses of biliary origin. This “cluster sign” is an insensitive but specific finding of pyogenic abscess (figure 6B), and is rarely present with metastatic disease.
50
Rim enhancement of abscesses assists in the discrimination from other lesions with high T2-weighted signal such as cysts and hemangiomas.
49
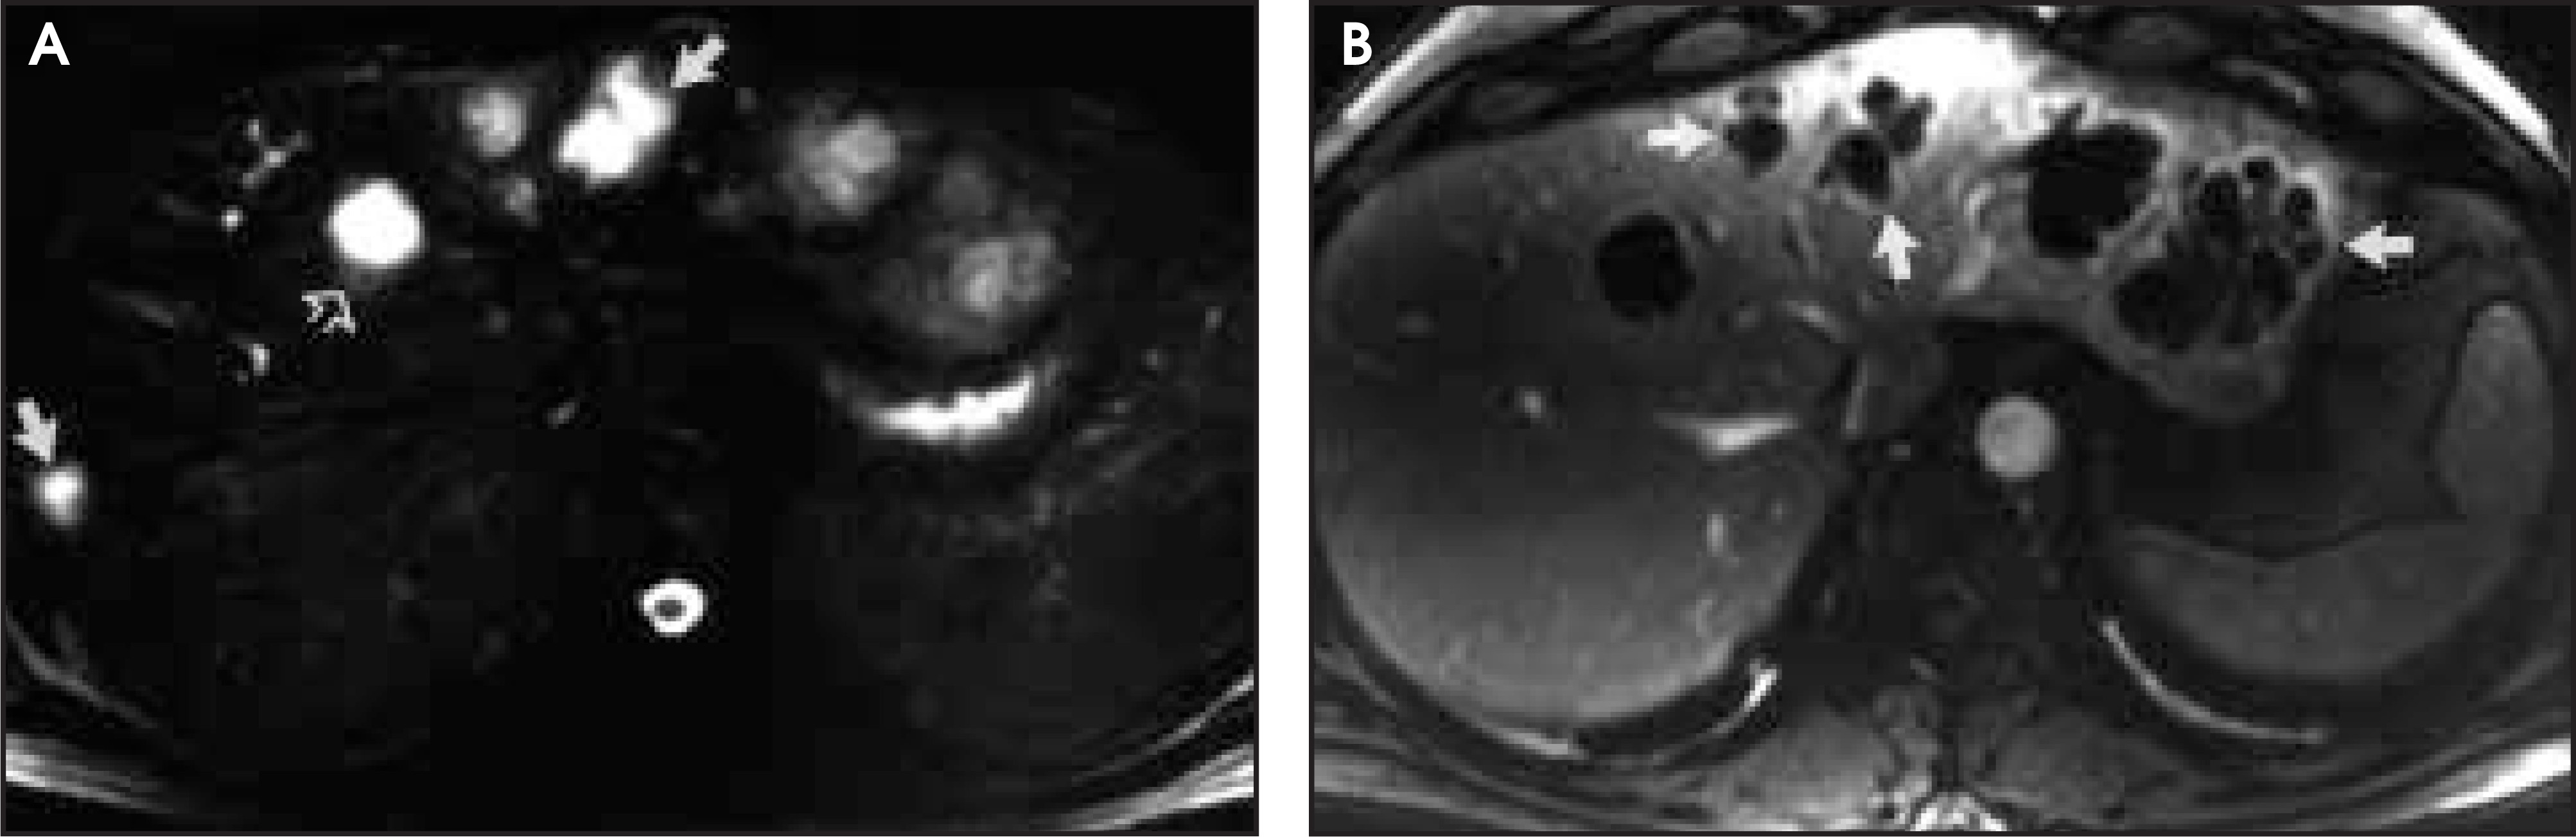
Hepatosplenic fungal disease is usually caused by Candida and occurs in the setting of profound neutropenia. MR imaging has proven superior to CT in detecting hepatosplenic fungal disease. 51 In the acute presentation (¾ 2 weeks of possible infection), fungal microabscesses are seen as foci of high signal intensity on fat-suppressed T2-weighted images. 52 The lesions are minimally hypointense to liver on both unenhanced and enhanced T1-weighted images, and perilesional enhancement is not observed in most patients. 52
Focal hepatic steatosis and focal fatty sparing
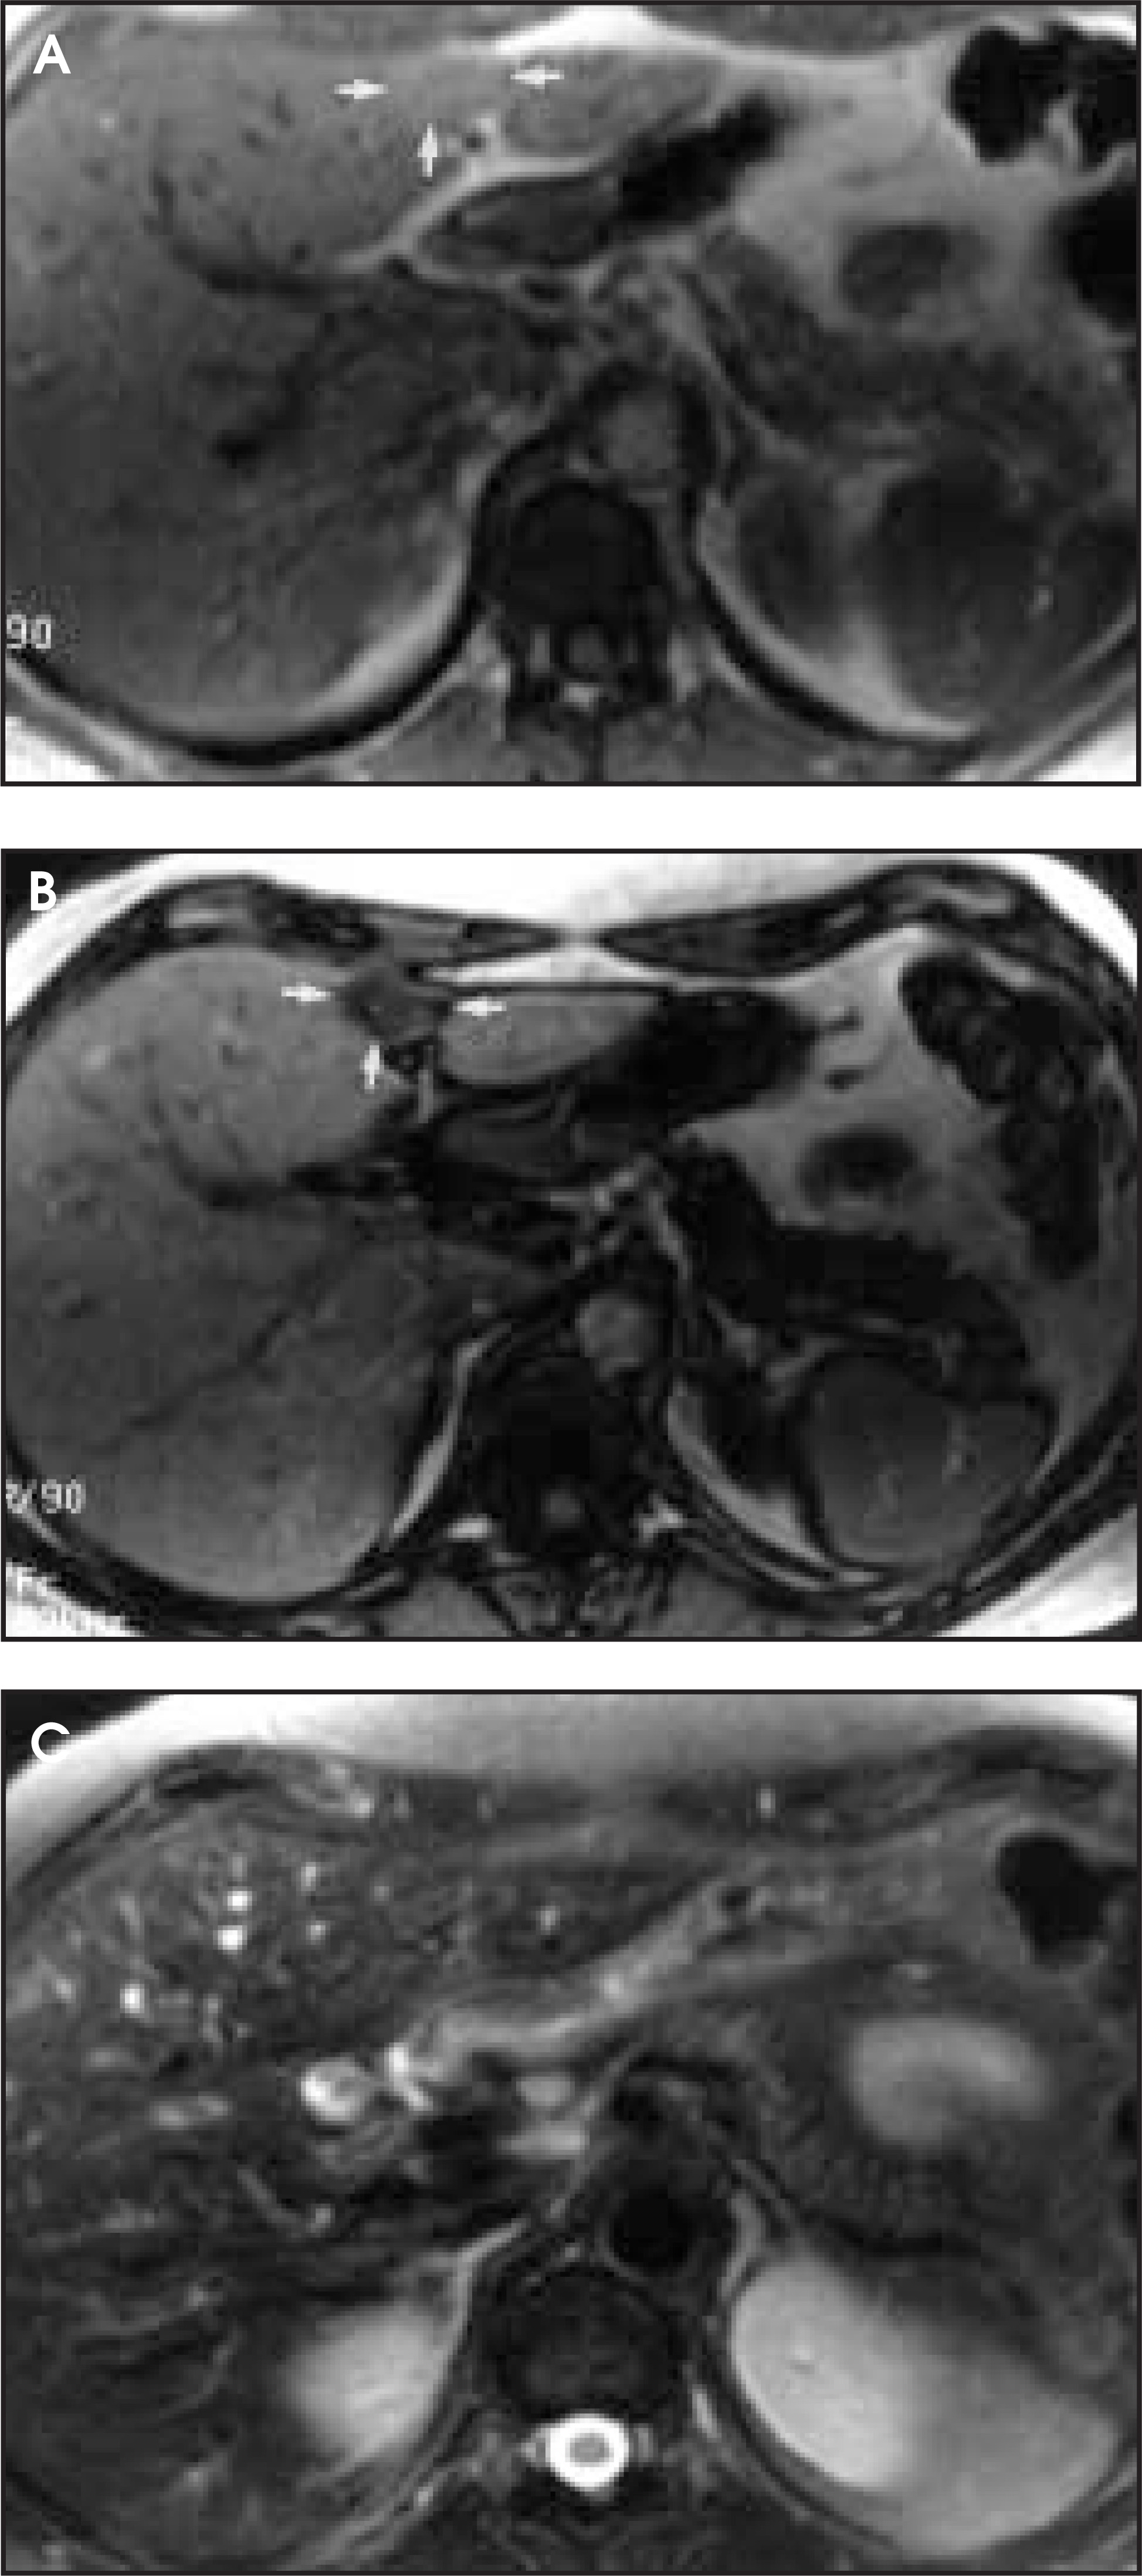
Focal hepatic steatosis and focal fatty sparing can result in hepatic “pseudolesions” that may be mistaken for malignancy. Chemical shift imaging can confirm the presence of microscopic lipid with loss of signal intensity demonstrated on opposed-phase images in comparison with in-phase images (figures 7A through C).
45
Imaging features suggestive of focal hepatic steatosis or sparing include periligamentous and periportal locations, geographic margins with lack of mass effect, and lack of distortion of traversing blood vessels.
53
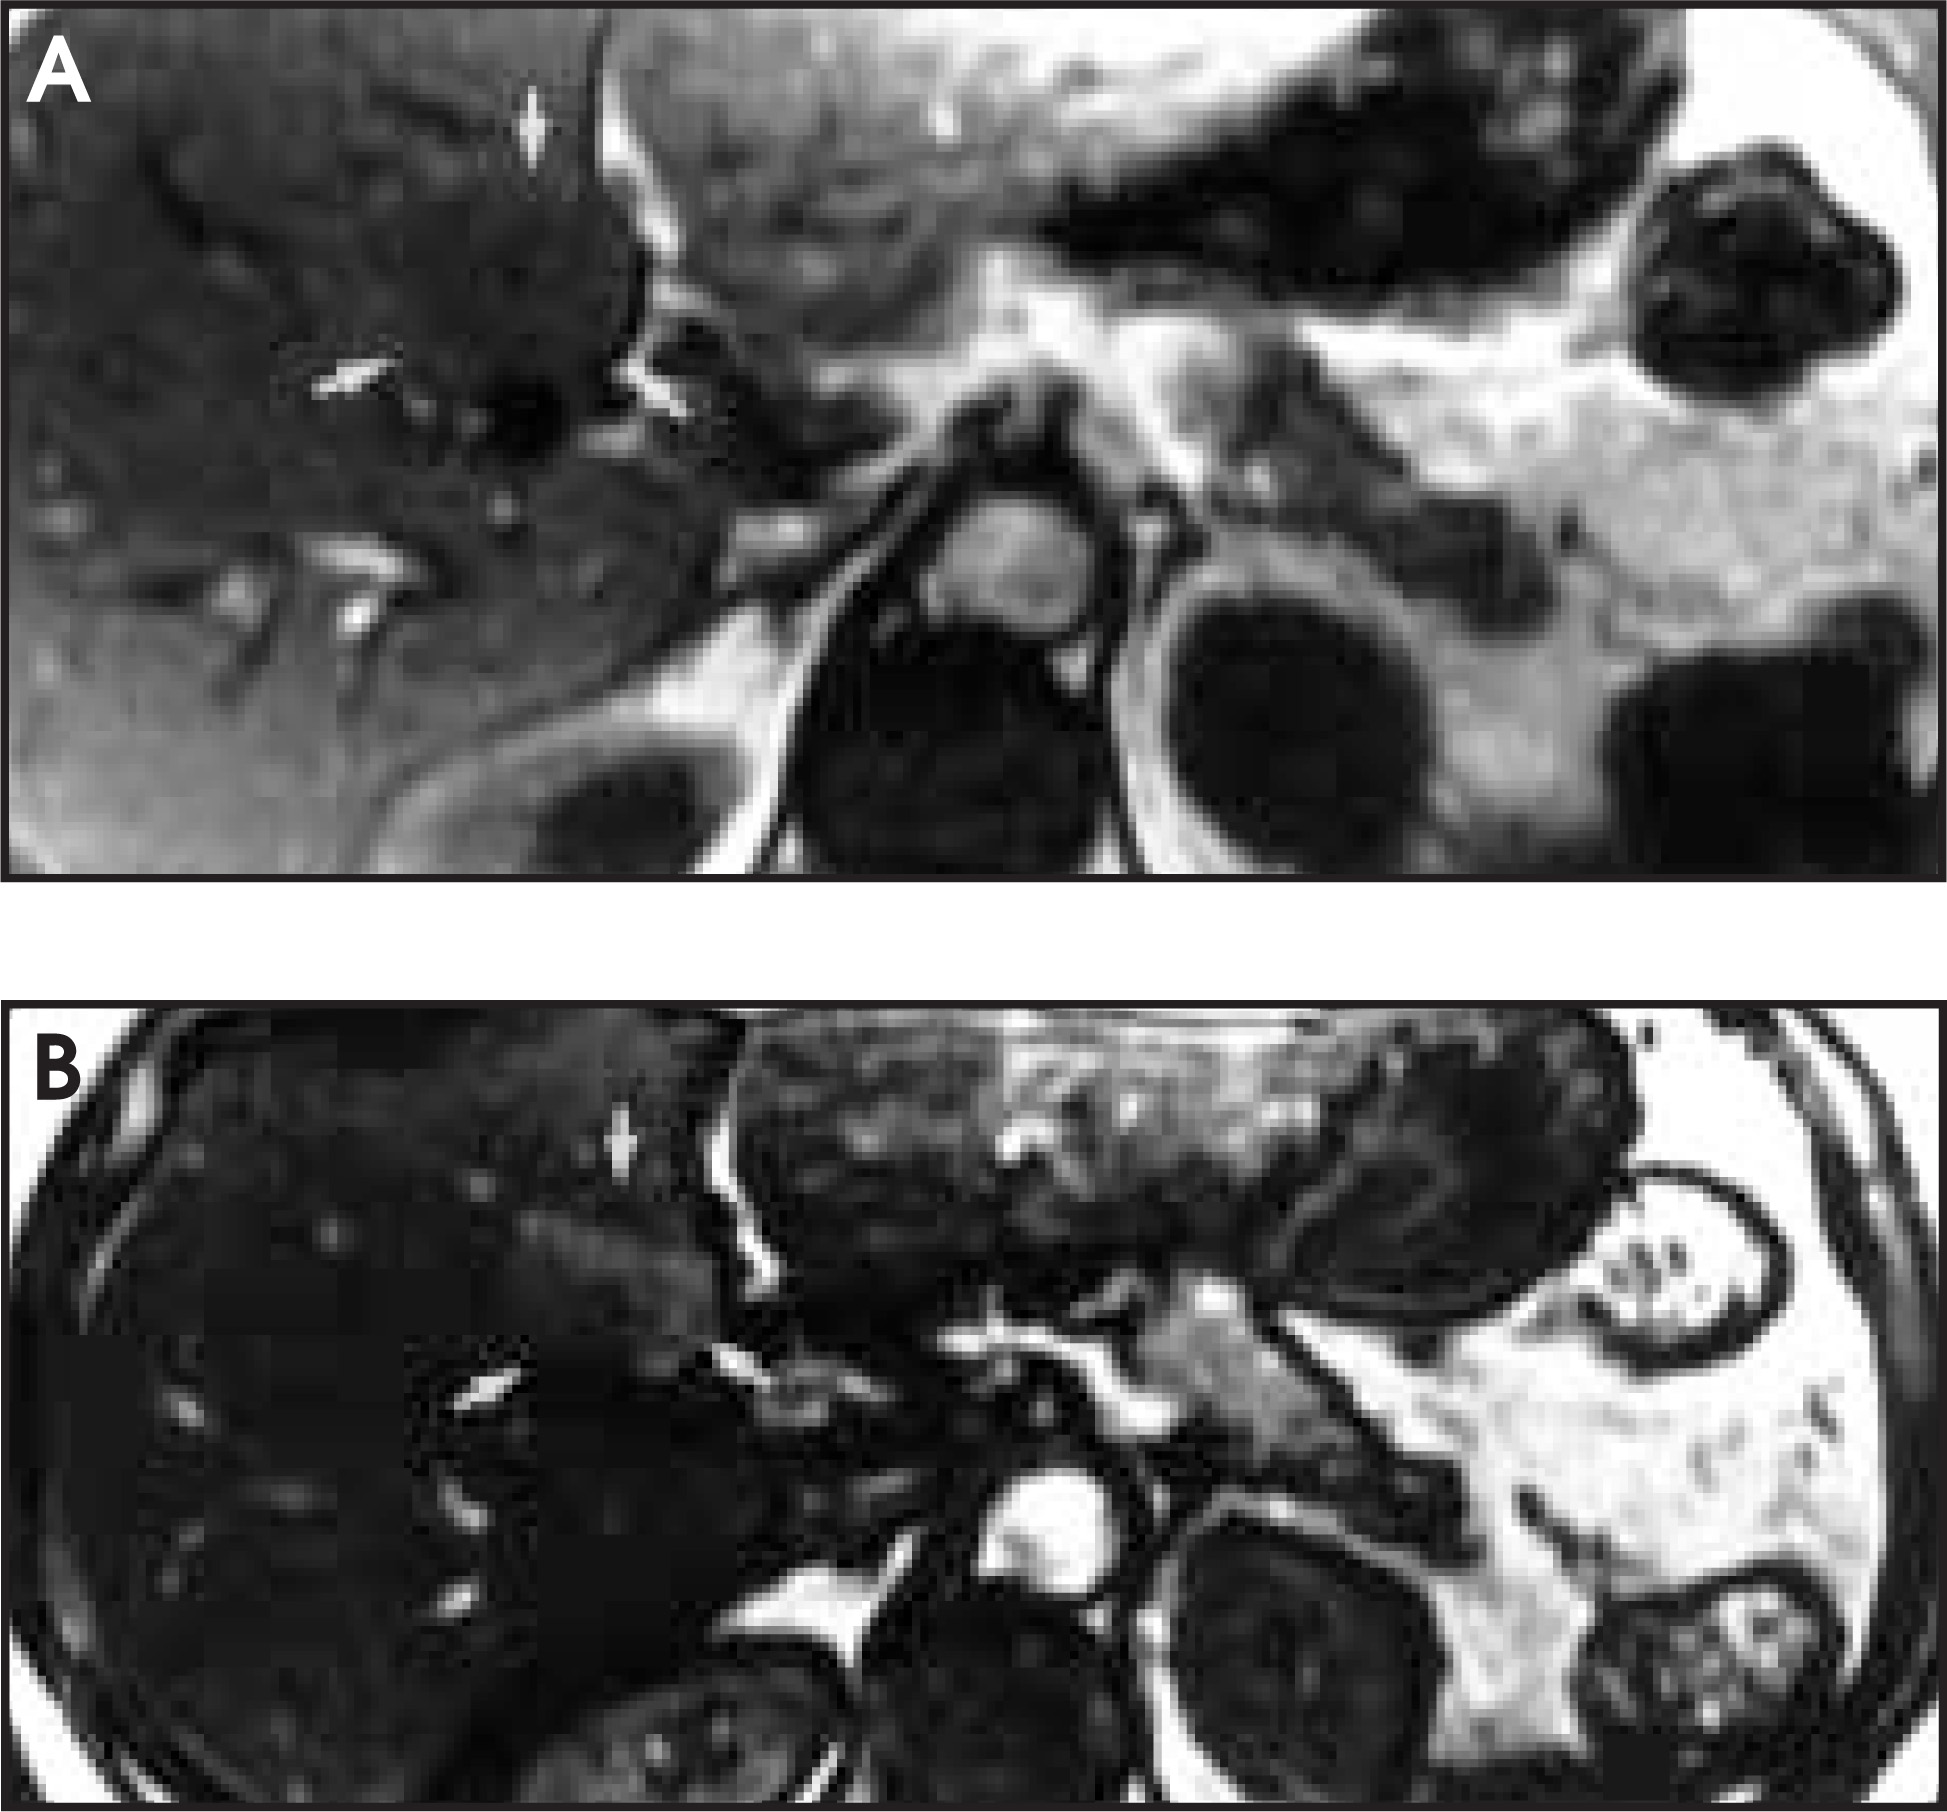
Decreased portal venous blood supply to the medial segment of the left hepatic lobe from aberrant gastric venous drainage is thought to result in the fatty sparing in this location (figures 8A and B).
54,55
Focal fatty sparing or pseudolesions around the falciform ligament may be due to aberrant blood supply from the internal thoracic artery.
56
Why focal hepatic steatosis can occur in the same locations as focal fatty sparing is uncertain, but it may be due to decreased delivery of unknown substances from the portal vein or relative ischemia secondary to diminished portal venous supply.
53
>Conclusion
Magnetic resonance can detect and characterize the majority of benign focal liver lesions. The ability to detect intratumoral lipid, characterize hepatocellular neoplasms, and distinguish between solid and nonsolid liver lesions makes MR an ideal imaging modality for hepatic lesion evaluation. AR
References
- Campeau N, Johnson C, Felmlee J. MR imaging of the abdomen with a phased-array multicoil: Prospective clinical evaluation. Radiology.. 1995;195:769-776.
- Martin J, Sentis M, Puig J. Comparison of in-phase and opposed-phase GRE and conventional SE MR pulse sequences in T1-weighted imaging of liver lesions. J Comput Assist Tomogr.. 1996;20:890-897.
- Yamashita Y, Hiroaki Y, Namimoto T. Phased array breath hold versus non-breath-hold MR imaging of focal liver lesions: A prospective comparative study. J Magn Reson Imaging.. 1997;7:292-297.
- Kanematsu M, Hoshi H, Itoh K. Focal hepatic lesion detection: Comparison of four fat-suppressed T2-weighted MR imaging pulse sequences. Radiology.. 1999;211:363-371.
- Keogan M, Spritzer C, Paulson E. Liver MR imaging: Comparison of respiratory triggered fast spin echo with T2-weighted spin-echo and inversion recovery. Abdom Imaging. 1996;21:433-439.
- Spritzer C, Keogan M, Delong D. Optimizing fast spin echo acquisitions for hepatic imaging in normal subjects. J Magn Reson Imaging.. 1996;1:128-135.
- McFarland E, Mayo-Smith W, Saini S. Hepatic hemangiomas and malignant tumors: Improved differentiation with heavily T2-weighted conventional spin-echo MR imaging. Radiology. 1994;193:43-47.
- Ito K, Mitchell D, Outwater E. Hepatic lesions: Discrimination of nonsolid benign lesions from solid, malignant lesions with heavily T2-weighted fast spin-echo MR imaging. Radiology. 1997;204:729-737.
- Lee V, Lavelle M, Rofsky N. Hepatic MR imaging with a dynamic contrast-enhanced isotropic volumetric interpolated breath-hold examination: Feasibility, reproducibility, and technical quality. Radiology.. 2000;215:365-372.
- Ito K, Mitchell D, Matsunaga N. MR imaging of the liver: Techniques and clinical applications. Eur J Radiol.. 1999;32:2-14.
- Gaines P, Sampson M. The prevalence and characterization of simple hepatic cysts by ultrasound examination. Br J Radiol.. 1989;62:335-337.
- Mathieu D, Vilgrain V, Mahfouz A. Benign liver tumors. Magn Reson Imaging Clin N Am.. 1997;5:255-288.
- Levine E, Cook L, Grantham J. Liver cysts in autosomal-dominant polycystic kidney disease: Clinical and computed tomographic study. AJR Am J Roentgenol.. 1985;145:229-233.
- Kida T, Yasuni N, Terada. Cystic dilatation of peribiliary glands in livers with adult polycystic disease and livers with solitary nonparasitic cysts: An autopsy study. Hepatology.. 1992;16:334-340.
- Terada T, Nakanuma Y. Pathological observations of intrahepatic peribiliary glands in 1,000 consecutive autopsy livers. III. Survey of necroinflammation and cystic dilatation. Hepatology. 1990;12:1229-1233.
- Baron R, Campbell W, Dodd G. Peribiliary cysts associated with severe liver disease: Imaging-pathologic correlation. AJR Am J Roentgenol.. 1994;162:631-636.
- Itai Y, Ebihara R, Tohno E. Hepatic peribiliary cysts: Multiple tiny cysts within the larger portal tract, hepatic hilum, or both. Radiology.. 1994;191:107-110.
- Semelka R, Brown E, Ascher S. Hepatic hemangiomas: A multi-institutional study of appearance on T2-weighted and serial gadolinium enhanced gradient-echo MR images. Radiology.. 1994;192:401-406.
- Yamashita Y, Ogata I, Urata J. Cavernous hemangioma of the liver: Pathologic correlation with dynamic CT findings. Radiology.. 1997;203:121-125.
- Vilgrain V, Boulos L, Vulluerme M. Imaging of atypical hemangiomas of the liver with pathologic correlation. Radiographics.. 2000;20:379-397.
- Choi B, Han M, Park J. Giant cavernous hemangioma of the liver: CT and MR imaging in 10 cases. AJR Am J Roentgenol.. 1989;152:1221-1226.
- Li K, Glazer G, Quint L. Distinction of hepatic cavernous hemangioma from hepatic metastases with MR imaging. Radiology. 1988;169:409-415.
- Larson R, Semelka R, Bagley A. Hypervascular malignant liver lesions: Comparison of various MR imaging pulse sequences and dynamic CT. Radiology.. 1994;192:393-399.
- Soyer P, Gueye C, Someveille E. MR diagnosis of hepatic metastases from neuroendocrine tumors versus hemangiomas: Relative merits of dynamic gadolinium chelate-enhanced gradient-recalled echo and unenhanced spin-echo images. AJR Am J Roentgenol.. 1995;165:1407-1413.
- Whitney W, Herfkens R, Jeffrey R. Dynamic breath-hold multiplanar spoiled gradient-recalled MR imaging with gadolinium enhancement for differentiating hepatic hemangiomas from malignancies at 1.5 T. Radiology. 1993;189:863-870.
- Mahfouz A, Hamm B, Wolf K. Peripheral washout: A sign of malignancy on dynamic gadolinium enhanced MR images of focal liver lesions. Radiology.. 1994;190:49-52.
- Outwater E, Ito K, Siegelman E. Rapidly enhancing hepatic hemangiomas at MRI: Distinction from malignancies with T2-weighted images. J Magn Reson Imaging.. 1997;7:1033-1039.
- Earls J, Theise N, Weinreb J. Dysplastic nodules and hepatocellular carcinoma: Thin section MR imaging of explanted cirrhotic livers with pathologic correlation. Radiology. 1996;201:207-217.
- Mitchell D, Palazzo J, Hann H. Hepatocellular tumors with high signal on T1-weighted MR images: Chemical shift MR imaging and histologic correlation. J Comput Assist Tomogr.. 1991;15:762-769.
- Siegelman E, Outwater E, Furth E. MR imaging of hepatic nodular regenerative hyperplasia. J Magn Reson Imaging.. 1995;5:730-732.
- Siegelman E, Outwater E. MR imaging techniques of the liver. Rad Clin N Am.. 1998;36:263-286.
- Wanless I, Mawdsley C, Adams R. On the pathogenesis of focal nodular hyperplasia of the liver. Hepatology.. 1985;5:1194-1200.
- Buetow P, Pantongrag-Brown L, Buck J. Focal nodular hyperplasia of the liver: Radiologic-pathologic correlation. RadioGraphics.. 1996;16:369-388.
- Saul S. Masses of the liver. Sternberg SS, ed. Diagnostic Surgical Pathology. 1999:1553-1628.
- Siegelman E, Outwater E. Magnetic resonance imaging of focal and diffuse hepatic disease. Semin US CT MRI. 1998;19:2-34.
- Mortele K, Praet M, Van V. CT and MR imaging findings in focal nodular hyperplasia of the liver: Radiologic-pathologic correlation. AJR Am J Roentgenol.. 2000;175:687-692.
- Paulson E, McClellan J, Washington K. Hepatic adenoma: MR characteristics and correlation with pathologic findings. AJR Am J Roentgenol.. 1994;163:113-116.
- Rosenberg L. The risk of liver neoplasia in relation to combined oral contraceptive use. Contraception.. 1991;43:643-652.
- Soe K, Soe M, Gluud S. Liver pathology associatied with the use of anabolic-androgenic steroids. Liver.. 1992;12:73-79.
- Labrune P, Trioche P, Duvaltier I. Hepatocellular adenomas in glycogen storage disease type I and III: A series of 43 patients and review of the literature. J Pediatr Gastroenterol Nutr.. 1997;24:276-279.
- Leese T, Farges O, Bismuth H. Liver cell adenomas. A 12 year surgical experience from a specialist hepato-biliary unit. Ann Surg.. 1988;208:558-564.
- Foster J, Berman M. The malignant transformation of liver cell adenomas. Arch Surg.. 1994;129:712-717.
- Arrive L, Flejou J, Vilgrain V. Hepatic adenoma: MR findings in 51 pathologically proved lesions. Radiology.. 1994;193:507-512.
- Chung K, Mayo-Smith W, Saini S. Hepatocellular adenoma: MR imaging features with pathologic correlation. AJR Am J Roentgenol.. 1995;165:303-308.
- Mitchell D, Kim I, Chang T. Fatty liver. Chemical shift phase difference and suppression magnetic resonance imaging technique in animals, phantoms, and humans. Invest Radiol.. 1991;26:1041-1052.
- Flejou J, Barge J, Menu Y. Liver adenomatosis. An entity distinct from liver adenoma?. Gastroenterology.. 1985;89:1132-1138.
- Grazioli L, Federle M, Ichikawa T. Liver adenomatosis: Clinical, histopathologic, and imaging findings in 15 patients. Radiology.. 2000;216:395-402.
- Mergo P, Ros P. MR imaging of inflammatory disease of the liver. Magn Reson Clin North Am.. 1997;5:367-376.
- Mendez R, Schiebler M, Outwater E. Hepatic abscesses: MR imaging findings. Radiology.. 1994;190:431-436.
- Jeffrey R, Tolentino C, Chang F. CT of small pyogenic abscesses: The cluster sign. AJR Am J Roentgenol.. 1988;151:487-489.
- Semelka R, Shoenut J, Greenberg H. Detection of acute and treated lesions of hepatosplenic candidiasis: Comparison of dynamic contrast-enhanced CT and MR imaging. J Magn Reson Imaging.. 1992;2:341-345.
- Semelka R, Kelekis N, Sallah S. Hepatosplenic fungal disease: Diagnostic accuracy and spectrum of appearances on MR imaging. AJR Am J Roentgenol. 1997;169:1311-1316.
- Siegelman E. MR imaging of diffuse liver disease. Hepatic fat and iron. Magn Reson Imaging Clin N Am.. 1997;5:347-365.
- Matsui O, Kadoya M, Takahashi S. Focal sparing of segment IV in fatty livers shown by sonography and CT: Correlation with aberrant gastric venous drainage. AJR Am J Roentgenol.. 1995;164:1137-1140.
- Matsui O, Takahashi S, Kadoya M. Pseudolesion in segment IV of the liver at CT during arterial portography: Correlation with aberrant gastric venous drainage. Radiology.. 1994;193:31-35.
- Ohashi I, Ina H, Gomi N. Hepatic pseudolesion in the left lobe around the falciform ligament at helical CT. Radiology.. 1995;196:245-249.
Citation
. Magnetic resonance imaging of benign hepatic lesions. Applied Radiology. 2001;30(9):23-31. doi:10.37549/AR1039.