Minimizing radiation risks with MDCT in neuroradiology
Applied Radiology — Vol. 38 , Issue 1 , pp. 19 -24
DOI: 10.37549/AR1672
Published: January 1, 2009
Categories
In November 2007, the New York Times reported, “Millions of Americans, especially children, are needlessly getting dangerous radiation from ‘super X-rays’ that raise the risk of cancer and are increasingly used to diagnose medical problems….” This headline is inflammatory; but the core message, coming from the medical community and echoed in the media, is that radiation should be minimized. Success in minimizing radiation will require a multifaceted approach, with a collective effort from radiologists, referring clinicians, and computed tomography (CT) manufacturers. In this article, we provide practical recommendations for reducing CT radiation from neuroradiologic imaging.
Measuring risk
Radiation risks are both stochastic and deterministic. Deterministic effects, such as radiation burns or cataracts, are easy to document and therefore predict. With 0.5 to 2 Gy dose to the lens, for example, patients are at risk for cataracts.1 Stochastic effects, such as cancer, are much more difficult to predict. They may or may not occur, after a long delay, at a rate nearly imperceptible above baseline, with or without a threshold dose. It is impossible to speak definitively about these risks—an uncertainty that has hampered efforts at risk reduction. Fears regarding stochastic effects are driving the current wave of alarm regarding CT. Because stochastic effects generally occur years after radiation exposure, pediatric patients are at the greatest risk. Pediatric patients’ risks are also higher than adult patients’ risks because of the proportion of rapidly dividing—and therefore radiosensitive—cells in children. For this reason, efforts at CT dose reduction should start with pediatric patients.
With multidetector CT (MDCT), several parameters are important for understanding radiation dose. Dose efficiency is a measure of how much of the irradiated tissue is included in the final images. With poor efficiency, significant radiation extends beyond the boundary of the imaged area to the area called the penumbra. Thus collimation affects radiation dose. Whereas with a single detector, collimation equals slice thickness, with MDCT, collimation determines the number of detectors exposed to the radiation beam. Each manufacturer has its own detector array and data acquisition systems. The source data acquired defines the width of the smallest section that can be reconstructed (Figure 1). Some collimation/detector protocols maximize coverage (eg, expose the greatest width per 360° scanner rotation); others maximize resolution (eg, expose only the narrowest detectors centrally).
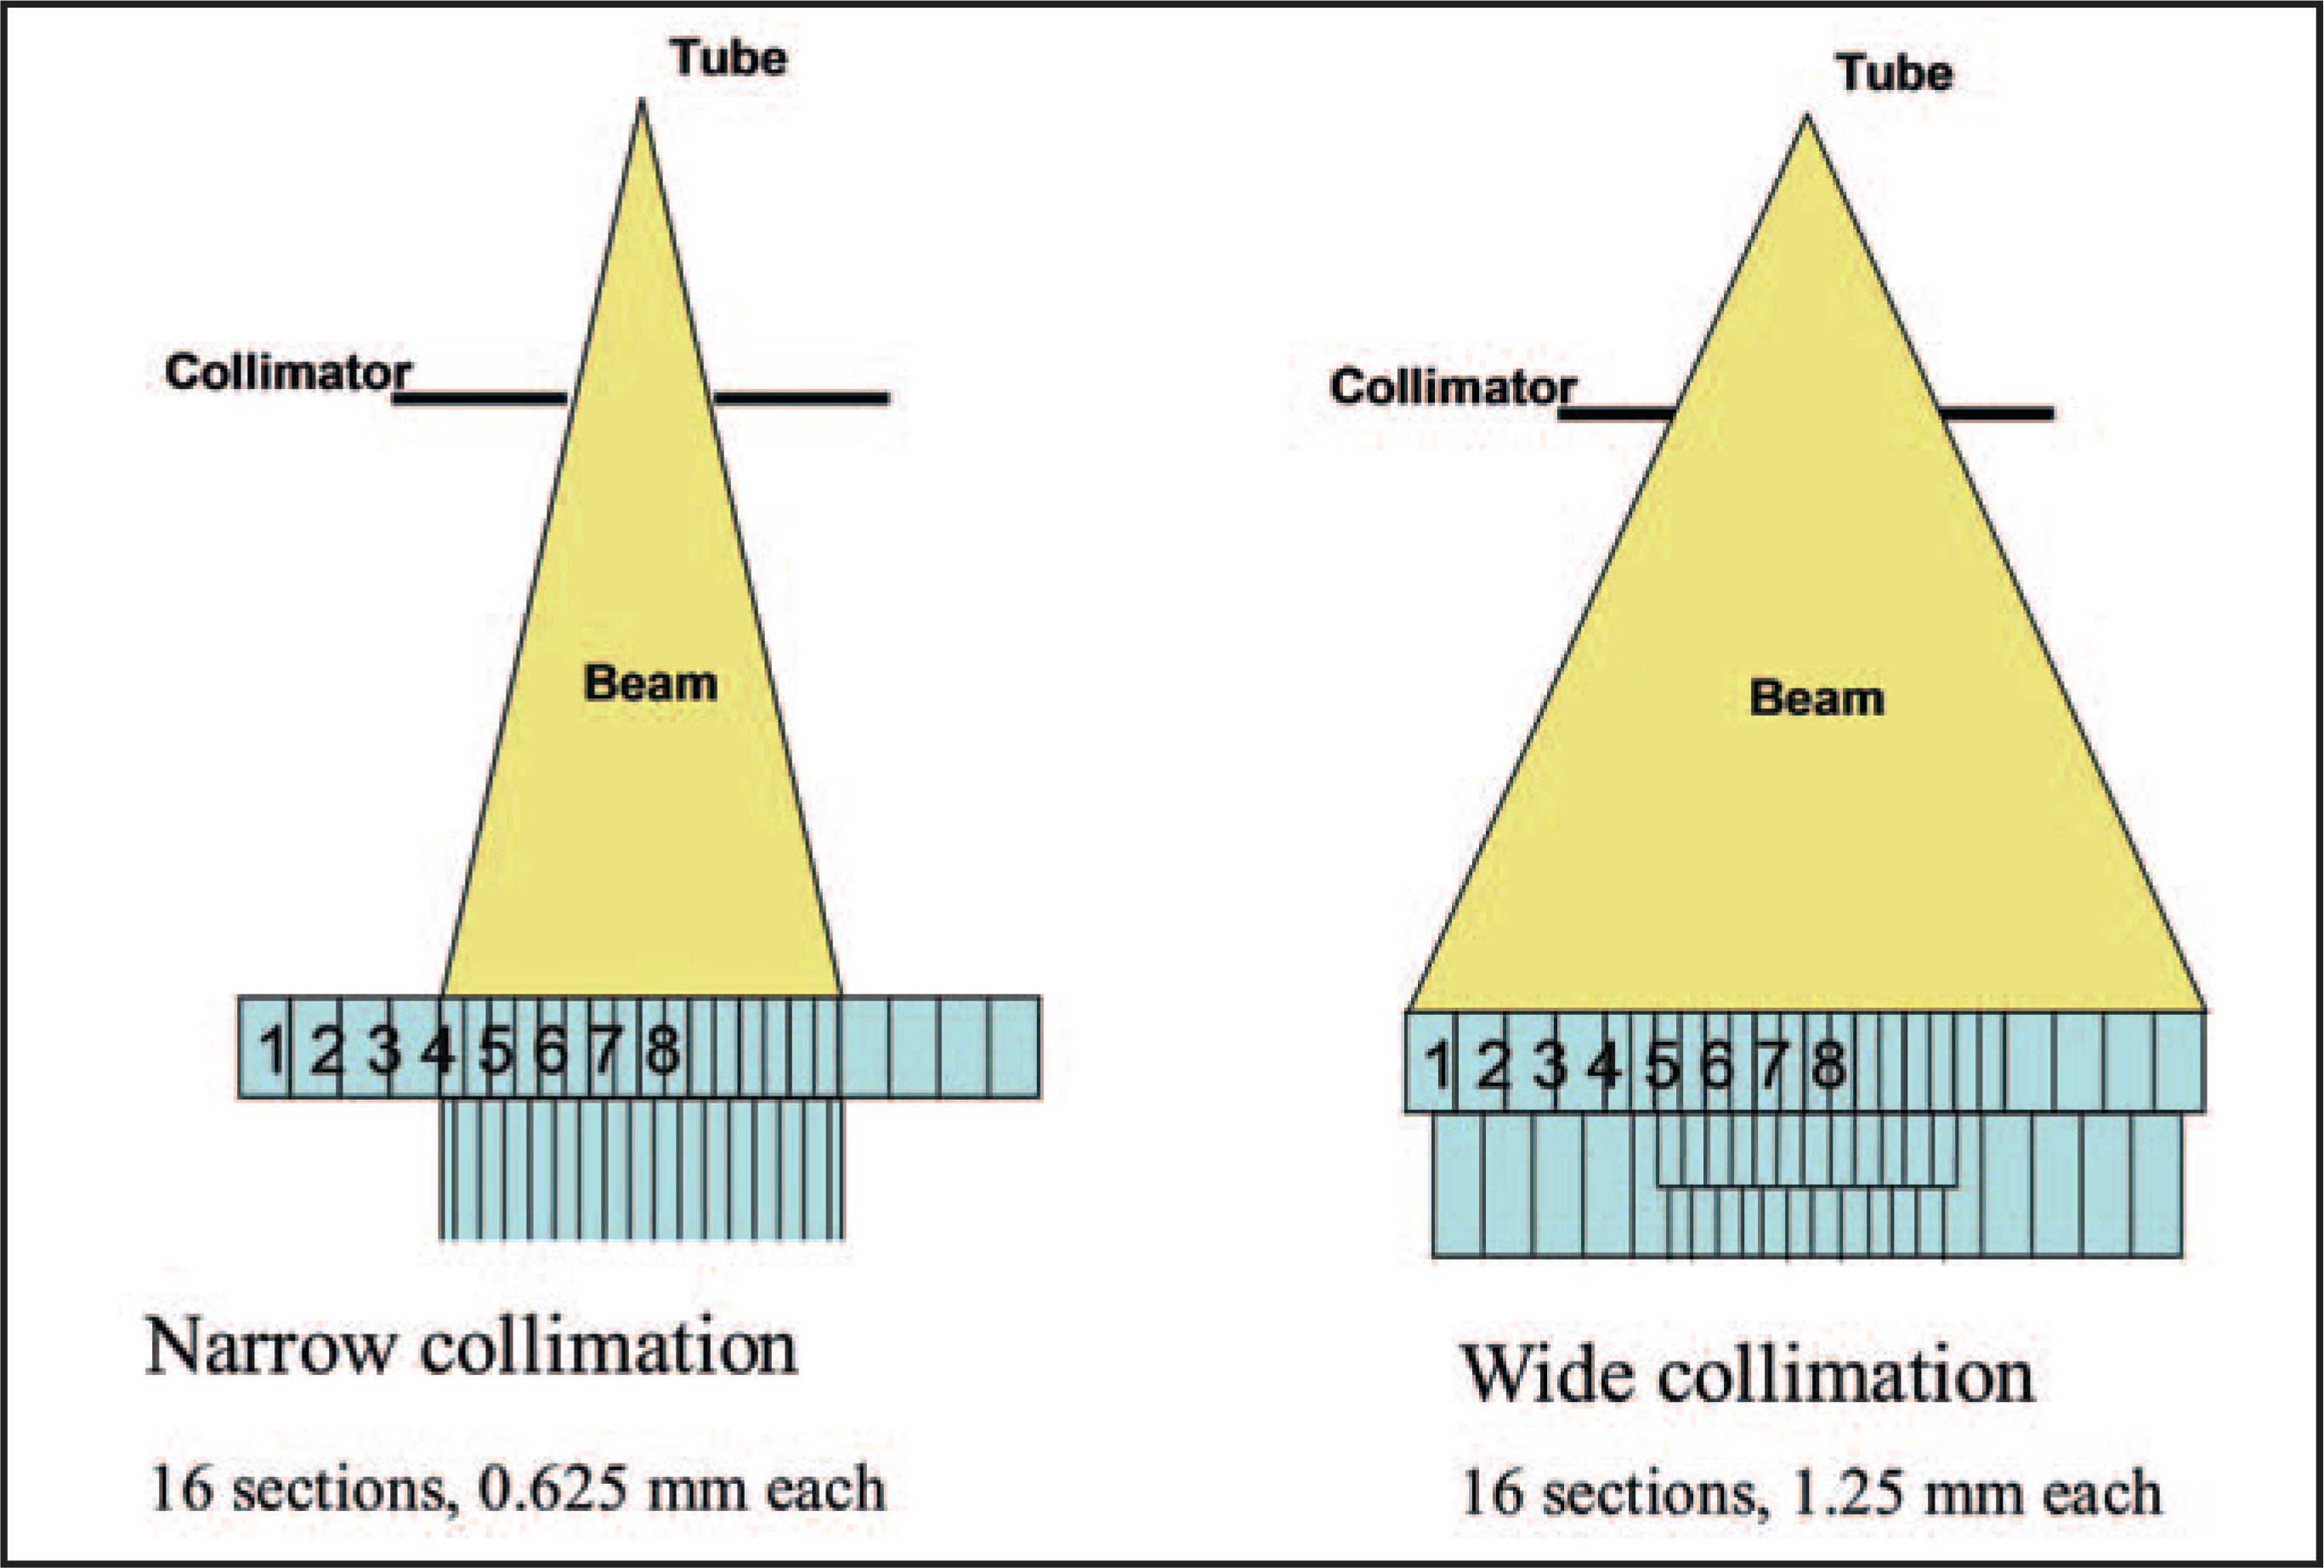
When choosing scanner protocols, radiologists should keep a few general guidelines for dose efficiency in mind. The dose consequence is highest with the smallest beam width; therefore, efficiency improves with the number of detectors exposed. Thus, it is more efficient to expose all detectors than to collimate to the central detectors. Verdun et al2 reported dose efficiency of 96% when exposing all 64 detectors versus a dose efficiency of only 67% when collimating to the 8 central detectors of a 64-detector scanner. The 64-detector scanner is much more efficient than a 4- or 8-detector scanner at acquiring thin sections for isotropic imaging. With a 4-detector scanner, acquiring images at 1.25-mm section thickness decreases the dose efficiency to 66% and more than doubles the CT dose index volume (CTDI volume, see below). Even on a 64-detector scanner, acquiring isotropic data may lead to increased radiation if the tube current is increased to compensate for the increased noise that plagues thin sections. Reviewing thicker sections makes noise acceptable and, therefore, allows us to limit dose. Thus the helpful dictum, “acquire thin, review thick” when possible.
There are many ways to measure radiation dose. The most helpful clinical parameters are CT dose index volume (CTDIvol) and the dose-length product (DLP). These are included on most recent MDCT scanners. The CT dose index is a measure of the energy absorbed divided by the unit mass. The weighted CT dose index (CTDIw) factors in the change in radiation dose across the depth scanned:
where (CTDI100)peripheral represents an average of 4 different measurements in the periphery of the phantom. For a standard head CT, which is approximated by a 16-cm phantom, the dose does not change significantly from the skin to the center of the patient’s head. The CTDIvol is the weighted CT dose index divided by the pitch:
Pitch is the distance the table travels per rotation divided by the beam collimation. Dose varies inversely with pitch. For example, if pitch is doubled, the dose is halved. Since CTDI measures are acquired using phantoms, they do not take into account the shape or composition of any individual patient.3
The DLP is the CTDIvol multiplied by the length of the scan:
Both the CTDI volume and the DLP can be used to compare individual scanning protocols with diagnostic reference levels (DRLs). Diagnostic reference levels are intended to represent the 75th percentile of radiation dose for a given examination. It is acceptable to exceed the DRL for any given patient, but doses should not routinely rise above the DRL. The most recent American College of Radiology guideline, adopted January 2008, recommends a DRL of 75 mGy for the CTDIvol when scanning an adult head.4 A final useful measure of radiation dose is the effective dose, which attempts to reflect the relative radiosensitivity of organs by incorporating a tissue-weighting factor. Typical effective doses are listed in Table 1.5-7
Minimizing risk
Any efforts to minimize risk must start with scanning less frequently. Radiologists should continue to educate referring clinicians regarding imaging appropriateness to prevent unnecessary examinations. In Figure 2, for example, a pregnant woman with a ventriculoperitioneal shunt received 6 plain films as part of a shunt series. Three of the films included the fetus in the direct beam (note the inadequate shielding). This is not ideal given the low diagnostic yield of a shunt series. In a recent review of 192 shunt series, only 1% (2 of 192) shunt series changed clinical management when the head CT was negative or unchanged.8
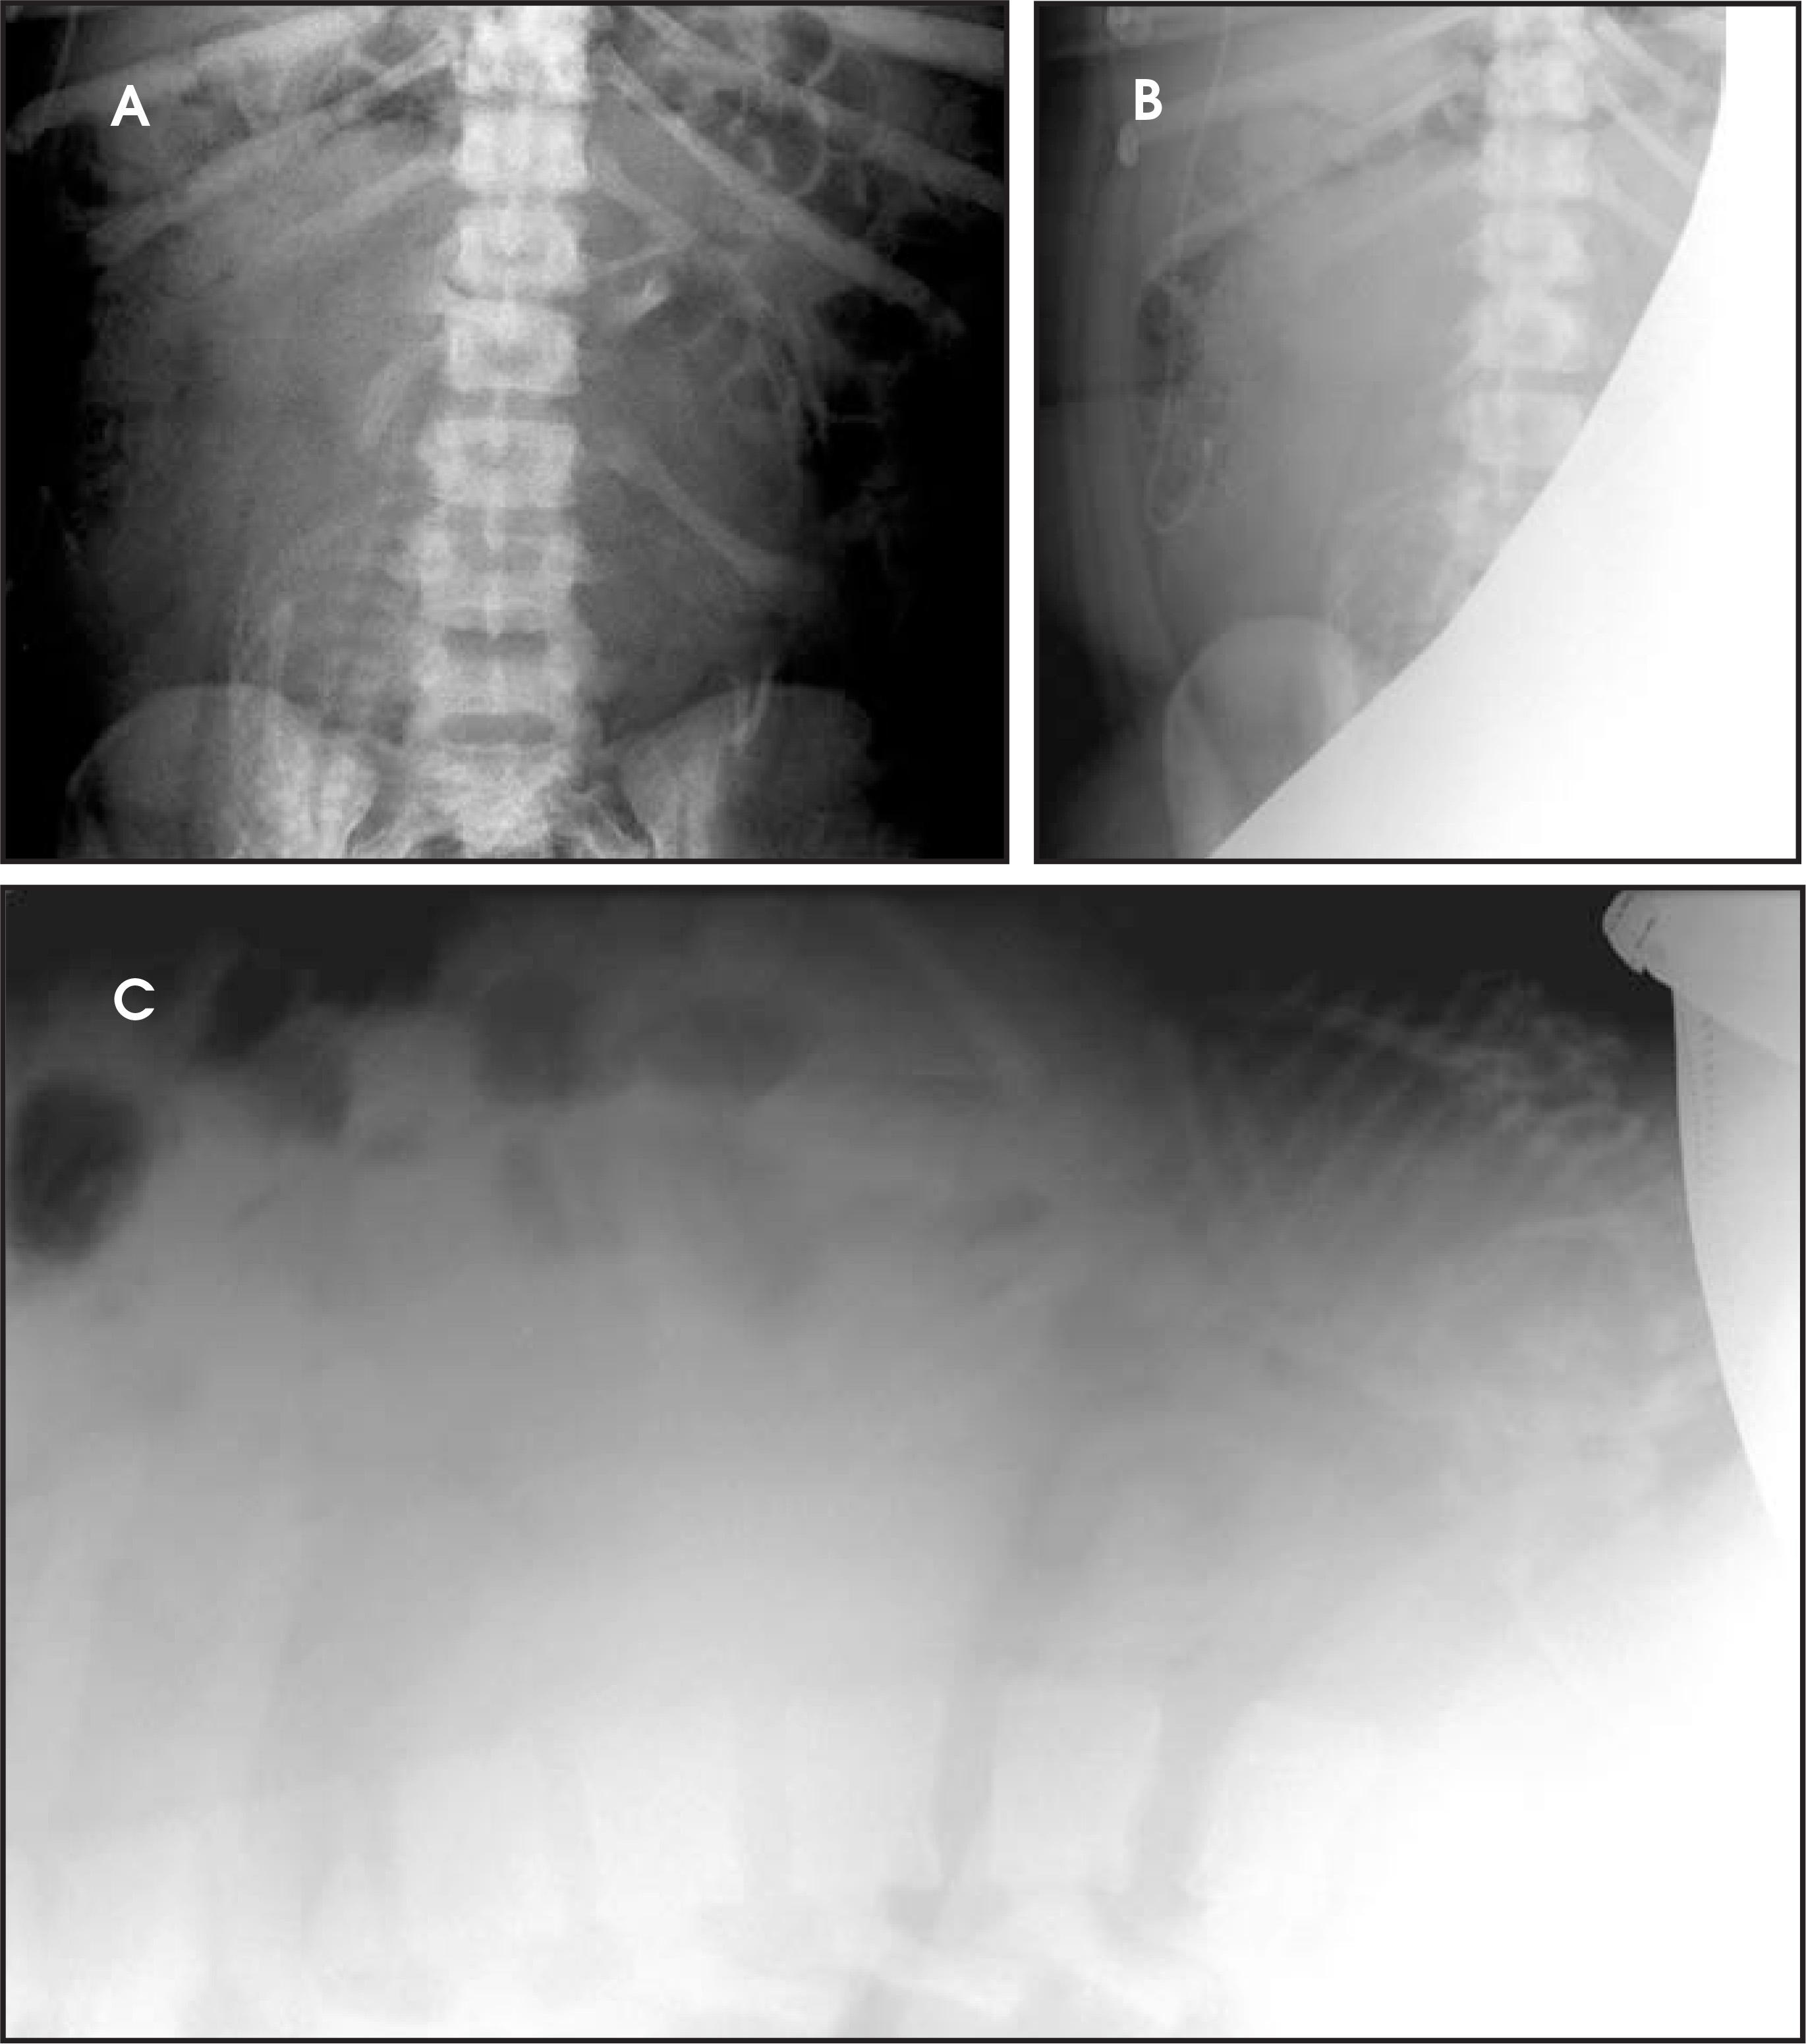
Requests for examinations that expose fetuses to radiation should be reviewed by a radiologist to make certain the examination is indicated. When performing an examination with a dose to the fetus <1 rem (10 mGy), there is no appreciable risk of lethality after the first 2 gestational weeks. The fetal risk decreases with increasing gestational age. In the first 2 weeks of gestation, however, radiation doses >1 rem could cause pregnancy loss. High radiation dose to the fetus during the major organogenesis period is more likely to result in congenital malformations than in lethality.9 The developing brain is most sensitive in weeks 8 to 15 postconception; data from atomic bomb survivors reveals a threshold dose for mental retardation of approximately 0.3 Gy. The dose to a fetus is <0.005 mGy with a head CT and as high as 10 mGy with lumbar spine radiographs.10
The responsibility for scanning less does not stop with the referring clinicians. Smart scanning is achieved when radiologists factor together the clinical concerns of the referring physicians with the radiation risks for patients. Weighing these issues, radiologists construct protocols that are diagnostic but, when possible, are performed with reduced radiation. Images acquired with less radiation represent a compromise between dose and diagnosis because reducing dose will increase noise. The last 3 decades of CT imaging have been driven by a desire for better resolution. This paradigm is changing as the magnitude of radiation exposure is realized.
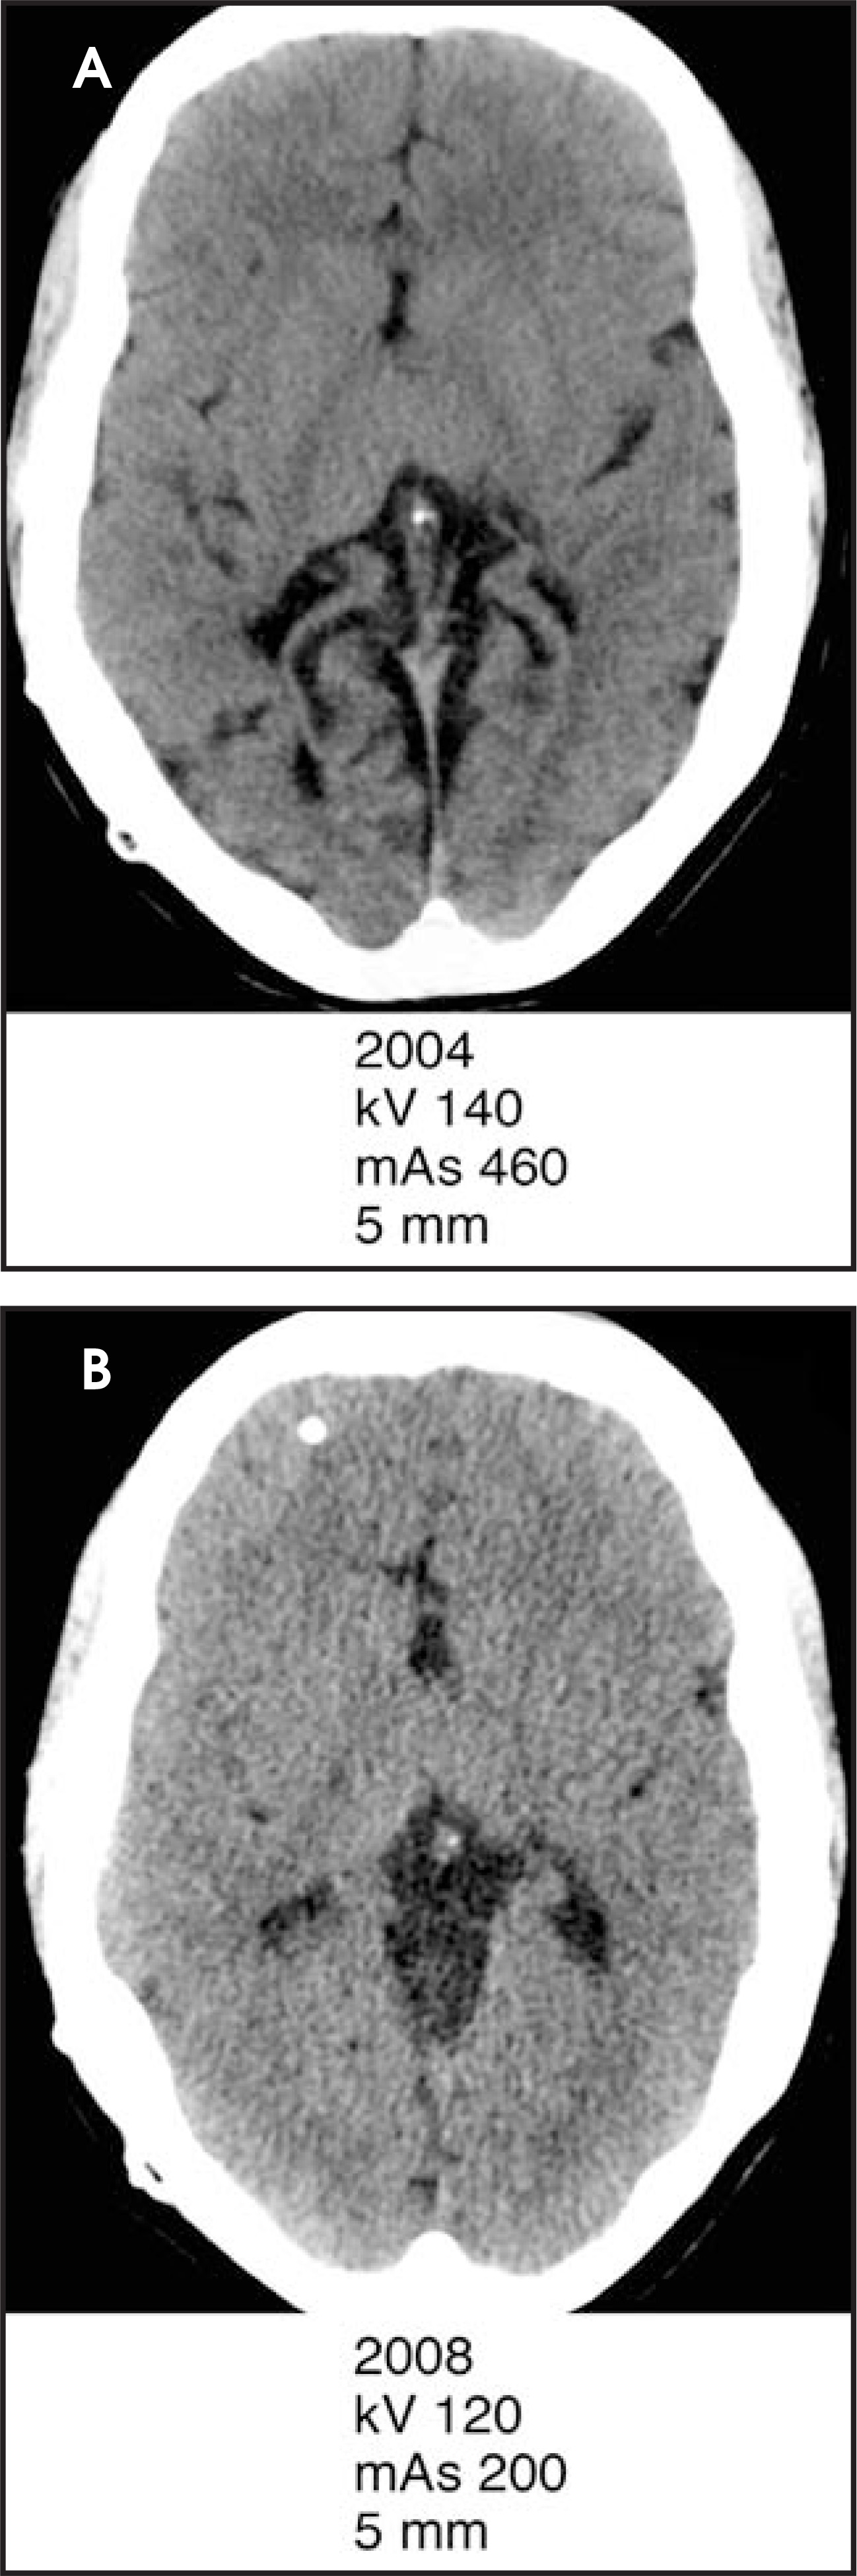
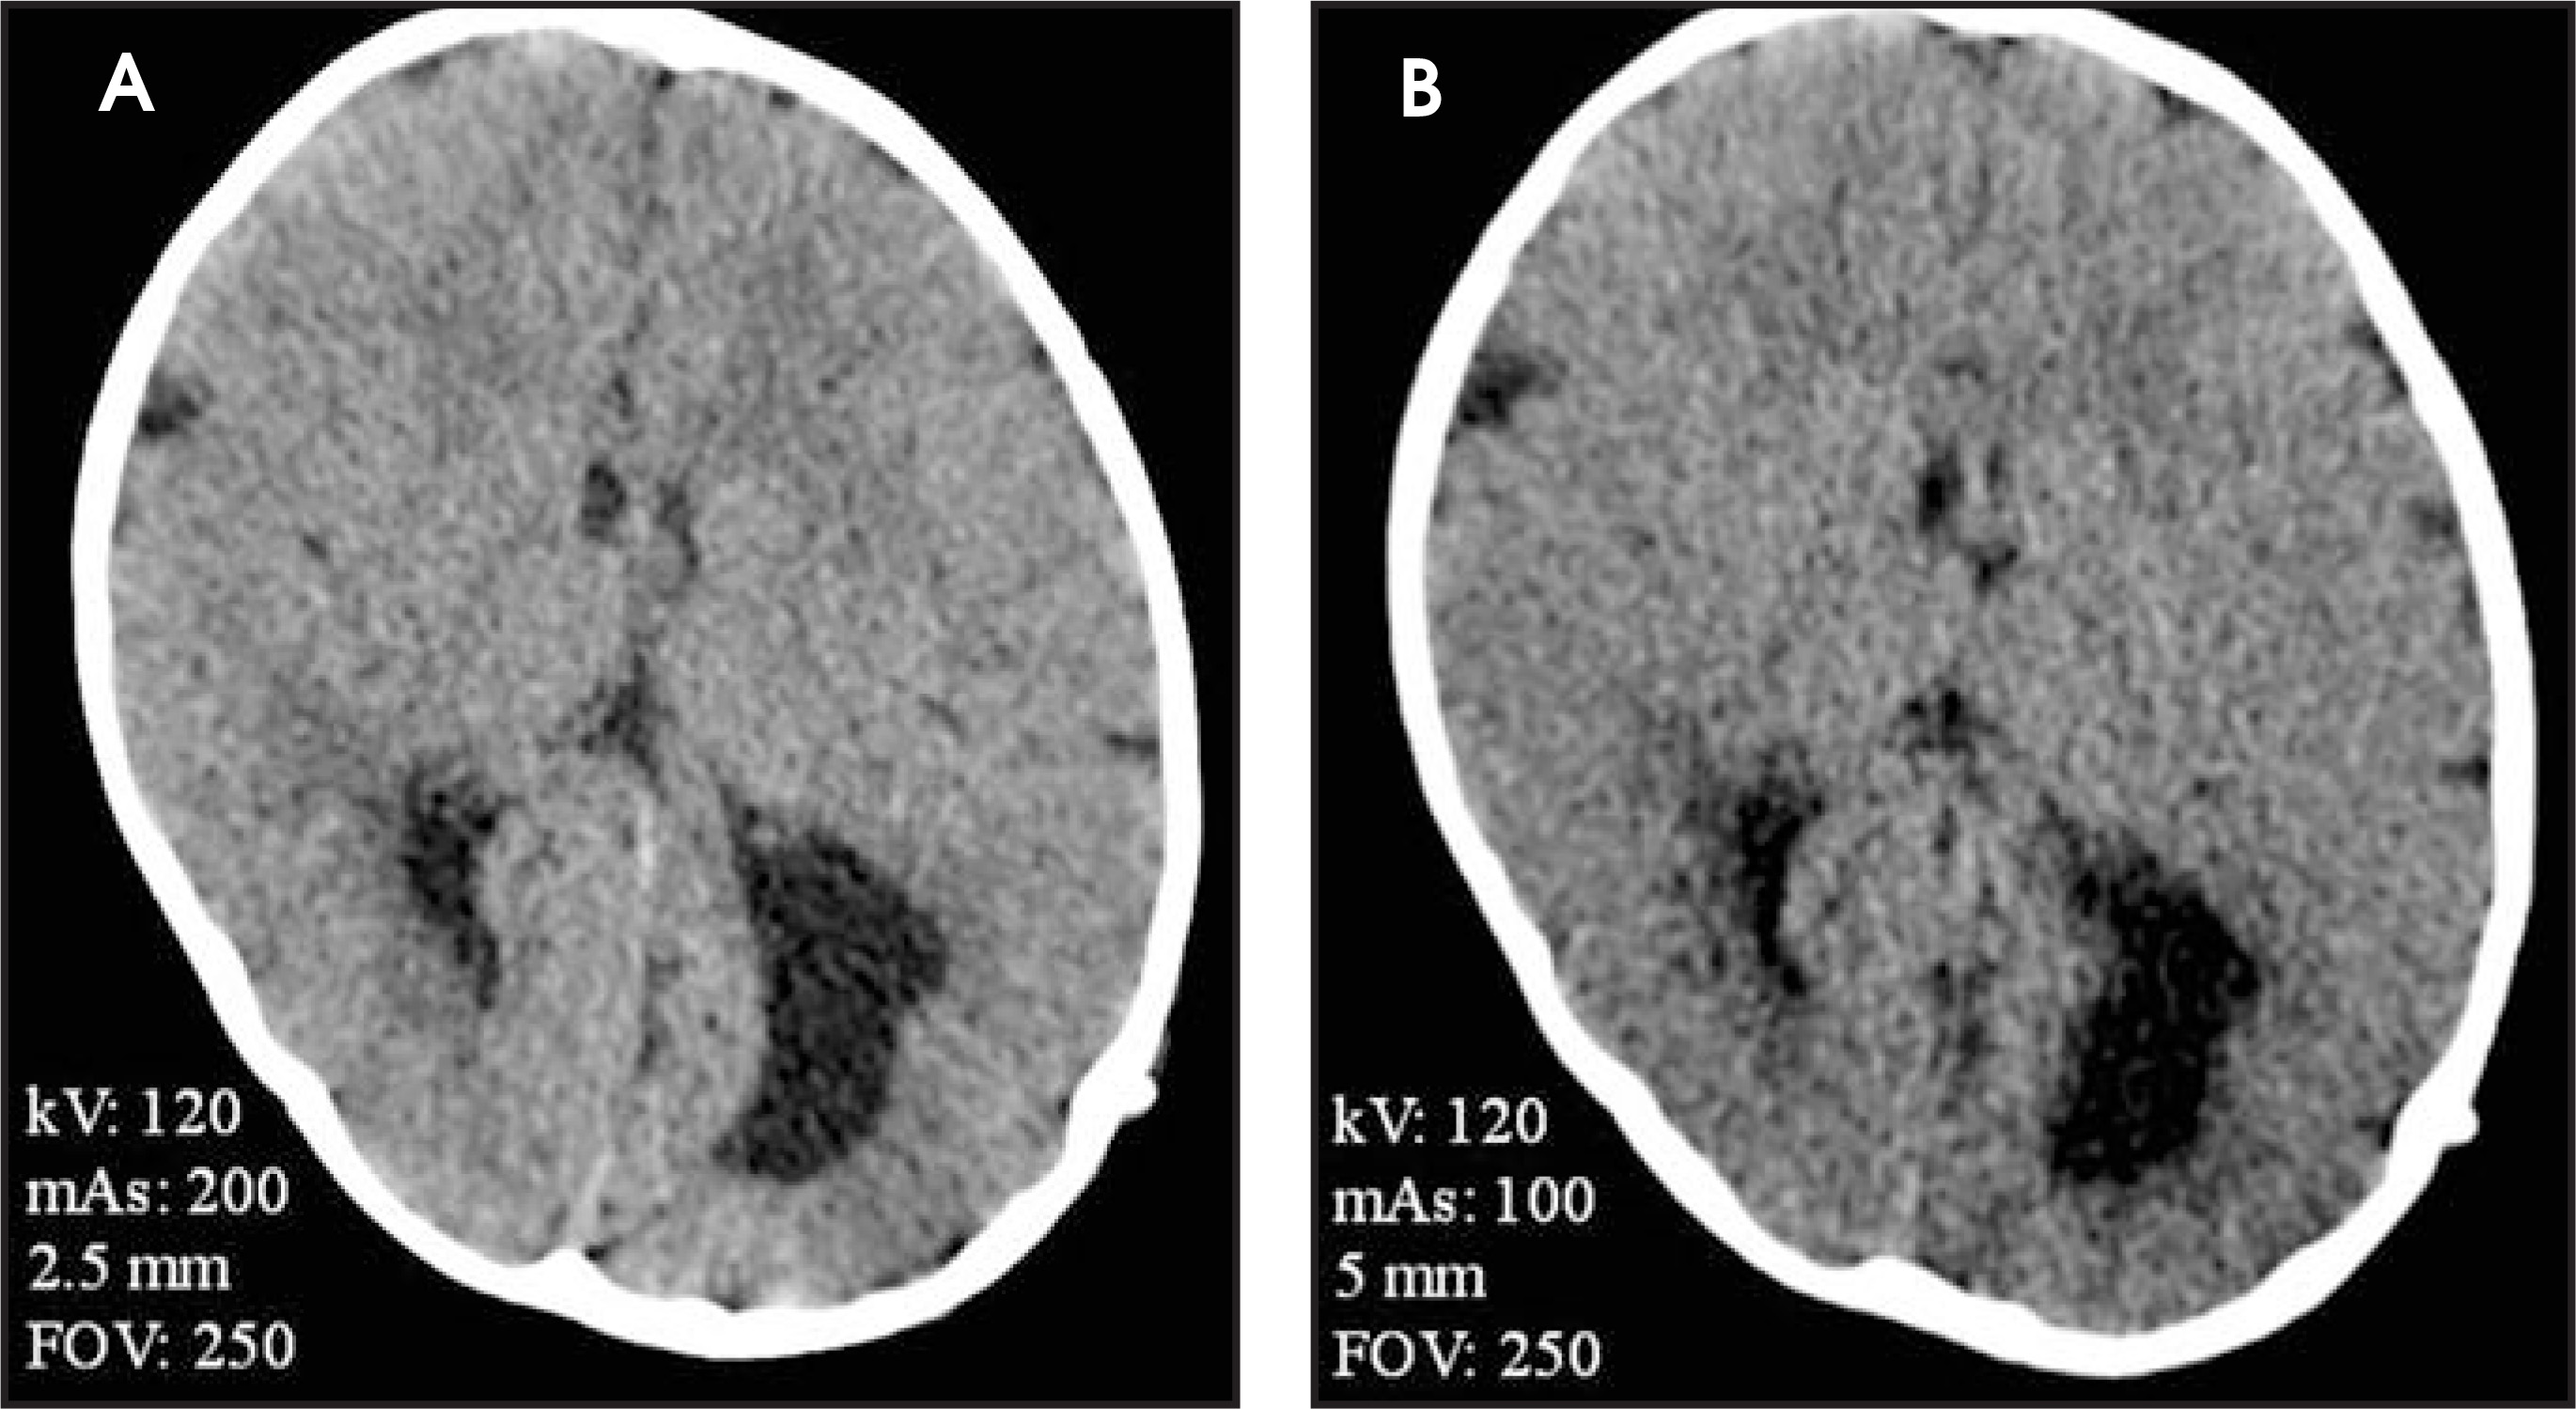
Radiologists are familiar with some strategies for dose reduction, such as limiting the length of the scan. Other simple dose-reduction strategies include decreasing the tube current or tube voltage, increasing pitch, and choosing wider collimation. Decreasing tube current is often the most effective step toward dose reduction. Tube current correlates linearly with dose, so that halving tube current (mAs) will halve the dose. However, decreasing tube current will increase image noise. This concept is illustrated in Figure 3. When moving from 200 mAs to 100 mAs, noise increases by the square root of the dose reduction (200 mAs/100 mAs = 2; √2 =1.41). Thus the noise increase when halving the tube current is 41% (1.41 – 1 = 0.41). This noise increase can be mitigated by increasing slice thickness (Figure 4).
Lowering kVp has a greater effect on dose than does lowering tube current, but the loss of tissue contrast typically makes this approach unacceptable. However, low kVp (typically 80 kVp) is useful for all CTA head/neck and CT cerebral perfusion studies, since 80 kVp is near the k-edge of iodine.
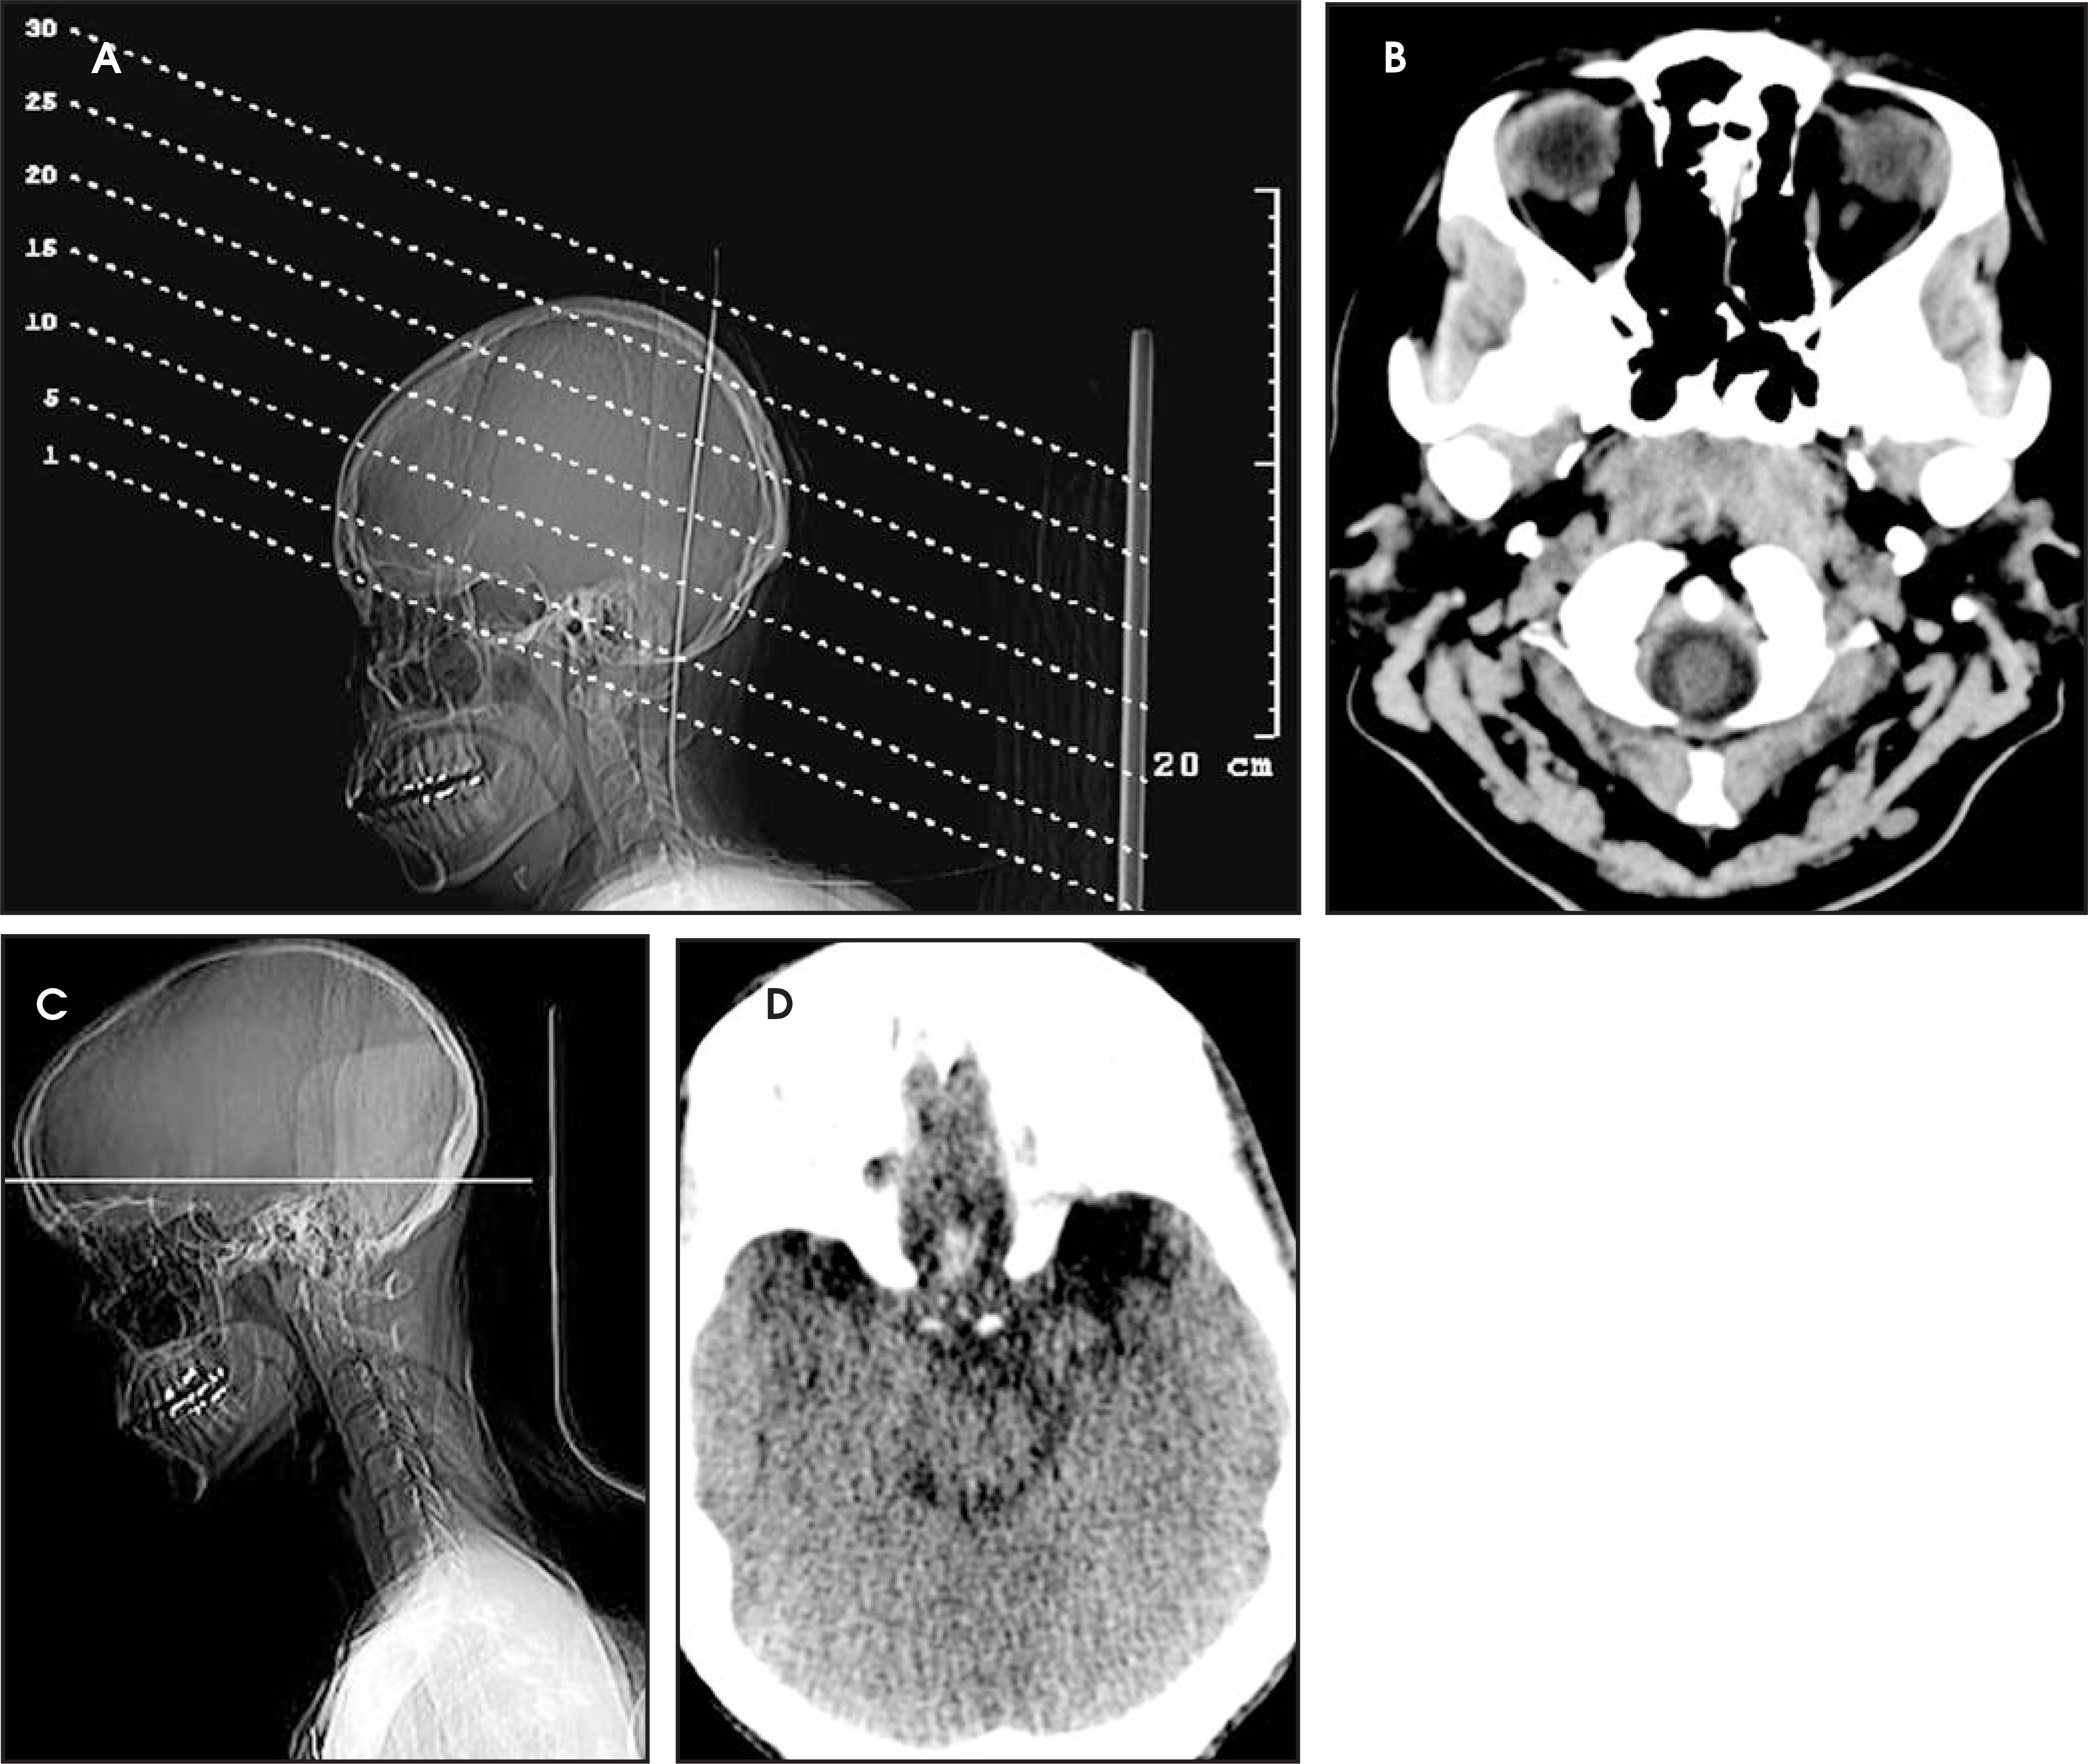
Smart scanning avoids unnecessary irradiation of radiosensitive organs, such as the optic lens. There are several strategies to decrease radiation to the lens. When orbital pathology is not suspected clinically, the lens should be kept out of the irradiated field. When scanning a neck, for example, technologists can use the inferior orbital rim on the localizer for the most cranial slice, thereby avoiding the lens. On routine head CT, the lens can be avoided by tucking the patient’s chin to the chest or by angling the gantry to exclude the orbits (Figure 5). Unfortunately, there are limitations to the angle of the gantry (30° for most MDCT scanners); therefore, the orbits may be exposed if the patient’s neck is extended. Bismuth shields have also proven efficacious in reducing lens dose without compromising the evaluation of the brain.11 Scanning protocols should be implemented to avoid scanning beyond the area of clinical concern. This requires vigilance, since the time cost for additional imaging is nearly imperceptible with today’s MDCT scanners.
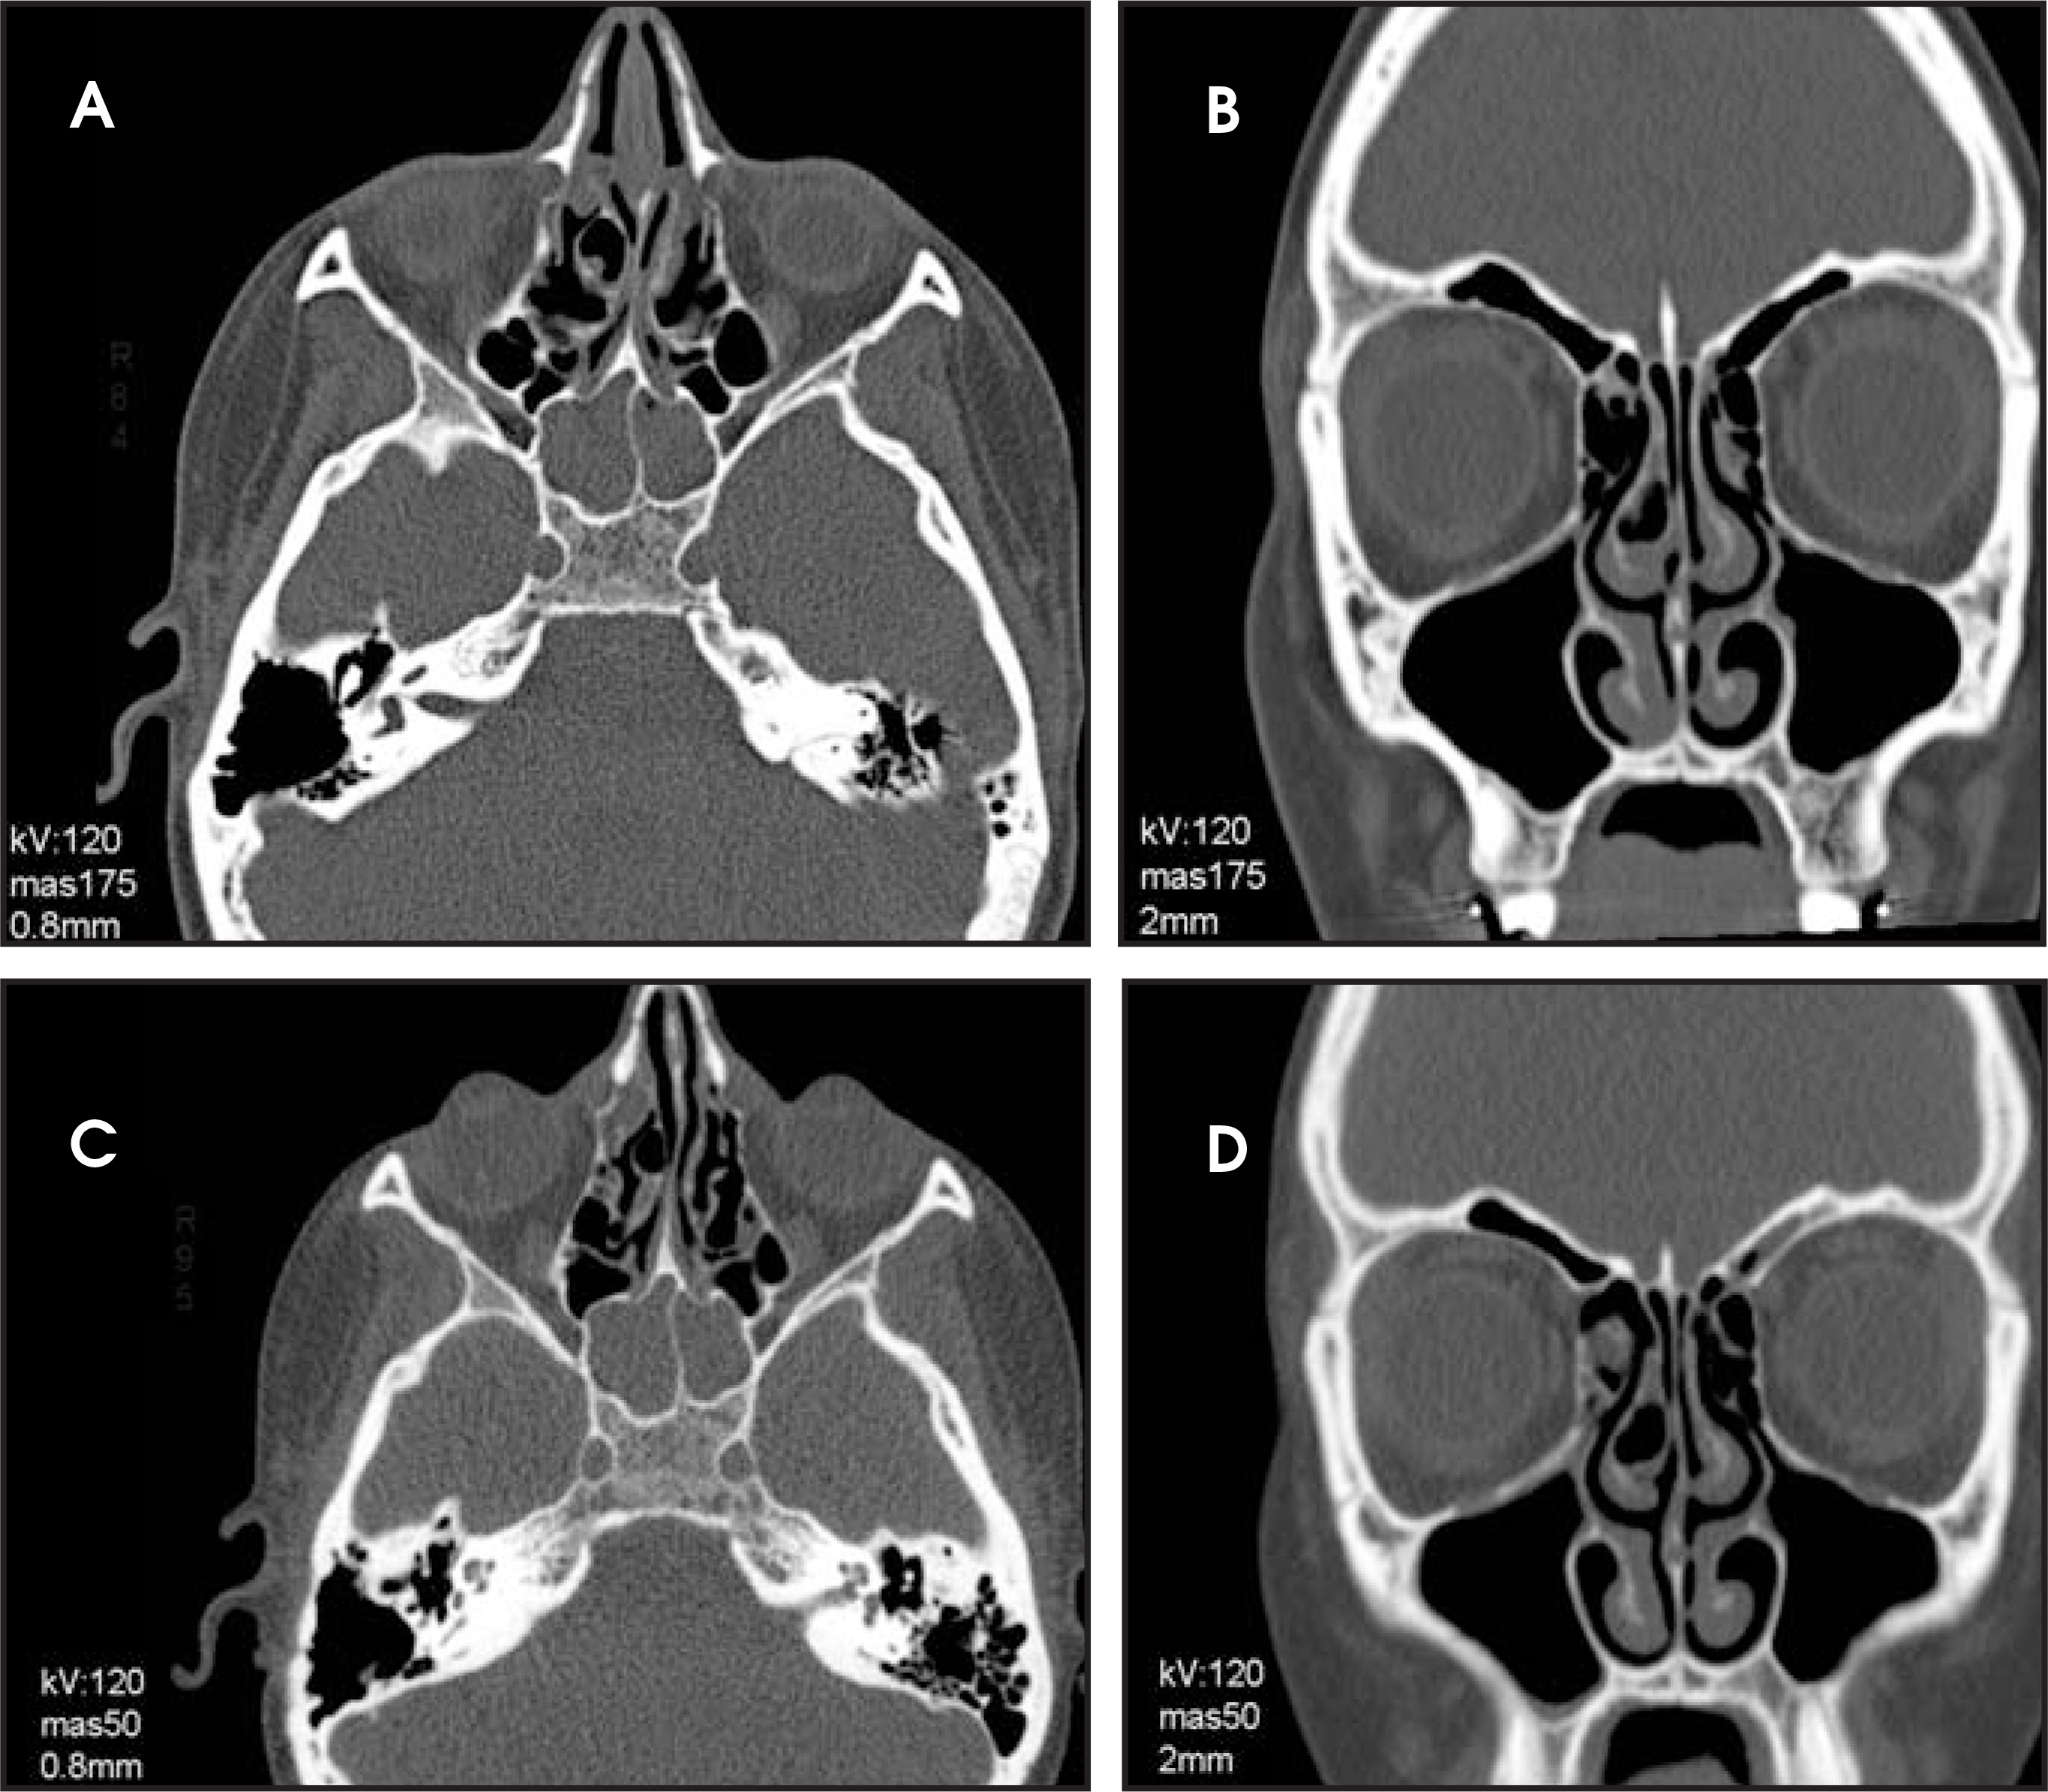
Sinus CT is low-lying fruit on the path to dose-reduction because high spatial resolution is not needed with such screening examinations. Patients’ sinuses may be scanned repeatedly over time, and the optic lens is almost always irradiated. In a study by MacLennan,12 the mean lens dose varied from 70.3 mGy when scanned at a tube current of 475 mAs, 17.6 mGy at a tube current of 210 mAs, and 4.7 mGy at a tube current of 30 mAs. There have been many approaches to minimizing radiation dose during sinus CT.13-16 Hojreh et al15 reported the diagnostic quality of low-dose scans, recommending a tube current of 50 mAs (with 140 kV and a collimation of 16 × 0.75 mm). Figure 6 shows the diagnostic quality of lower-dose sinus scanning.
CT perfusion imaging carries a high radiation cost. When imaging for middle cerebral artery (MCA) territory infarcts, the most caudal slice should be at the superior orbital rim. When performing perfusion on a 40- or 64-detector scanner, most of the MCA territory will be included in the 4-cm slab acquired.
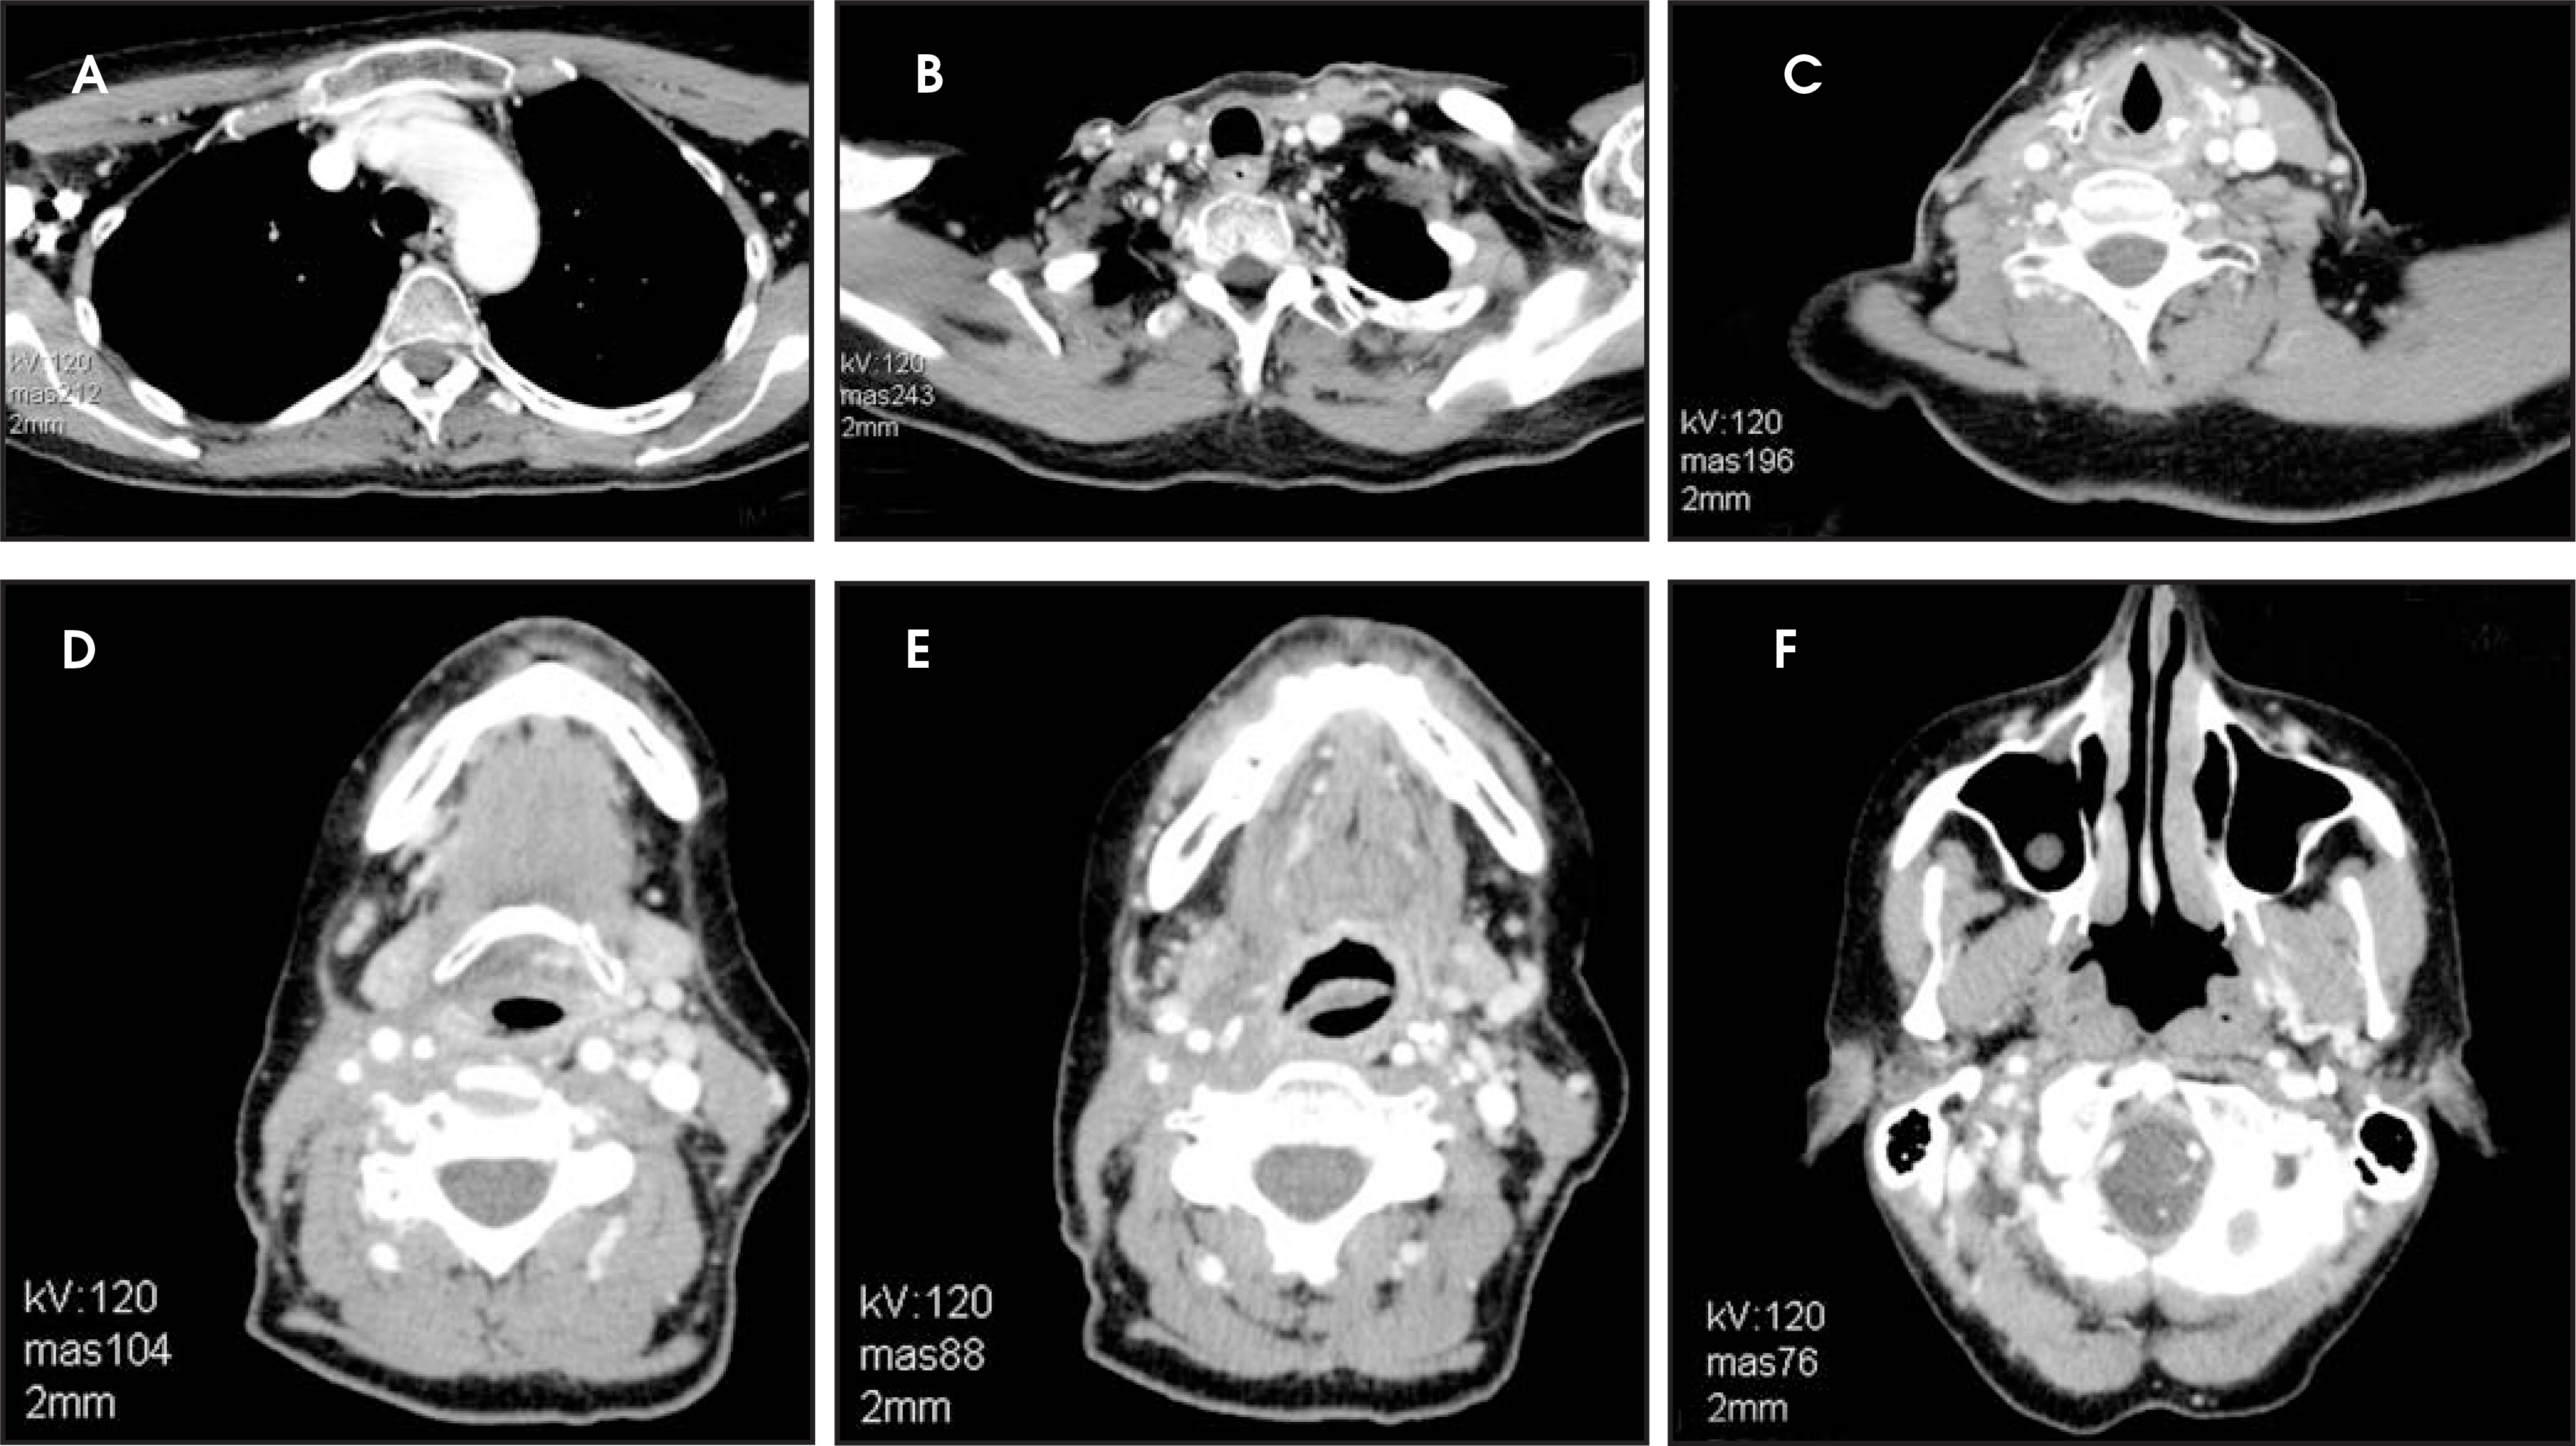
Smart scanning also uses the significant advances that manufacturers are making in reducing radiation dose with MDCT. Manufacturers have taken several different approaches to reducing dose. GE Medical Systems uses “Auto mA” software. Philips uses “Dose Right.” Siemens uses a “CARE Dose” application packet. Toshiba uses the “Real EC.” Each of these applications attempts to account for the varied tube current required when imaging patients of different body shapes and composition. When scanning the neck, for example, tube modulation software will reduce tube current when scanning the smallest portions of the upper neck but will increase tube current when scanning through the shoulders at the thoracic inlet (see Figure 7). Tube modulation eliminates the need to scan the entire neck at the high tube current necessary to scan through the shoulders. Modulation can be performed along the z-axis, according to a localizer sequence; or in the angular plane, adjusting with each rotation, from the data of the prior rotation. Such software advances allow a more constant image quality, while reducing unnecessary radiation. In neuroradiology, these should be widely implemented for neck scans and can also be used with most other scans.17
Conclusion
With knowlege of general MDCT dose guidelines, radiologists can find the necessary balance between maximizing image resolution and minimizing radiation dose. Protocols should be dose conscious. Referring clinicians will need to be included in discussions of radiation risks, or they may balk at changes in image quality. Radiologists’ efforts should be wide ranging but can initially be targeted at pediatric patients who are at the greatest risk for stochastic effects. Dose-reduction software from manufacturers can help keep images diagnostic by maintaining an acceptable noise level. During the last 5 years, much has been learned from research on radiation dose and risks. It is time for clinical implementation.
References
- Valentin J. Relative biological effectiveness (RBE), quality factor (Q), and radiation weighting factor (wR): ICRP Publication 92. Ann ICRP. 2003;33(4):93-95.
- Verdun F, Gutierrez D, Schnyder P. CT dose optimization when changing to CT multi-detector row technology. Curr Probl Diagn Radiol. 2007;36(4):176-184.
- McNitt-Gray M. AAPM/RSNA Physics Tutorial for Residents: Topics in CT. Radiation dose in CT. Radiographics. 2002;22:1541-1553.
- ACR Practice Guideline for diagnostic reference levels in medical x-ray imaging (Resolution 3). 2008:802.
- Mettler F, Upton A. Medical Effects of Ionizing Radiation. 1995.
- Wall B, Hart D. Revised radiation doses for typical X-ray examinations. Report on a recent review of doses to patients from medical X-ray examinations in the UK by NRPB. National Radiological Protection Board. Br J Radiol. 1997;70:437-439.
- Hadley J, Agola J, Wong P. Potential impact of the American College of Radiology appropriateness criteria on CT for trauma. Am J Roentgenol. 2006;186:937-942.
- Griffey R, Ledbetter S, Khorasani R. Yield and utility of radiographic “shunt series” in the evaluation of ventriculo-peritoneal shunt malfunction in adult emergency patients. Emerg Radiol. 2007;13:307-311.
- Valentin J. Biological effects after prenatal irradiation (embryo and fetus). Publication 90. Ann ICRP. 2003;33(1-2):1-206.
- Sharp C, Shrimpton J, Bury R. Diagnostic medical exposures: Exposure to ionising radiation of pregnant women. Doc NRPB. 1993;4(4):5-14.
- Mukundan S, Wang P, Frush D. MOSFET dosimetry for radiation dose assessment of bismuth shielding of the eye in children. AJR Am J Roentgenol. 2007;188:1648-1650.
- MacLennan A. Radiation dose to the lens from coronal CT scanning of the sinuses. Clin Radiol. 1995;50:265-267.
- Tack D, Widelec J, De Maertelaer V. Comparison between low-dose and standard-dose multidetector CT in patients with suspected chronic sinusitis. AJR Am J Roentgenol. 2003;181:939-944.
- Hagtvedt T, Aalokken T, Notthelien J, Kolbenstvedt A. A new low-dose CT examination compared with standard-dose CT in the diagnosis of acute sinusitis. Eur Radiol. 2003;13:976-980.
- Hojreh A, Czerny C, Kainberger F. Dose classification scheme for computed tomography of the paranasal sinuses. Eur J Radiol. 2004;56:31-37.
- Bassim M, Ebert C, Sit R, Senior B. Radiation dose to the eyes and parotids during CT of the sinuses. Otolaryngol Head Neck Surg. 2005;133:531-533.
- Smith A, Dillon W, Gould R, Wintermark M. Radiation dose-reduction strategies for neuroradiology CT protocols. AJNR Am J Neuroradiol. 2007;28:1628-1632.
Citation
. Minimizing radiation risks with MDCT in neuroradiology. Applied Radiology. 2009;38(1):19-24. doi:10.37549/AR1672.