MR imaging of indeterminate renal lesions
Applied Radiology — Vol. 37 , Issue 11 , pp. 19 -32
DOI: 10.37549/AR1658
Published: November 1, 2008
Categories
The exponential growth in cross-sectional imaging, including ultrasound (US), computed tomography (CT), and magnetic resonance imaging (MRI), has resulted in a similar rise in detection of incidental renal lesions. The majority of these “incidentalomas” represent benign cysts consistent with an age-dependent incidence of renal cysts, ranging from 4.9% in patients under 30 years to 32% in patients over 60 years.1 While the great majority of simple renal cysts can be adequately characterized on the initial imaging examination, some incidentally detected renal lesions remain indeterminate.
Although there is a broad differential diagnosis, most incidental renal lesions represent benign simple or complex epithelial cysts, angiomyolipomas, oncocytomas, renal cell carcinomas, or metastases. One retrospective study of solid renal lesions, which included pathologic correlation, found that 67% of lesions were malignant.2 Thus, these incidental renal lesions must be further characterized by imaging or histologic sampling. The relatively long doubling time of renal cell carcinoma (RCC) combined with increasing use of CT for many applications has led to increased early detection of these tumors. This factor, along with advances in RCC treatment, has decreased tumor-specific mortality in recent decades and gives further impetus to accurate lesion characterization.3 This article will discuss the application of modern MRI to the evaluation of the indeterminate renal mass, both the cystic and solid types. With an appropriate understanding of the superior tissue characterization capability of MRI, the radiologist can appropriately triage the management of the indeterminate renal mass as follows: 1) benign with no additional management needed; 2) likely benign with follow-up imaging recommended; and 3) still indeterminate with histopathologic diagnostic sampling advised.
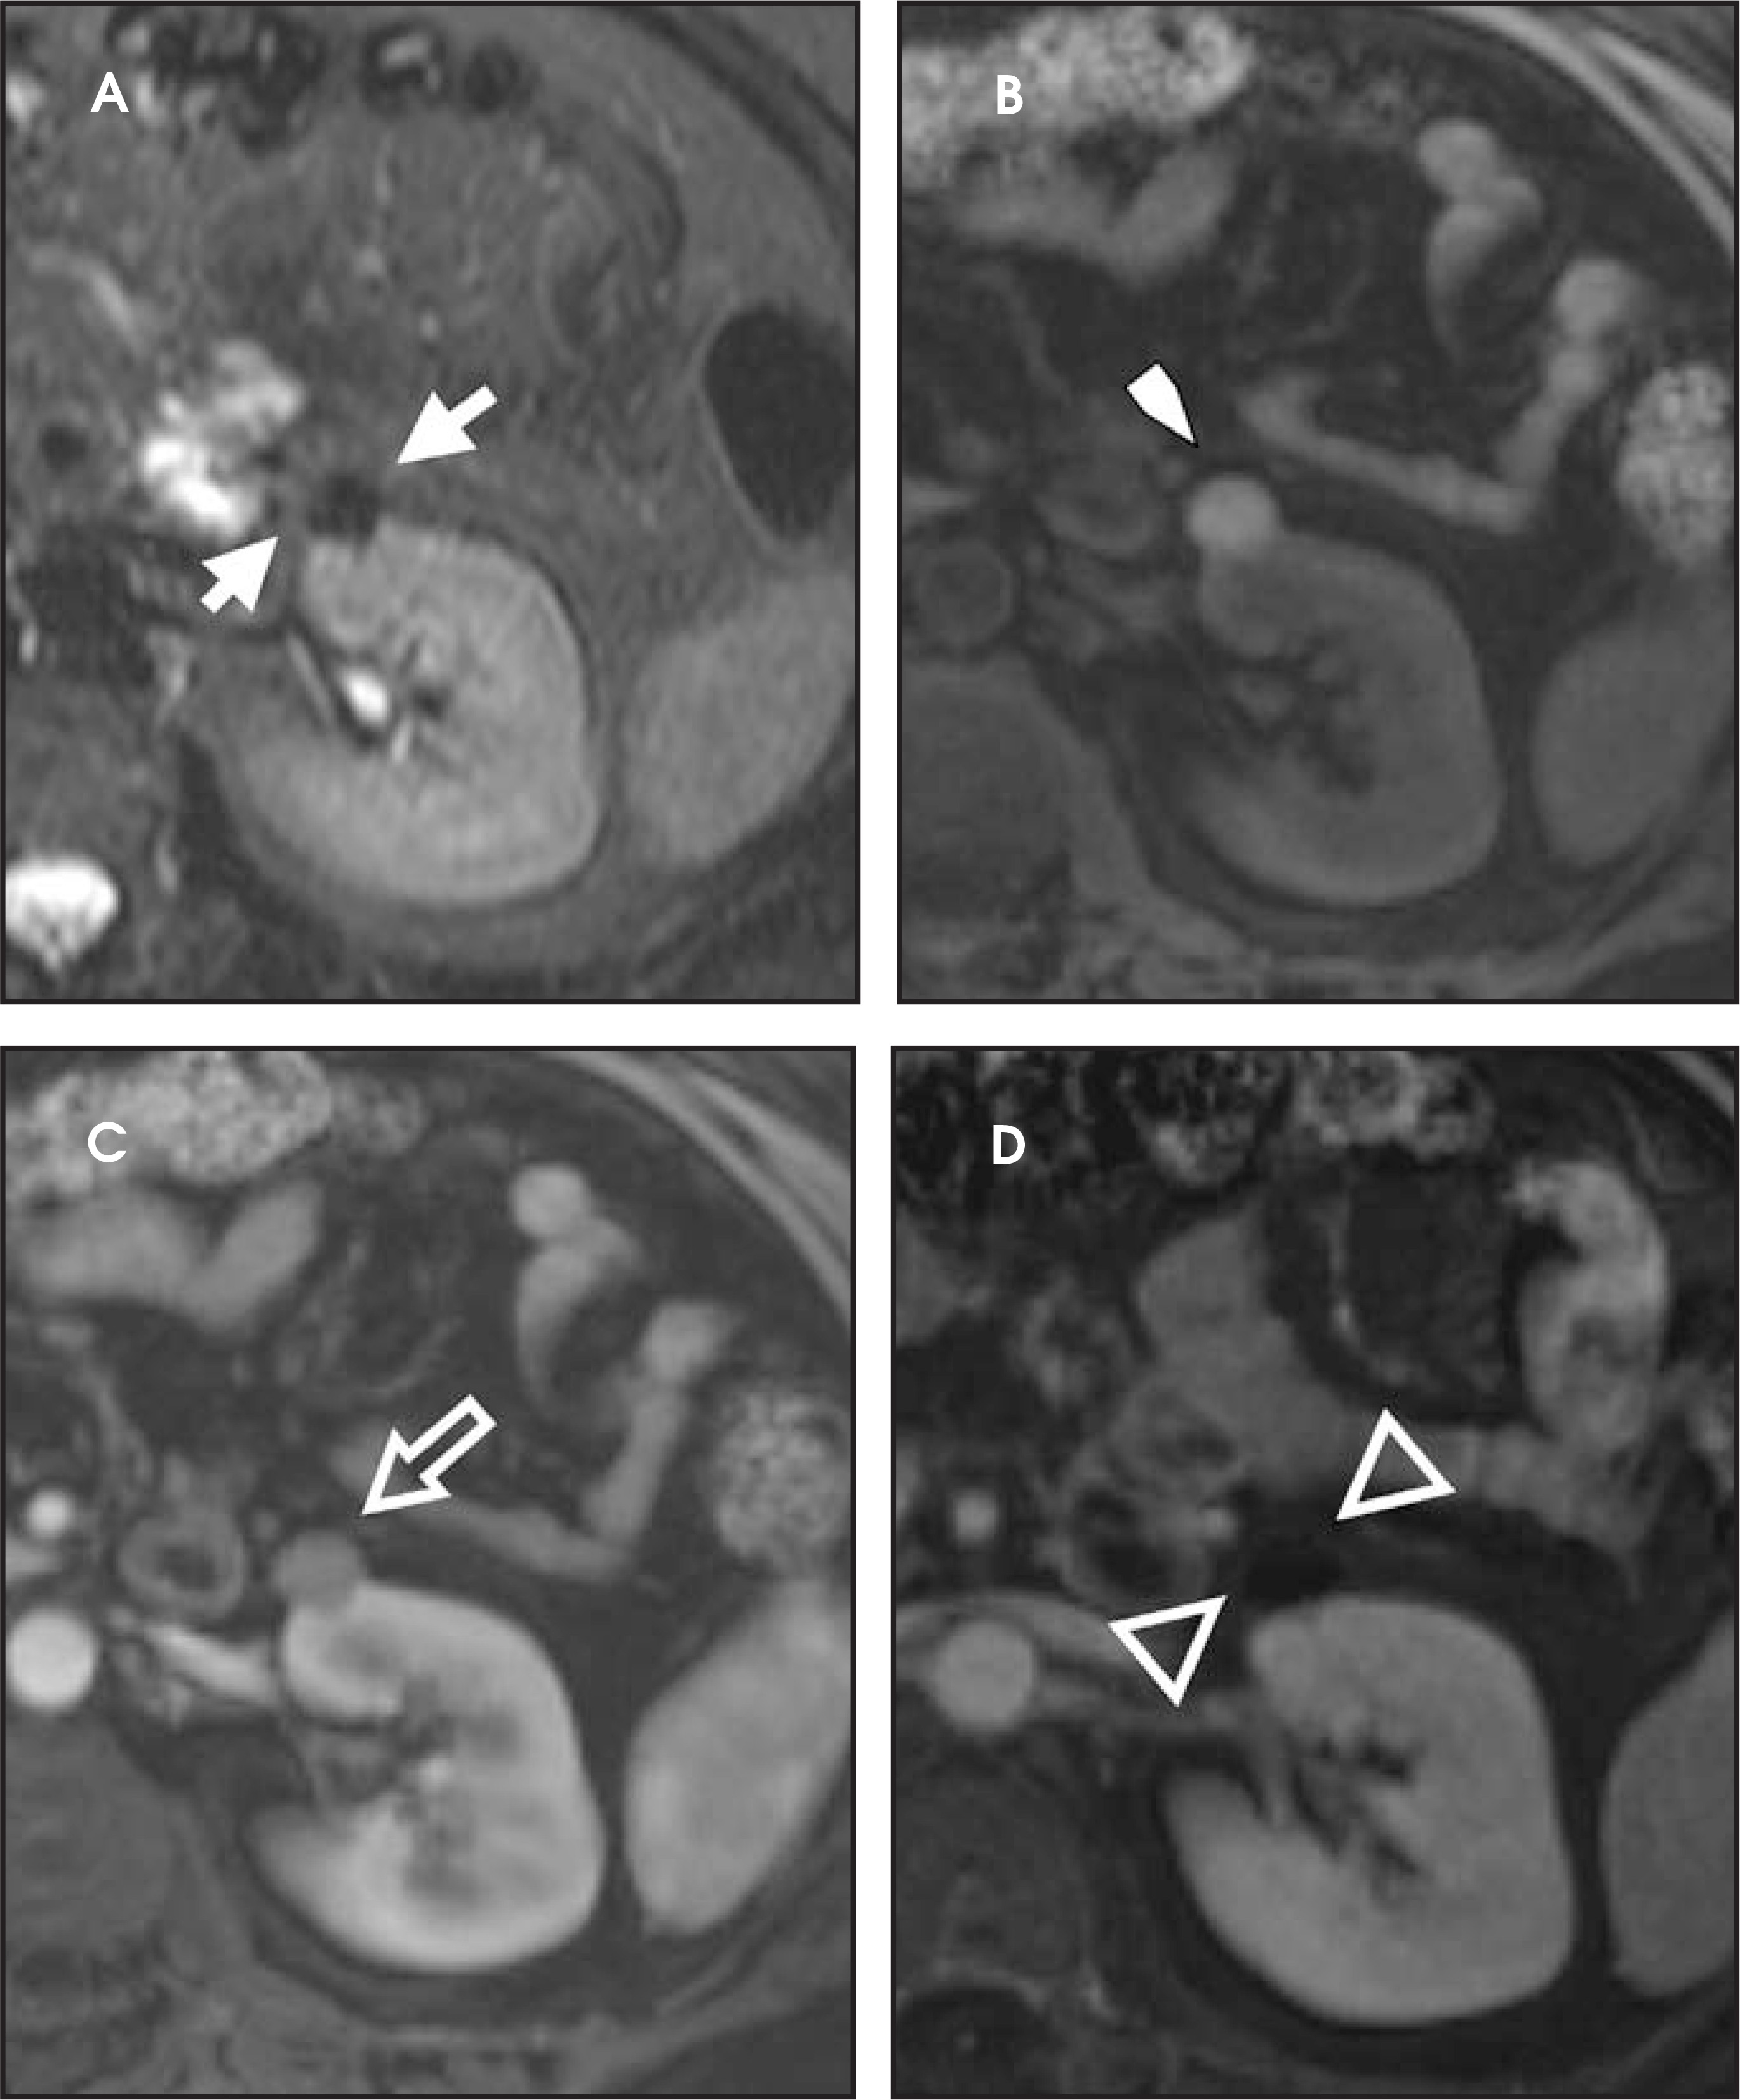
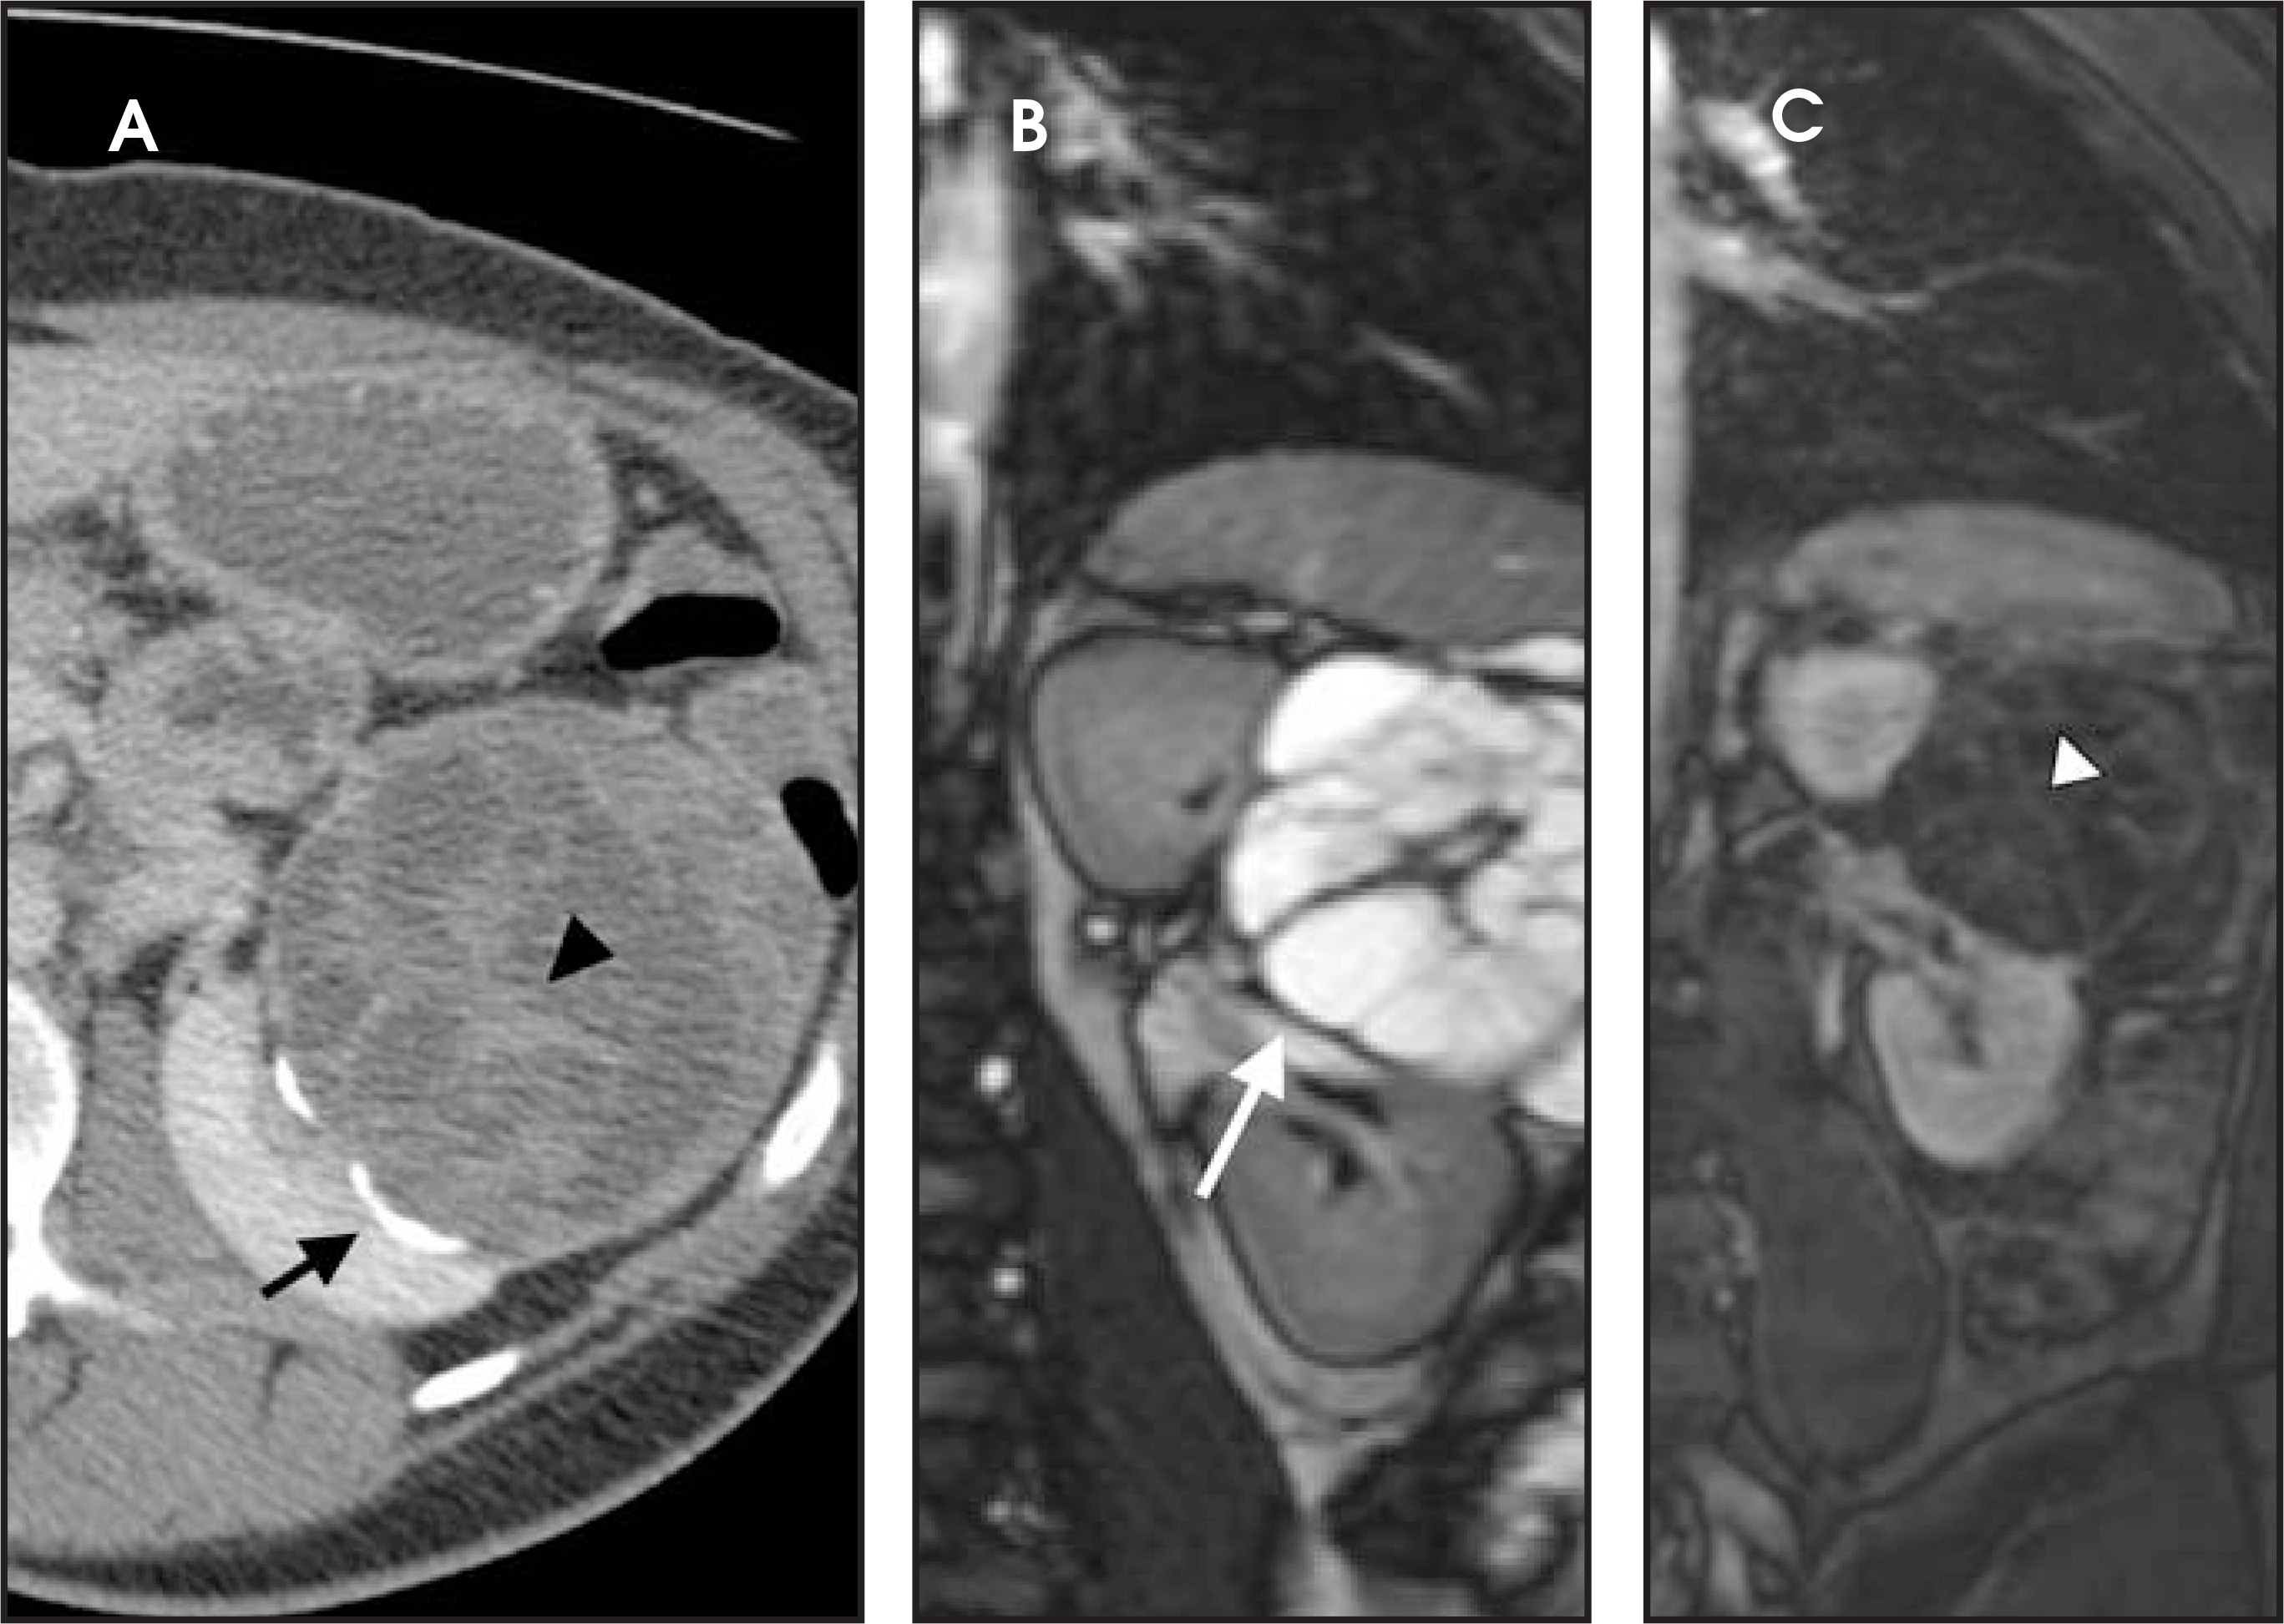
An incidental renal mass can be broadly divided into cystic or solid-appearing lesions. If US shows a homogenous anechoic renal lesion with posterior acoustic enhancement, the diagnosis of a simple cyst can be made readily. Similarly, a simple cortically based renal lesion with low (<15) HU and no internal structure also represents a benign cyst. On contrast-enhanced CT imaging, a homogeneous dense renal lesion poses a greater clinical challenge, as it may represent a true enhancing tumor or a hyperattenuating cyst (Figure 1). Current American College of Radiology guidelines rank CT and MRI (both with and without intravenous [IV] contrast) of equivalent appropriateness for overall indeterminate renal mass evaluation.4 Although it is the least expensive modality, US frequently will not definitely characterize the indeterminate cystic lesion if there is any significant internal heterogeneity, possibly due to blood clot or debris. On CT, a lesion will be classified as a suspicious solid mass (and not a hyperdense cyst) if the HU attenuation rises more than 10 to 15 HU following IV contrast administration. An increase in postcontrast attenuation of <15 HU may represent pseudoenhancement related to an artifact of image reconstruction algorithms.5
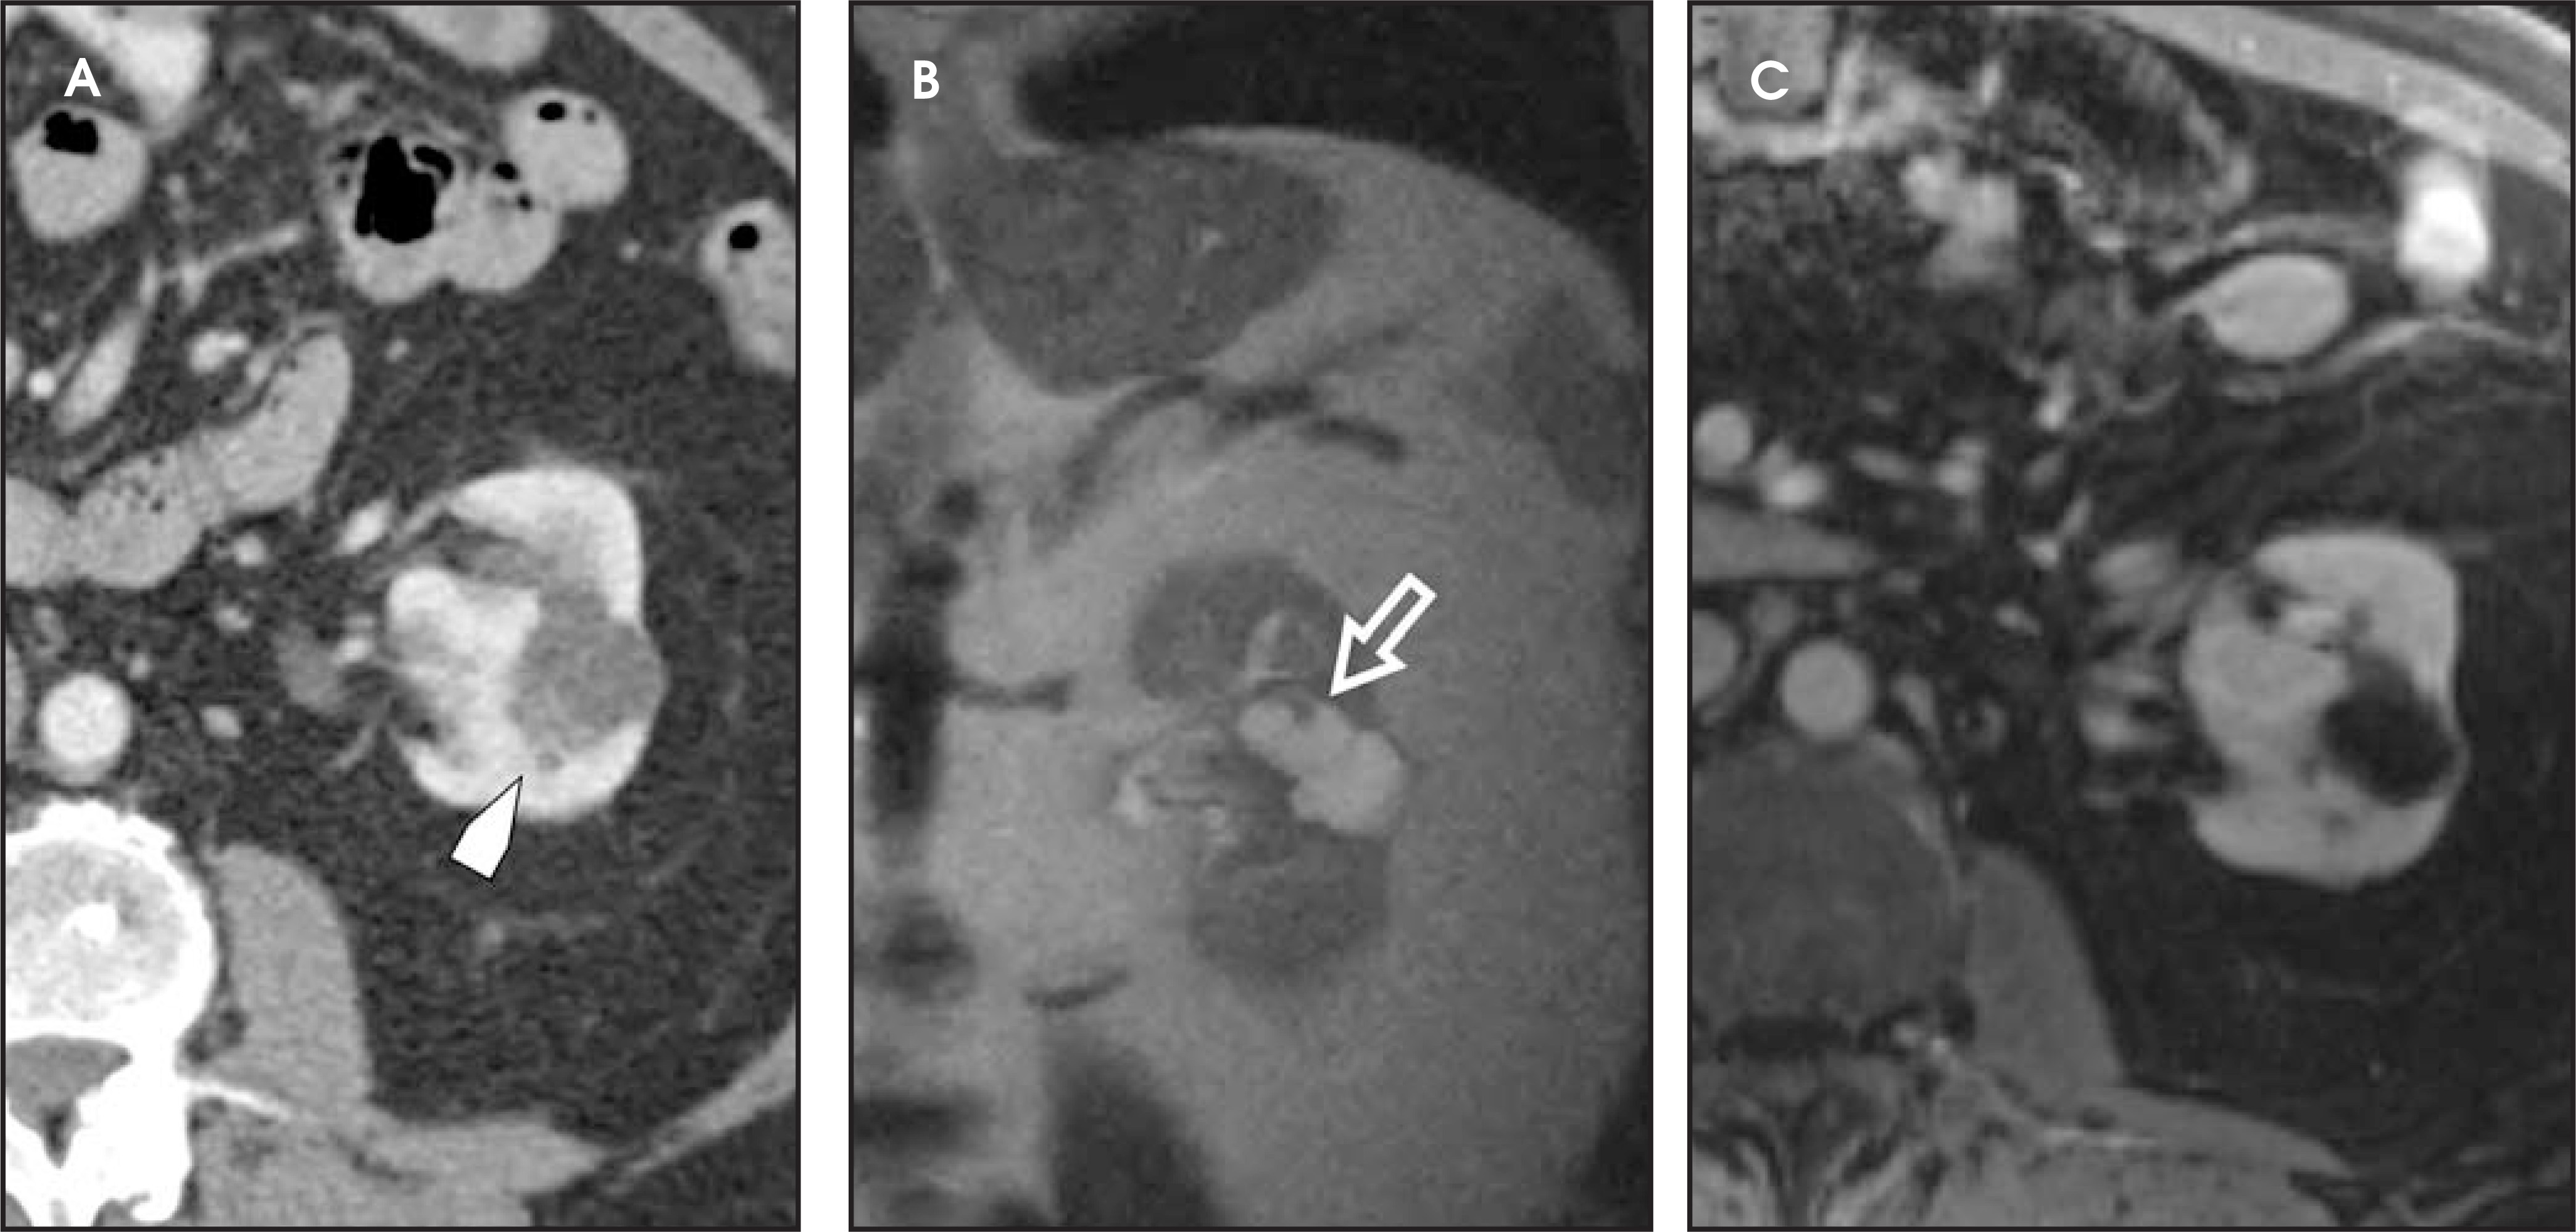
Bosniak promulgated a CT classification system (Class I through Class IV) to aid in the analysis and management of cystic-appearing renal lesions6 (Figure 2). This classification system has been widely accepted by both radiologists and urologists and has also been adapted for application to MRI.6 The tissue characterization abilities of MRI will frequently upgrade the Bosniak class of a cystic lesion seen on CT imaging; 10% of imaged lesions may be potentially reclassified to a higher stage by MRI.6 The remainder of this article will describe the technical aspects of renal MRI and provide an overview of a diagnostic algorithm for the MRI analysis of the indeterminate renal lesion.
Technique of MRI analysis
Accurate renal lesion characterization requires high-resolution imaging best performed with relatively modern equipment operating at a field strength of ≥1T. Although open configuration systems in the low and middle Tesla range (<1T) are appealing for claustrophobic and morbidly obese patients, the improved signal-to-noise ratio (SNR) and gradient strengths as well as reduced sequence acquisition times of high-field units yield superior images compared with sub-1T open magnet systems. Despite the recent market penetration of 3T magnets, 1.5T MRI remains the mainstay of high-field body imaging. Our current 1.5T protocol is listed in Table 1. Unless there is a specific history of hematuria, the authors do not routinely perform MR urography. In order to maximize SNR, a phased-array surface coil should be employed.
Respiratory motion presents a significant challenge to quality body MRI. The kidneys, despite their location in the retroperitoneum, exhibit significant movement with respiration. The authors acquire the majority of sequences during suspended respiration to minimize respiratory artifact that can be severe and can render images uninterpretable. End- expiratory breath-holding provides the most reproducible diaphragmatic excursion and is recommended for most patients.7 Anecdotally, many of our more sick or elderly patients can sustain a sufficiently long respiratory suspension only with breath-holds at full inspiration, although this does result in more variability in renal position across sequences. During dynamic contrast-enhanced sequence acquisition, k-space– based parallel imaging is used to minimize acquisition time (syngo Grappa, Siemens Medical Solutions, Malvern, PA) and facilitate respiratory suspension.
The coronal single-shot fast spin-echo (SSFSE) sequence with half-Fourier reconstruction provides both excellent anatomic detail and an overview of renal pathology (Figure 2B). This T2-weighted (T2W) sequence is acquired during suspended respiration and can also be used as a localizer. Hydronephrosis is readily apparent on this sequence, and tumoral renal vein invasion can be seen as absence of the normal flow void. Diffusion-weighted imaging (DWI), a standard component in neuroimaging, has now been incorporated into all our abdominal MRI protocols. As a broad analogy, DWI in body MRI mirrors the application of fluorodeoxyglucose (FDG)–positron emission tomography (PET): foci of restricted diffusion appear hyperintense on these sequences and may represent malignancy, infection, inflammation, and ischemia.8-10 While DWI is not used as the sole determinant of an indeterminate lesion’s malignant potential, the sequence will often increase diagnostic confidence.
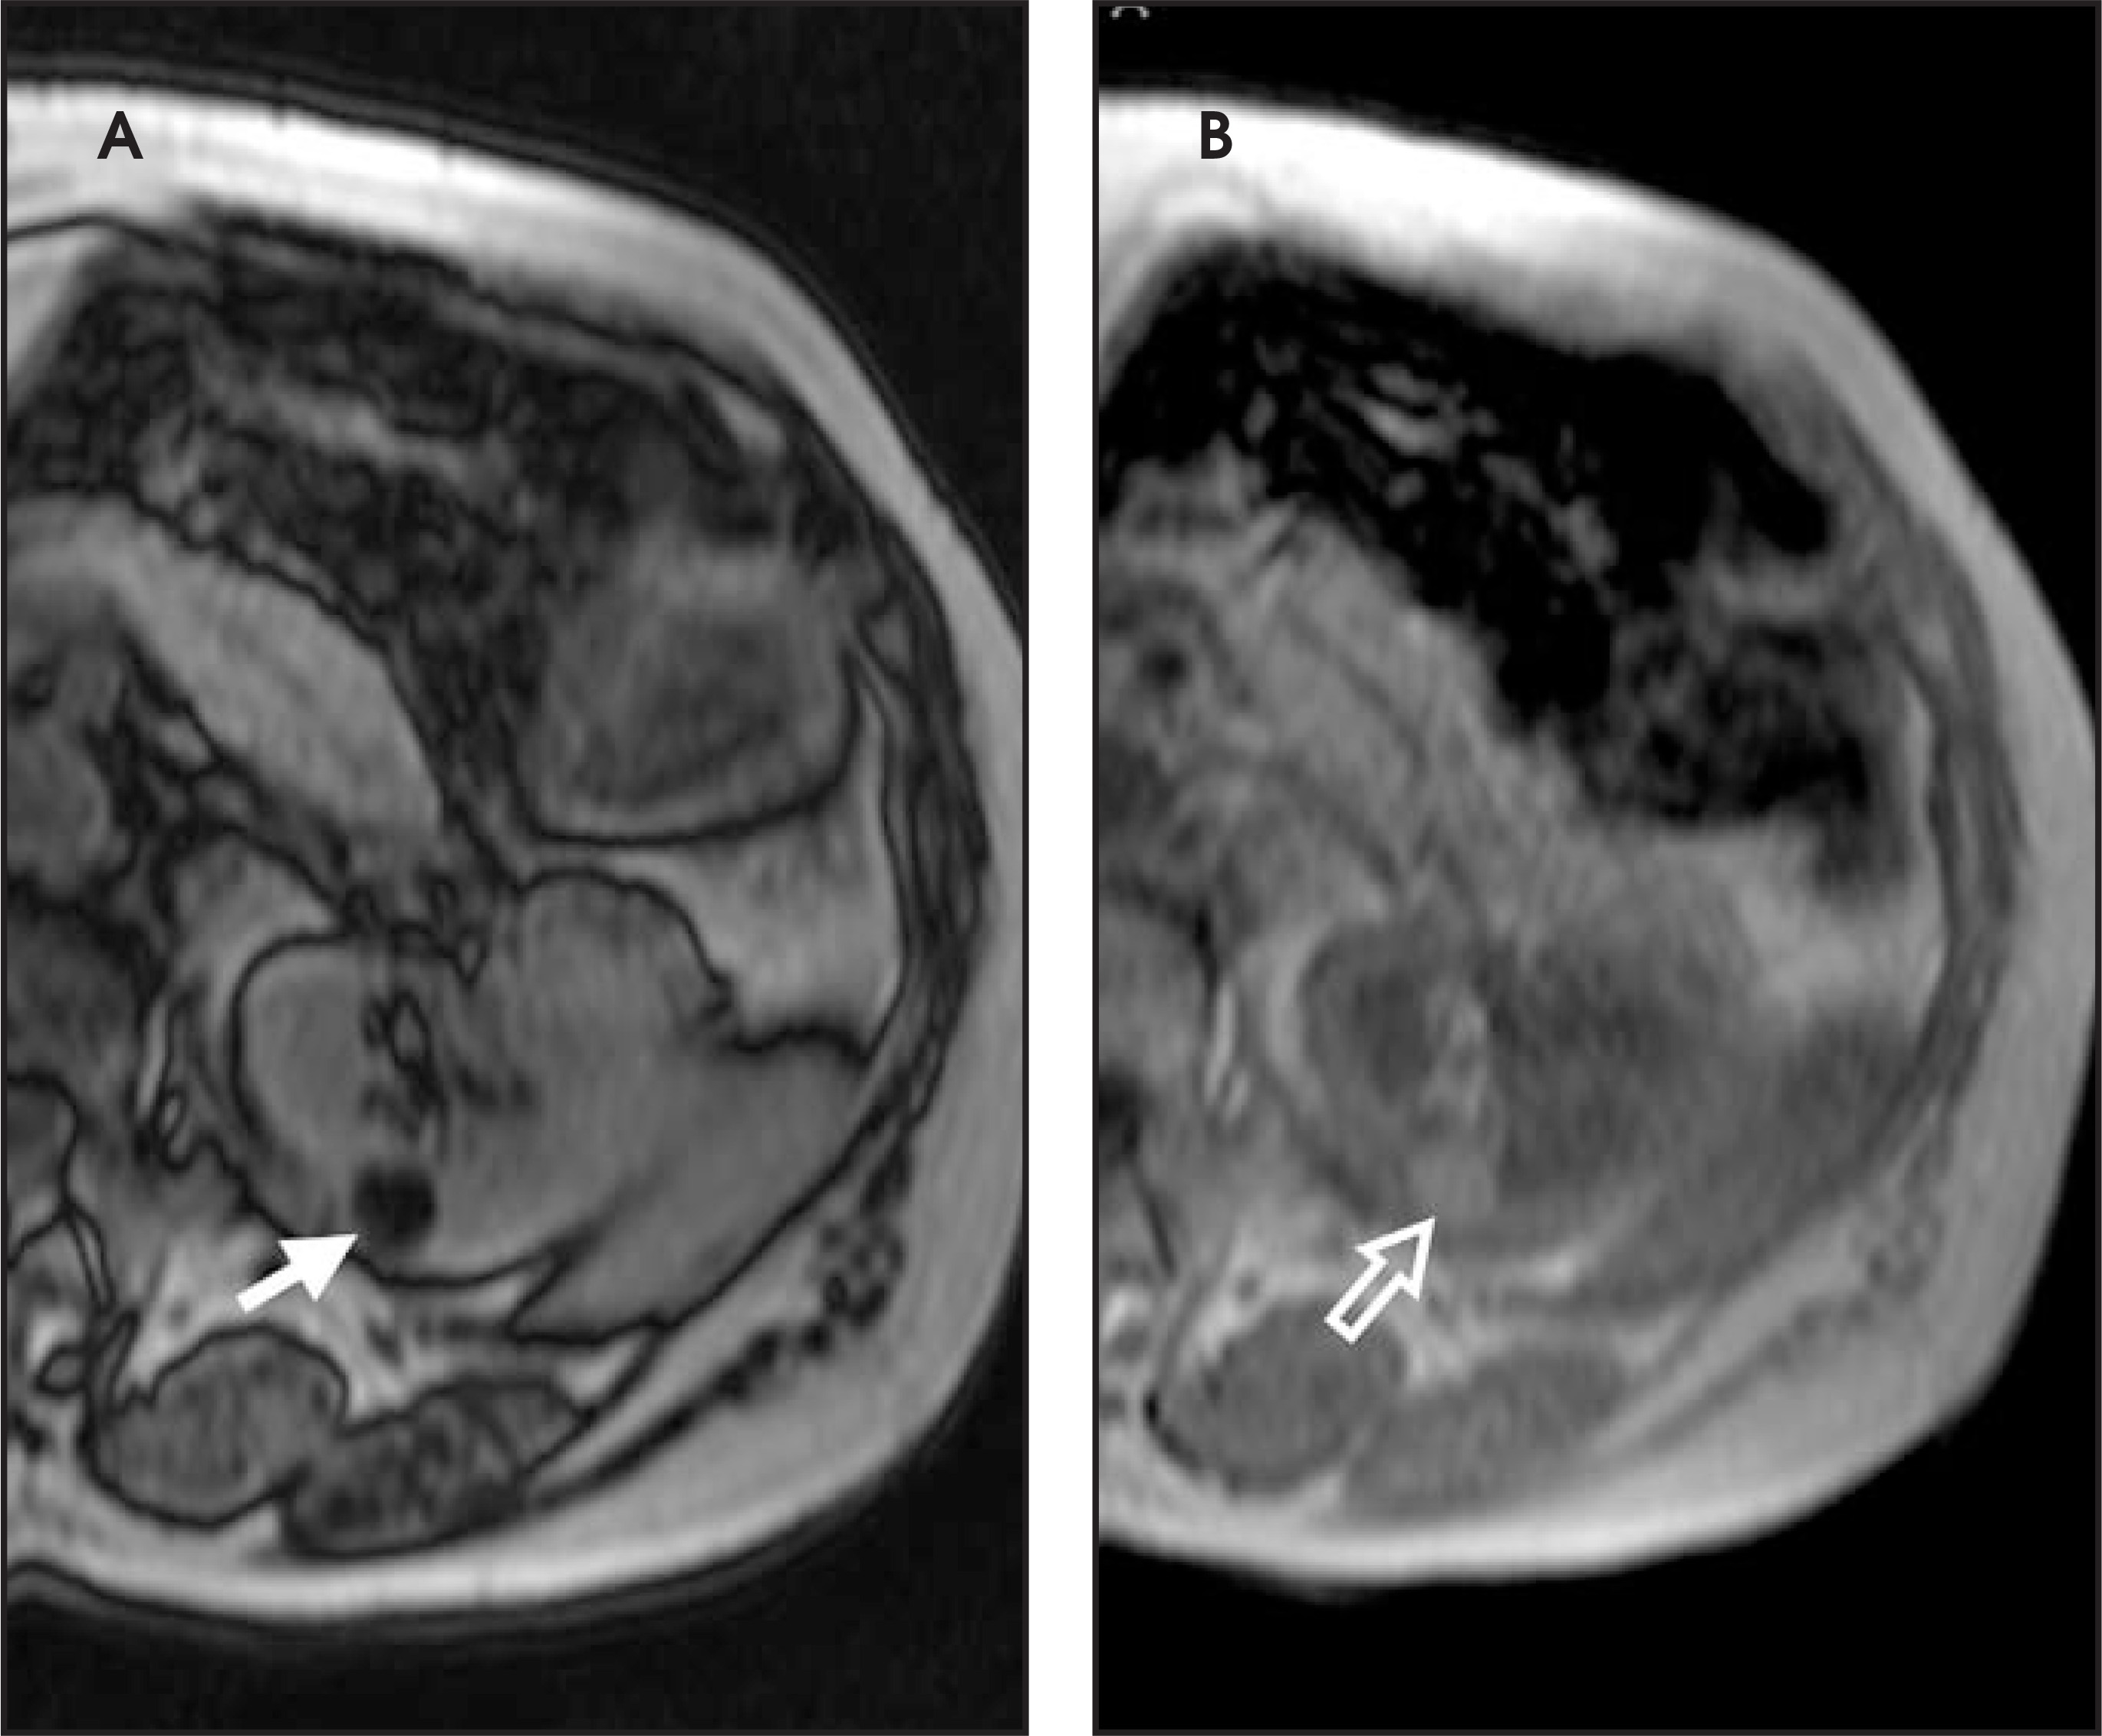
Several sequences in the MRI protocol are designed to detect lipid within an indeterminate renal lesion. A chemically selective fat-saturation pulse is employed as part of a fast spin-echo (FSE) T2W sequence, a T1-weighted (T1W) gradient-recalled echo (GRE) in-phase sequence, and with 3-dimensional (3D) volume-interpolated gradient-echo T1W dynamic contrast acquisitions (Figure 3). This fat-saturation pulse readily causes signal loss from “macroscopic” deposits of fat within an indeterminate lesion. This can facilitate the diagnosis of angiomyolipoma (AML), as discussed below. In- and opposed-phase T1W GRE sequences detect intra-voxel, or intracellular, lipid (Figure 4).
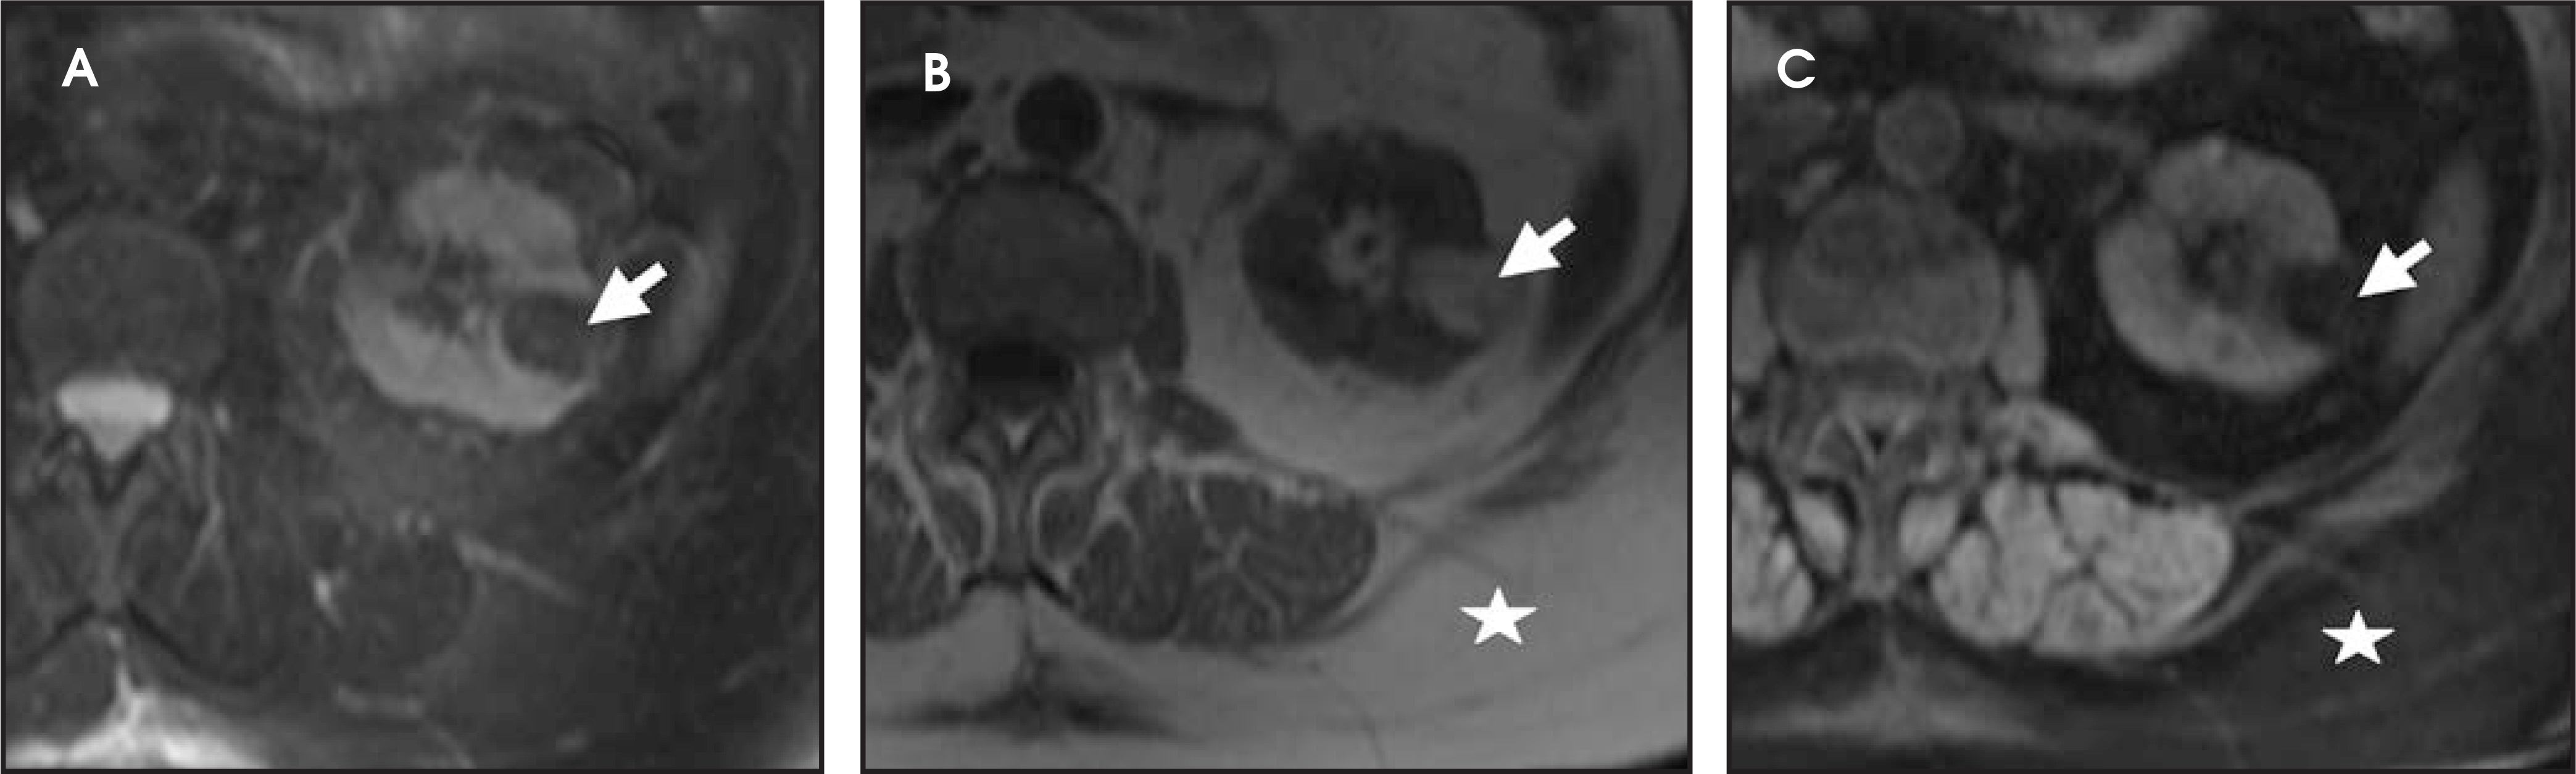
Dynamic contrast-enhanced imaging, using multiphase 3D volume-interpolated GRE T1W sequences, is the workhorse of renal lesion characterization. These are performed as multiple breath-hold sequences before and at timed intervals after IV bolus injection of a gadolinium-based contrast agent. Reproducible diaphragmatic excursion during breath-holds allows for more accurate computer-processed image subtraction and better visual appreciation of the degree of lesion enhancement. The optimal phases of enhancement on multiphase contrast-enhanced MRI mirror those seen with iodinated agents on triple-phase CT examinations. Arterial-phase imaging begins at 20 seconds following initiation of a 2 mL/sec bolus injection of 20 mL of IV extracellular gadolinium contrast agent. The optimal corticomedullary phase peaks at 60 seconds postinjection. A second corticomedullary phase, which we do not routinely image, occurs approximately 90 seconds after injection due to the T2* effects of concentrated gadolinium within the renal tubules. The nephrographic phase, wherein the renal parenchyma (medulla and cortex) enhance uniformly, can be imaged reliably at 2 minutes after injection. We typically acquire the contrast-enhanced images in the transverse plane. However, if there is a known lesion involving the upper or lower poles of either kidney, the coronal plane is preferable because of improved in-plane resolution. The choice of plane is not critical when using a 3D acquisition because the images may be reconstructed in any plane. Whenever precontrast and dynamic contrast-enhanced images are obtained using identical parameters (field of view, matrix, slices, etc), postprocessing digital subtraction can be applied. By subtracting the precontrast dataset from the post-contrast dataset, a set of subtraction images is obtained. On these images, nonenhancing structures appear dark. Any areas of contrast enhancement, such as enhancement within an indeterminate renal lesion, should be readily apparent on the subtraction images (Figure 1).
Analysis of lesions
Cystic renal masses
Once technically acceptable images are acquired, the first step in analysis of any renal mass requires classifying the lesion as cystic or solid. A lesion with generally uniform hyperintensity on T2W sequences, similar to cerebral spinal fluid or gallbladder, can be confidently labeled “cystic.” The most common etiologies of a cystic renal lesion include simple cyst, complicated benign cyst, and cystic RCC. Internal hemorrhage or proteinaceous debris within an indeterminate cystic lesion may result in relative T2 hypointensity compared with a simple cyst and should correspond to T1 hyperintensity on the fat-saturated T1W sequences. Measurement of signal intensity on the pre- and postcontrast sequences or the application of subtraction software will assess whether a lesion is truly cystic or merely a T2 hyperintense solid mass (Figure 1). If there are no dominant thickened septations or nodular components, a diagnosis of benign cyst (simple or hemorrhagic) can be assigned.
The Bosniak CT criteria for cystic renal classification have been widely adapted for MRI interpretation.5 Unfortunately, compared with its appearance on CT, cyst wall calcification is not well appreciated on MR images. A small number (<4) of thin “hairline” septations within a cyst without other concerning features is consistent with a benign diagnosis. Lesions with ≥4 septations should be followed with additional imaging examinations (Bosniak Class II or IIF). Any thickened or irregular septations or nodular enhancing components should raise the specter of a cystic renal cell carcinoma and require histologic sampling (Class III or IV) or interval follow-up in the frail patient (Figure 2 and Figures 5 through 8).
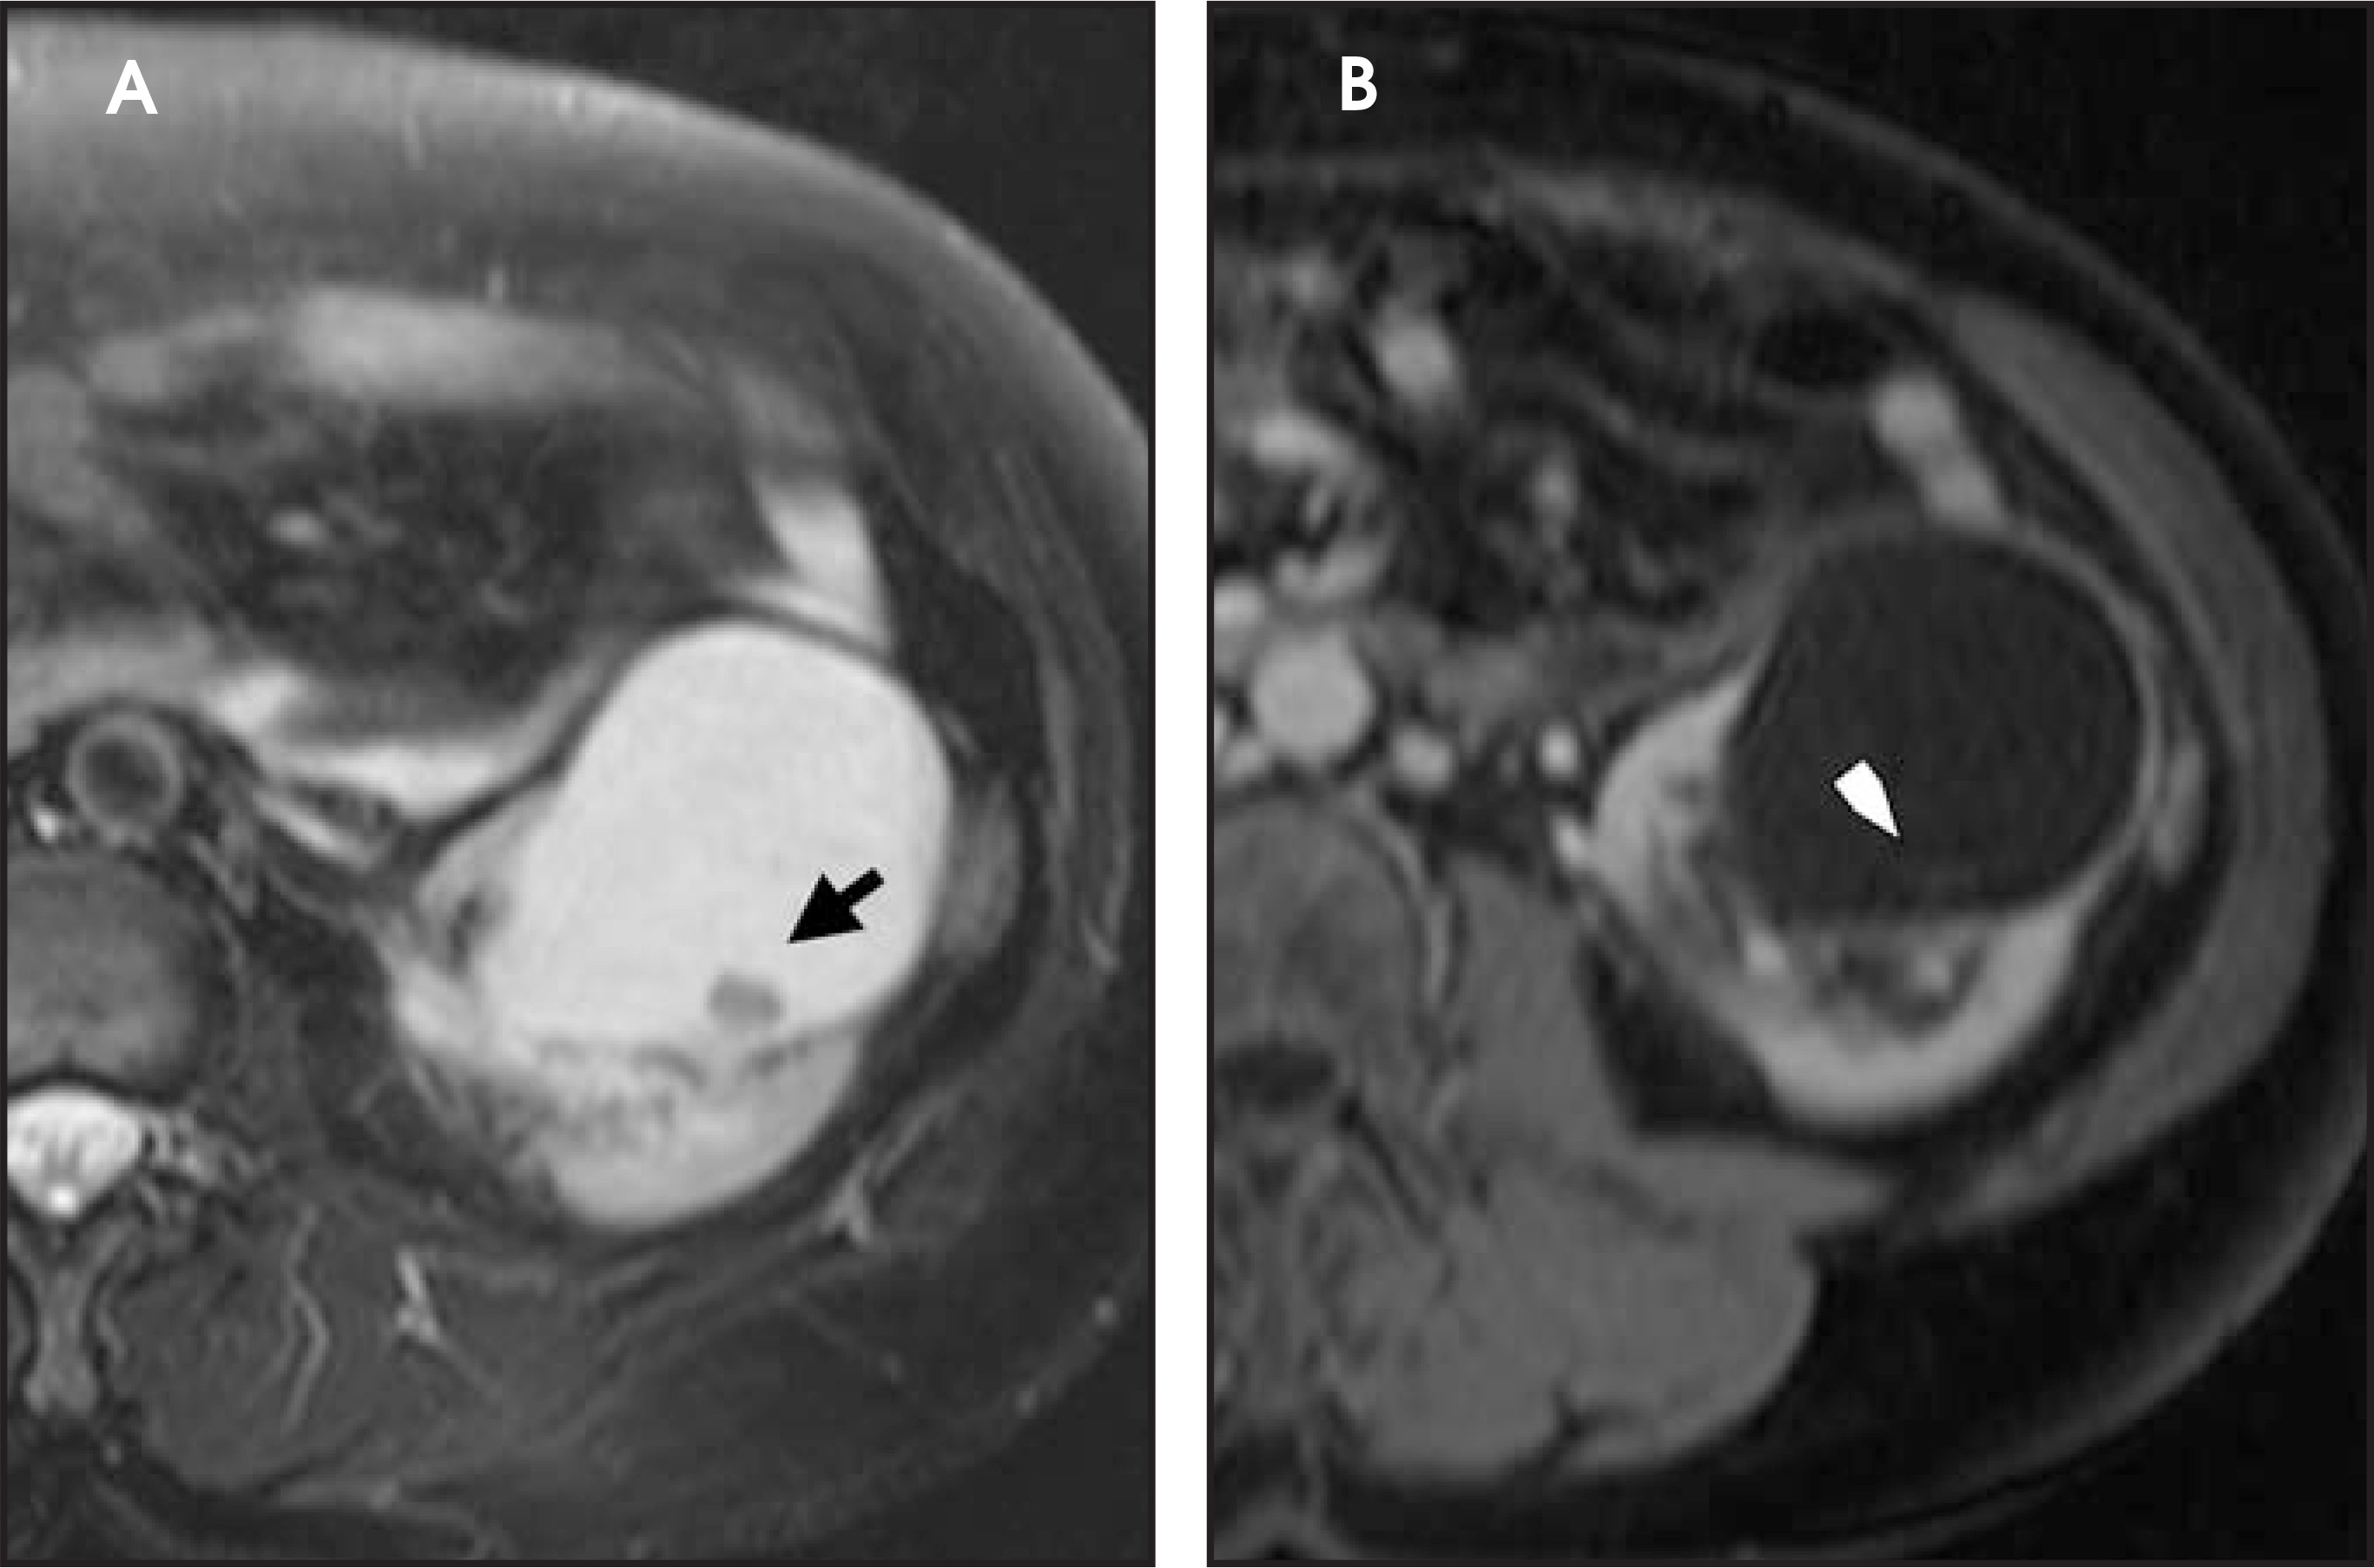
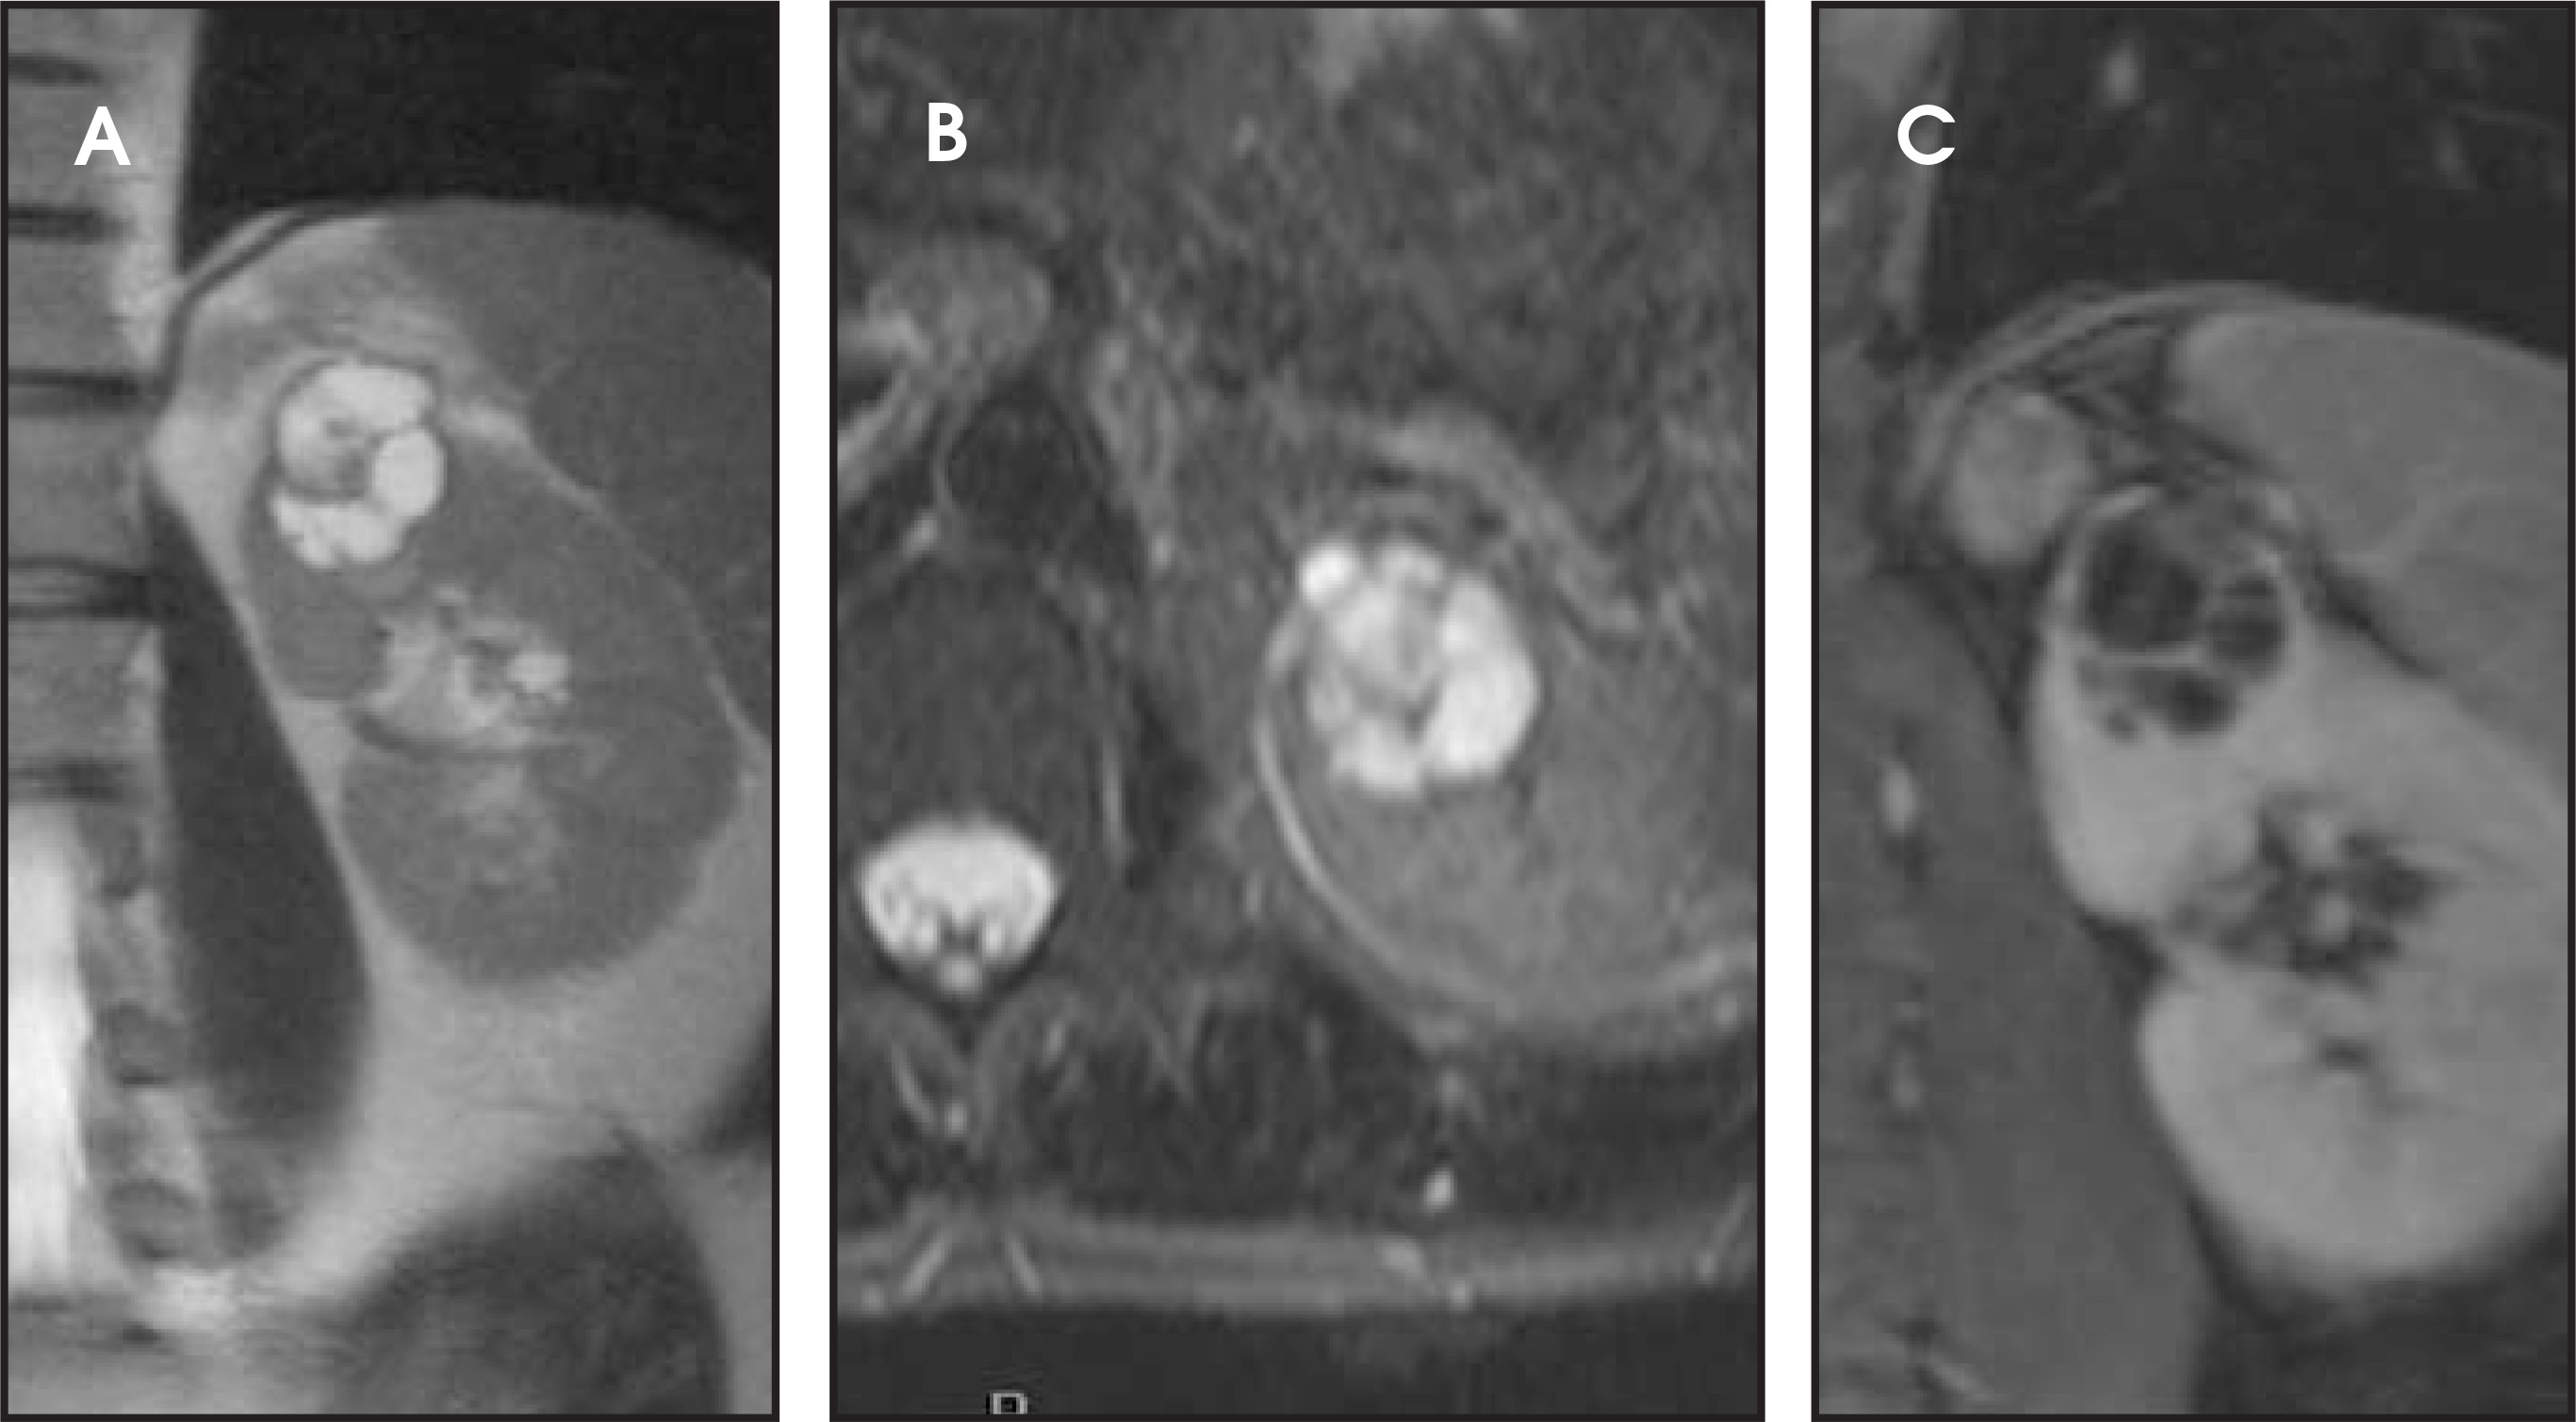
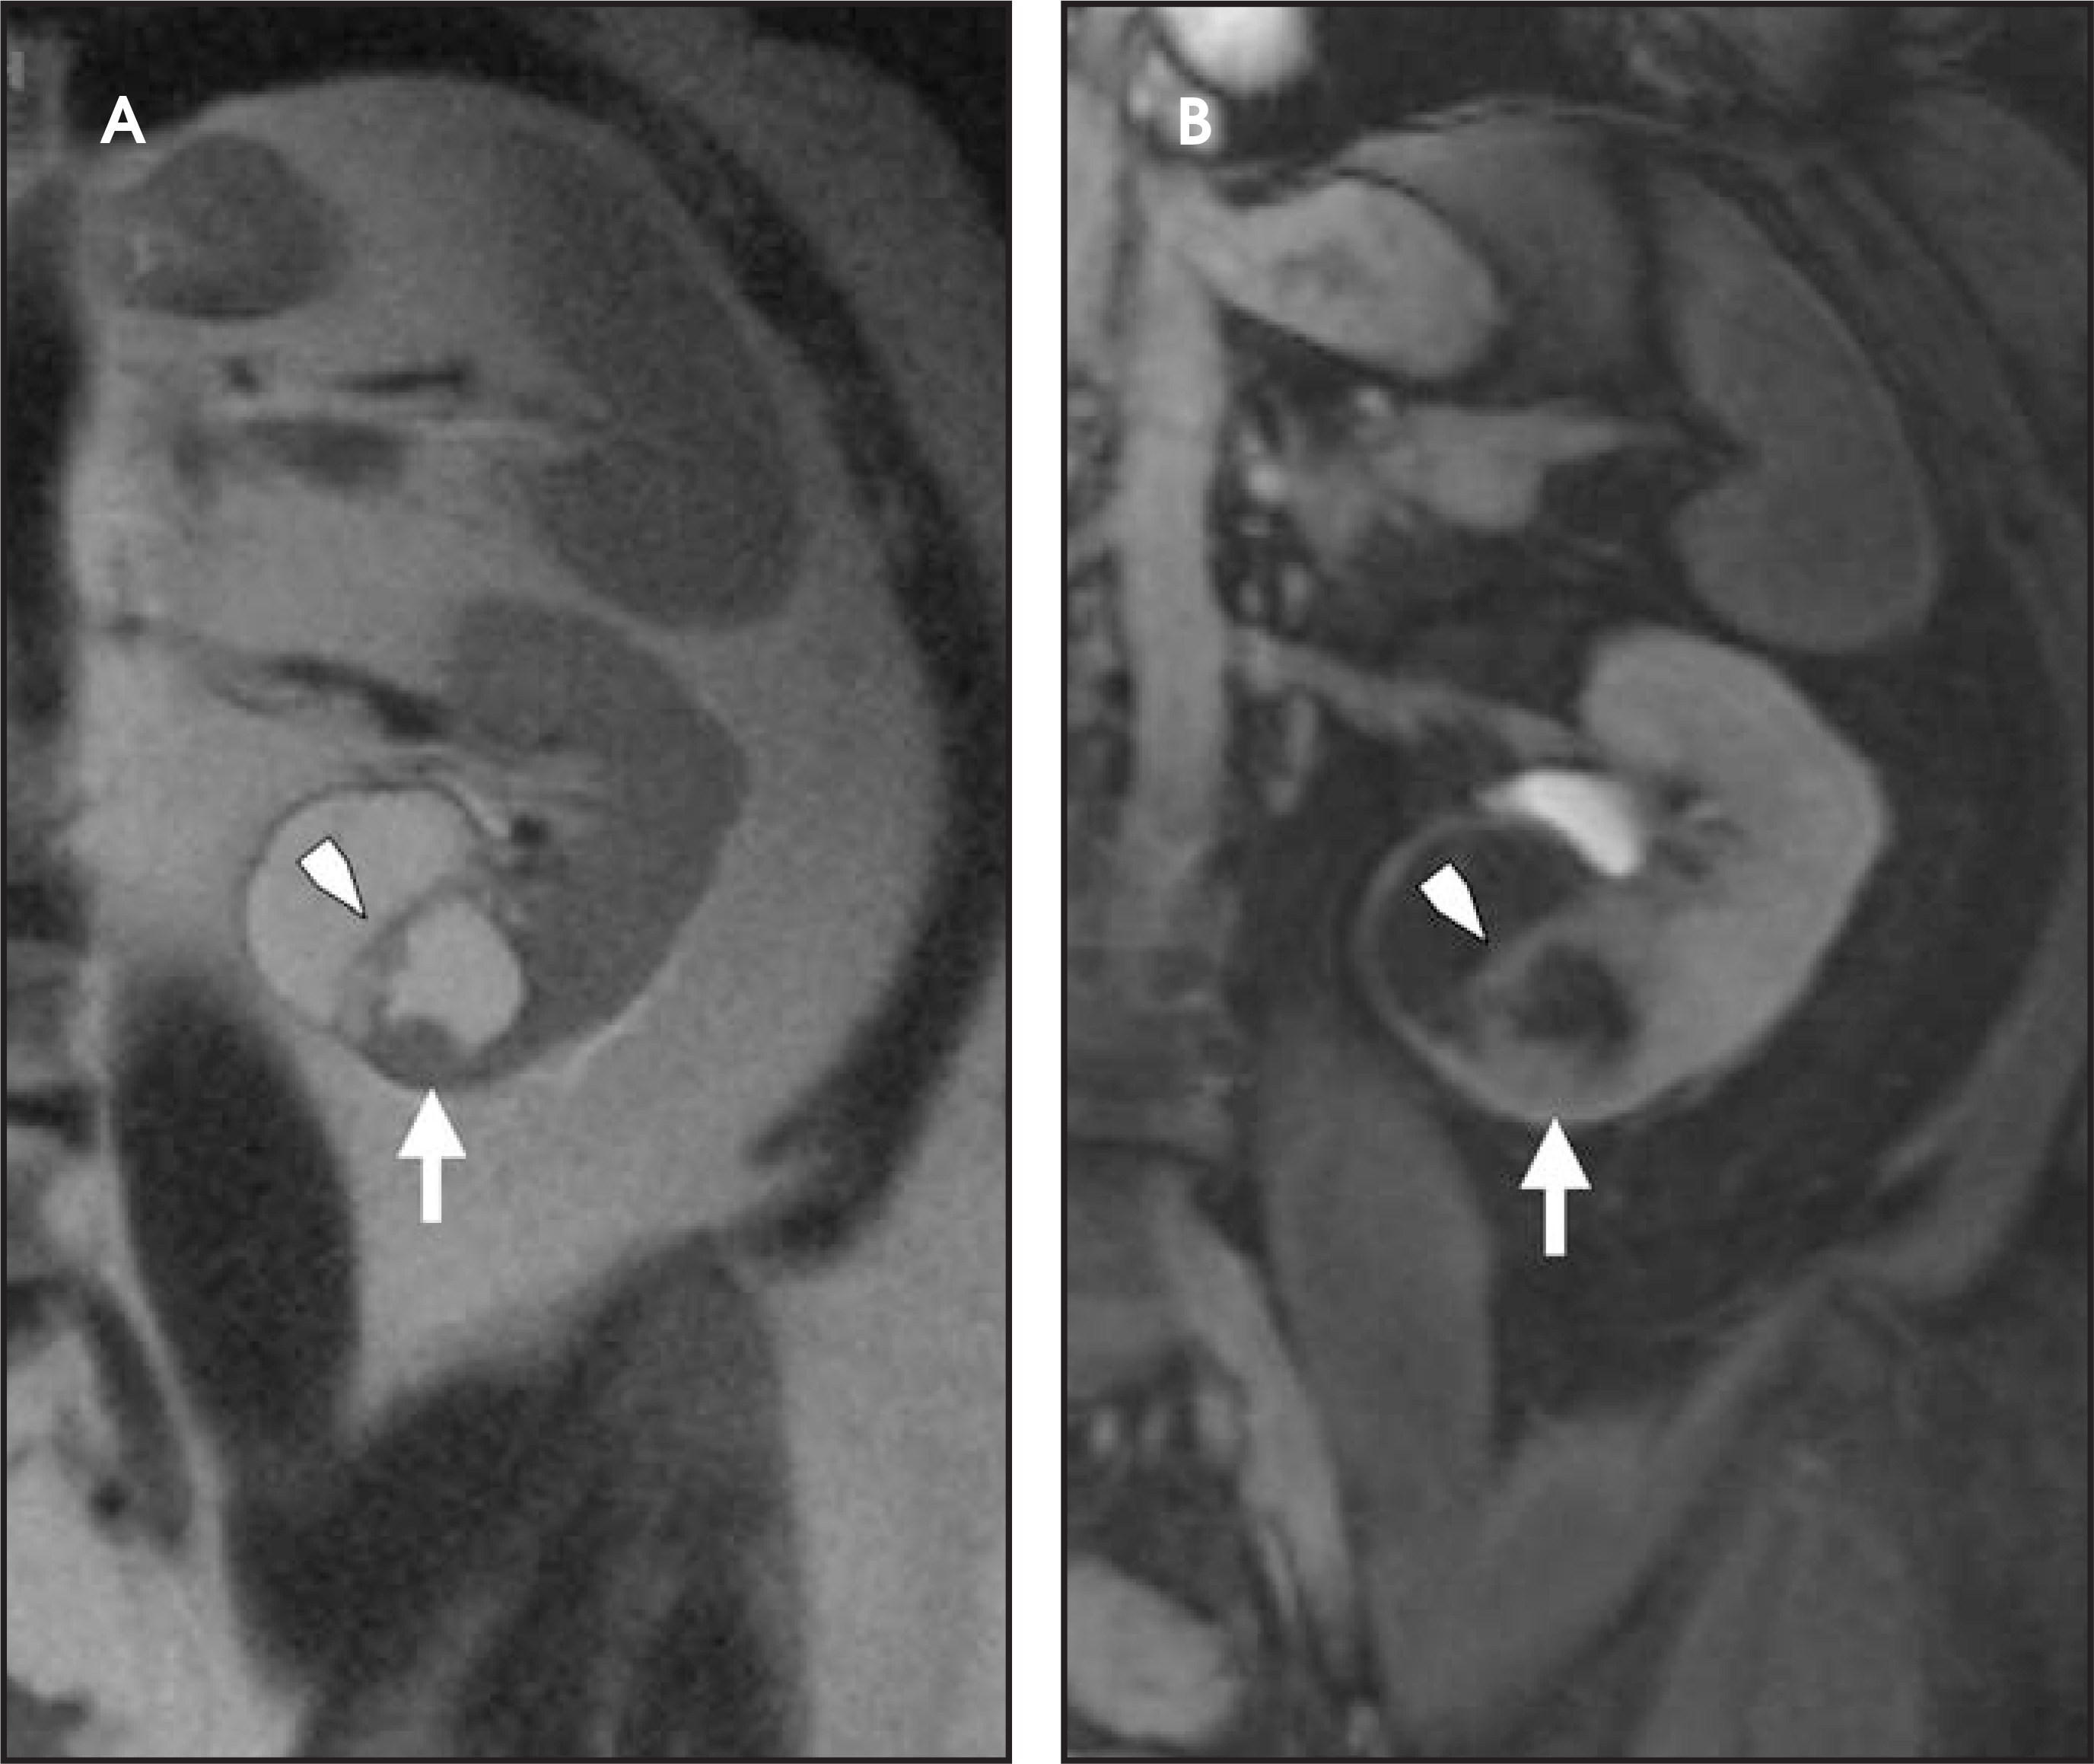
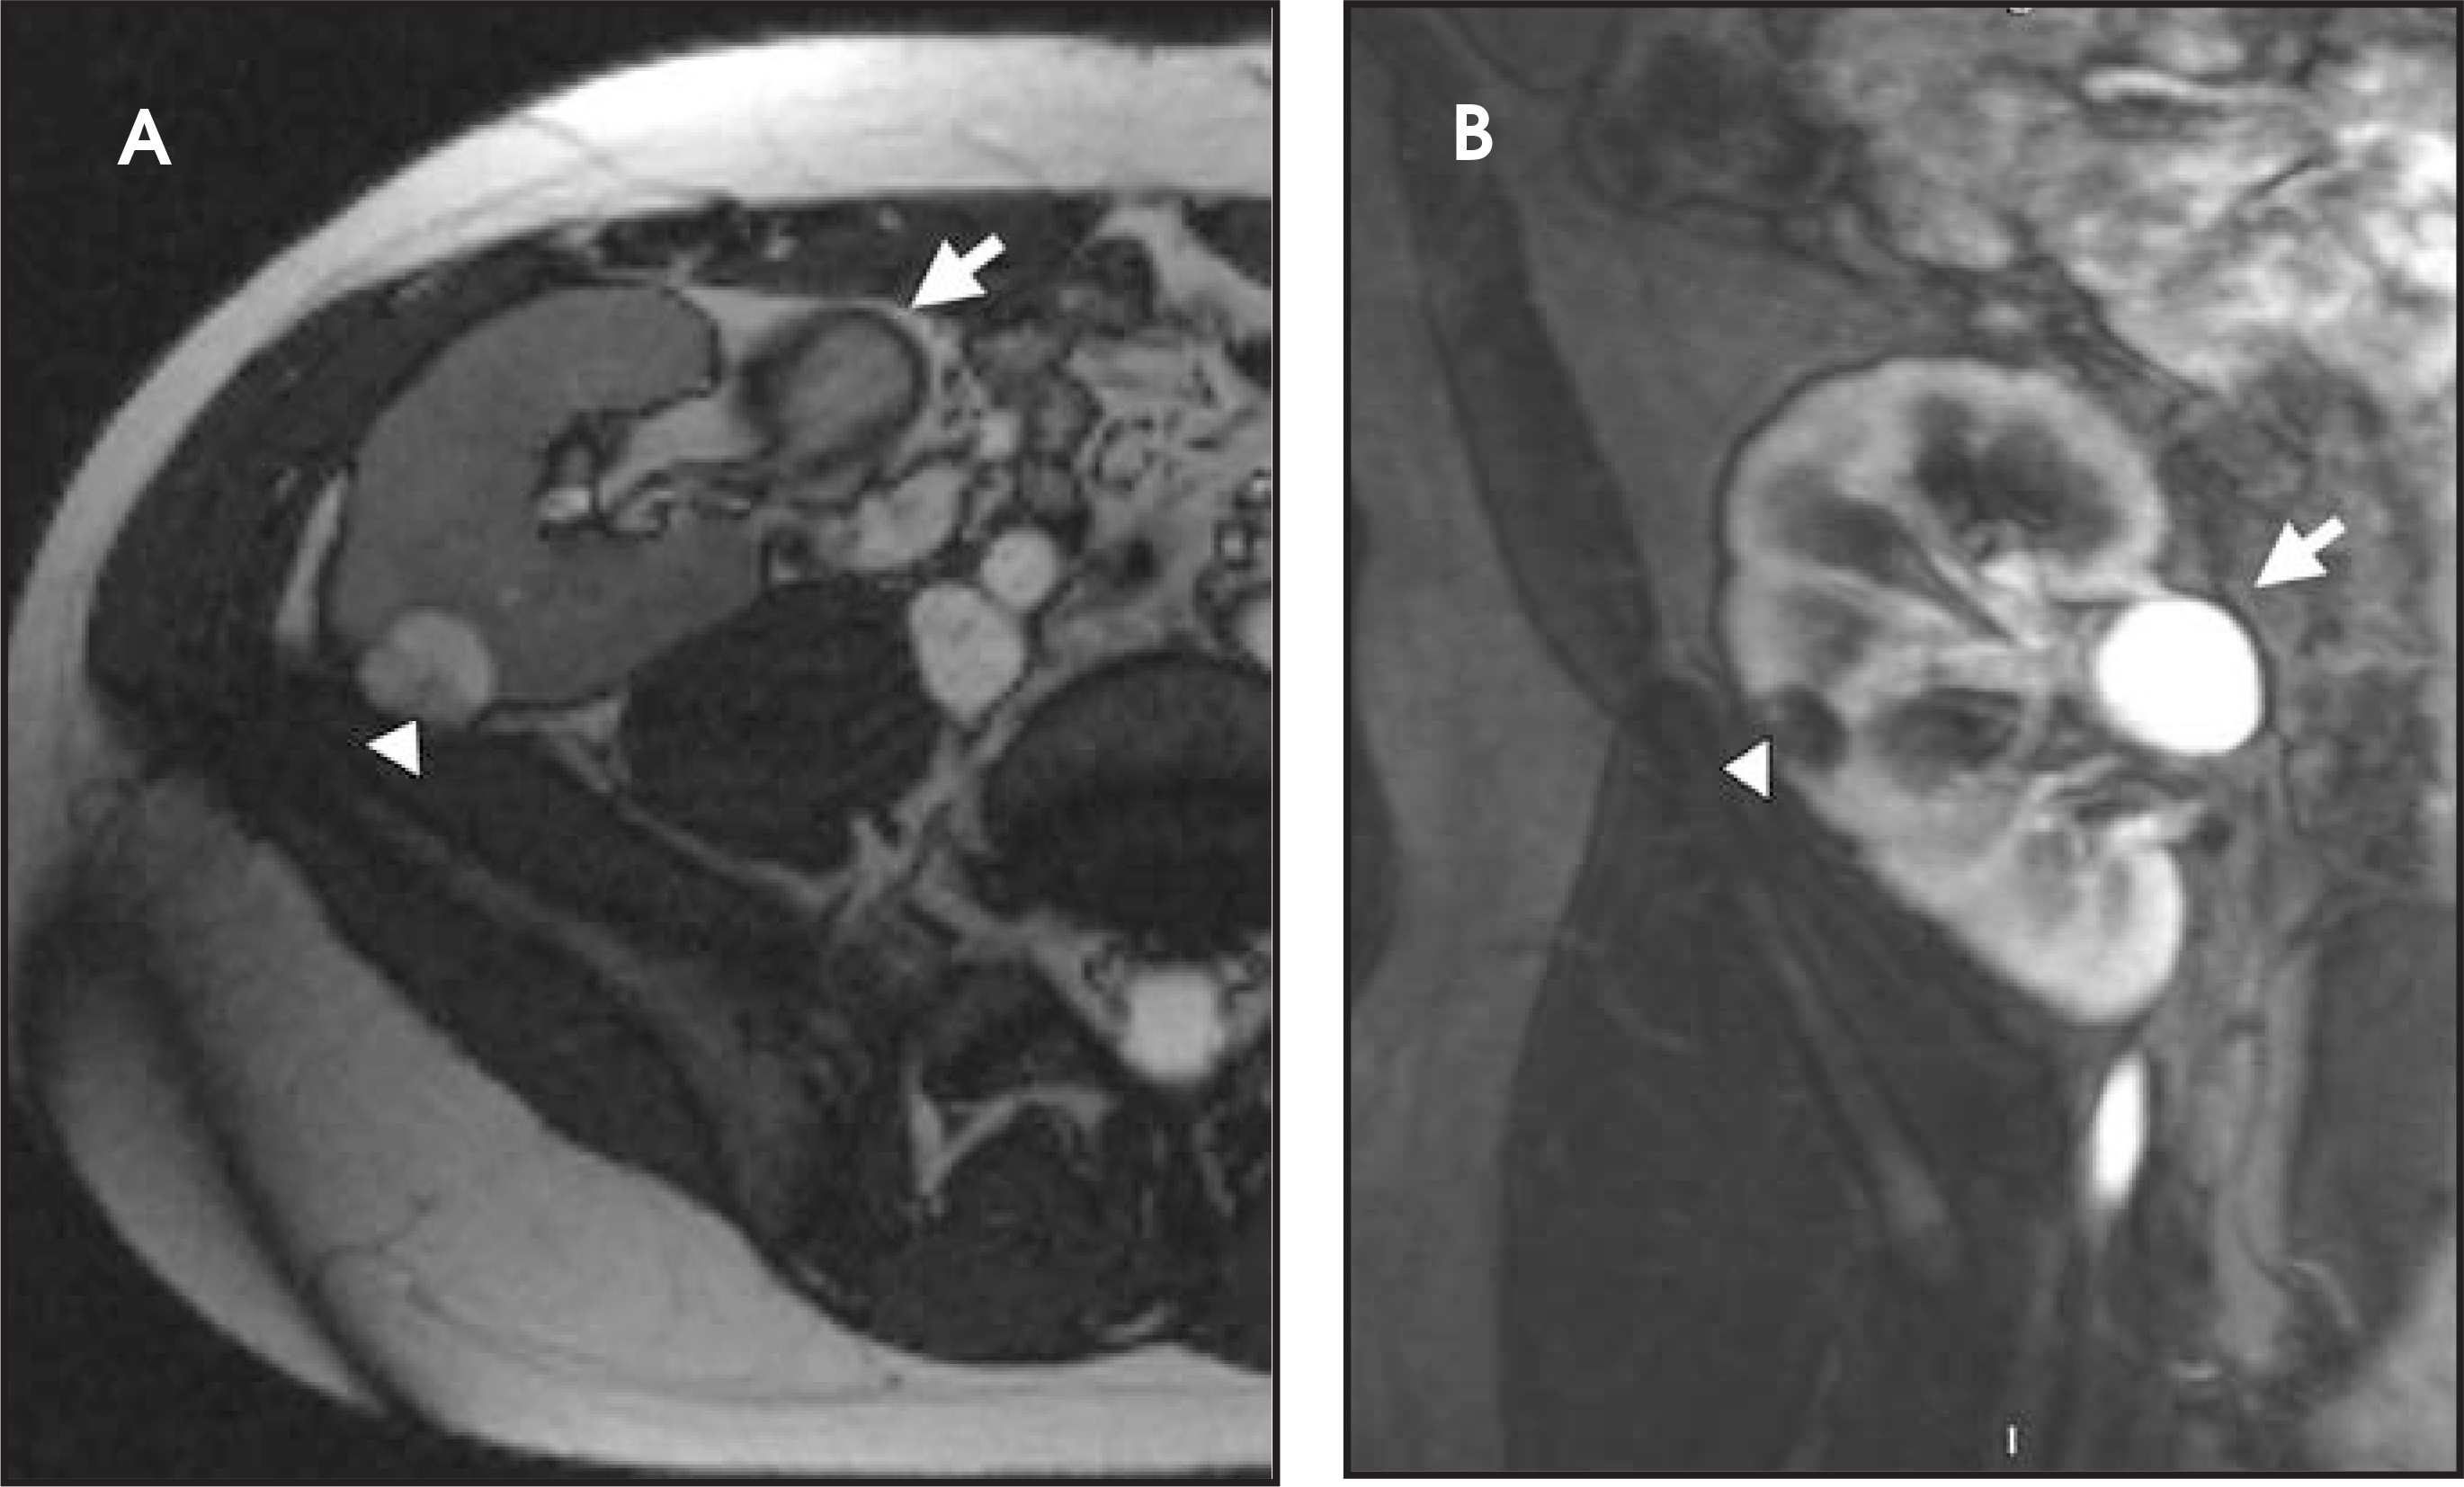
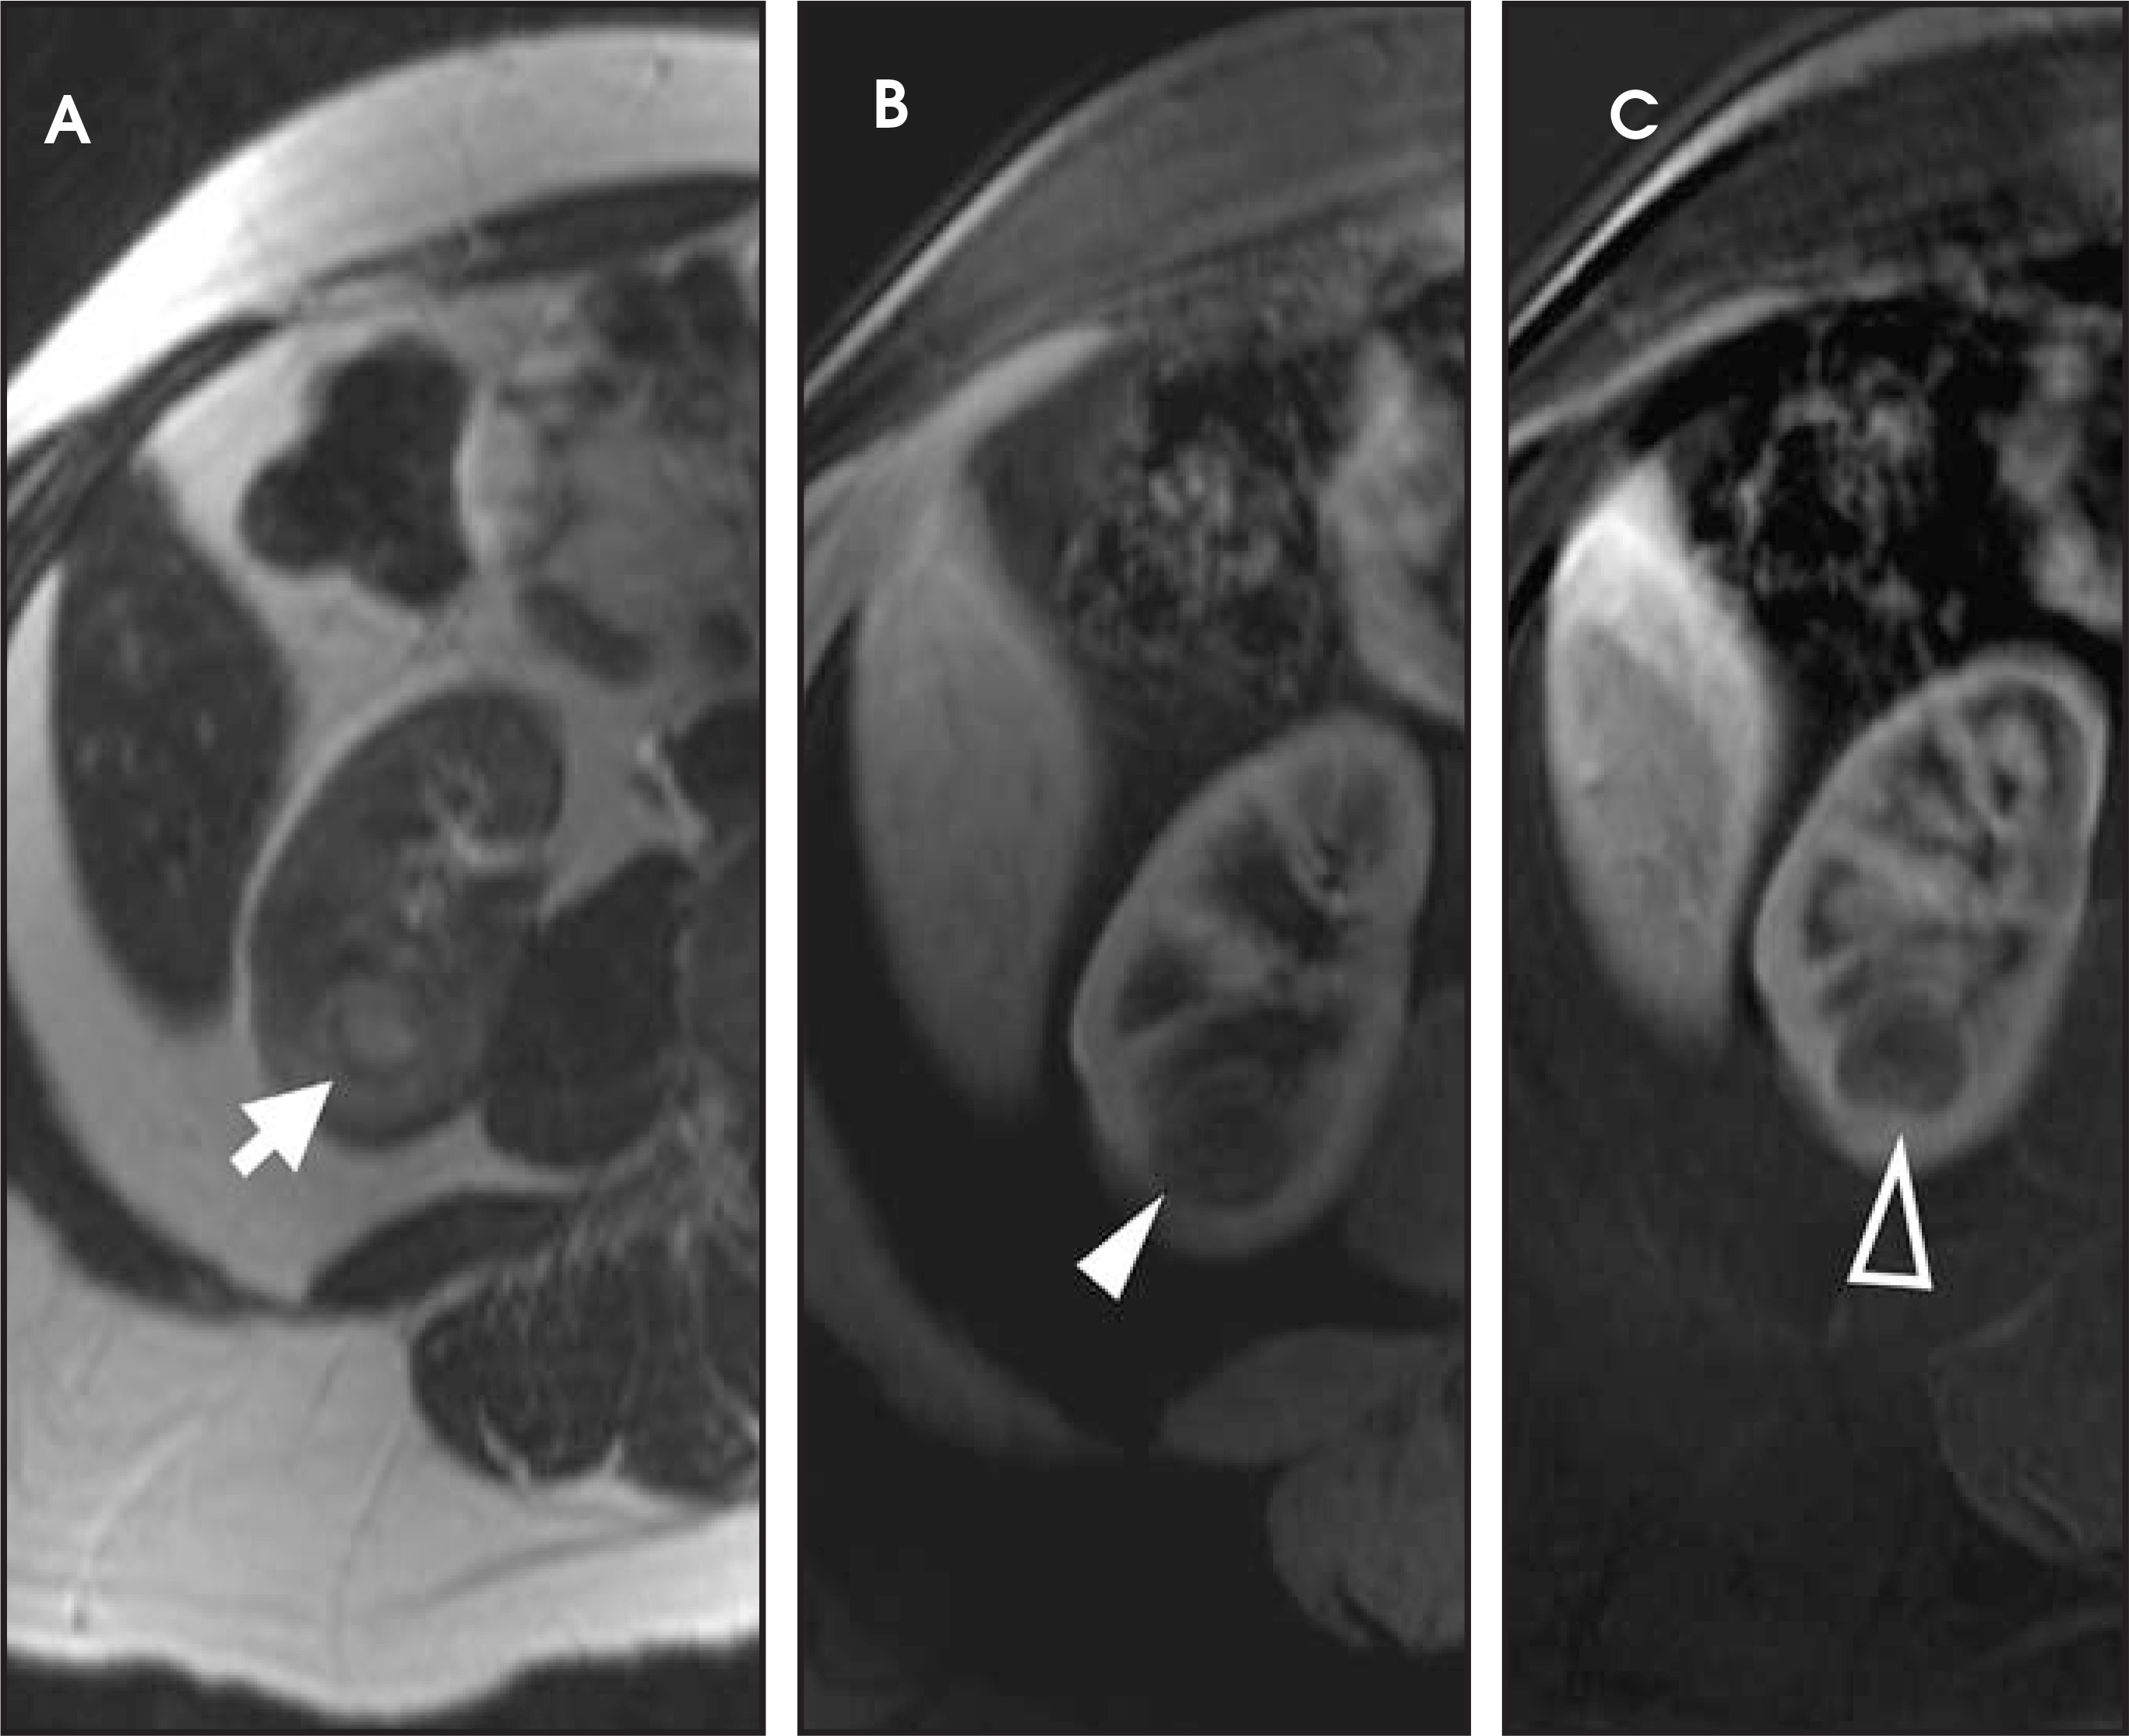
If follow-up imaging is recommended, consider imaging beyond the routine 2-year criteria for benignity because of the potentially long doubling time of RCC. Comparison with prior imaging examinations is helpful in documenting lesion stability. The “water” within benign cysts should be unrestricted and should not appear hyperintense on DWI sequences. Although it is not sufficiently specific to exclude a cystic RCC, DWI is used to help triage cystic lesions with borderline wall or septal thickening to follow-up imaging versus pathologic sampling. A rare benign cystic lesion, the multilocular cystic nephroma (MLCN) presents as a mass lesion with multiple internal cysts. The classic MLCN patient demographic includes either a preteen boy or a middle-aged woman. Multilocular cystic nephroma may herniate into the central renal medulla/renal pelvis, allowing for confident diagnosis (Figure 9). Nevertheless, as with the other cystic lesions, thickened septa or enhancing nodularity in MLCN should triage the patient to pathologic sampling or surgical excision.
Solid renal masses
The differential diagnosis for a solid enhancing renal mass incorporates a wide range of malignant and benign entities. Angiomyolipoma (AML) and oncocytoma represent the most common benign lesions, while RCC, renal metastasis, and transitional cell carcinoma top the list for malignant masses. As its name implies, an AML is composed of vascular, smooth muscle and lipid elements. The benign AML can be seen in isolation or can be associated with tuberous sclerosis, in which case there are often multiple and bilateral renal lesions.
Reflecting the various internal histologic components, marked variability typifies the MR appearance of an AML, including heterogeneous T2 hyperintensity and variable enhancement on dynamic contrast-enhanced sequences. The superior tissue characterization of MRI allows more precise identification of the fat component within an AML than does either CT or US. The classic imaging characterization of AML requires identification of focal areas of lipid. Colloquially, these fatty foci are termed macroscopic fat because they are appreciable to the naked eye and, on imaging, appear similar to the relatively pure fat seen in the subcutaneous tissues or perinephric space.
Sonographically, fat within an AML shows focal hyperechogenicity. On a CT scan, focal areas of fat density (<0 HU) are seen within AMLs. Chemically selective fat-saturation pulses are incorporated into both T1W and T2W sequences for similar detection of macroscopic fat (Figure 3). The great majority of AMLs contain foci of macroscopic fat, which are best detected on T1W images acquired with and without fat saturation and with all other major parameters held constant.
In a smaller subset of AMLs, the intralesional fat is more homogeneously dispersed throughout the tumor. In these lesions, the fat can be detected using a dual-phase gradient-echo T1W sequence with in- and opposed-phase images. The presence of signal loss within the renal lesion on the opposed-phase versus the in-phase acquisition confirms the presence of intravoxel fat (Figure 4). Some authors label this lipid-poor AML, although pathologically intralesional fat is still seen microscopically. A signal loss <40% on opposed-phase GRE suggests the diagnosis of lipid-poor AML. A subset of RCC can also contain intralesional fat; however, the degree of signal loss on opposed-phase images is typically <20%.10 On opposed-phase GRE T1W images, the classic AML macroscopic fat can be identified by a hypointense “india ink” outlining artifact separating the fatty component of the lesion from the surrounding water-containing elements. This occurs due to signal loss in those voxels at the interface of fat and water-based tissues.
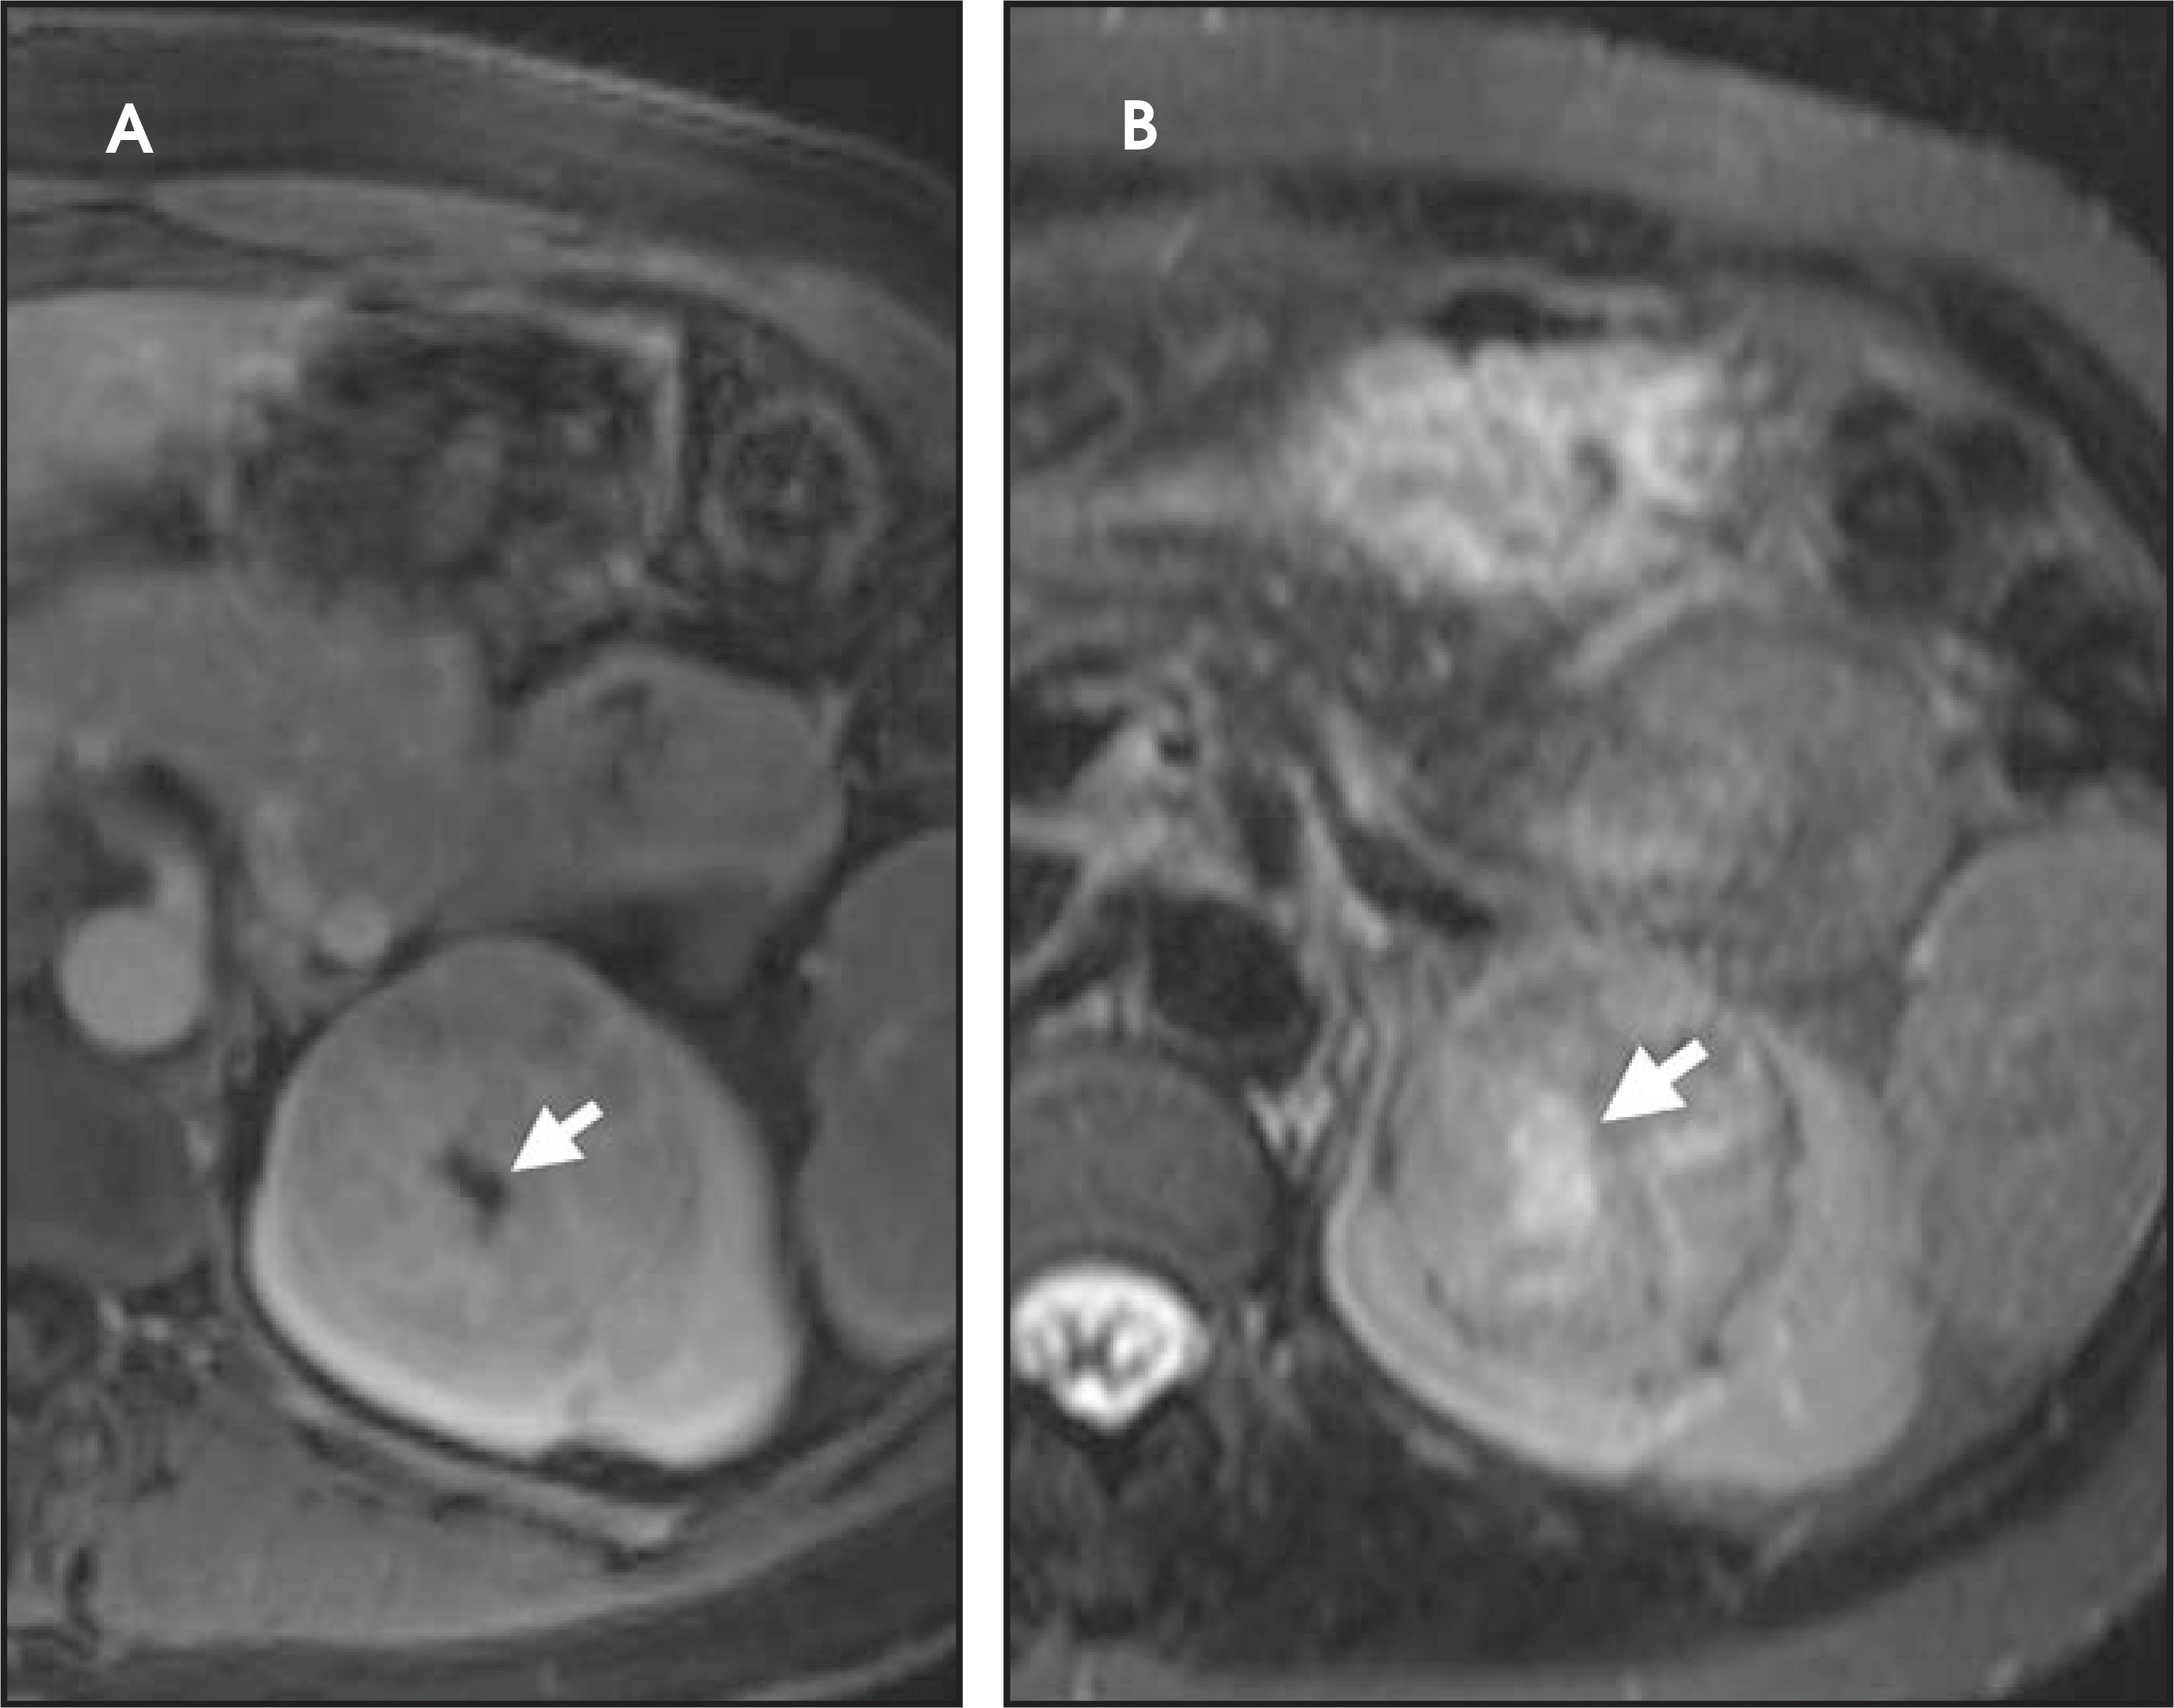
Oncocytoma, the most common benign tumor of the kidney, is an adenoma arising from type B intercalated cells of the cortical collecting duct. On MRI, the oncocytoma is usually a well-circumscribed mass that is T1 hypo- or isotense relative to the renal cortex and exhibits variable T2 heterogeneity. Occasionally present in larger lesions (>5 cm), a T1 hypointense, T2 hyperintense, and hypoenhancing central scar can suggest the diagnosis (Figure 10). In smaller lesions, a homogeneous persistent enhancement pattern can suggest the diagnosis, but is not definitive. The classic angiographic “spoke-wheel” pattern of oncocytoma vessels is rarely seen on MRI. In comparison with AML, no definitive MRI findings can differentiate oncocytoma from RCC. For many years, the identification of a solid renal mass without visible macroscopic fat triaged the patient to surgical resection. Previously, pathologic analysis could not distinguish a benign oncocytoma from a chromophobe subtype of RCC since oncocytic cells are seen in both lesions. In a large retrospective review, 13% of resected solid renal masses were found to be benign, and this increased to >25% for lesions smaller than 3 cm.11 Immunohistochemical and cytogenetic analyses have now improved to allow for differentiation between these benign and malignant entities.12,13 With the rise in detection of smaller incidental lesions, percutaneous biopsy with pathologic analysis can play a significant role in avoiding unnecessary partial or complete nephrectomy for benign lesions.14 In an increasing number of institutions, when a lesion remains indeterminate following renal protocol MRI or CT, a percutaneous biopsy is now the standard of care. Renal mass biopsy should particularly be considered for small (<2 cm) lesions with persistent uniform enhancement and in patients who are poor candidates for surgical resection.
Renal cell carcinomas comprise the majority (approximately 80%) of primary renal neoplasms and 2% of all malignant tumors.15 Renal cell carcinoma arises from the tubular epithelium of the kidney and can be divided into several histologic subtypes: clear cell RCC (most common, ~75%), papillary (~15%), chromophobic, oncocytic, and collecting duct. Identification of the sub-type does not have reliable prognostic significance,16 but does account for the variable imaging appearance of RCC. In general, the solid varieties of RCC lesions are well-circumscribed, cortically based, heterogeneously T2 hyperintense, and isointense on noncontrast T1W sequences, and exhibit avid arterial-phase enhancement.
In some cases, the histologic subtype can be suggested by specific imaging features. For example, cystic change is more closely associated with the papillary subtype (Figures 6 through 9). Clear cell RCC are usually solid masses and may show mild signal loss on opposed-phase gradient imaging, consistent with a component of intravoxel fat. Occasionally, a solid RCC will not show typical arterial enhancement, and subtraction images can be helpful in identifying subtle tumoral enhancement (Figure 11). The Bosniak criteria apply only to lesions that are predominantly cystic. As with cystic lesions, findings of restricted diffusion within a solid renal lesion on DWI sequences is suggestive of malignancy. Nevertheless, this application is not sufficiently sensitive to confidently categorize a lesion as benign in the absence of DWI restriction. Once RCC is suspected, an assessment of renal vein invasion and local lymphadenopathy will impact the tumor TMN stage. Occasionally, RCC may arise closer to the medulla of the kidney and can be confused with transitional cell carcinoma (TCC). Calyceal, renal pelvis, or ureteral distortion, thickening, or enhancement is more frequently seen with TCC. Clinically, TCC presents with hematuria more often than does RCC. Angiomyolipoma, oncocytoma, and RCC are not the only solid renal lesions encountered by radiologic imaging. More rare entities include fibroma, leiomyoma, extramedullary hemato poiesis, hemangioma, and juxtaglomerular cell tumors; however, there are no definitive imaging features of these entities that would obviate pathologic diagnosis. Additionally, the kidneys are a relatively common site for metastases from numerous cancers. An isolated renal metastasis is rare; additional extrarenal deposits are usually present, making metastatic disease less of a diagnostic dilemma.
Conclusion
Quality high-field MR image acquisition, including fat-saturation sequences and dynamic IV contrast enhancement, is the key prerequisite for MRI evaluation of the indeterminate renal mass. Classifying a renal lesion as cystic or solid represents the first step in the decision tree. As with CT analysis, the Bosniak criteria can be applied to MRI of cystic lesions. This system can help classify the indeterminate lesion as a benign simple or hemorrhagic cyst, likely complex cyst requiring follow-up imaging, or possible cystic RCC that would need biopsy or excision. In the absence of a known extrarenal primary malignancy or intra-tumoral macroscopic fat, RCC should be the diagnosis of exclusion for most indeterminate solid renal masses. Percutaneous biopsy is gaining favor for indeterminate renal lesions with imaging characteristics that suggest a possible benign etiology.
References
- Marumo K, Horiguchi Y, Nakagawa K. Incidence and growth pattern of simple cysts of the kidney in patients with asymptomatic microscopic hematuria. Int J Urol. 2003;10(2):63-67.
- Vasudevan A, Davies R, Shannon B, Cohen R. Incidental renal tumours: The frequency of benign lesions and the role of preoperative core biopsy. BJU Int BJU Int.
- Pantuck A, Zisman A, Belldegrun A. The changing natural history of renal cell carcinoma. J Urol Cancer.
- Israel G, Francis I, Baumgarten D. Expert Panel on Urologic Imaging. Indeterminate renal mass. 2008.
- Israel G, Bosniak M. How I do it: Evaluating renal masses. Radiology. 2005;236:441-450.
- Israel G, Hindman N, Bosniak M. Evaluation of cystic renal masses: Comparison of CT and MR imaging by using the Bosniak classification system. Radiology J Urol.
- Plathow C, Ley S, Zaporozhan J. Assessment of reproducibility and stability of different breath-hold maneuvres by dynamic MRI: Comparison between healthy adults and patients with pulmonary hypertension. Eur Radiol. 2006;16:173-179.
- Colagrande S, Carbone S, Carusi L. Magnetic resonance diffusion-weighted imaging: Extraneurological applications. Radiol Med (Torino). 2006;111:392-419.
- Charles-Edwards E, deSouza N. Diffusion-weighted magnetic resonance imaging and its application to cancer. Cancer Imaging. 2006;6:135-143.
- Kim J, Kim S, Jang Y. Renal angiomyolipoma with minimal fat: Differentiation from other neoplasms at double-echo chemical shift FLASH MR imaging. Radiology. 2006;239:174-180.
- Frank I, Blute M, Cheville J. Solid renal tumors: An analysis of pathological features related to tumor size. J Urol J Urol(6 Pt 1).
- Liu J, Fanning C. Can renal oncocytomas be distinguished from renal cell carcinoma on fine-needle aspiration specimens? A study of conventional smears in conjunctionwith ancillary studies. Cancer. 2001;93:390-397.
- Pan C, Chen P, Ho D. The diagnostic utility of MOC31, BerEP4, RCC marker and CD10 in the classification of renal cell carcinoma and renal oncocytoma: An immunohistochemical analysis of 328 cases. Histopathology. 2004;45:452-459.
- Silverman S, Gan Y, Mortele K. Renal masses in the adult patient: The role of percutaneous biopsy. Radiology. 2006;240:6-22.
- Motzer R, Bander N, Nanus D. Renal-cell carcinoma. N Engl J Med N Engl J Med.
- Patard J, Leray E, Rioux-Leclercq N. Prognostic value of histologic subtypes in renal cell carcinoma: A multicenter experience. J Clin Oncol. 2005;23:2763-2771.
Citation
. MR imaging of indeterminate renal lesions. Applied Radiology. 2008;37(11):19-32. doi:10.37549/AR1658.