MR imaging of the painful knee: Correlation with conventional radiography

Applied Radiology — Vol. 32 , Issue 5 , pp. 35 -41

DOI: 10.37549/AR1182

Published: May 1, 2003

Justin Q. Ly, MD, Douglas P. Beall, MD

Categories

article Article ar

Significant advances in magnetic resonance (MR) imaging have taken place over the past decade, particularly in the areas of scanner construction, imaging software, and surface-coil technology that have made MR imaging the study of choice for the noninvasive imaging evaluation of multiple anatomic sites. Today, subtle fractures, which are often missed or absent radiographically, can be detected accurately and easily with the aid of MR imaging.1 MR imaging, with its excellent soft-tissue contrast and ability to demonstrate marrow abnormalities, has now surpassed single-slice computed tomography (CT) in its ability to simultaneously delineate both osseous and soft-tissue injuries.2 In the evaluation of cartilage, MR imaging has replaced CT arthrography, conventional arthrography, and sonography.3,4 In addition to its role in evaluating traumatic processes, MR imaging can also demonstrate nontraumatic abnormalities such as osteomyelitis, tumors, avascular necrosis, and arthritis. One disadvantage of having such a superior diagnostic modality readily available is that many clinicians now falsely regard conventional radiography as unnecessary, sometimes bypassing this modality in favor of MR imaging. In reality, correlation of radiographic findings with MR imaging provides many answers in a multitude of clinical scenarios. Moreover, in situations in which radiographic findings are absent or nonspecific, MR imaging is useful in establishing the diagnosis.

This article will present a variety of knee cases that illustrate the utility of MR imaging in providing information when the radiographic evaluation is not helpful or when it provides complimentary findings to the MR appearance of an abnormality.

Advertisement

Materials and methods

The images were chosen from a digital archive of more than 150 MR examinations of the knee.

All MR imaging examinations were performed on 1.5 T MR units from GE Medical Systems (one 1.5T Signa MR/i Echospeed-plus unit and one 1.5T Signa MRI) with a dedicated knee coil (all products from GE Medical Systems, Milwaukee, WI). The following parameters were utilized as the knee imaging protocol: sagittal double-echo spin-echo T2-weighted sequence with 16-cm field-of-view (FOV); repetition time (TR) 2175 ms; echo time (TE) 20/90 ms; number of excitations 1; slice thickness/gap 4/1 mm; matrix 256 × 192; axial and coronal oblique fast-spin-echo (FSE) T2-weighted sequences with FOVs of 14 cm and 16 cm, respectively; TR 3000 ms; TE 70 ms; number of excitations 2; echo train length 4; slice thickness/gap 4/1 mm; matrix 320 × 224; coronal spin-echo T1-weighted sequence with FOV of 16 cm; TR 600 ms; TE 12 ms; number of excitations 2; slice thickness/gap 4/1 mm; matrix 512 × 256; coronal cross-hatched gradient-recalled echo (GRE) sequence with FOV of 16 cm; TR 600 ms; TE 15 ms; flip angle 25°; number of excitations 2; slice thickness/gap 4/0 mm; matrix 256 × 192. A frequency-selective fat saturation pulse was used on all sequences (except the T1 and the cross-hatched GRE sequences) to reduce the high signal from surrounding fat. To reduce artifacts, oversampling in the phase-and frequency-encoding axes was performed.

Advertisement

Radiographic–MR imaging correlation

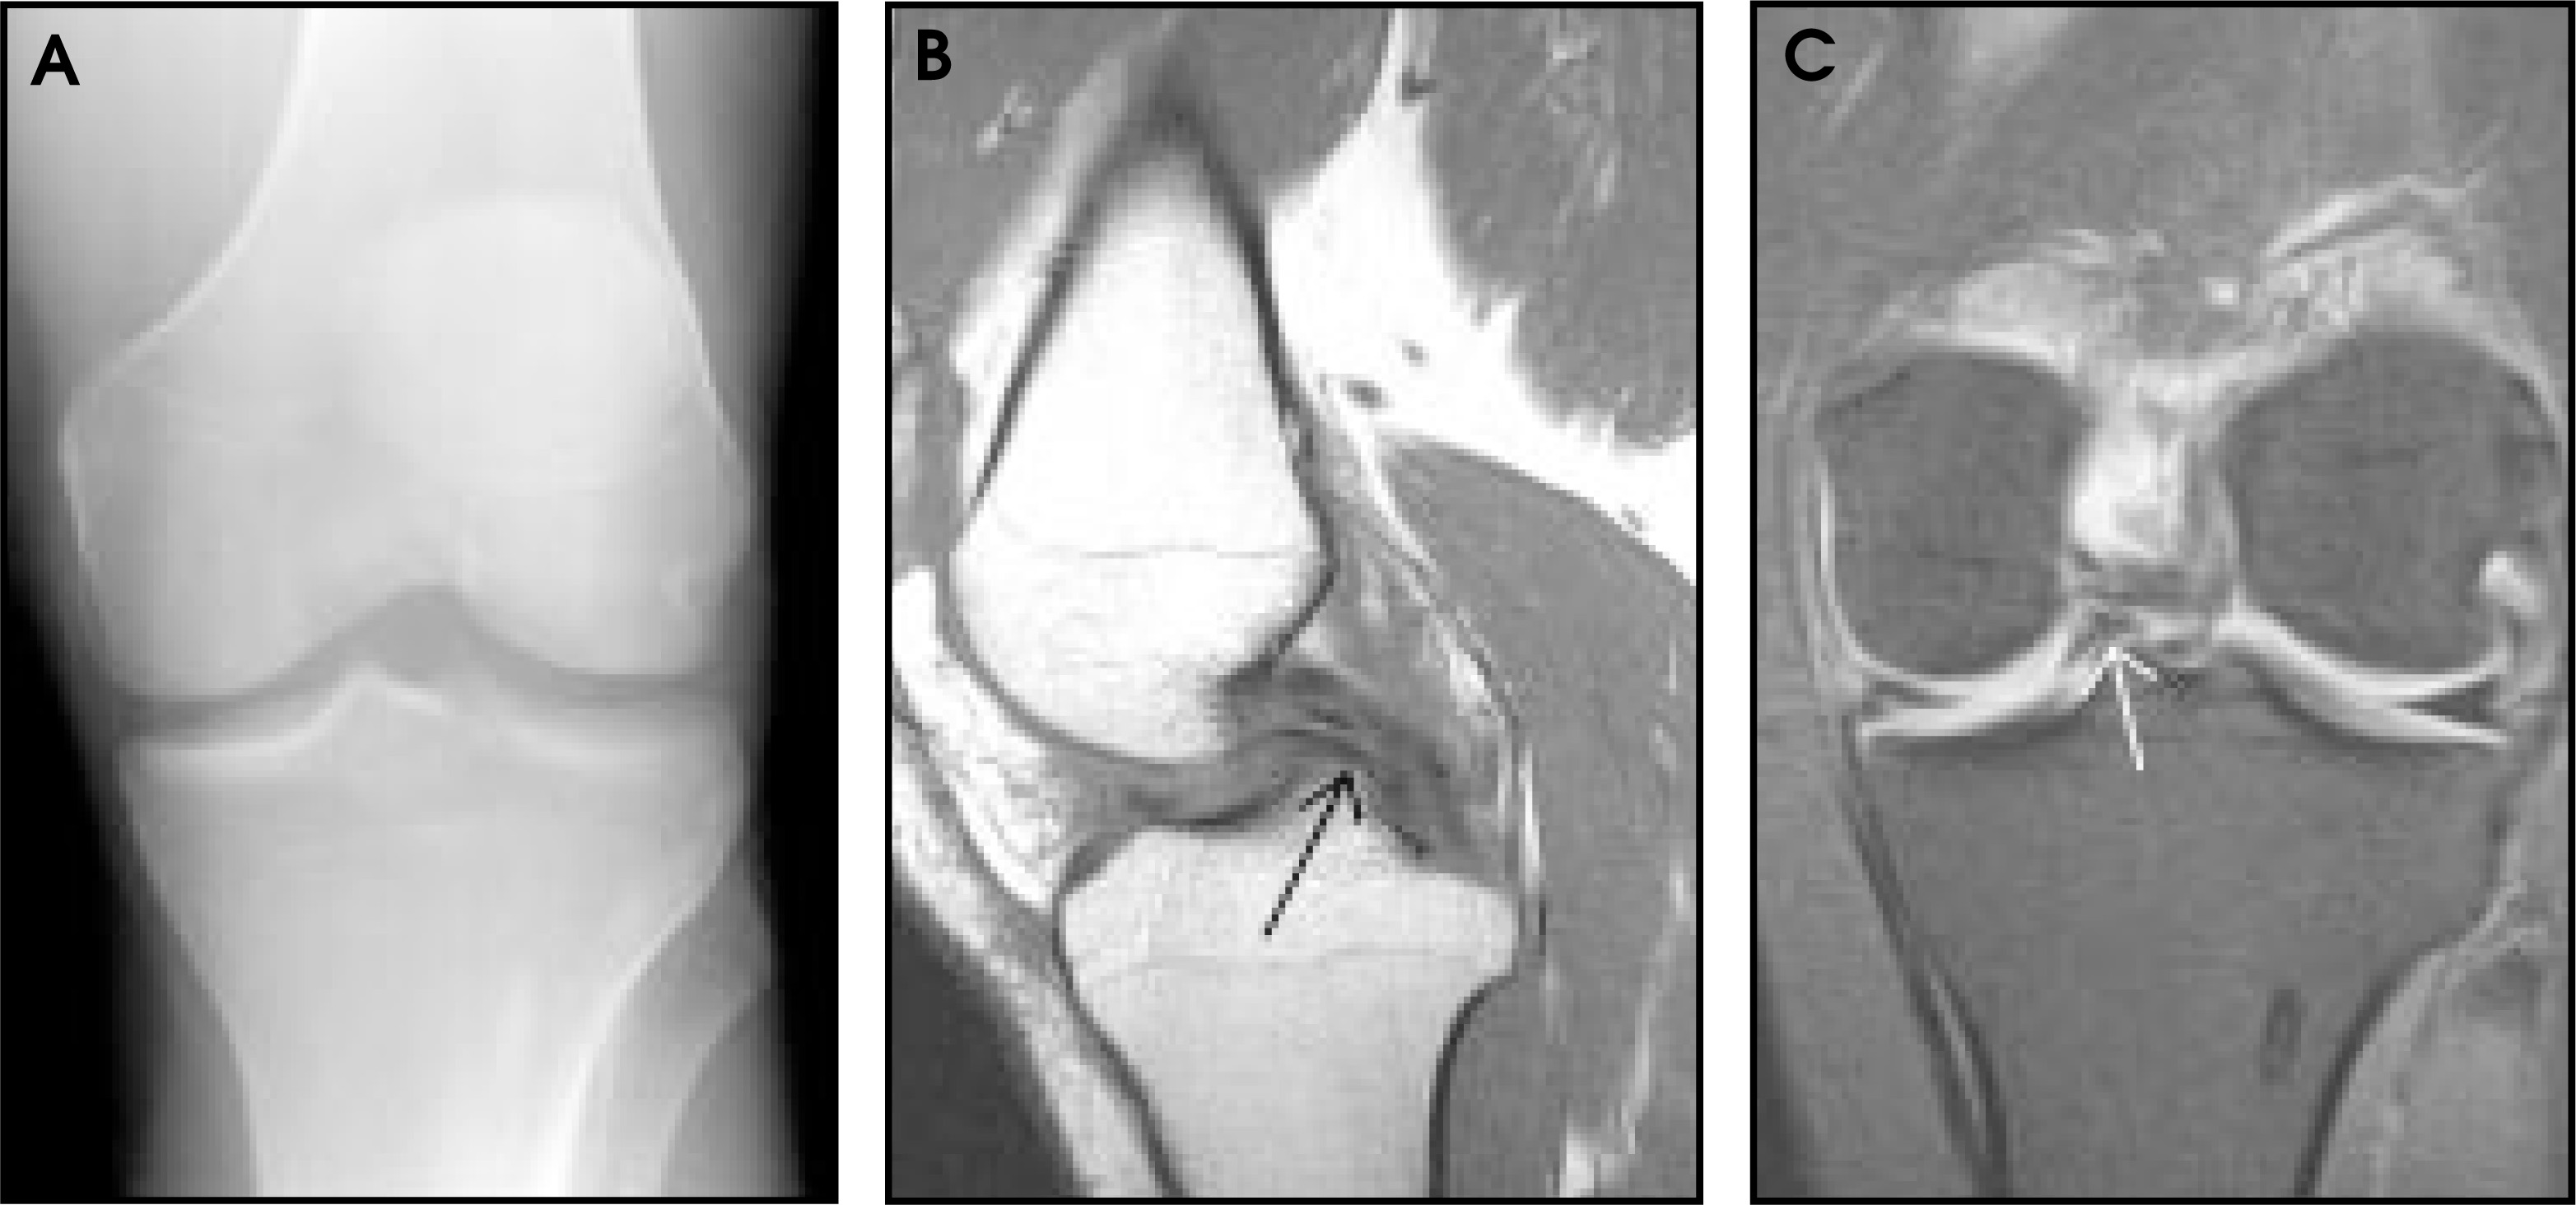
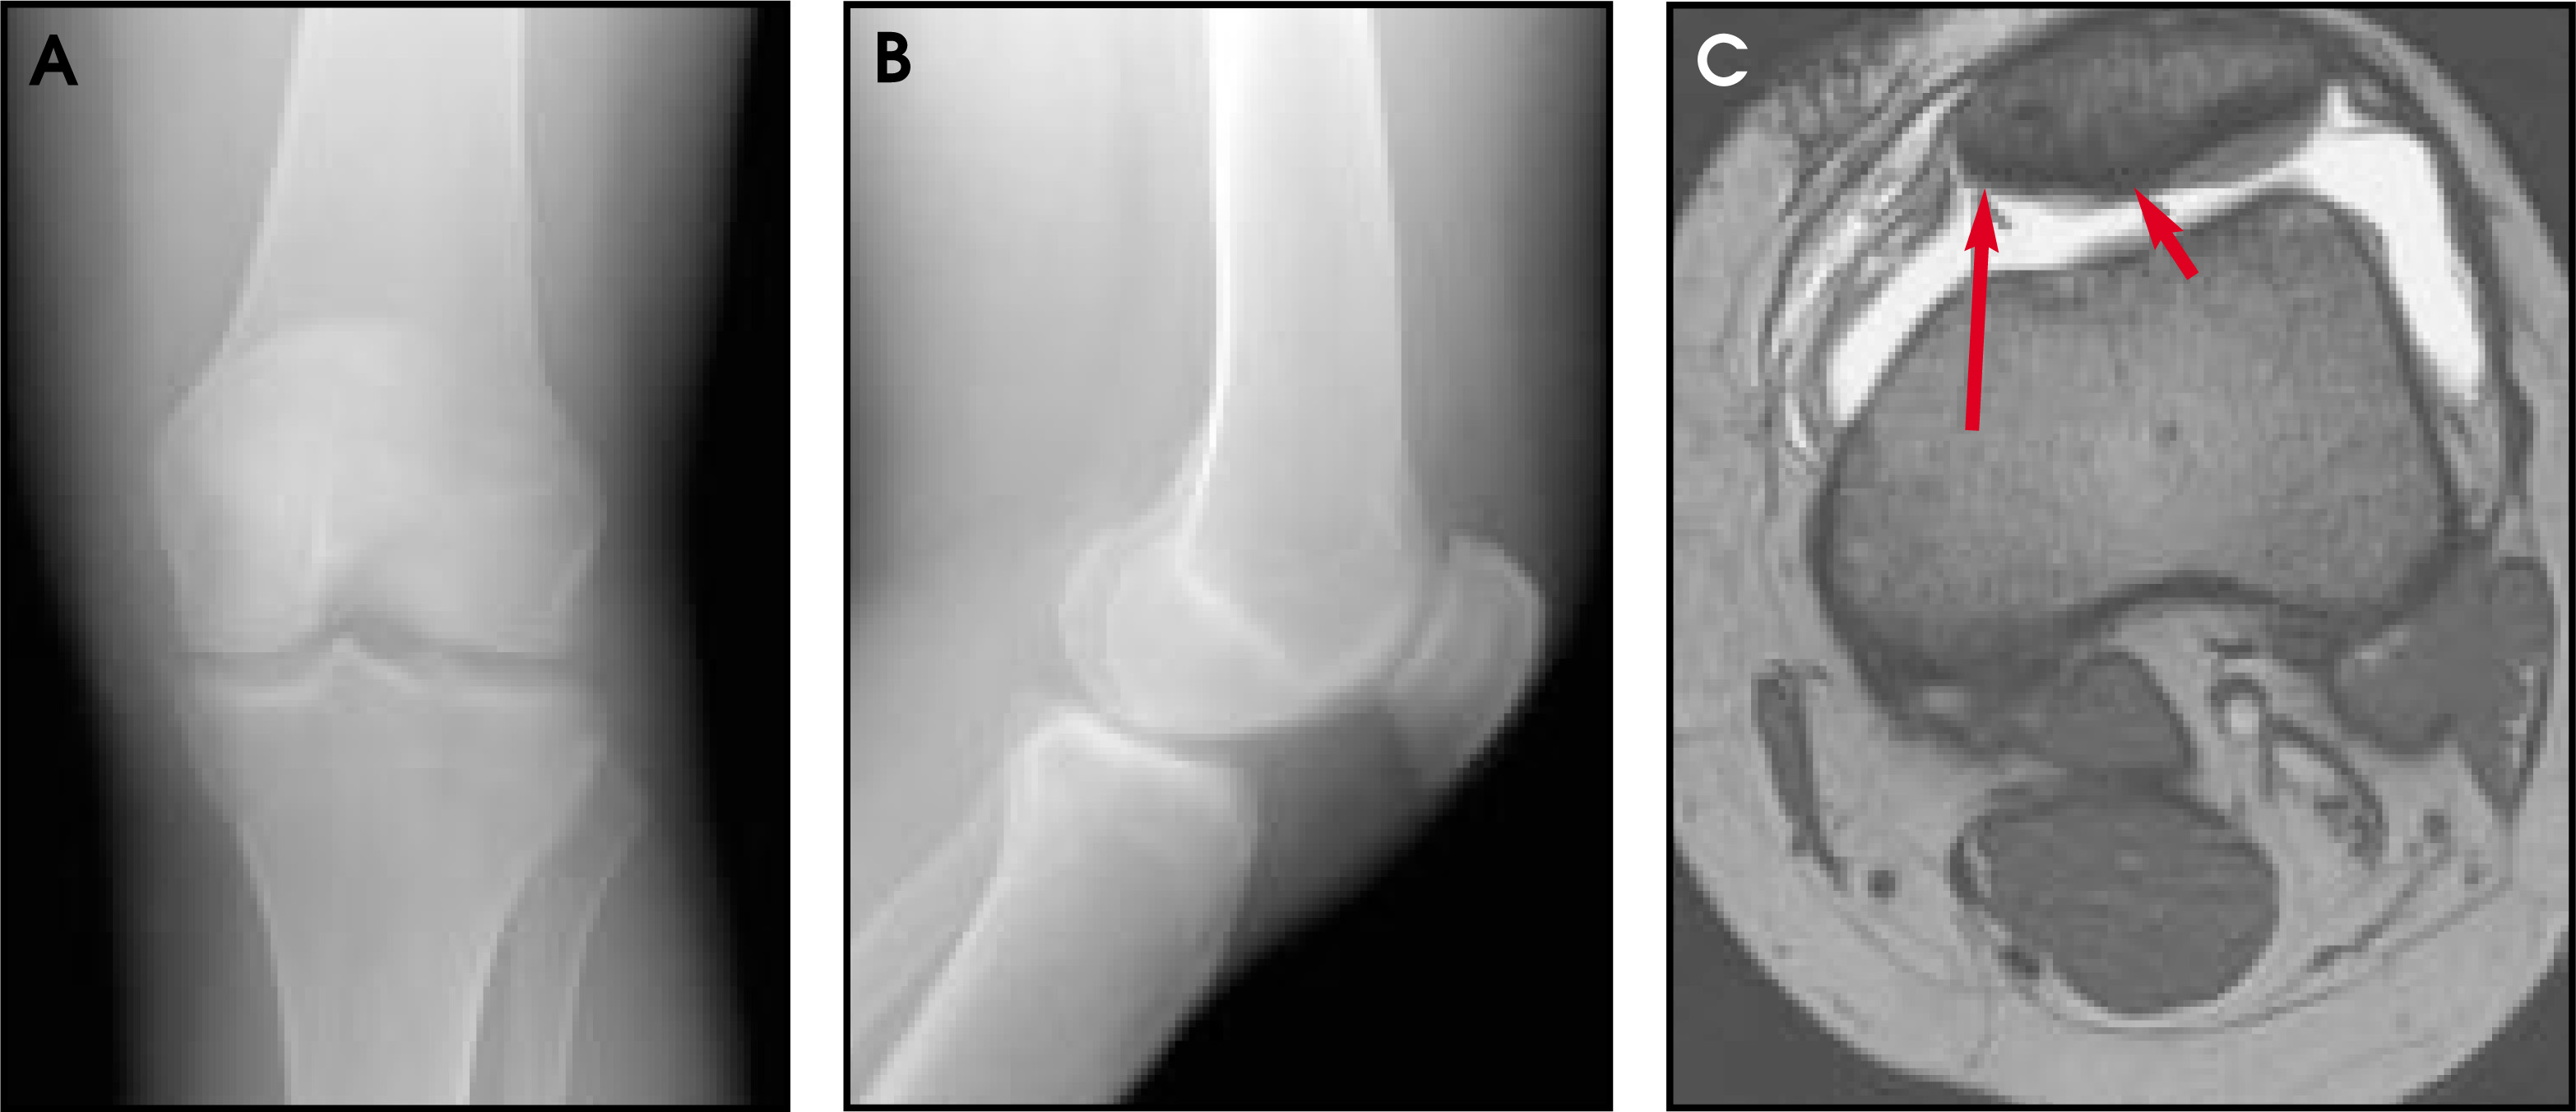
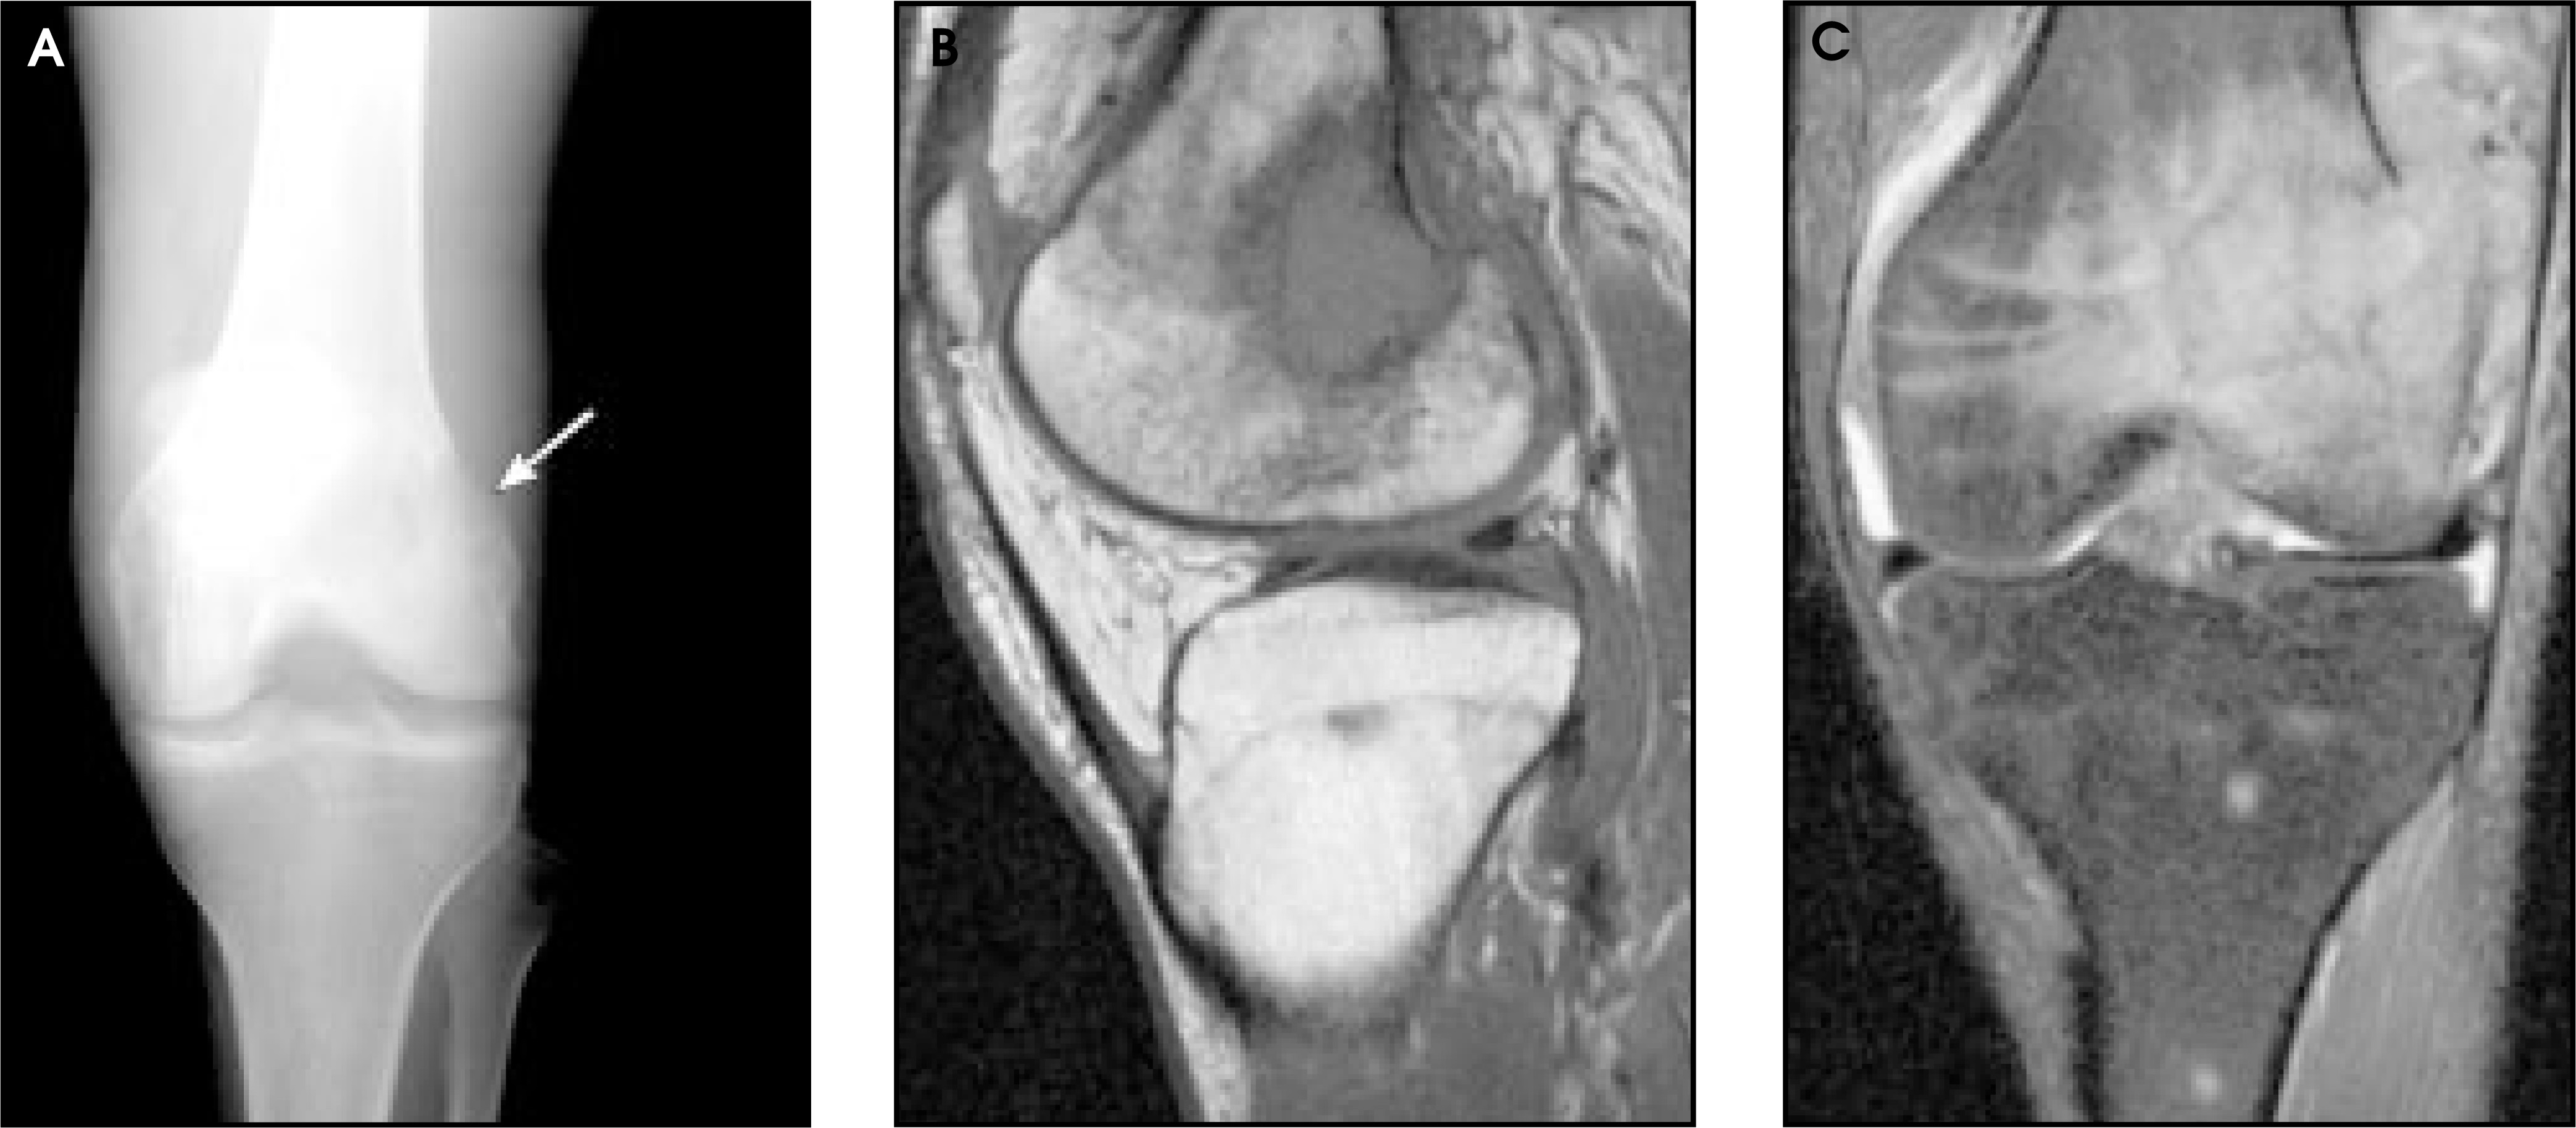
MR imaging can be useful in detecting abnormalities that are radiographically absent even with an optimal radiographic evaluation. An example of this can be seen in early avascular necrosis. Avascular necrosis commonly occurs at the hips due to a variety of factors that give rise to hypercoaguable states or to vessel fragility; but it can also occur around the knee, particularly in patients on steroid therapy for inflammatory disease (ie, systemic lupus erythematosus). Although early avascular necrosis is oftentimes not apparent with radiography, MR imaging may show marrow edema (Figure 1). Another radiographically occult phenomenon, especially in its early stages, is the stress fracture. Early detection of stress fractures can be difficult with radiography. MR imaging, however, can allow visualization of a stress fracture, which is seen as a linear or jagged hypointense area on T1-weighted imaging (T1WI). The linear hypointensity is also seen on T2-weighted images (T2WI) and is characteristically surrounded by marrow edema. This is known as the “stress response.”5 The usual stress fracture is short and horizontal to the long axis of the involved bone (Figure 2).6 Other pathologic processes that can be radiographically inconspicuous or absent include small osteochondral lesions (Figure 3), various types of sports-induced injuries (Figure 4), and chondromalacia of the patella (Figure 5).
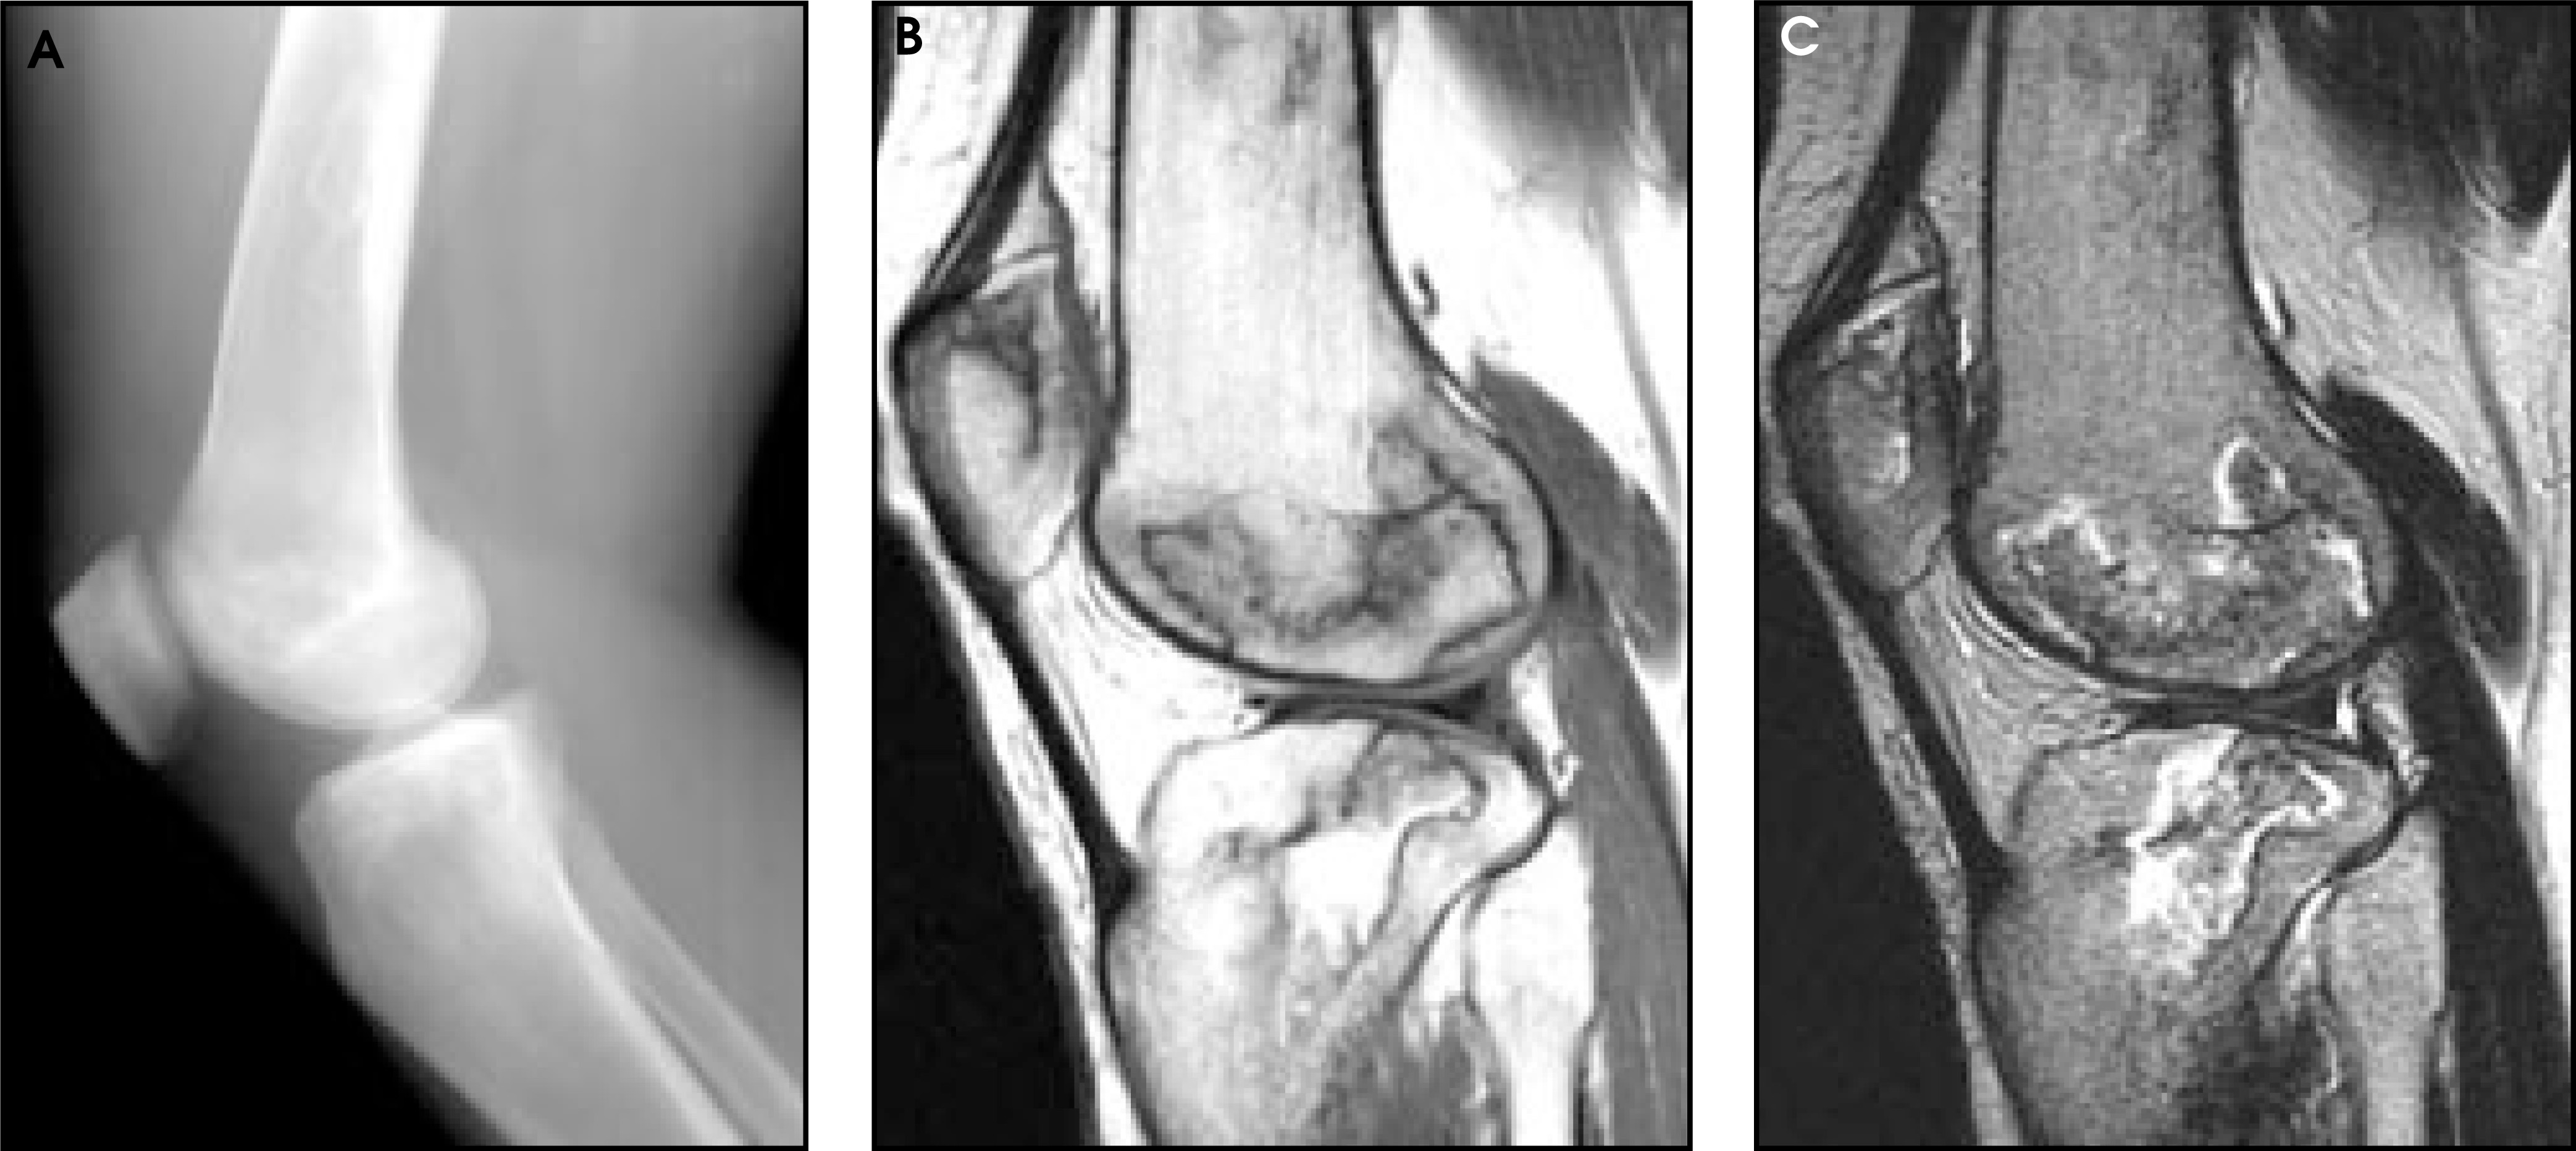
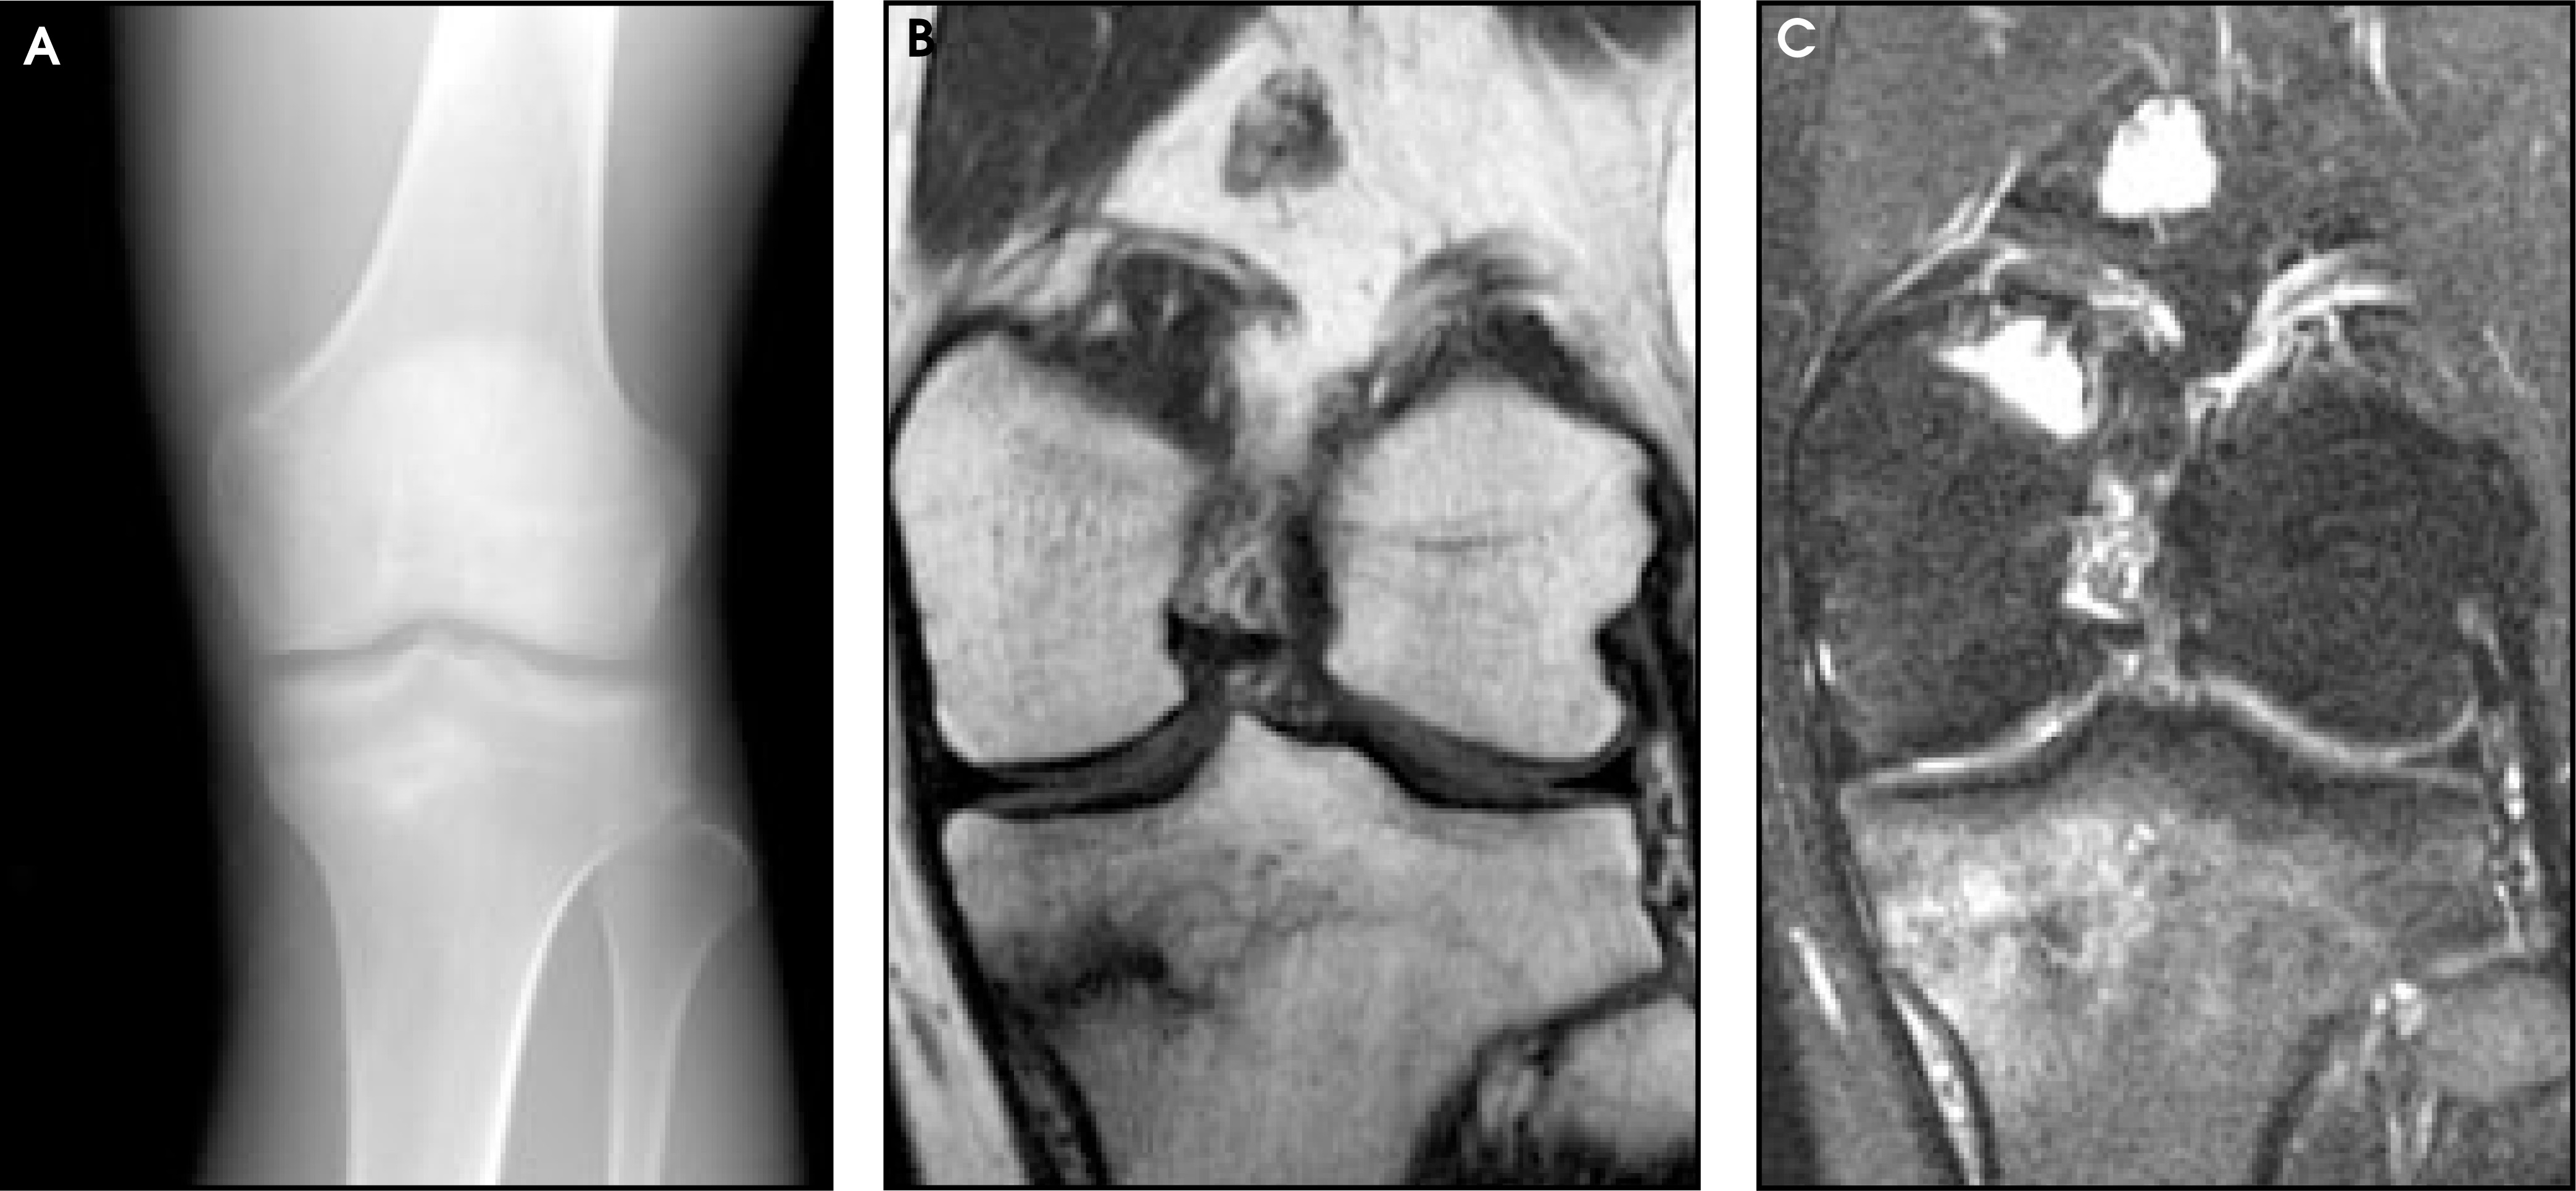
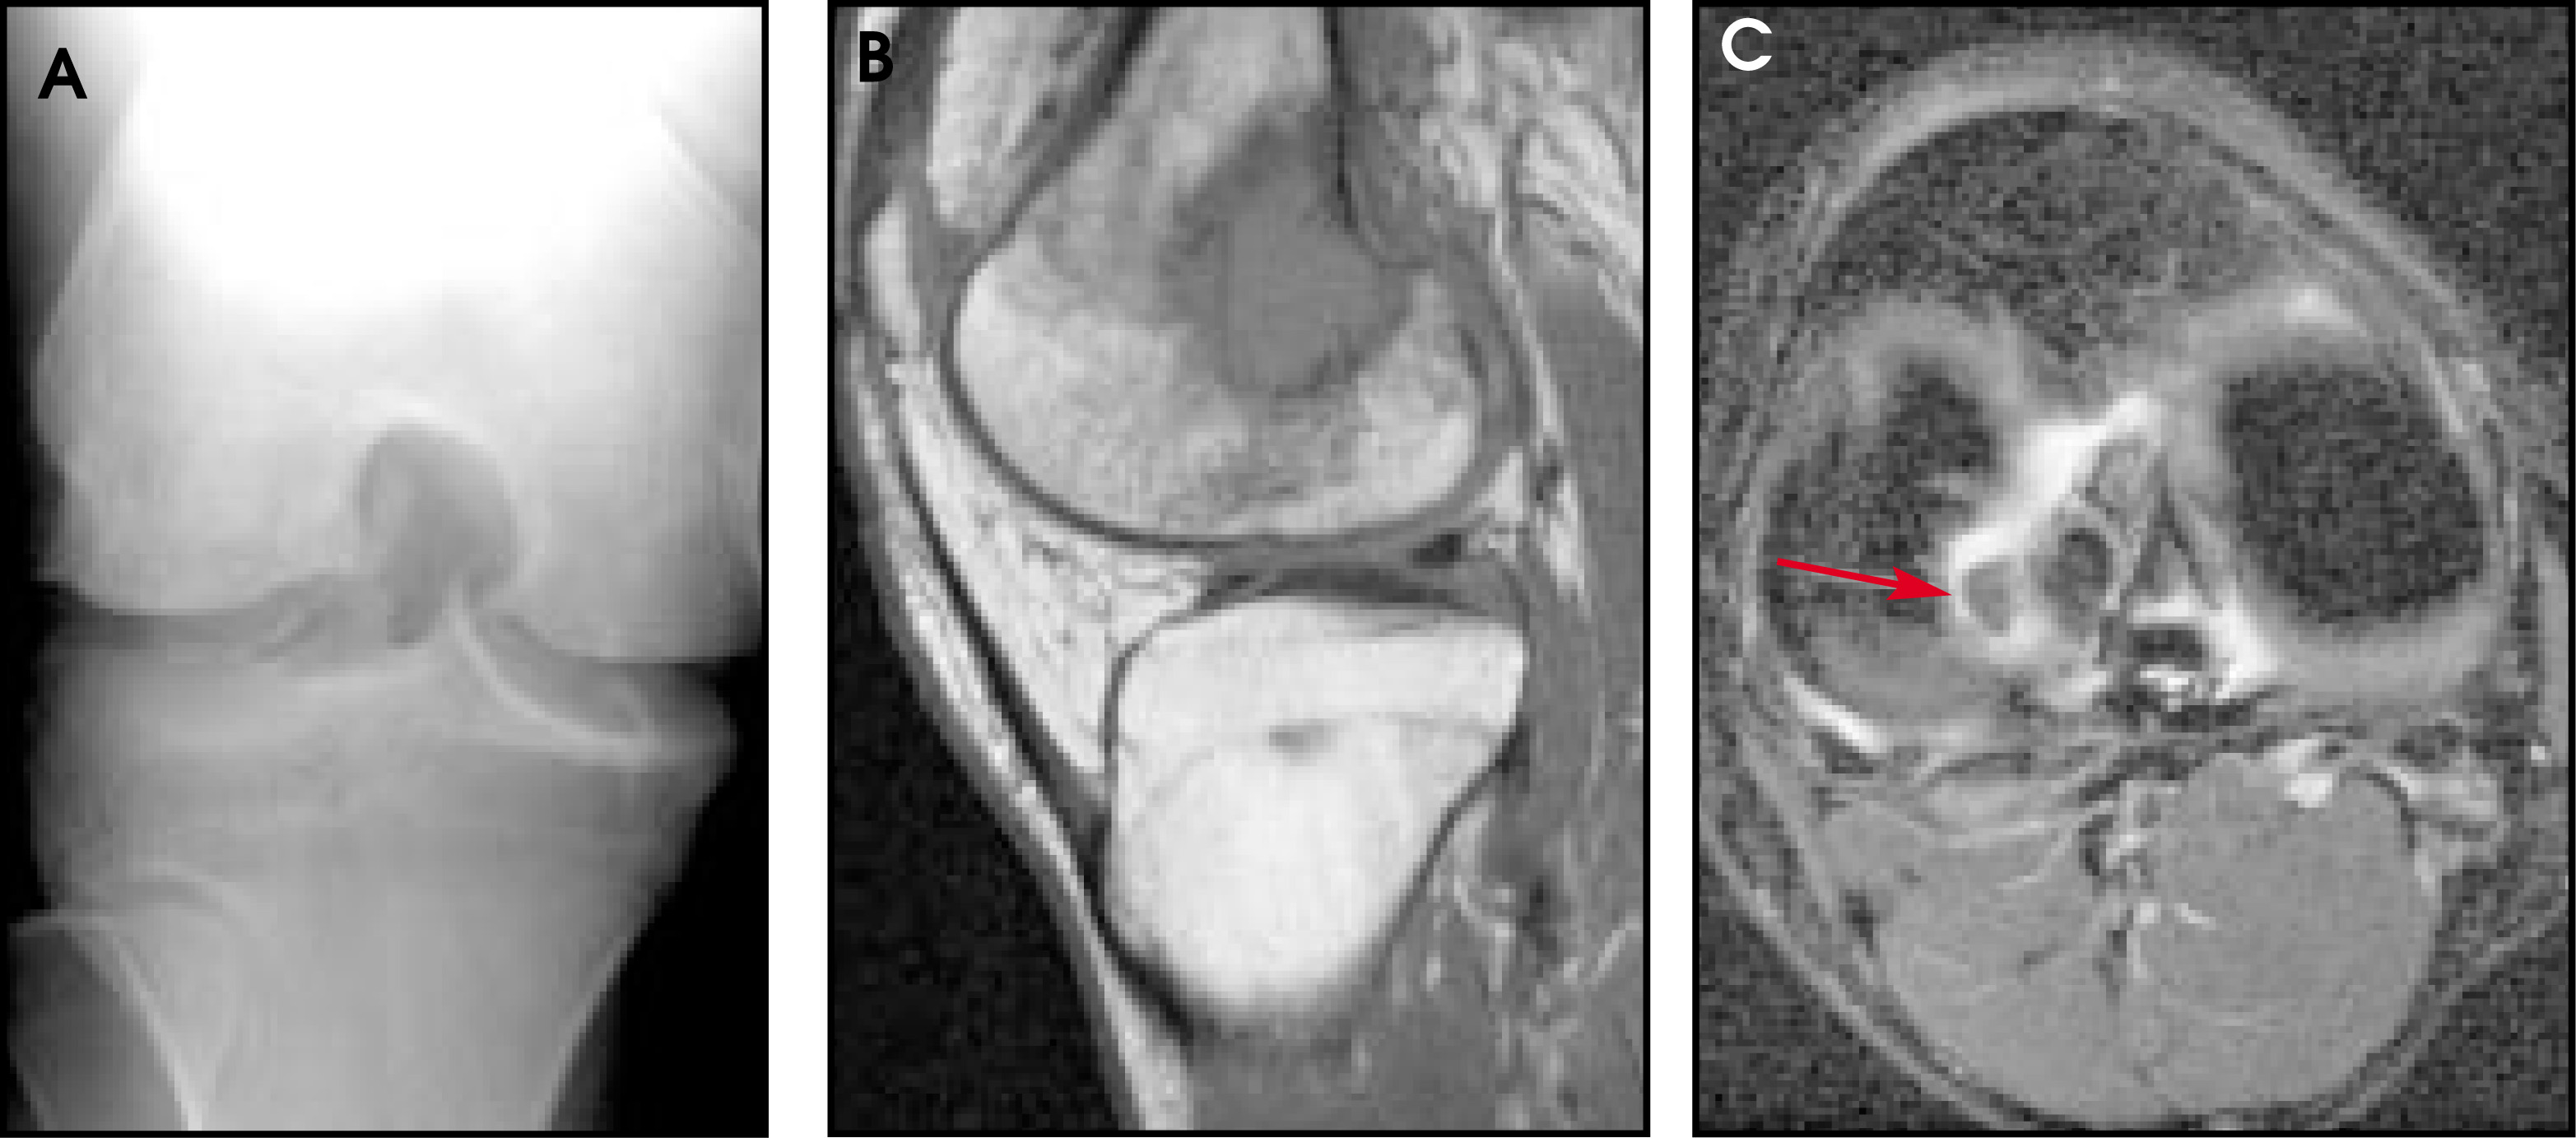
FIGURE 1.
FIGURE 1. Avascular necrosis of the distal femur. (A) Lateral radiograph shows a subtle, ill-defined mixed lytic, sclerotic process involving the femoral condyles and the proximal tibia. The margins of this process are sclerotic and serpiginous. (B) At both the distal femur and proximal tibia, sagittal T1-weighted MR image shows a thin, serpiginous dark line with surrounding ill-defined hypointense areas representing edematous marrow. (C) Sagittal T2-weighted MR image shows serpiginous collections of marrow edema surrounding regions of bone that are hypointense to the normal marrow. These darker areas probably represent the fibrosis and trabecular collapse that is frequently seen in necrotic regions of bone.
FIGURE 2.
FIGURE 2. Stress fracture. (A) Anteroposterior radiograph of the left knee in an athlete complaining of knee pain shows sclerotic irregularity at the medial metaphysis of the proximal tibia. (B) Coronal T1-weighted MR image shows a horizontally oriented irregular hypointensity at the medial tibia. (C) Coronal fat-suppressed T2-weighted MR image confirms the suspected stress fracture, which is seen on this image as a lowintensity fracture line surrounded by regions of higher signal intensity representing marrow edema.
FIGURE 3.
FIGURE 3. Osteochondral fracture/synovial chondromatosis. (A) Anteroposterior knee radiograph shows multiple ossified bodies overlying the lateral femorotibial joint space and intercondylar notch. (B) Coronal T1-weighted (TW1) MR image shows an osteochondral defect (arrow) at the medial aspect of the lateral femoral condyle. No loose bodies are seen. (C) Axial fat-suppressed TW1 MR image shows fluid surrounding the fragment (arrow) as well as multiple ossified intra-articular bodies.
FIGURE 4.
FIGURE 4. Medial meniscus tear. (A) Anteroposterior radiograph is unremarkable. (B) Sagittal T1-weighted MR image demonstrates a double posterior cruciate ligament sign (arrow), which represents a bucket handle tear of the medial meniscus that has flipped into the intercondylar notch. (C) Coronal fat-suppressed T2-weighted MR image shows a hypointense fragment (arrow) within the intercondylar notch and a torn medial meniscus that contains focal high signal that surfaces inferiorly. These findings are consistent with a bucket handle tear of the medial meniscus.
FIGURE 5.
FIGURE 5. Chondromalacia patella. (A) Anteroposterior radiograph is unremarkable. (B) Lateral radiograph reveals mild loss of patellofemoral joint space, which is suggestive of patellofemoral chondromalacia. (C) Axial gradientrecalled echo image of the knee shows thinning of the patellar cartilage at the medial facet (long arrow) and along the median ridge (short arrow), consistent with chondromalacia of the patella.

MR imaging, with its excellent soft-tissue contrast, is particularly useful in defining soft-tissue abnormalities and pathology, as they often have a nonspecific radiographic appearance (Figures 6 and 7). Figure 8 presents an a case in which a chondroid lesion detected radio-graphically is shown more clearly on MR imaging to have nonaggressive characteristics, favoring a benign chondroid tumor. Differentiating between enchondromas and chondrosarcomas is paramount, as these two entities have different prognoses and potentially different treatment strategies.7 A case of hemophilic arthropathy is another example in which MR imaging can complement the information provided by radiography. In this entity, MR findings of irregular foci of very low signal intensity are due to hemosiderin deposits that help to distinguish degenerative changes secondary to hemophilic arthropathy from other erosive arthritides (Figure 9).
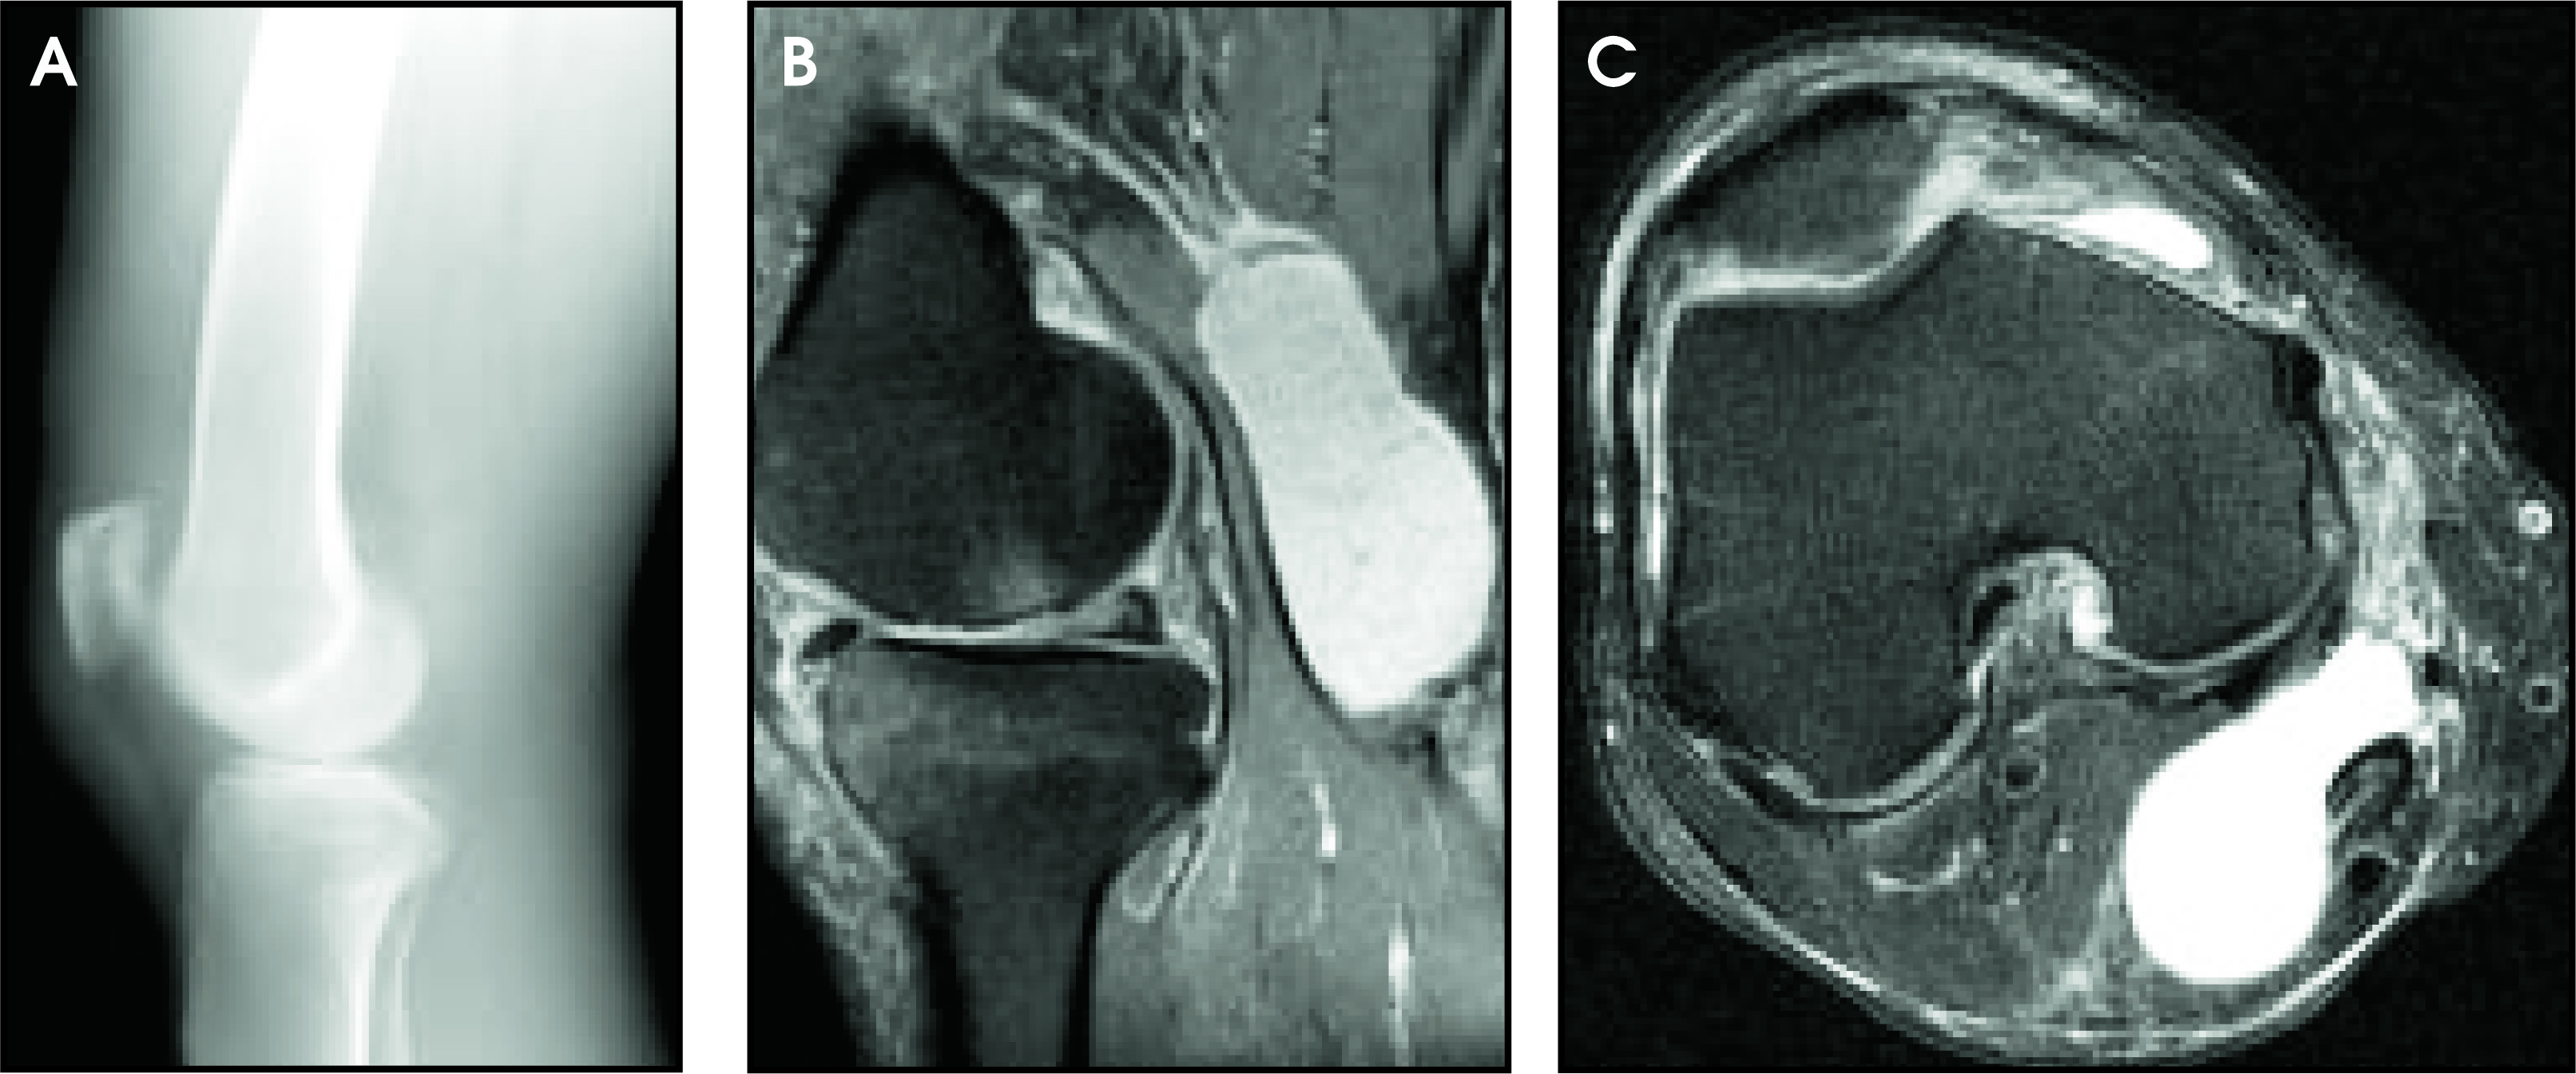
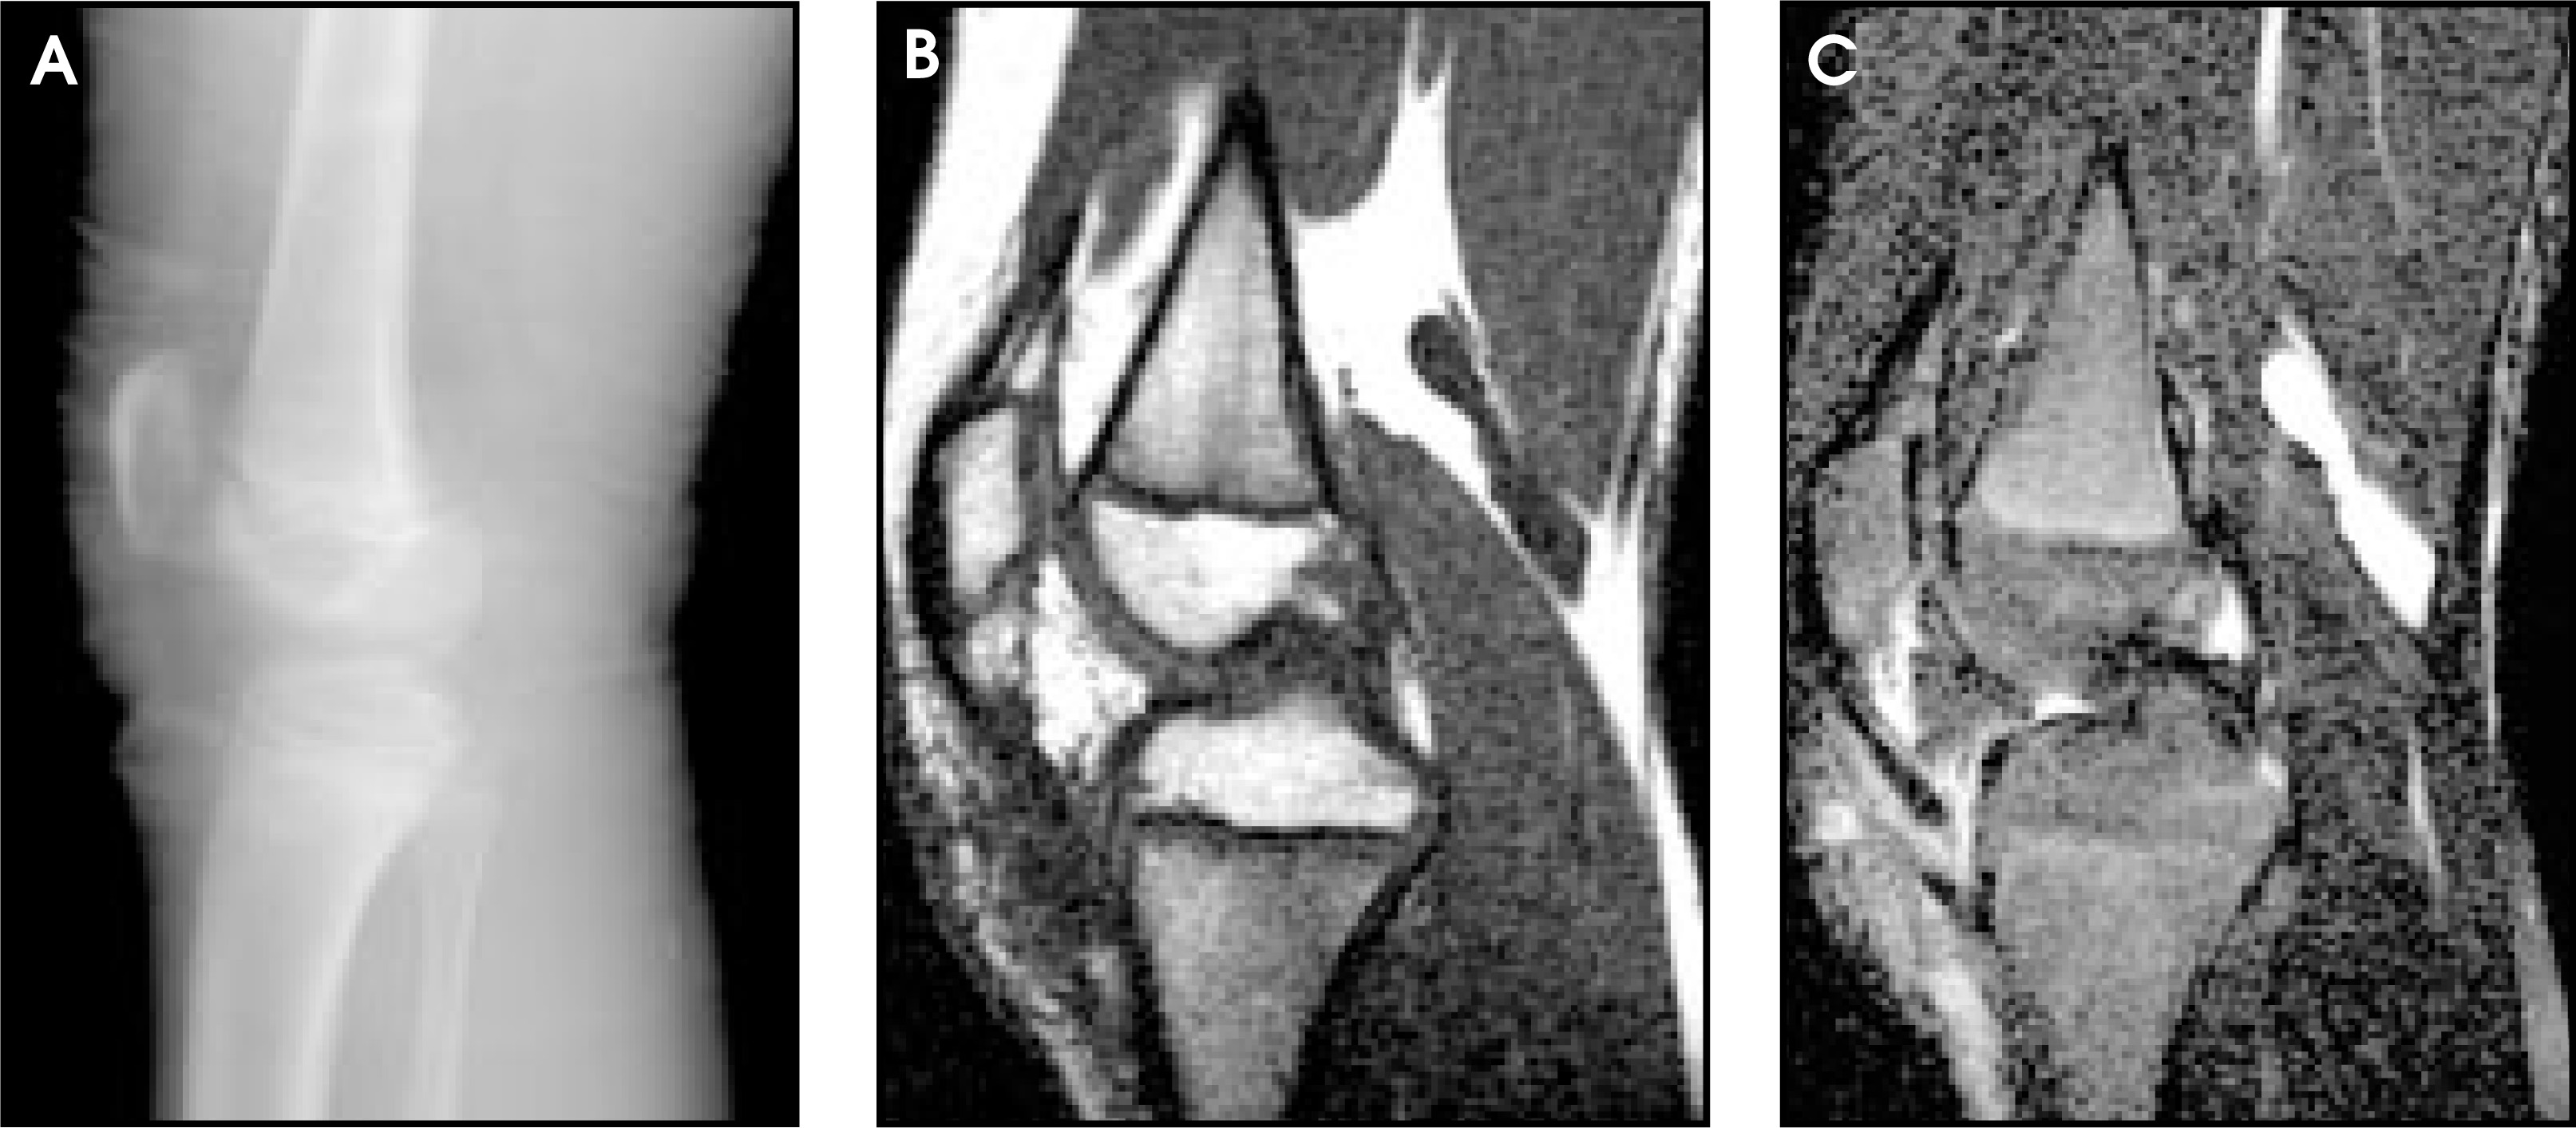
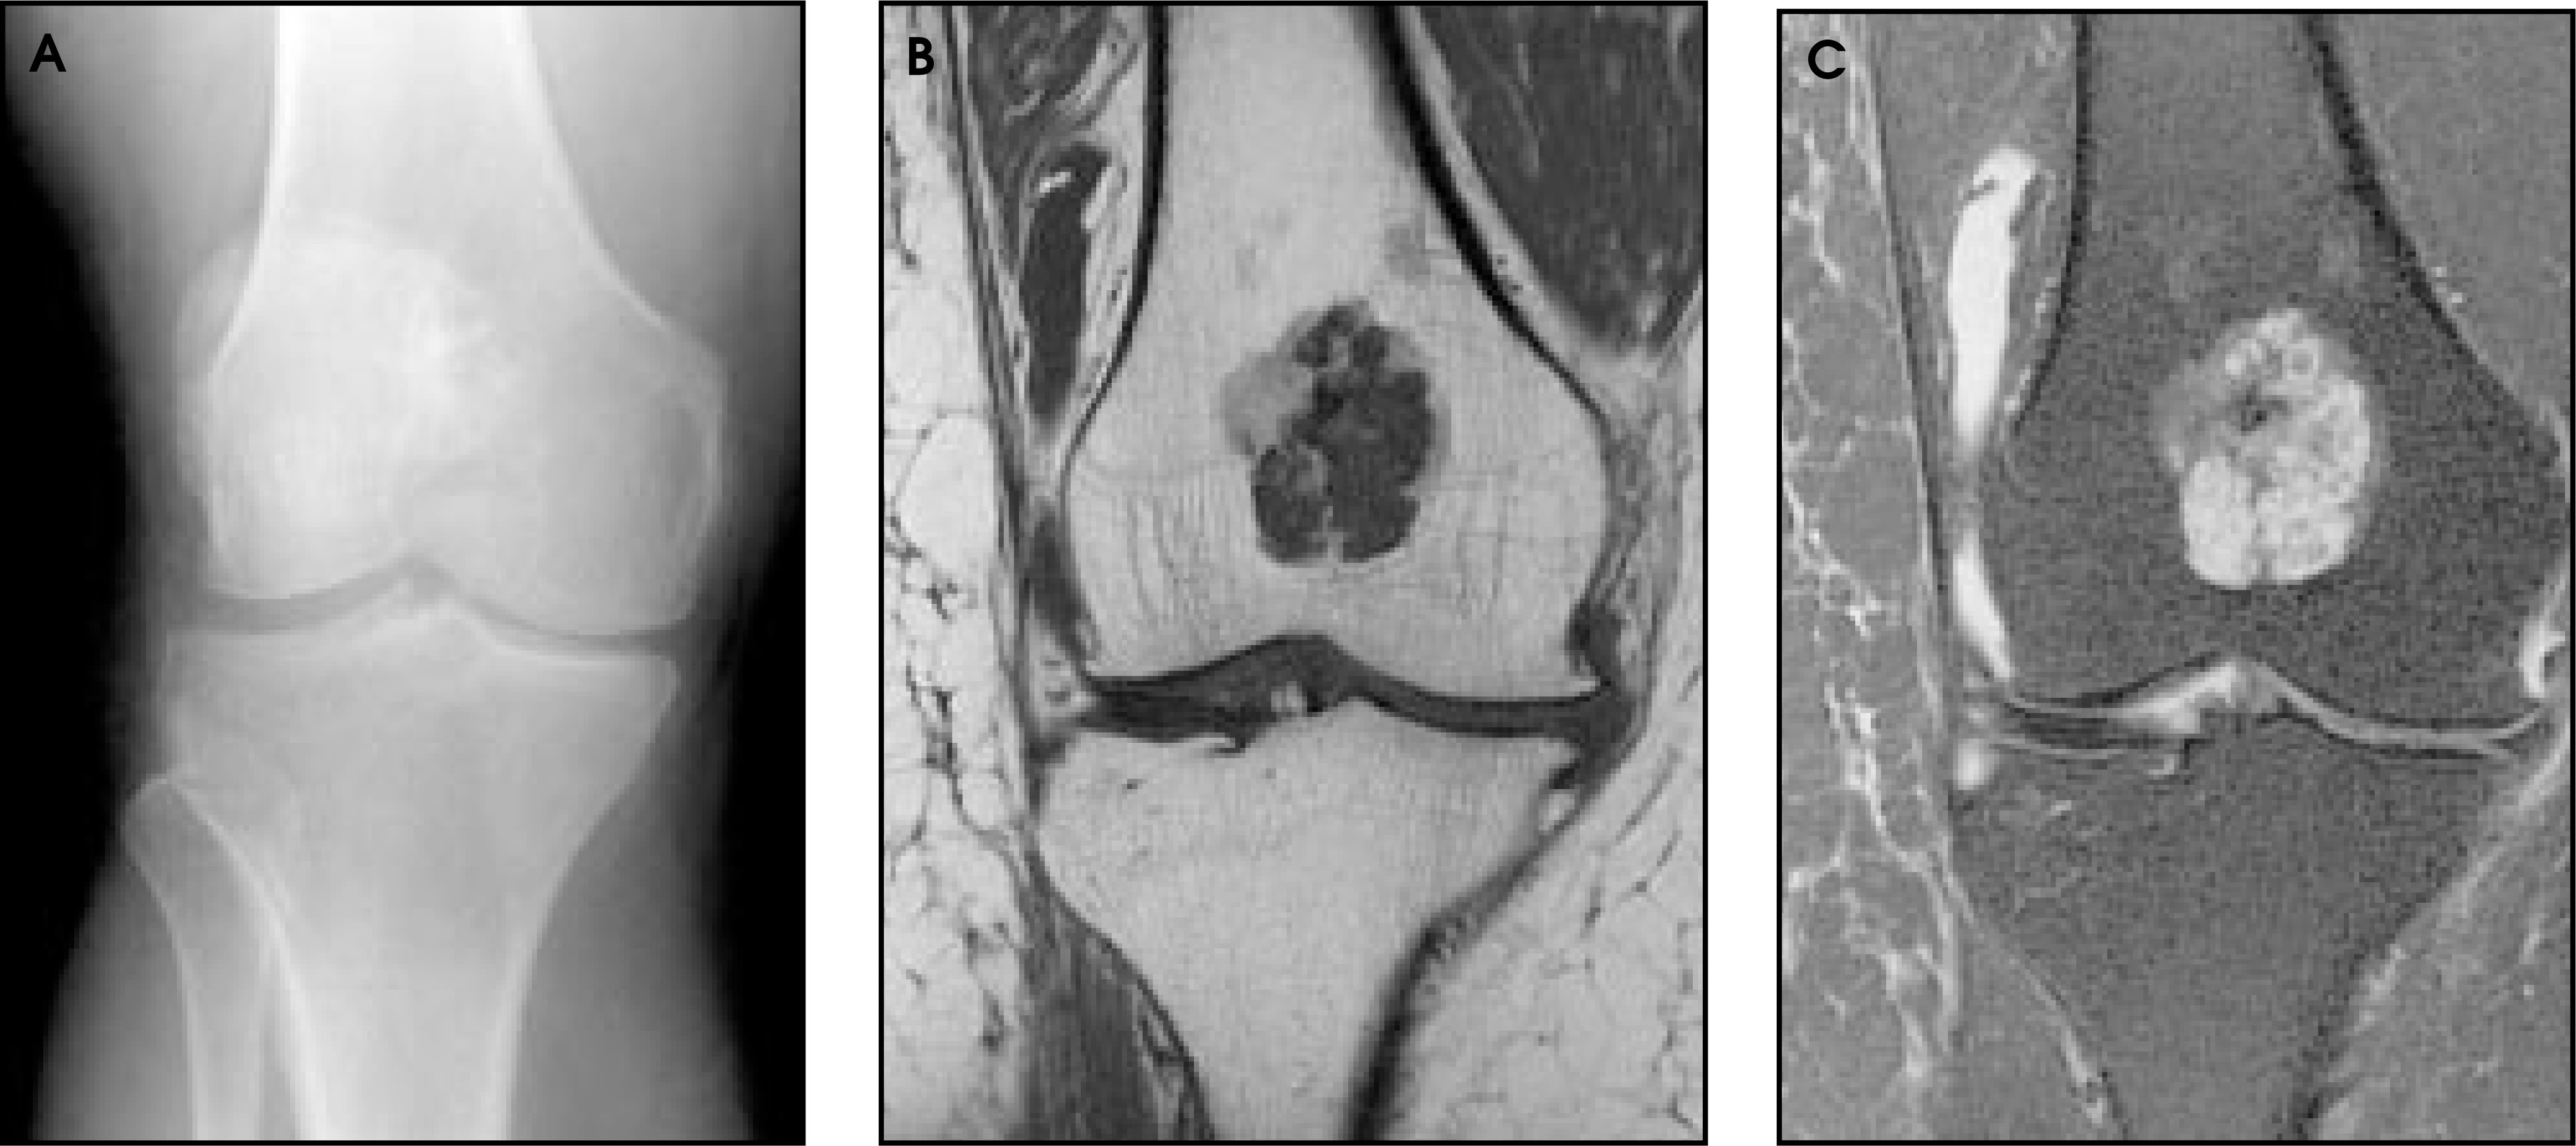
FIGURE 6.
FIGURE 6. Popliteal cyst. (A) Lateral radiograph of the knee in a young male complaining of posterior knee swelling is normal. (B) Sagittal fat-suppressed T2-weighted (T2W) MR image reveals a large fluid-filled cyst within the soft tissues of the posterior knee. (C) Axial fat-suppressed T2W MR image shows that the cyst lies between the medial head of the gastrocnemius and the semimembranosus, which is the typical location for a Baker’s cyst.
FIGURE 7.
FIGURE 7. Patellar tendon rupture. (A) Lateral radiograph of the knee in a patient who suffered a traumatic knee injury shows no evidence of a fracture, but there is increased soft tissue inferior to the patella. (B) Sagittal T1-weighted MR image shows ill-defined increased hypointensity in the area of the patellar tendon. (C) Sagittal fat-suppressed T2-weighted MR image reveals a complete tear of the patellar tendon (arrow), with associated soft-tissue edema.
FIGURE 8.
FIGURE 8. Enchondroma of the distal femur. (A) Anteroposterior radiograph of the right knee in a patient who recently fell shows a poorly marginated area of calcification overlying the distal femur. A chondroid lesion is suspected. (B) Coronal T1-weighted MR image shows a lobulated, and very hypointense, well-defined lesion that is centrally located within the distal femur. (C) Coronal fat-suppressed T2-weighted MR image shows the same lesion to be predominantly hyperintense with low signal intensity fibrovascular septae interspersed within it. A rounded focus of very low signal superiorly within the lesion corresponds to a focus of calcification. There is no endosteal scalloping, cortical breaththrough, or associated soft-tissue mass to suggest a malignancy or a chondrosarcoma.
FIGURE 9.
FIGURE 9. Hemophilic arthropathy. (A) Anteroposterior radiograph of the left knee demonstrates erosive changes of the articular surfaces, diffuse osteopenia, and severe loss of joint space. (B) Coronal T1-weighted MR image confirms the erosive changes and narrowed joint space, but also shows the periarticular marrow edema and the extent of intraosseous involvement. (C) Coronal fat-suppressed T2-weighted MR image shows an irregular area of very low signal (arrow) corresponding to hemosiderin deposition resulting from repetitive hemarthroses.

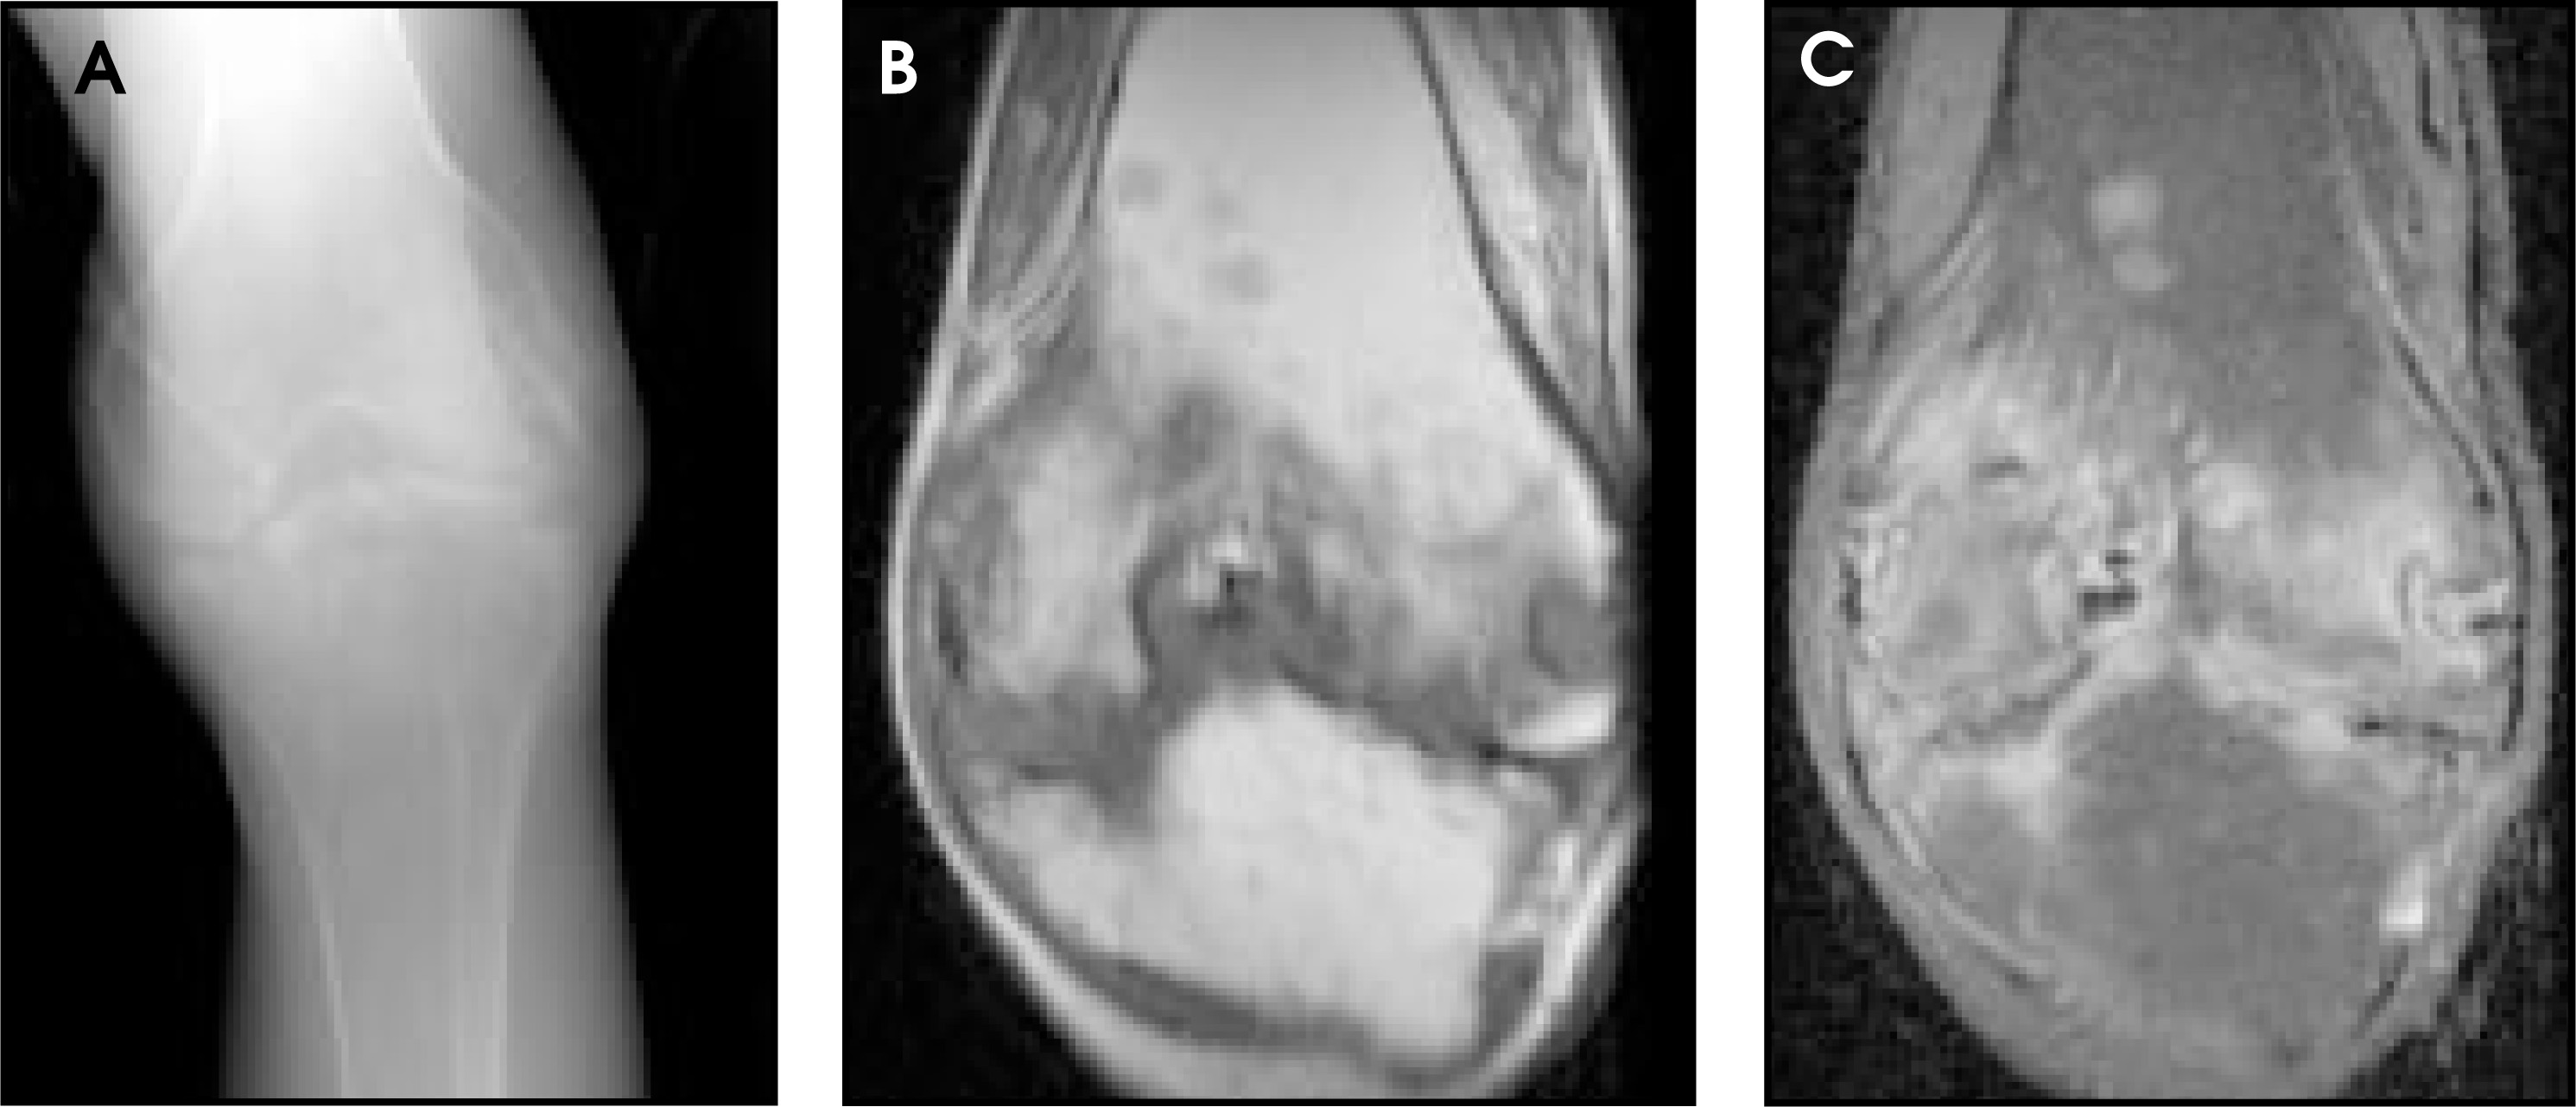
Lipohemarthrosis (Figure 10), pigmented villonodular synovitis (Figure 11), fibroxanthoma (Figure 12), and osteomyelitis are also examples of the complementary roles that MR imaging and radiography can play in diagnosis. Lipohemarthrosis and other fat-containing processes can be difficult to identify with radiography, but are readily diagnosed on MR imaging, due to the predictable signal characteristics of fat on different pulse sequences. In patients with radiographic findings suggestive of osteomyelitis (eg, soft-tissue swelling, osseous erosions), MR imaging may confirm the diagnosis by showing marrow enhancement, abnormally high T2 signal, intermediate to low T1 signal, and demonstration of sinus tracts (Figure 13).
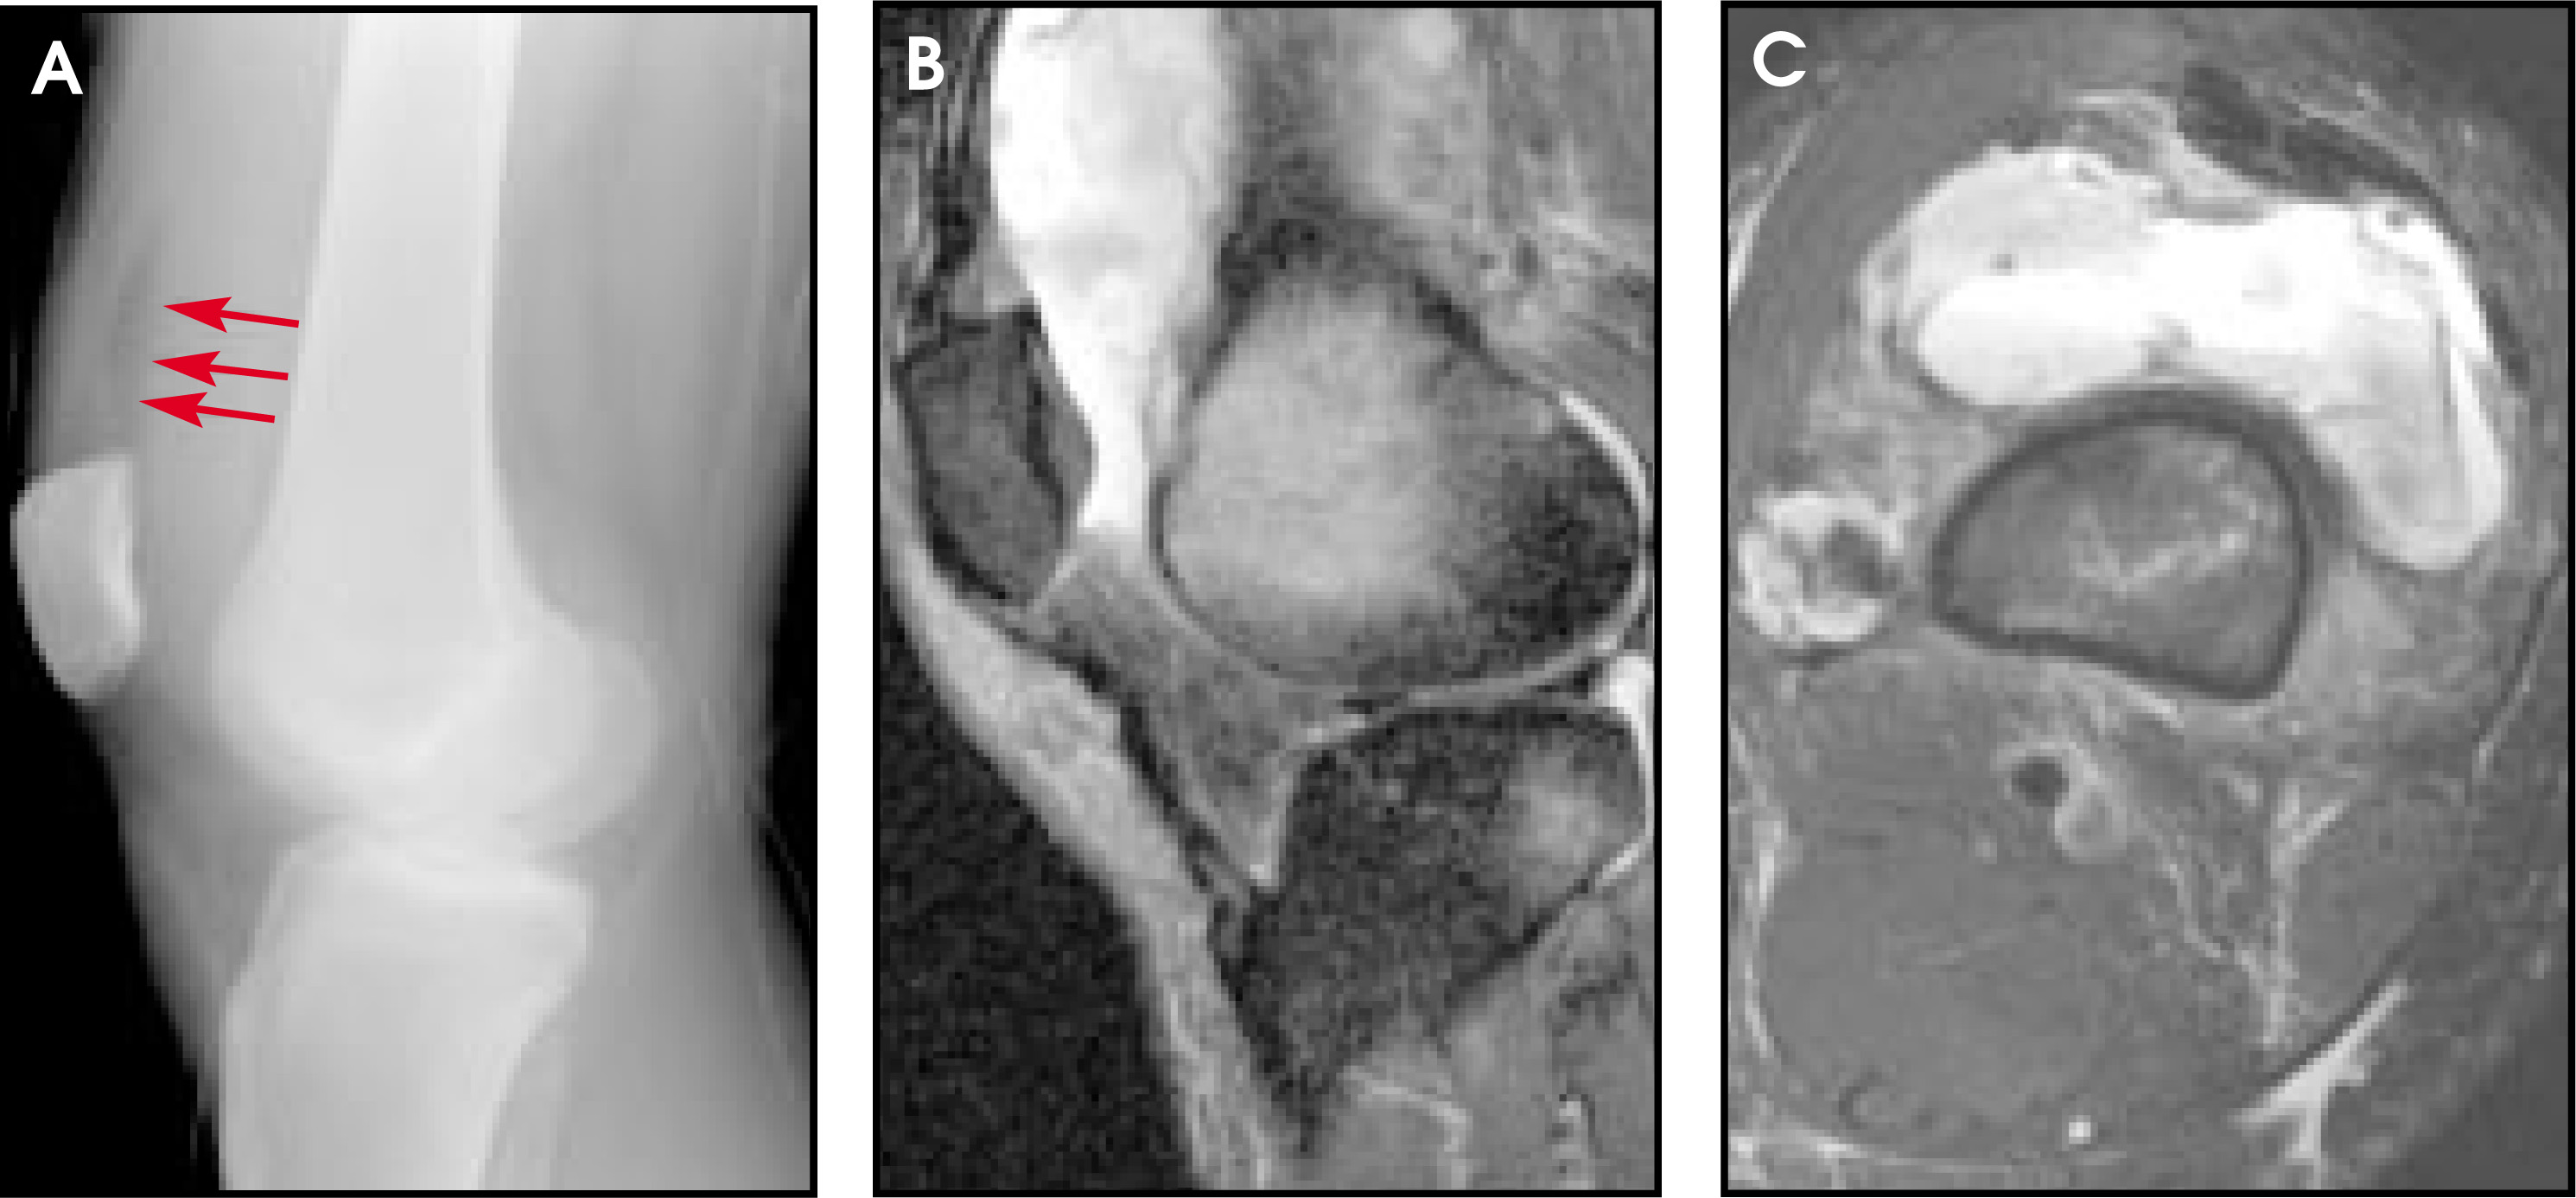
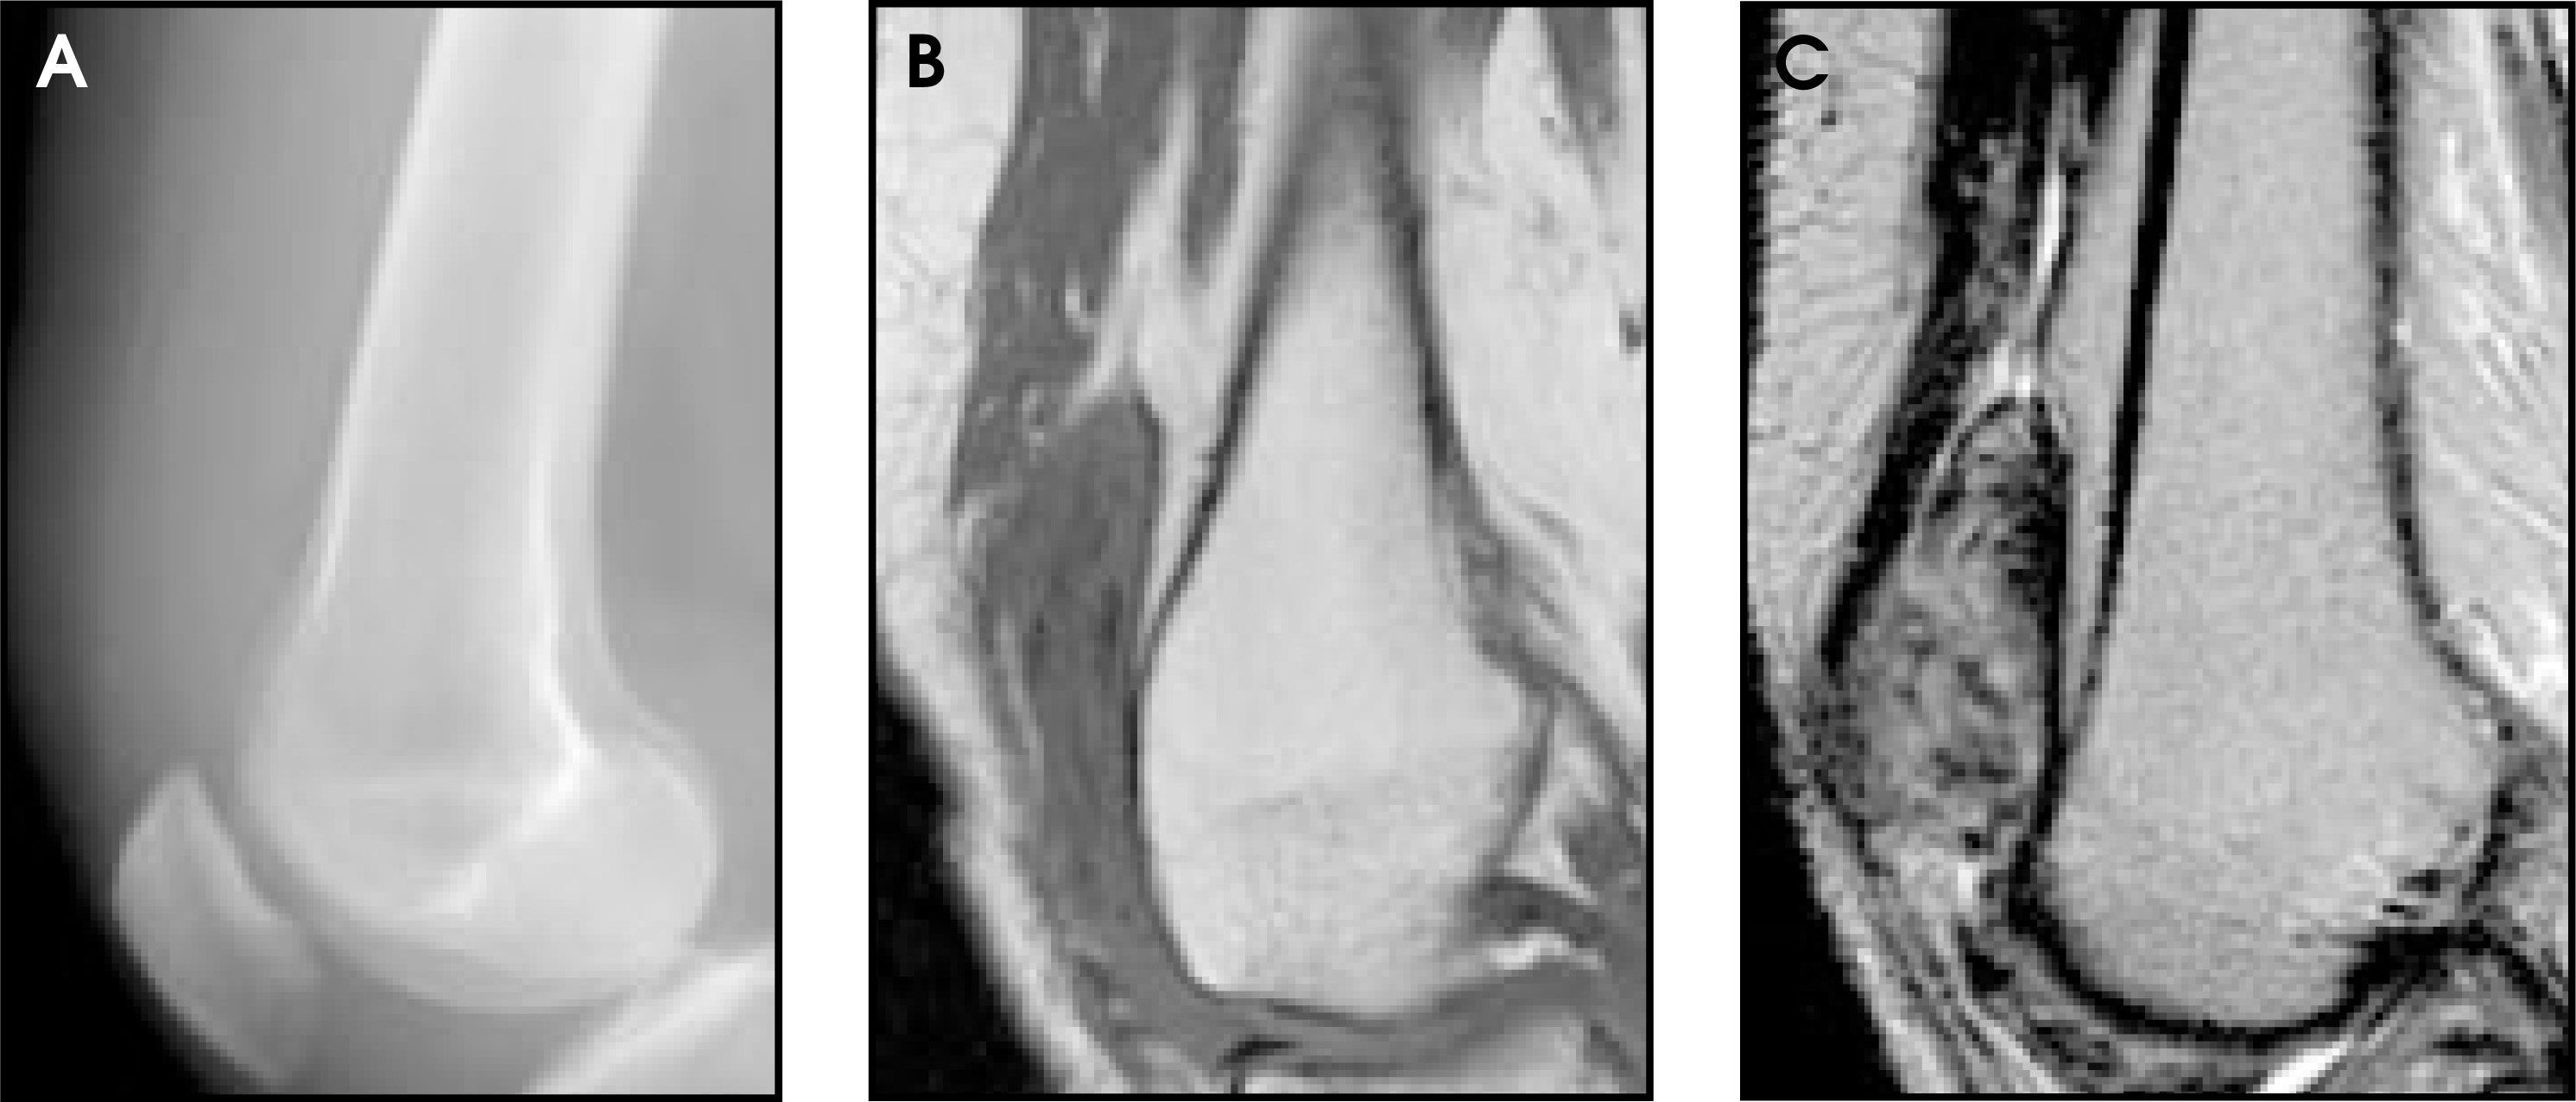
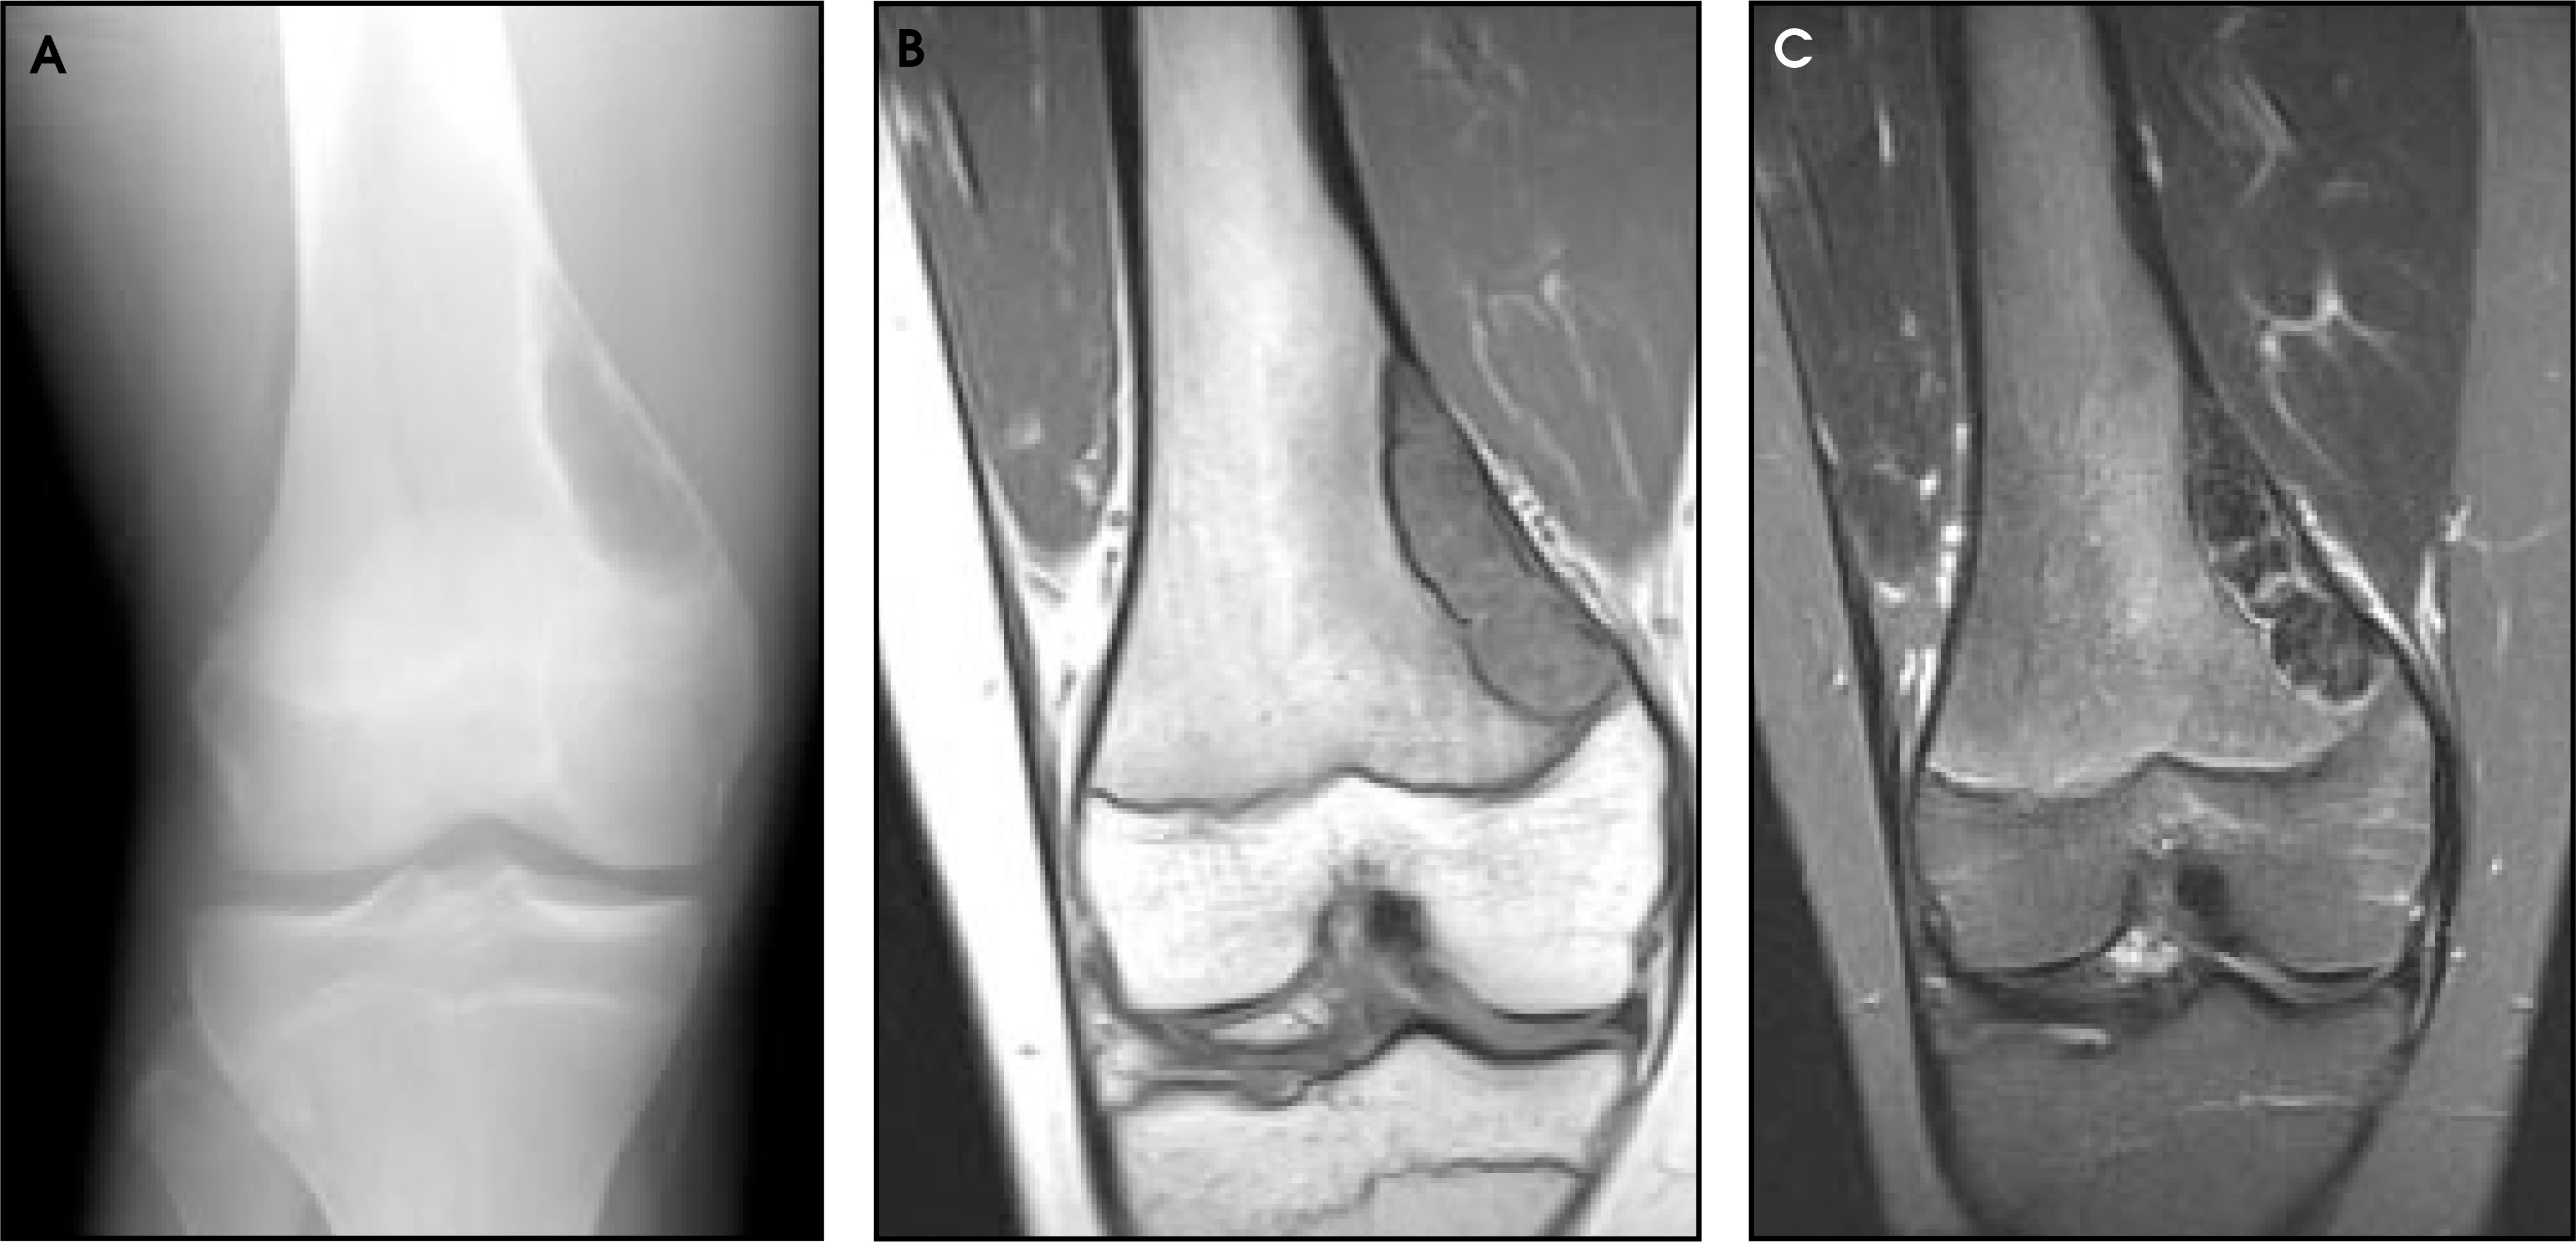
FIGURE 10.
FIGURE 10. Lipohemarthrosis. (A) Lateral radiograph of the knee in a patient who suffered blunt trauma to the knee shows a suspicious fluid level (arrows) in the suprapatellar region anteriorly. (B) Sagittal T2-weighted (T2W) fatsuppressed MR image shows a moderate-size contusion of the femoral condyle, a large joint effusion, and amorphous fatty-appearing material consisting of blood and marrow that has leaked into the joint space secondary to a condylar fracture.(C) Axial T2W fat-suppressed MR image shows dependently layering blood products, which form a horizontal line separating them from the serum and elements of marrow fat above.
FIGURE 11.
FIGURE 11. Pigmented villonodular synovitis (PVNS). (A) Lateral radiograph shows a density within the suprapatellar bursa, which was thought to represent a small knee effusion. (B) Sagittal T1-weighted MR image demonstrates a heterogeneous but largely intermediate to low signal intensity mass within the suprapatellar bursa. This mass contains several linear and oblong foci of decreased signal. (C) Sagittal T2-weighted MR image shows a heterogeneous mass with high signal similar to that of the marrow or subcutaneous fat. Interspersed within the mass are very low signal foci , which are indicative of PVNS (the synovial biopsy was confirmatory). Note that there are no osseous erosions.
FIGURE 12.
FIGURE 12. Fibroxanthoma. (A) Anteroposterior radiograph demonstrates a cortically based right medial metadiaphyseal lytic lesion with welldefined margins. There is no cortical disruption or soft-tissue involvement. (B) Coronal T1-weighted MR image shows that the lesion is predominantly isointense to muscle, with areas containing lower signal scattered within this lesion. (C) Coronal, fat-suppressed T2-weighted (T2W) MR image reveals the fibrous nature of this tumor with the majority of the lesion appearing dark on the T2W image. The appearance and signal characteristics are typical for a nonossified fibroma, otherwise known as a fibroxanthoma.
FIGURE 13.
FIGURE 13. Osteomyelitis. (A) Anteroposterior radiograph of the left knee shows an ill-defined lucency involving the lateral femoral condyle and loss of cortical integrity in this region (arrow). (B) Sagittal T1-weighted MR image shows definite cortical disruption and juxtacortical intermediate intensity material that could be inflammatory changes representing infection given the patient’s history of fever, leukocytosis, and cellulitis. (C) Coronal fat-suppressed T2-weighted MR image shows high signal within the bone and adjacent soft tissue consistent with osteomyelitis and cellulitis, respectively. Aspiration of this region confirmed the presence of purulent fluid.

In other instances, a relatively confident diagnosis can be made from radio-graphic findings, and MR findings play only a supportive role, as in a typical case of a giant cell tumor involving the proximal tibial metaphysis (Figure 14).
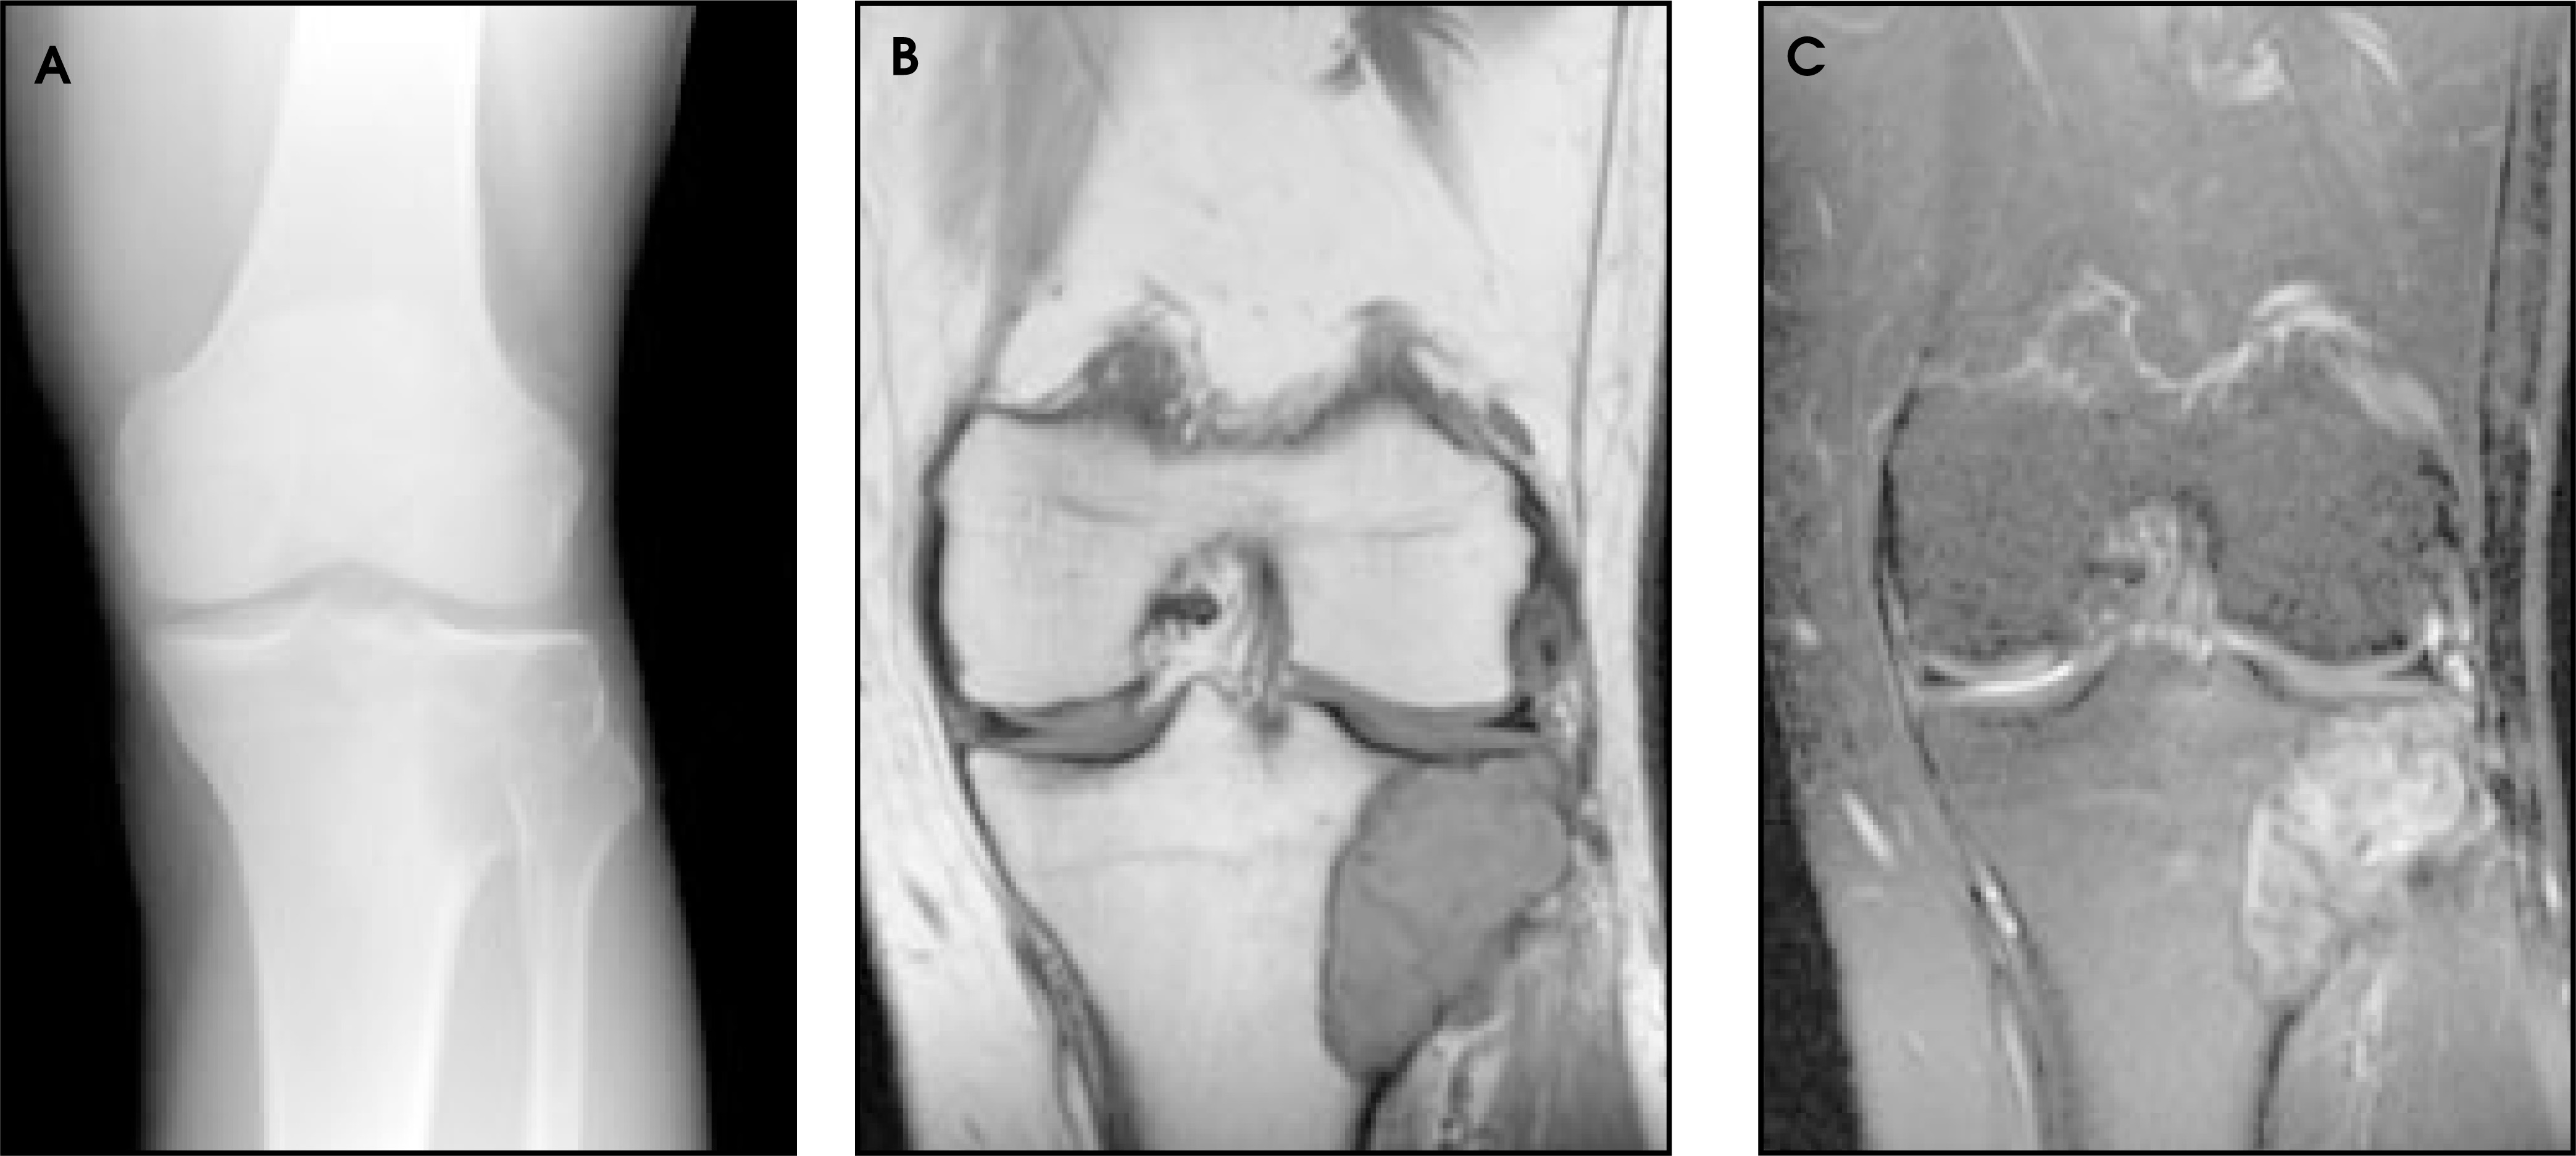
FIGURE 14.
FIGURE 14. Giant cell tumor of the lateral tibial plateau. (A) Anteroposterior radiograph of the left knee demonstrates a slightly expansile lytic lesion involving the lateral tibial plateau. The lesion contains a narrow transition zone and nonsclerotic margins. Adjacent cortical thinning is appreciated, without soft-tissue involvement or periosteal reaction. (B) Coronal T1-weighted MR image shows a well-defined intermediate signal intensity mass. This image confirms the absence of cortical breakthrough or soft-tissue mass. (C) Coronal fat-suppressed T2-weighted MR image shows a heterogeneous but largely high signal intensity mass. These radiographic and MR findings are typical for a nonaggressive giant cell tumor.

Advertisement

Conclusion

There are certain instances in which a disease process shows no radiographic findings but is readily detectable on MR imaging. In general, however, conventional radiography and MR imaging play complementary roles in diagnosing many disease processes of the knee. Correlating these two modalities is helpful in synthesizing the information in order to formulate a differential diagnosis or to provide a firm diagnosis. AR

References

  1. Feldman F. Musculoskeletal radiology: Then and now. Radiology. 2000;216:309-316.
  2. Bencardino J, Rosenberg Z, Brown R. Traumatic musculotendinous injuries of the knee: Diagnosis with MR imaging. RadioGraphics. 2000;20:S103-S120.
  3. Hodler J, Resnick D. Current status of imaging of articular cartilage. Skelet Radiol. 1996;37:1476-1479.
  4. Waldschmidt J, Rilling R, Kajdacsy-Balla A. In vitro and in vivo MR imaging of hyaline cartilage. Zonal anatomy, imaging pitfalls, and pathologic conditions. RadioGraphics. 1997;17:1387-1402.
  5. Daffner R, Pavlov H. Stress fractures: Current concepts. AJR Am J Roentgenol. 1992;159:252-254.
  6. Neltzschman H, Mena C. MRI evaluation of the painful lower extremity when radiographs are inconclusive. Appl Radiol. 1999;28(6):12-23.
  7. Mandell G, Harcke H, Kumar S. Chondroid lesions of the extremities. Top Magn Reson Imaging. 1991;4:56-65.

Citation

Ly JQ, Beall DP. MR imaging of the painful knee: Correlation with conventional radiography. Applied Radiology. 2003;32(5):35-41. doi:10.37549/AR1182.