MRI of Toxic, Metabolic, and Autoimmune Encephalopathies: A Review
Applied Radiology — Vol. 49 , Issue 1 , pp. 10 -19
DOI: 10.37549/AR2625
Published: January 1, 2020
1 Texas Tech University Health Sciences Center, El Paso, TX
2 Texas Tech University Health Sciences Center, El Paso, TX
3 University of British Columbia, Vancouver, BC
Categories
Encephalopathies encompass a wide range of etiologies, including intoxications, autoimmune disorders, and metabolic imbalances. Symptoms are often nonspecific and range from seizures, focal neurological deficits, and movement disorders, to coma, permanent sequelae and death.1 MRI is the imaging modality of choice and is often the first indicator of an encephalopathy as a possible cause of symptoms.1 Recognition of distinct MRI enhancement patterns in regard to symmetry and topographic distribution can help identify the underlying pathology.
This article highlights the vital role the radiologist plays in identifying these manifestations, which in some cases are reversible. We also illustrate the most common toxic, autoimmune, and metabolic encephalopathies to create an understanding and awareness of typical imaging appearances the radiologist may encounter (Table 1).
Toxic Etiologies
Thermatrim Encephalopathy
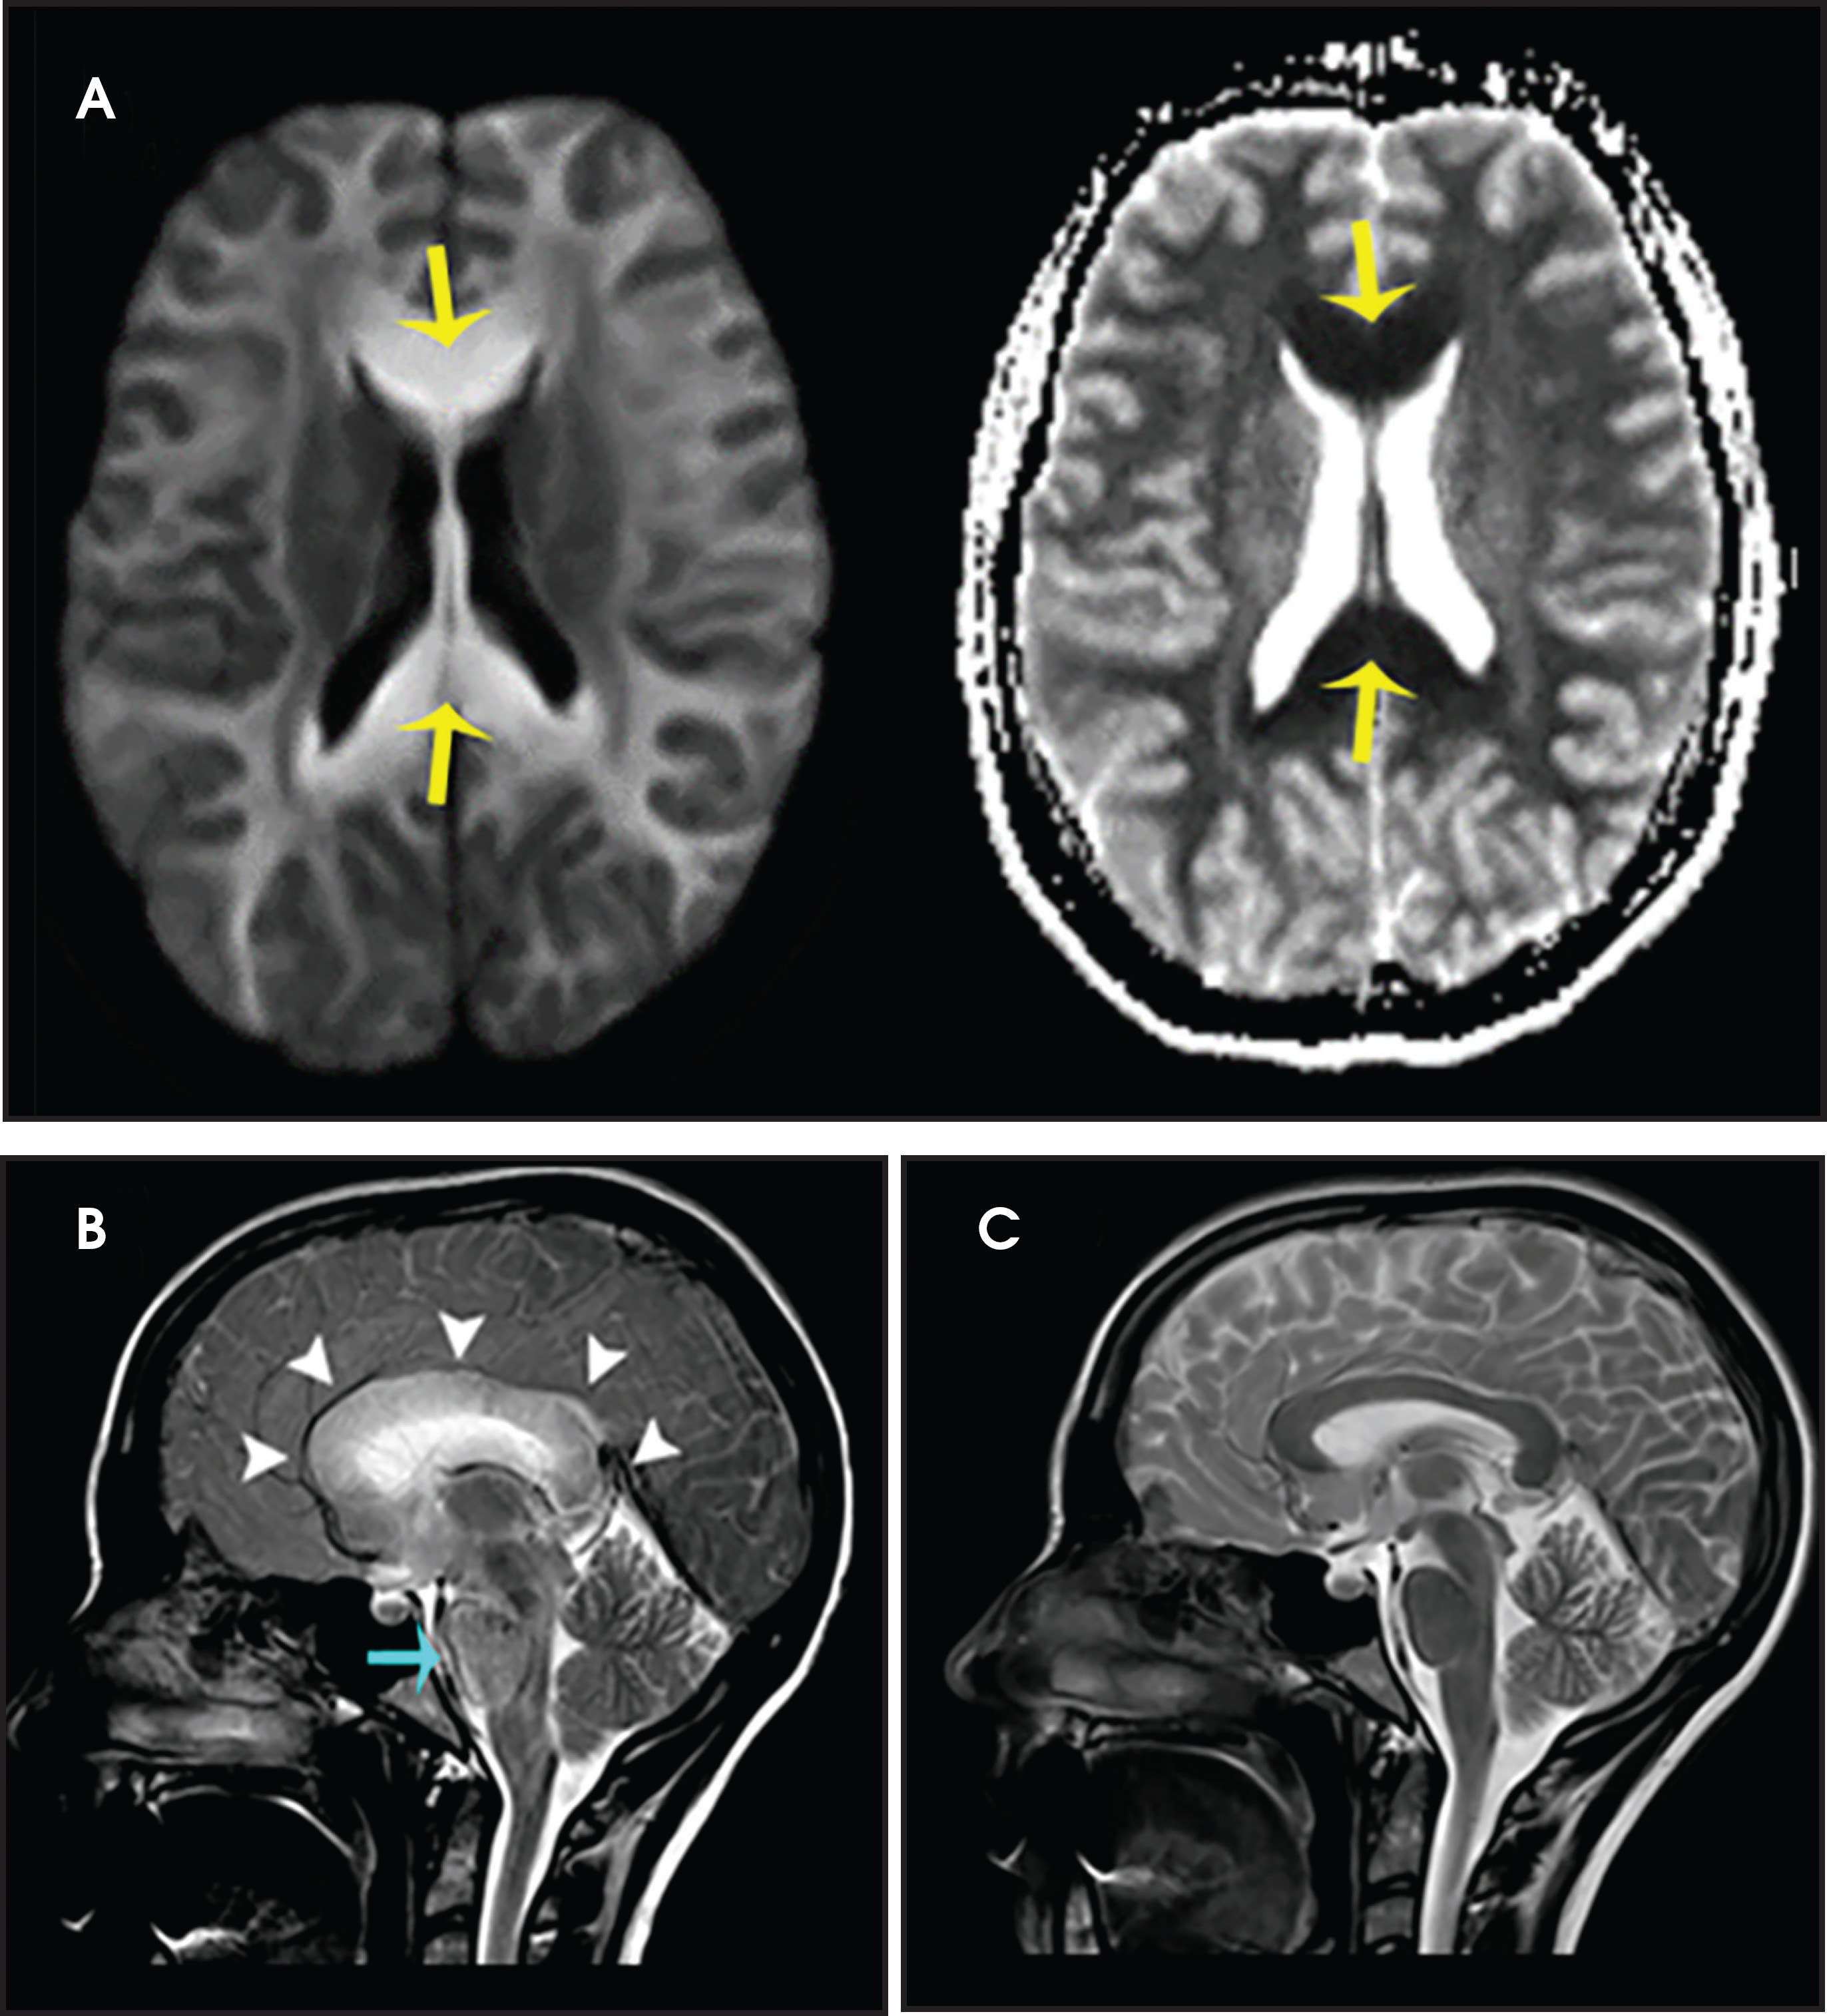
Thermatrim, a thermogenic dietary supplement marketed to promote weight loss, has been associated with anxiety, insomnia, cardiovascular disorders, and central nervous stimulation.2Imaging findings are characteristic for extensive symmetric involvement of the corpus callosum, pons, and the subcortical white matter, with hyperintensities on T2-weighted imaging (T2-WI) and restricted diffusion on Diffusion Weighted Imaging (DWI) with reduced Apparent Diffusion Coefficient (ADC) values (Figure 1).2
Methanol Encephalopathy
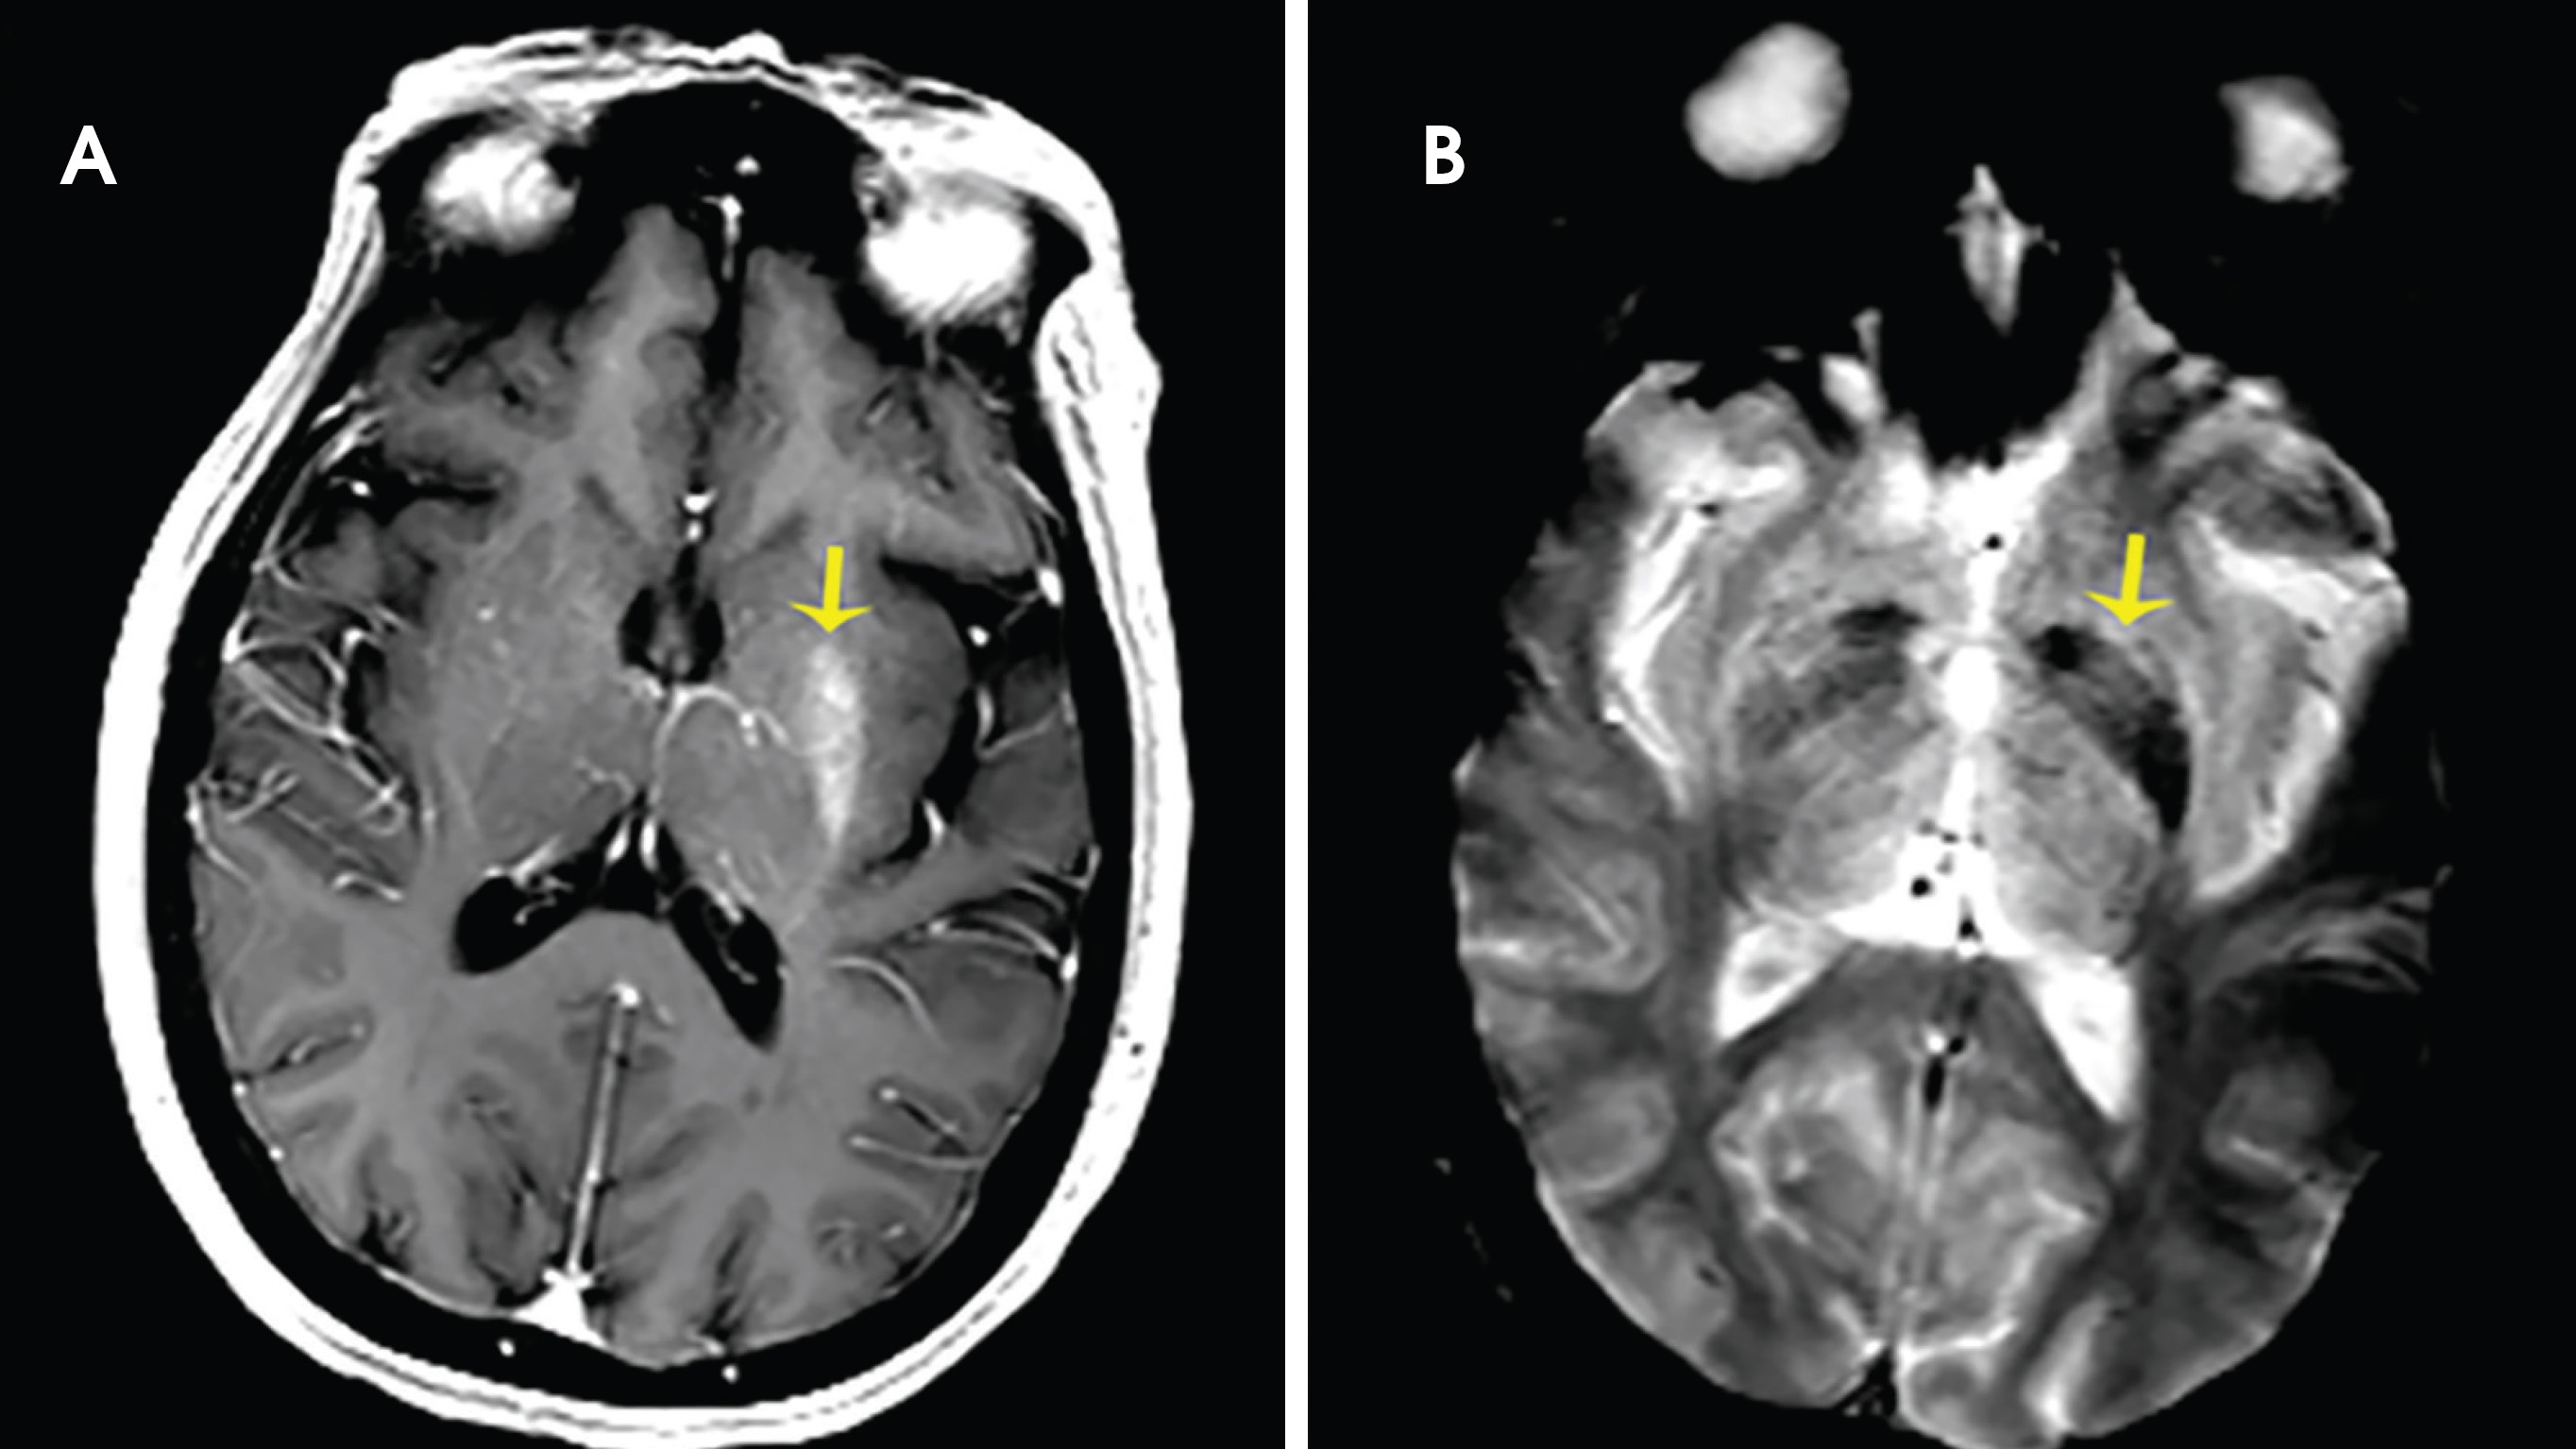
The clinical presentation usually involves visual disturbances as a first symptom followed by headaches, dizziness, malaise, seizures, stupor, and coma after a latent period.3 Intoxication can be fatal unless treated early and characteristically involves bilateral necrosis of the putamina with or without hemorrhage.4 Variable signal intensities on T1-weighted imaging (T1-WI) with enhancement after contrast administration, hyperintensities on T2-WI, and Fluid Attenuation Inversion Recovery (FLAIR) sequences, and restricted diffusion on DWI, are typical imaging findings (Figure 2).4
Carbon Monoxide Encephalopathy
Carbon-monoxide intoxications may be accidental or intentional and present with nonspecific symptoms and signs ranging from headaches and confusion to coma and death.4 Exposure can be acute or chronic, and bilateral symmetric necrosis of the globi pallidi with or without involvement of the caudate and putamina is characteristic.4 Hypointensities on T1-WI and hypertintensities on T2-WI are distinct imaging findings and their extent correlates with clinical outcome (Figure 3).4
Heroin Encephalopathy
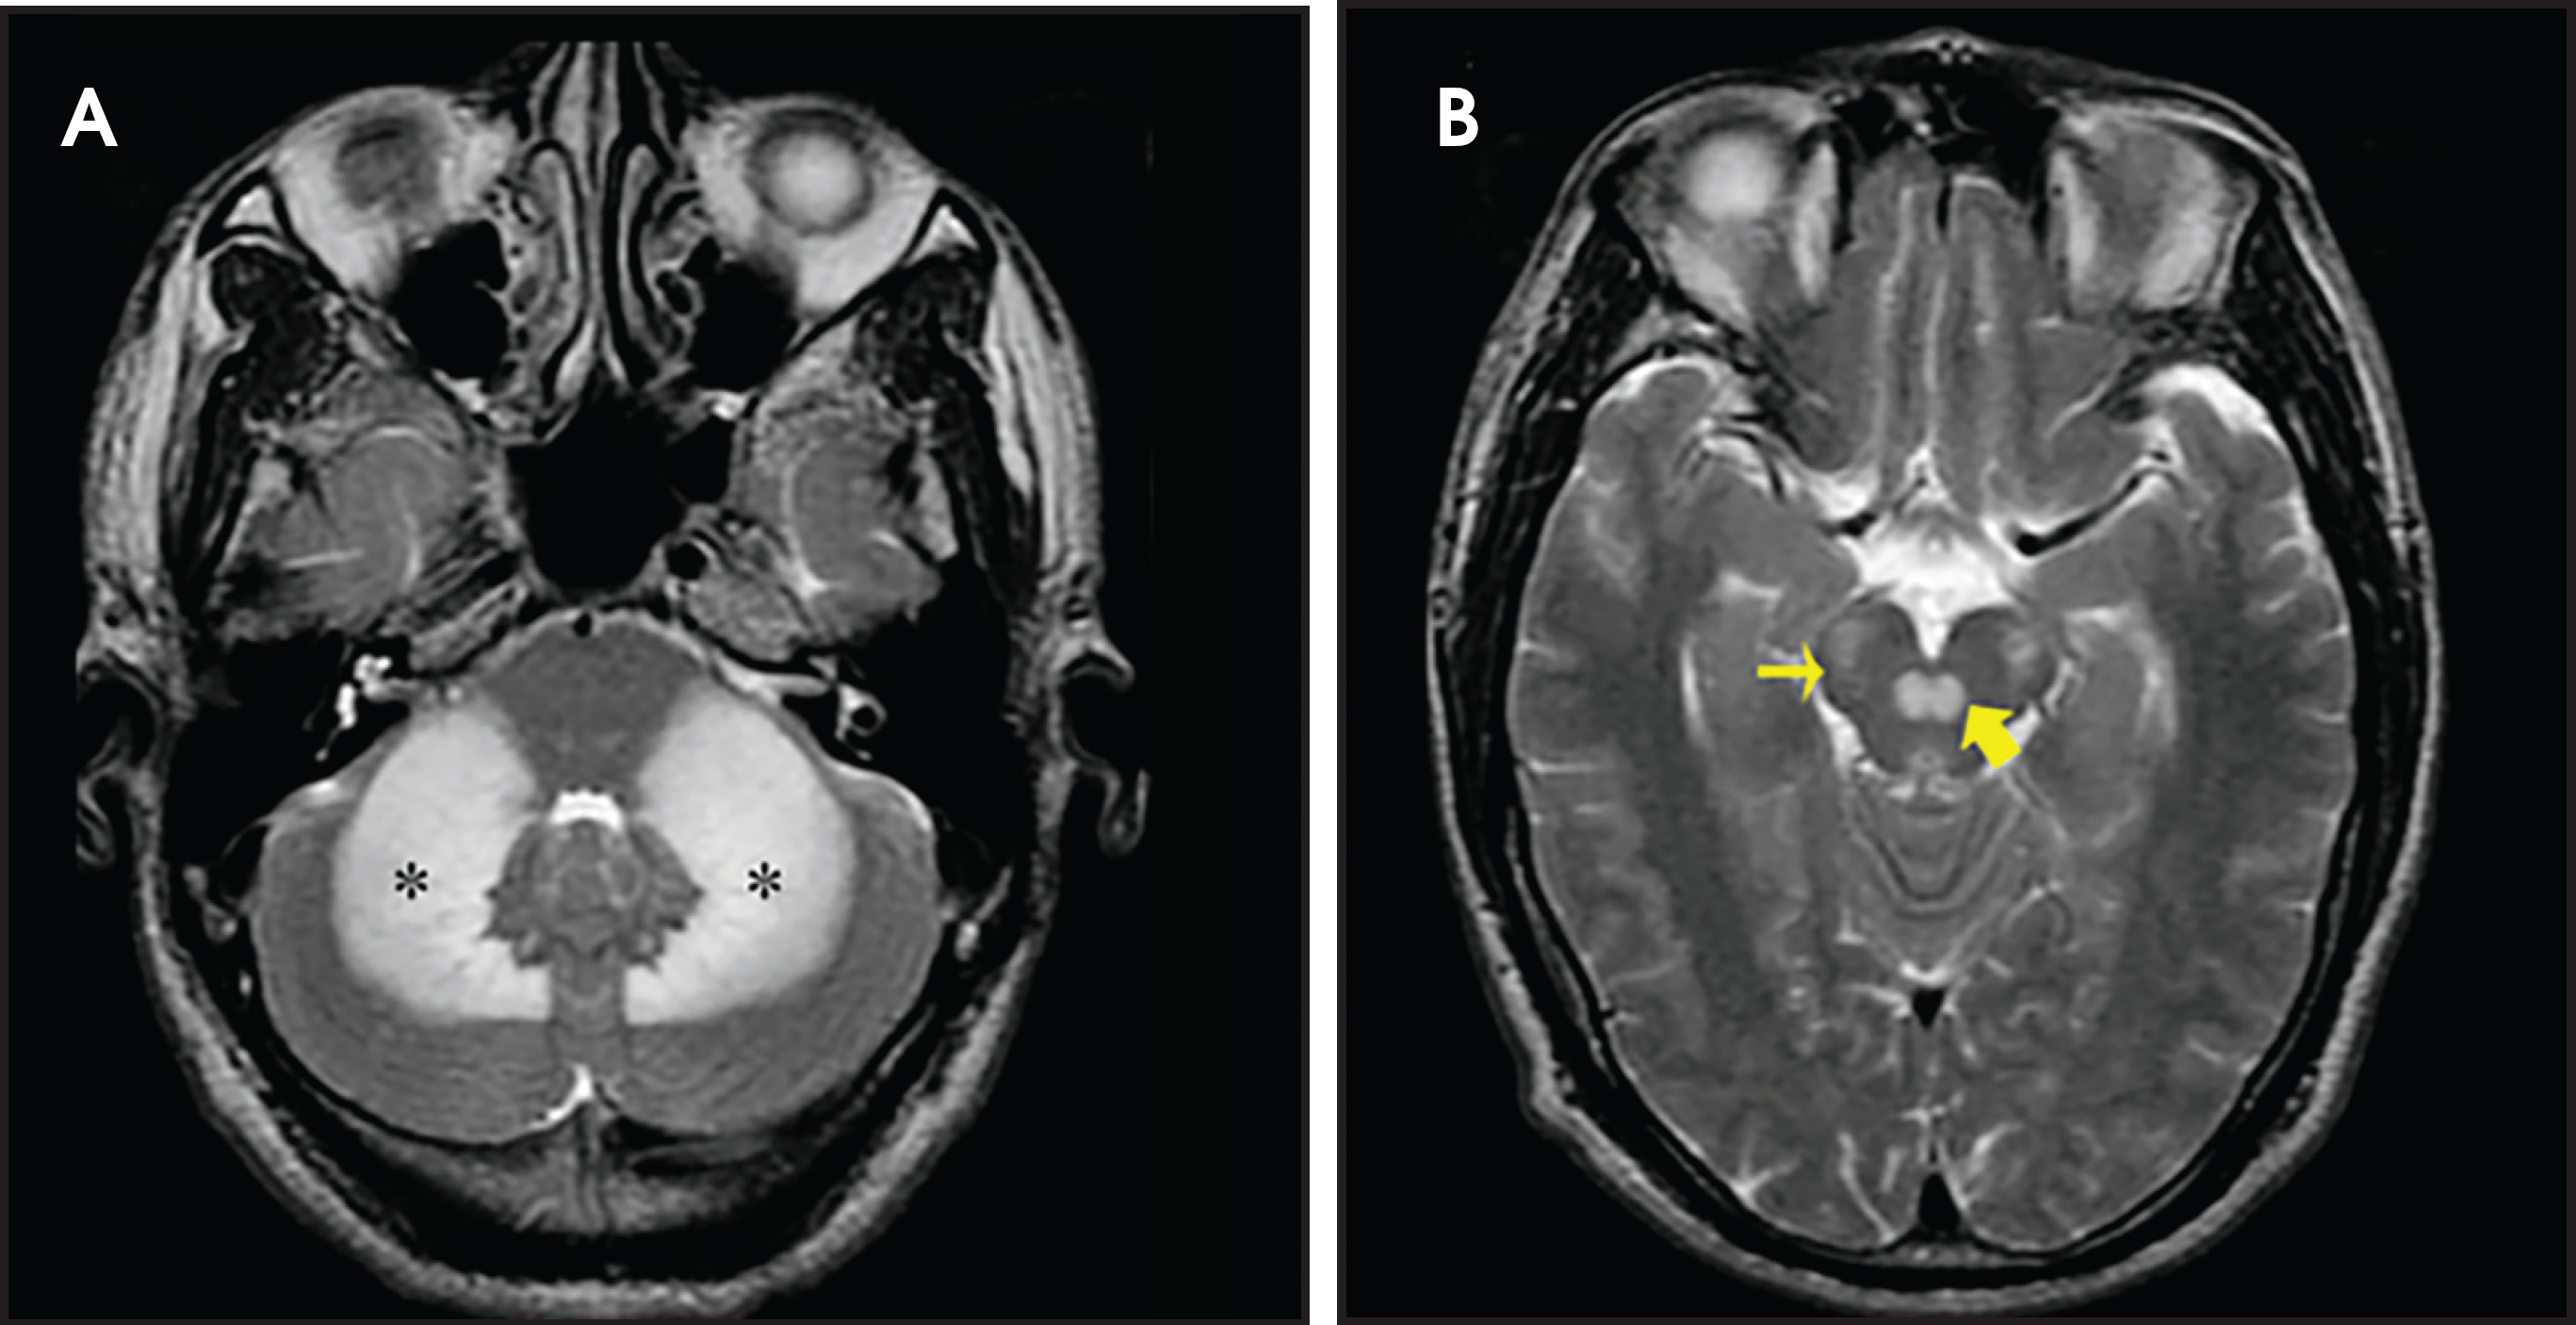
Heroin can be administered through multiple routes, including intravenous injection, oral use, and vapor inhalation, also referred to as “chasing the dragon.” Leukoencephalopathy related to heroin vapor inhalation progresses from cerebellar signs and motor restlessness to pyramidal and pseudobulbar signs and eventually to spasms, paresis, and death.5 Symmetric high signal intensity on T2-WI MRI and FLAIR sequences with involvement of the cerebellum and posterior limbs of the internal capsules are characteristic (Figure 4).5 Heroin encephalopathy is typically associated with ischemia, and 5-10% of all heroin users have infarcts of the globipallidi.6 High signal intensities in the subcortical and periventricular white matter on T2-WI are also characteristic imaging findings (Figure 4).6
| Toxic | Autoimmune | Metabolic |
|---|---|---|
| Thermatrim | Anti-NMDA R-encephalopathy | Central Pontine Myelinolysis /Osmotic Demyelination |
| Heroin | Hashimoto | Wernicke Encephalopathy |
| Methanol | Limbic | Non-ketotic hyperglycemic hemichorea |
| Carbon-monoxide | Hypoxic | |
| Tacrolimus | Hypoglycemic | |
| Hepatic | ||
| Hyperammonemic |
Tacrolimus Encephalopathy
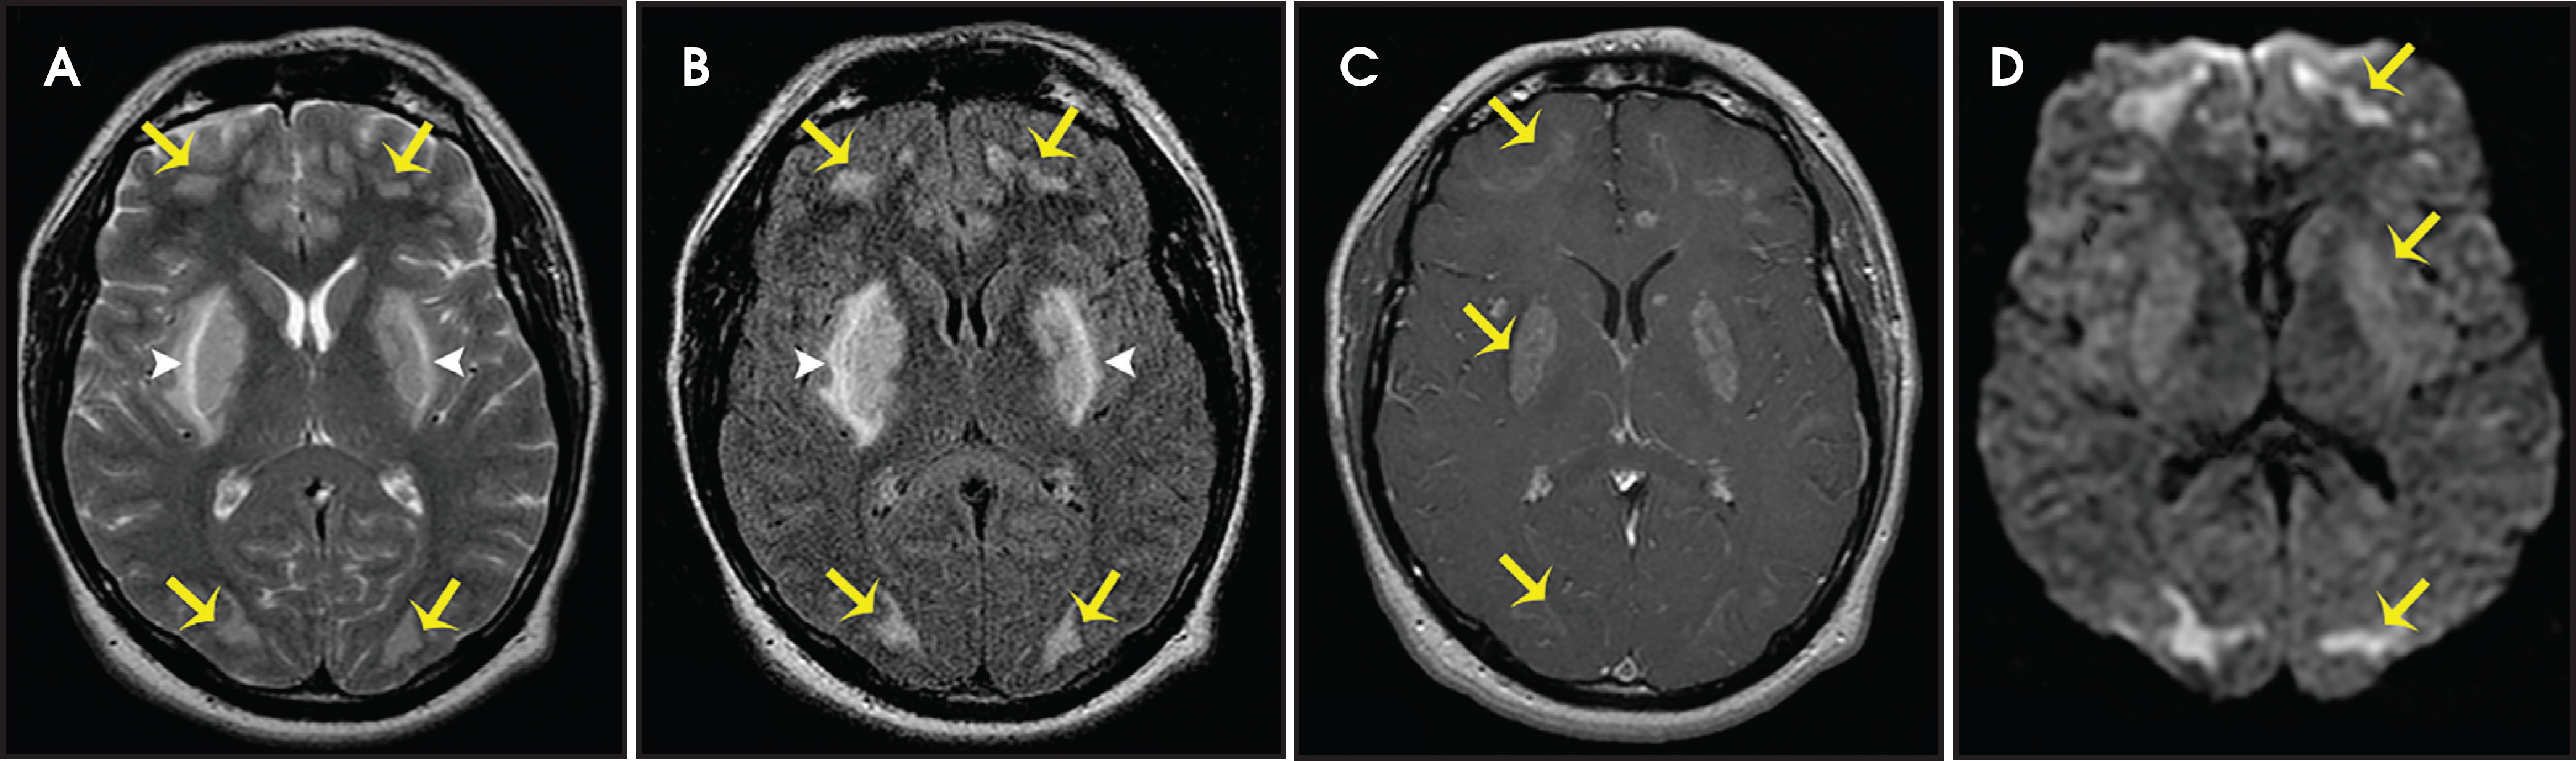
The calcineurin inhibitor tacrolimus is administered in the prophylaxis of graft-versus-host disease. About 40-60% of all treated patients suffer from headaches, paresthesia, tremor, and sleep disturbances, and 5-8% exhibit signs of confusion, lethargy, dysarthria, seizures, and coma.7 Bilateral edema in the subcortical white matter is characteristic and corresponds to hyperintensities on T2-WI and FLAIR sequences (Figure 5).7
Autoimmune Etiologies
Hashimoto Encephalopathy
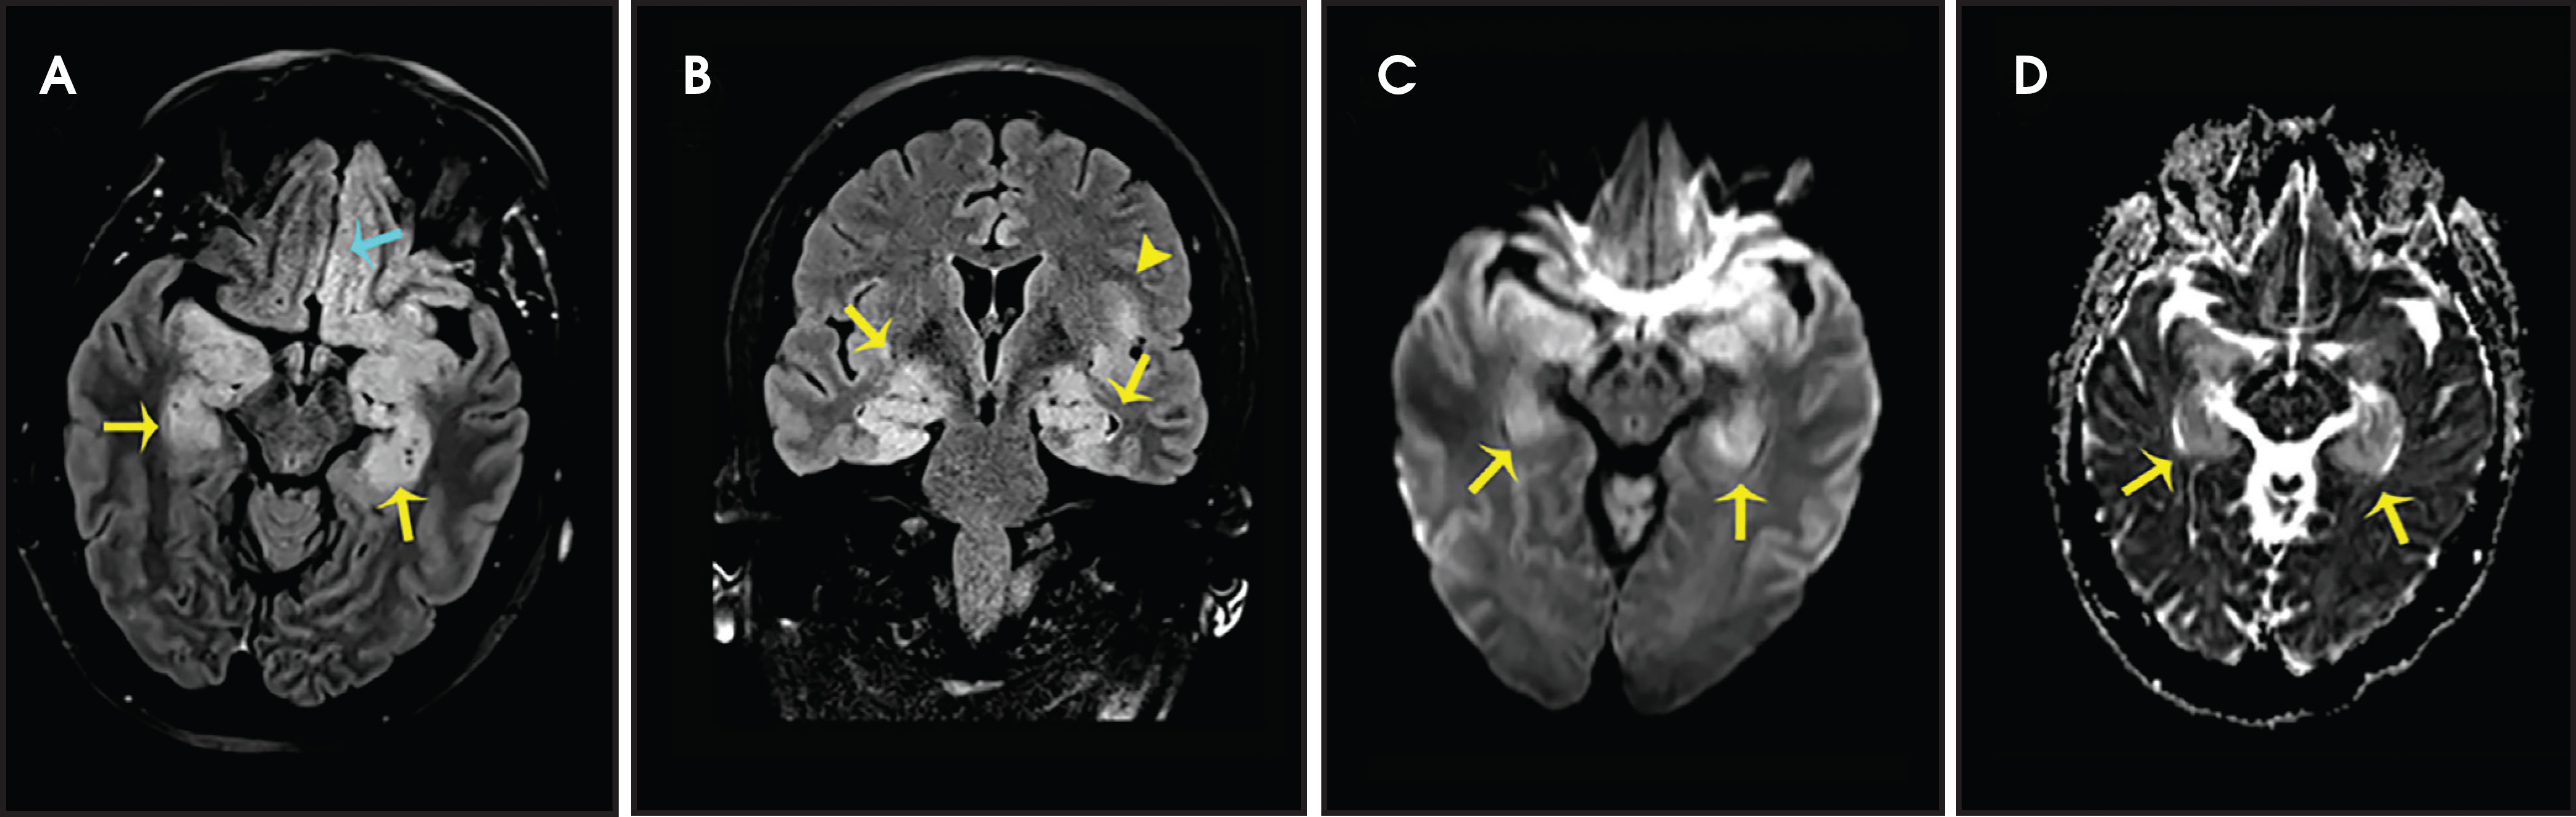
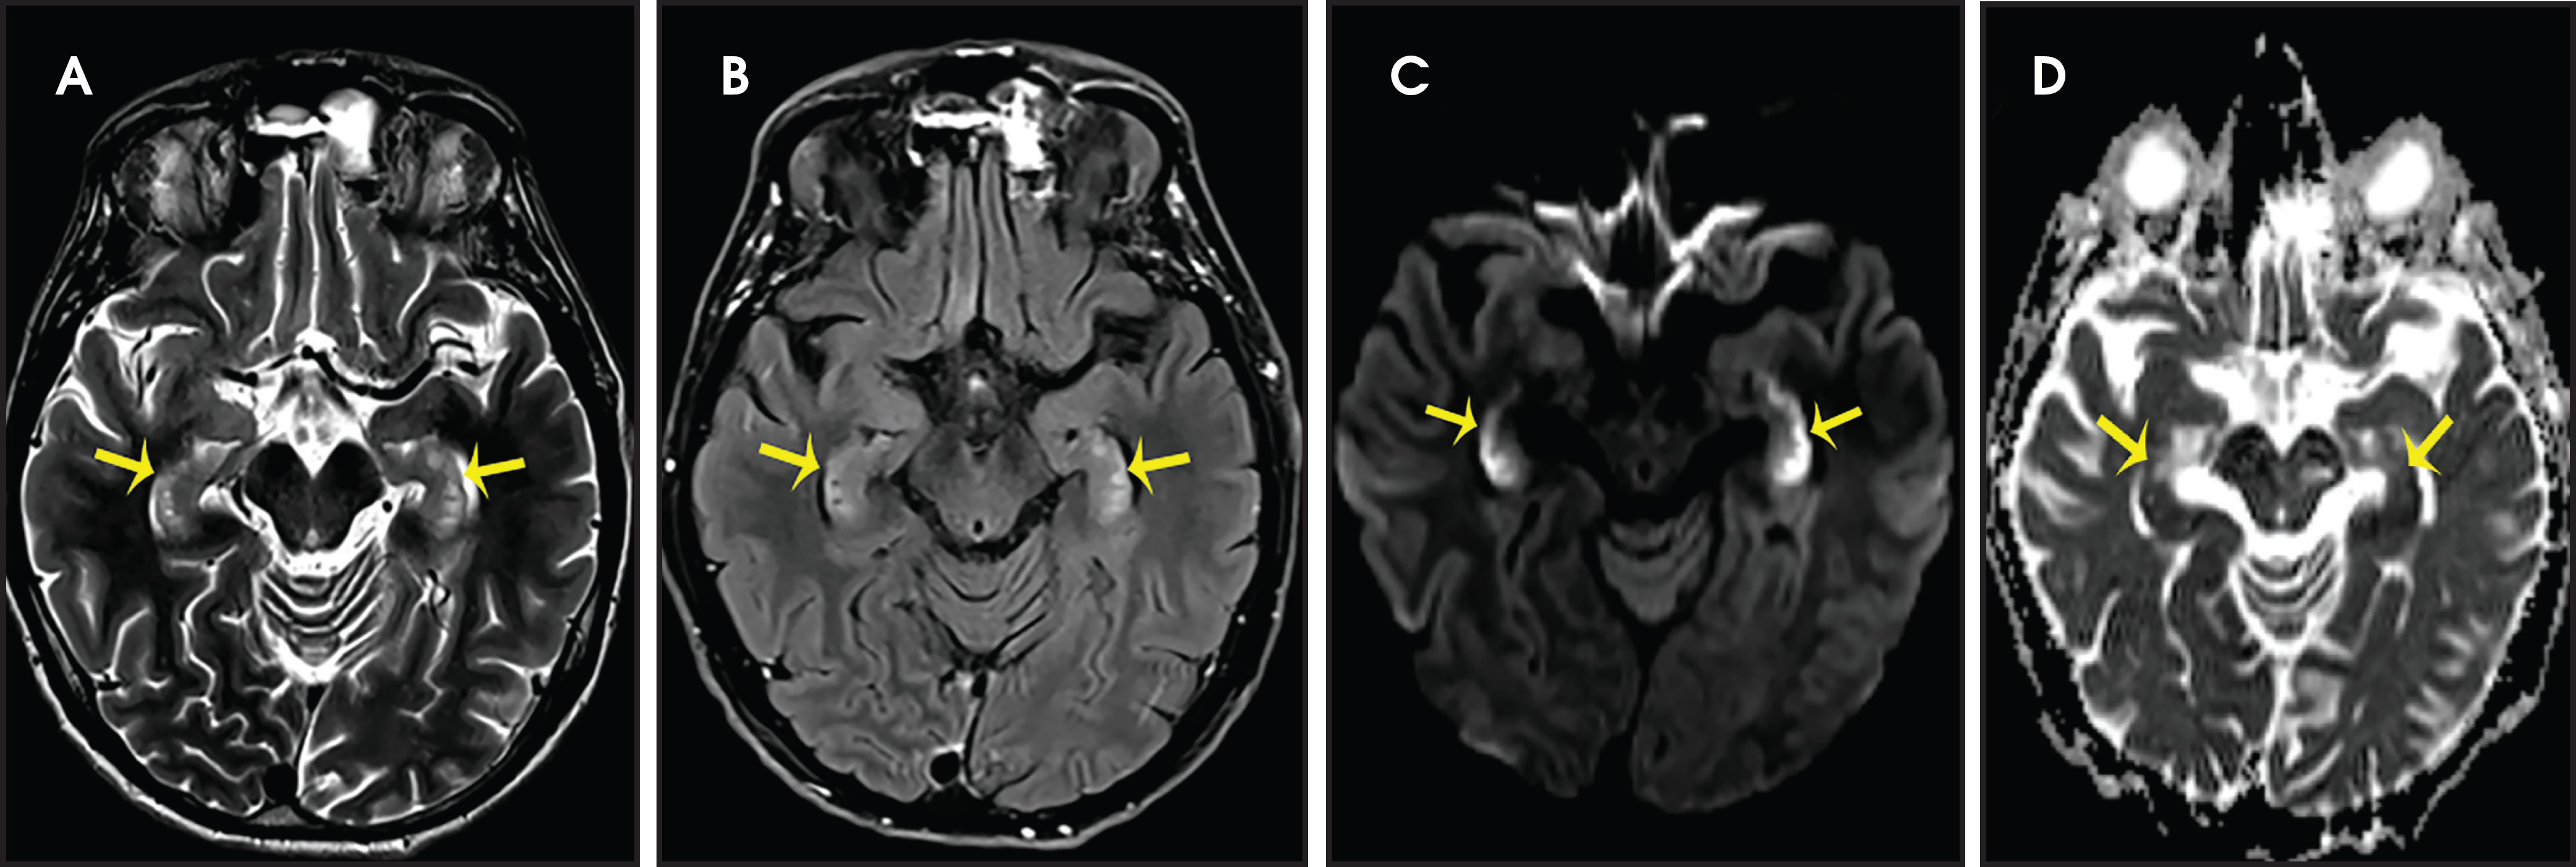
Hashimoto encephalopathy, associated with autoimmune disease involving the thyroid, can present either as neurological deficits or as progressive cognitive decline with dementia or psychosis.8 Seizures are usually present in both forms, and anti-thyroid antibodies, in particular antithyroid peroxidase (anti-TPO) and antithyroglobulin (anti-TG), can be detected. Imaging findings are potentially reversible and are characteristic for bilateral symmetric involvement of the temporal lobes and basal ganglia, with diffuse increased signal intensities on T2-WI and FLAIR sequences (Figure 6).8
Anti-N-Methyl-D-Aspartate Receptor (NMDA R) - Encephalopathy
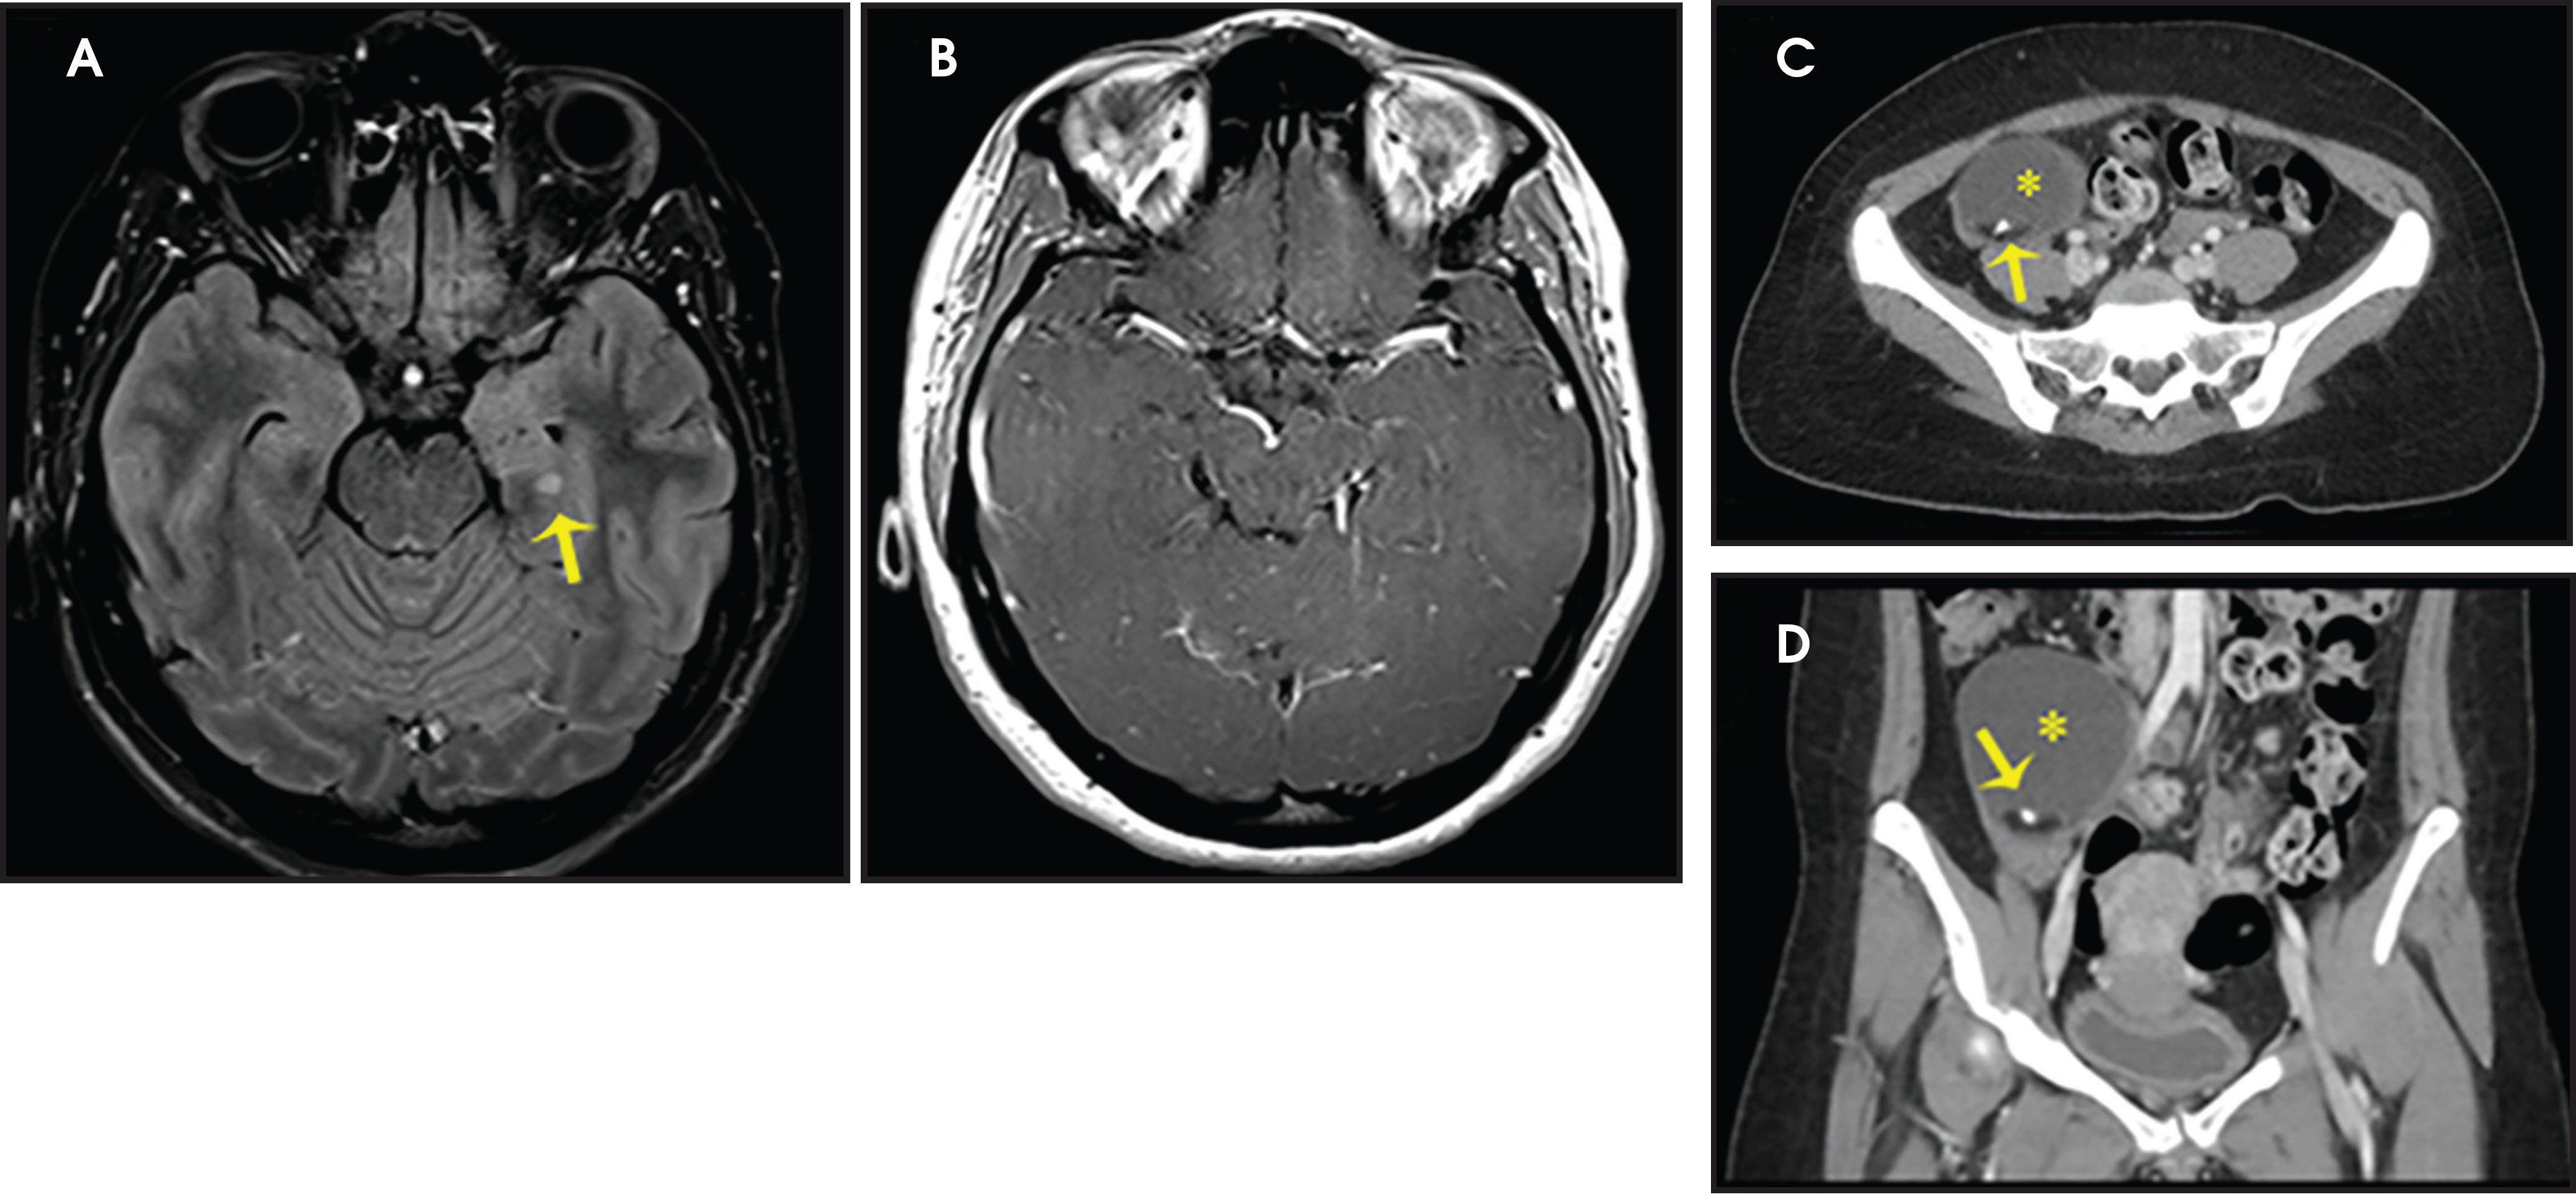
NMDA R-encephalopathy is associated with serum or cerebrospinal fluid autoantibodies against subunits of the NMDA receptor. Signs include auditory and visual hallucinations, behavior changes, impaired consciousness, seizures, movement disorders, and autonomic dysfunction.9 In 59% of cases, an ovarian tumor can be identified and the overall associated mortality is up to 25%.9Diagnostic imaging is often normal but may demonstrate hyperintensities of the hippocampi, cerebellar and cerebral cortex, basal ganglia, brainstem, fronto-basal, and insular regions, and should include appropriate studies to rule out an ovarian teratoma (Figure 7).9
Limbic Encephalitis (LE)
LE can be the paraneoplastic manifestation of an underlying, often undetected, malignancy associated with various antibodies against neuronal and tumor cells or it can be non-neoplastic, and in that case most commonly identifiable through the presence of voltage-gated, potassium channel antibodies (VGKG).10Onset is generally subacute with temporal lobe seizures, memory loss, and confusion. Temporomesial changes with uni- or bilateral swelling are visible on T2-WI and FLAIR sequences and may progress to atrophy (Figure 8).10
Metabolic Etiologies
Hypoxic Encephalopathy
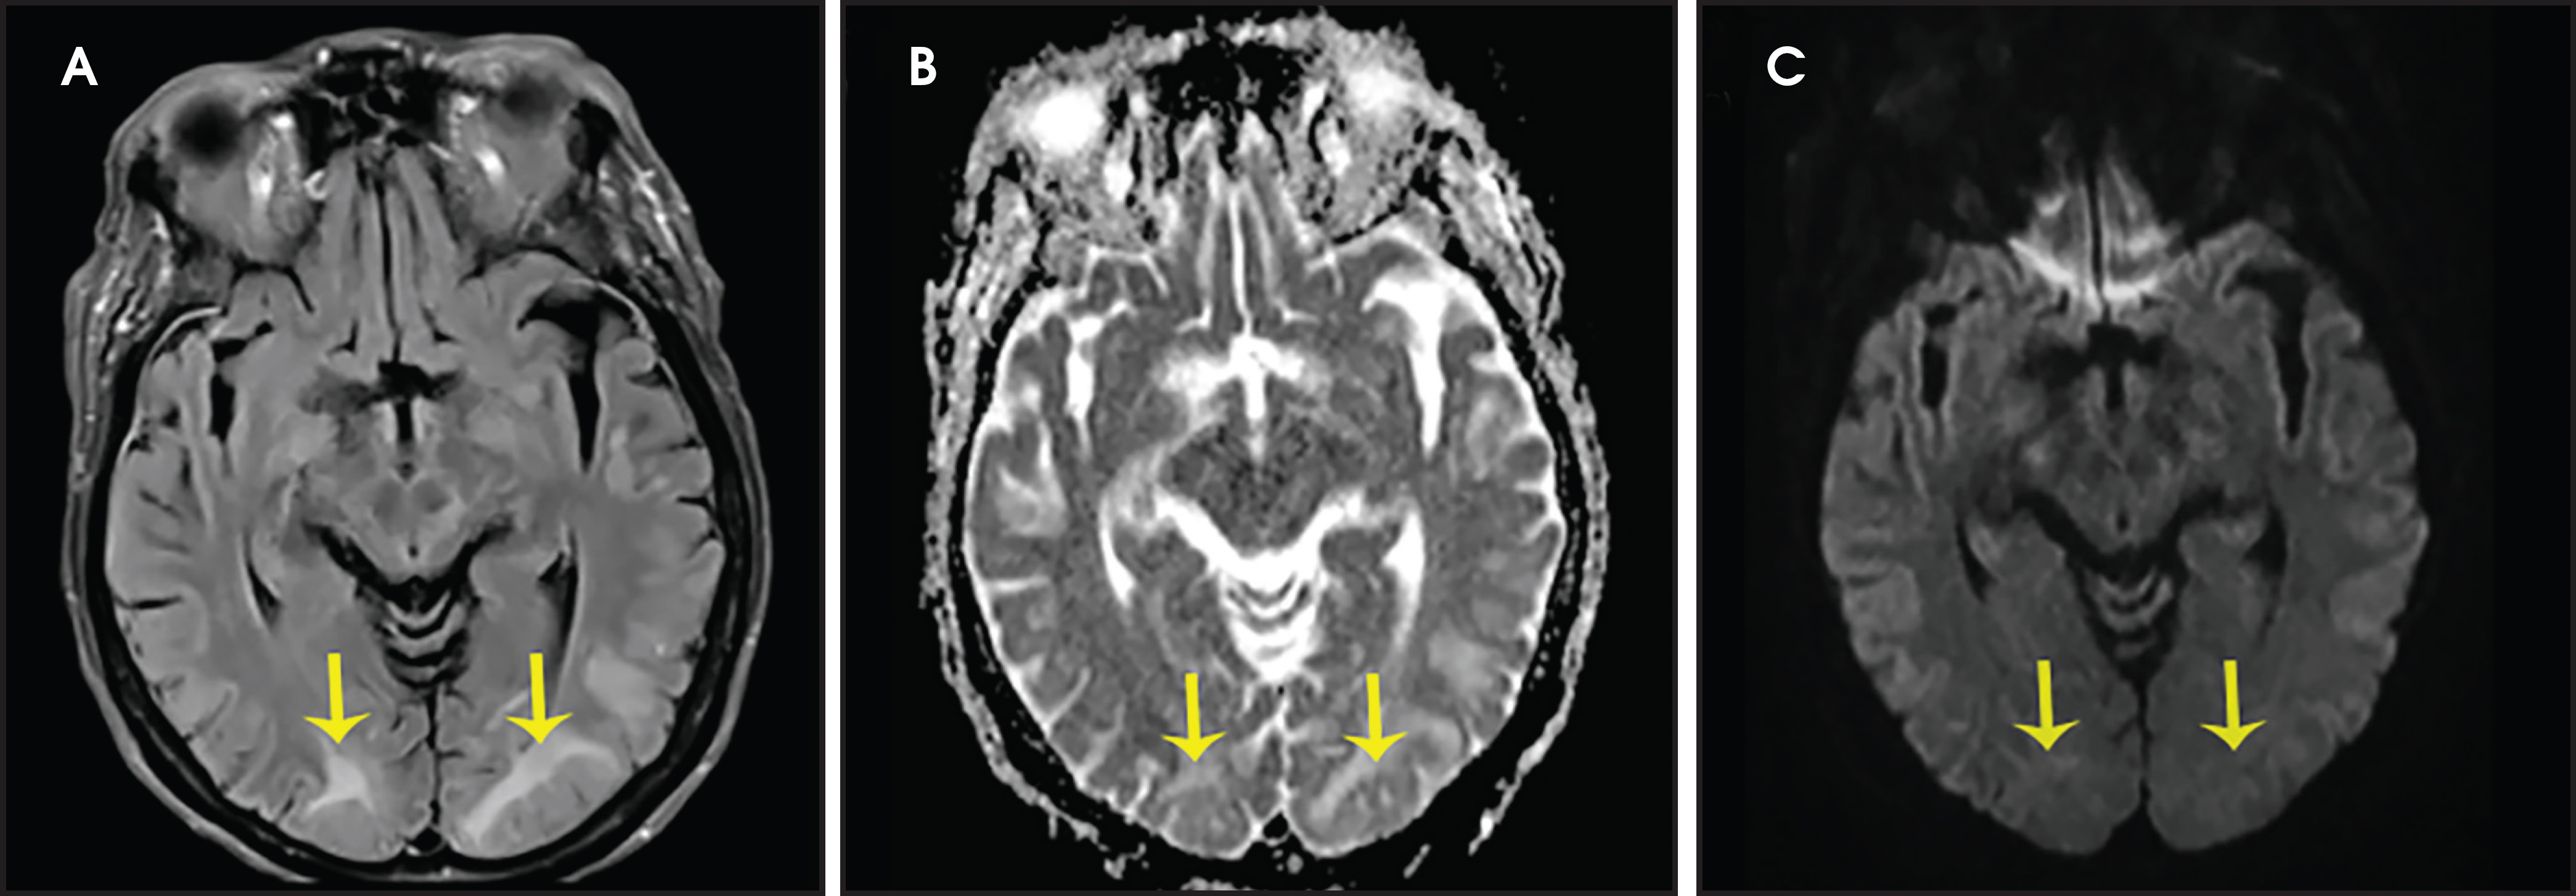
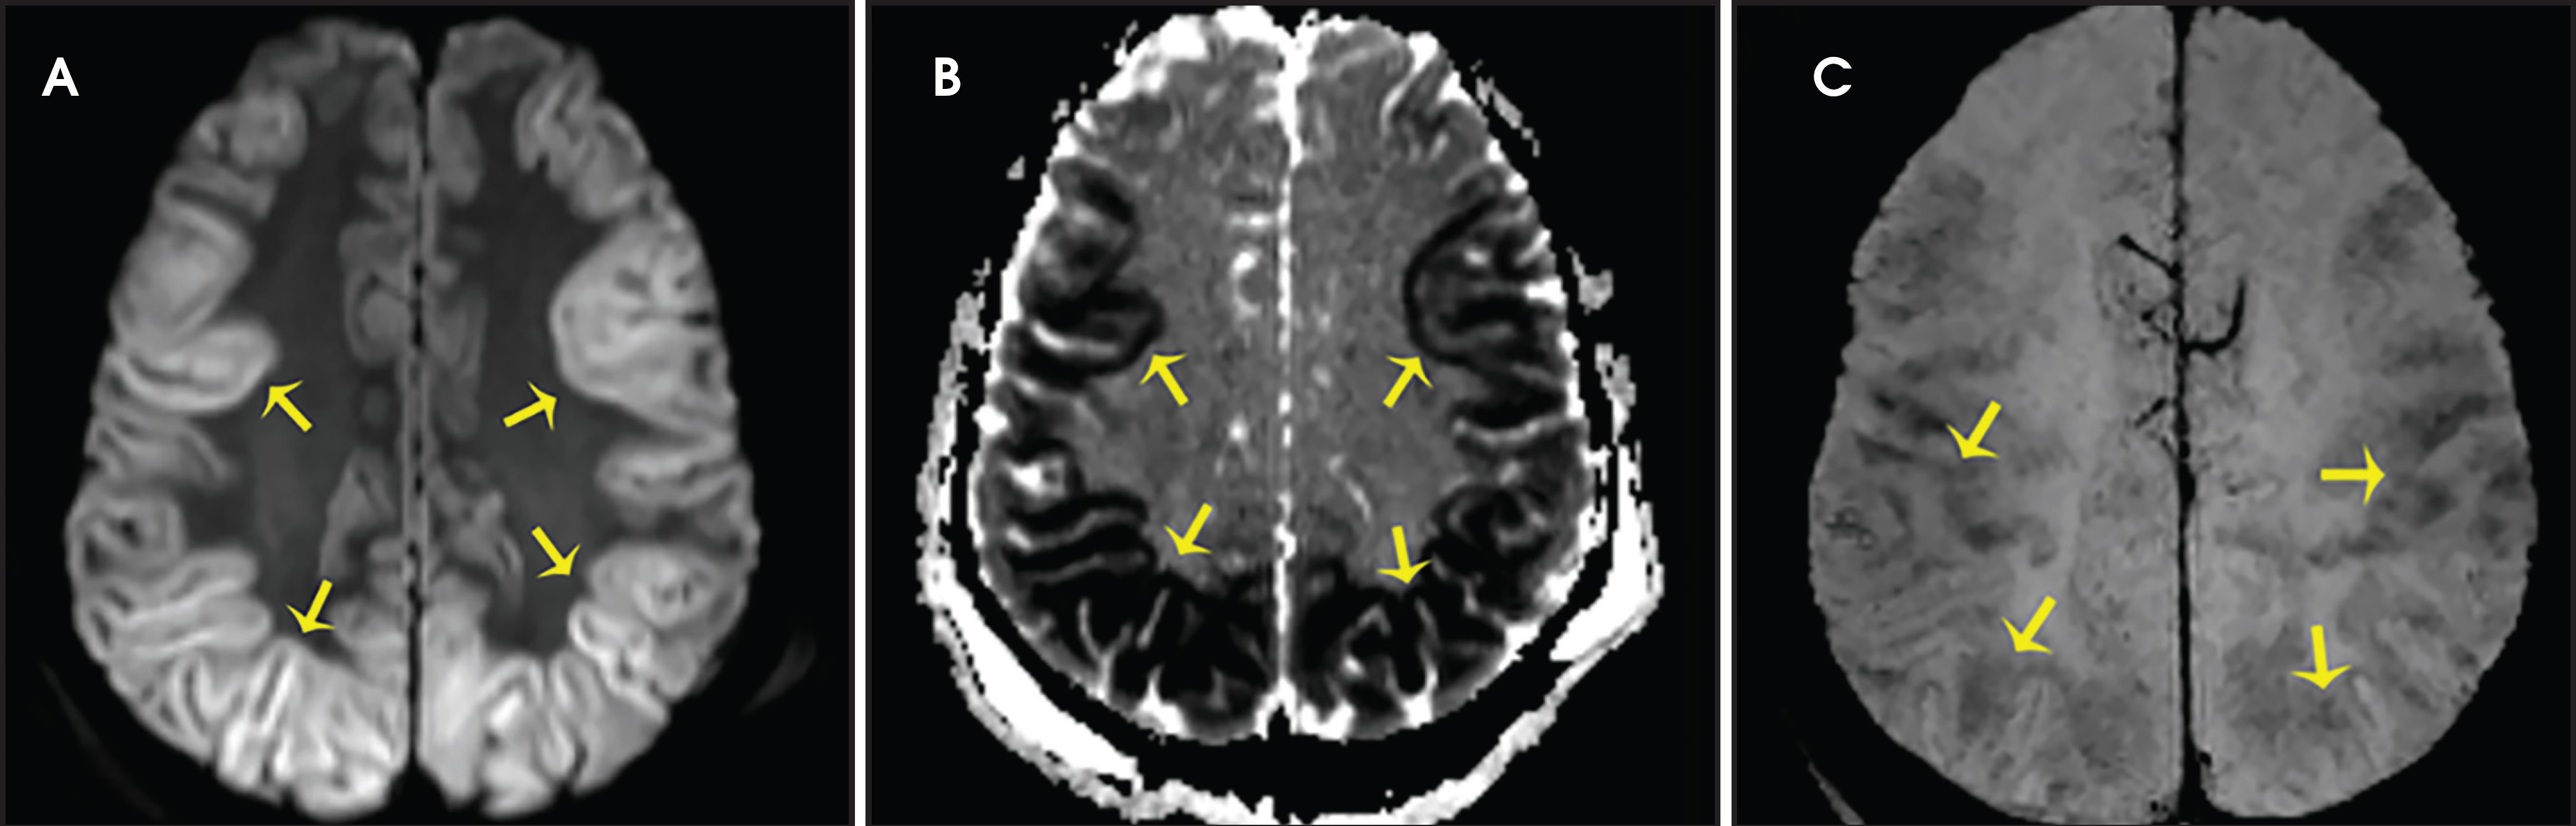
Hypoxic encephalopathy occurs because of either hypoperfusion or hypoxia, and the duration of the insult, the degree of perfusion, temperature, and glucose levels determine the extent of the cerebral injury.1 Structures of the gray matter, such as cerebral cortex, basal ganglia, or hippocampi, are usually affected.1 DWI usually identifies hyperintensities within one hour after insult, followed by increased signal intensities on T2-WI after 24 h. After 21 days, laminar necrosis of the cortex corresponds to T1 shortening (Figure 9).1
Nonketotic hyperglycemic hemichorea
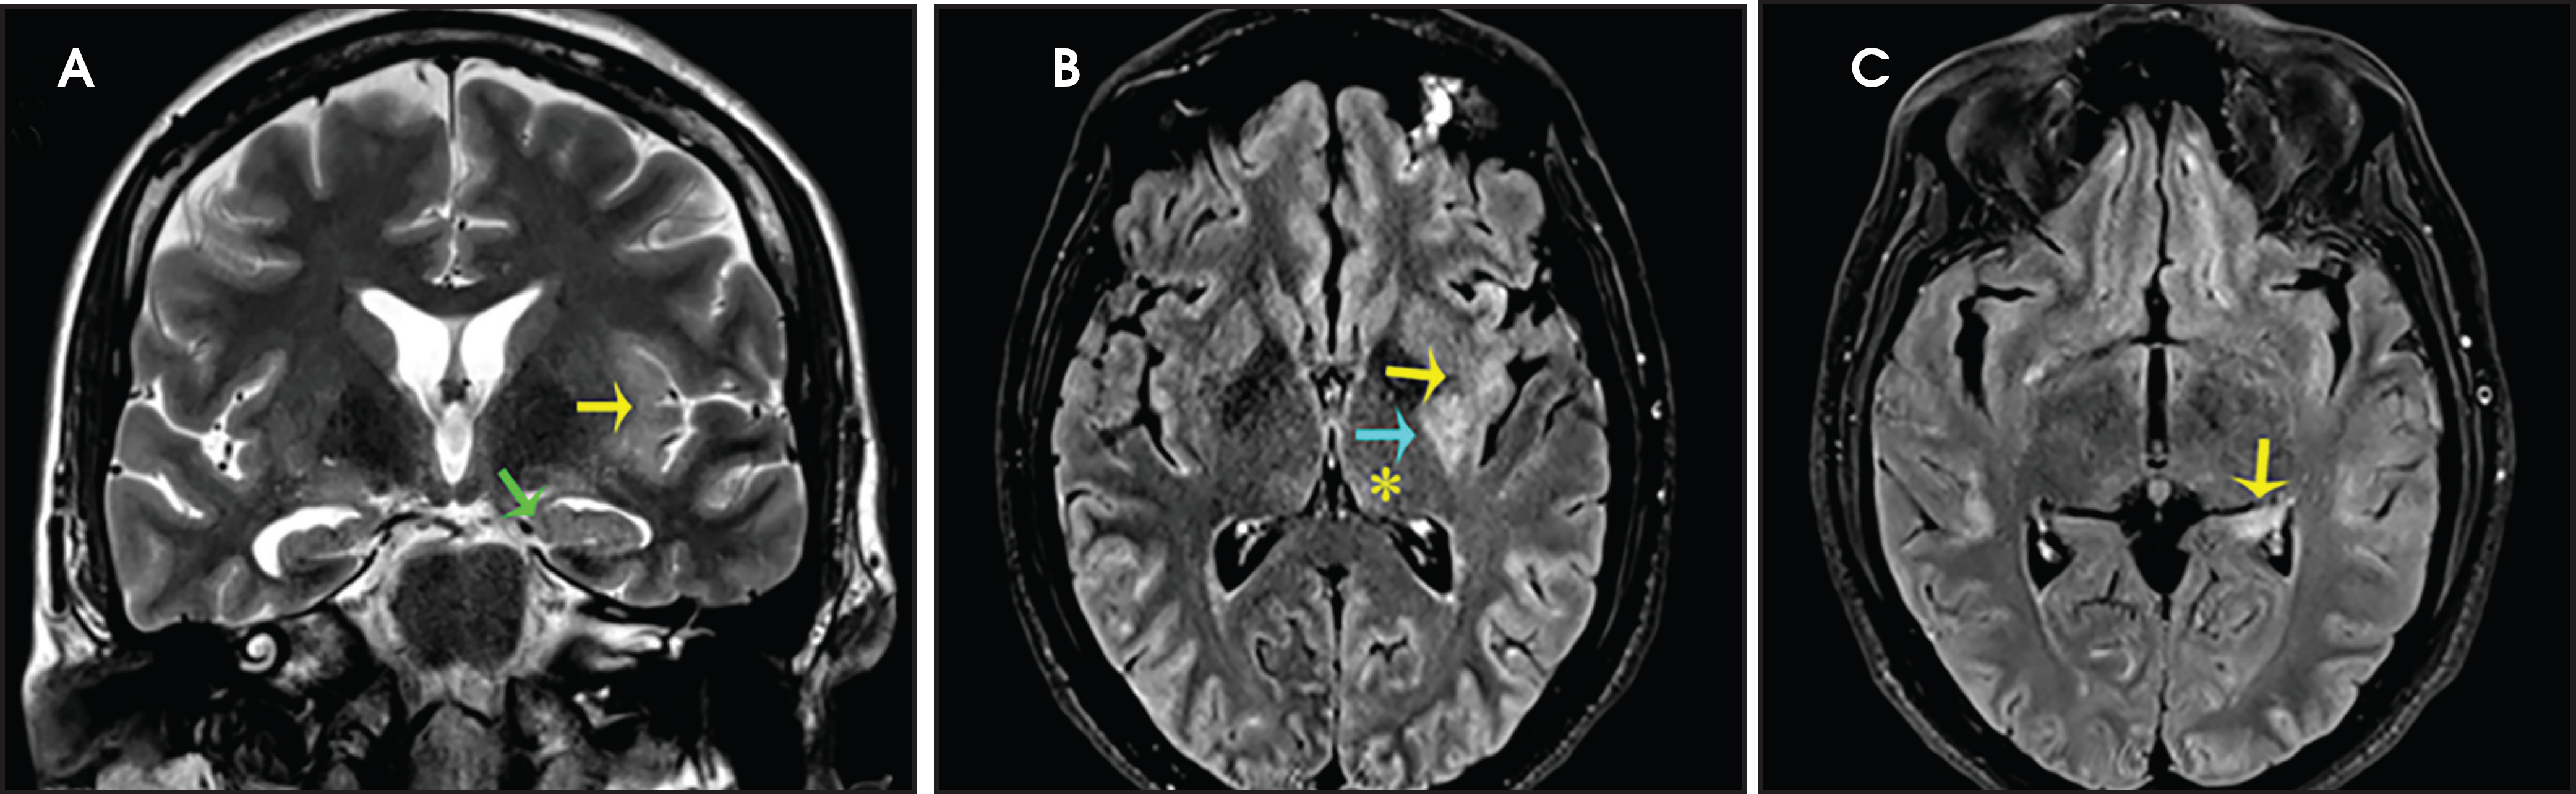
Nonketotic hyperglycemic hemichorea is a rare treatable manifestation of diabetes mellitus usually involving the unilateral or, more commonly, bilateral caudate nuclei and the putamina.1 It clinically presents with involuntary movements with elevated blood glucose levels and absence of ketones. T1-WI shows increased signal intensities of the involved structures with variable imaging findings on T2-WI (Figure 10).1
Hypoglycemic Encephalopathy
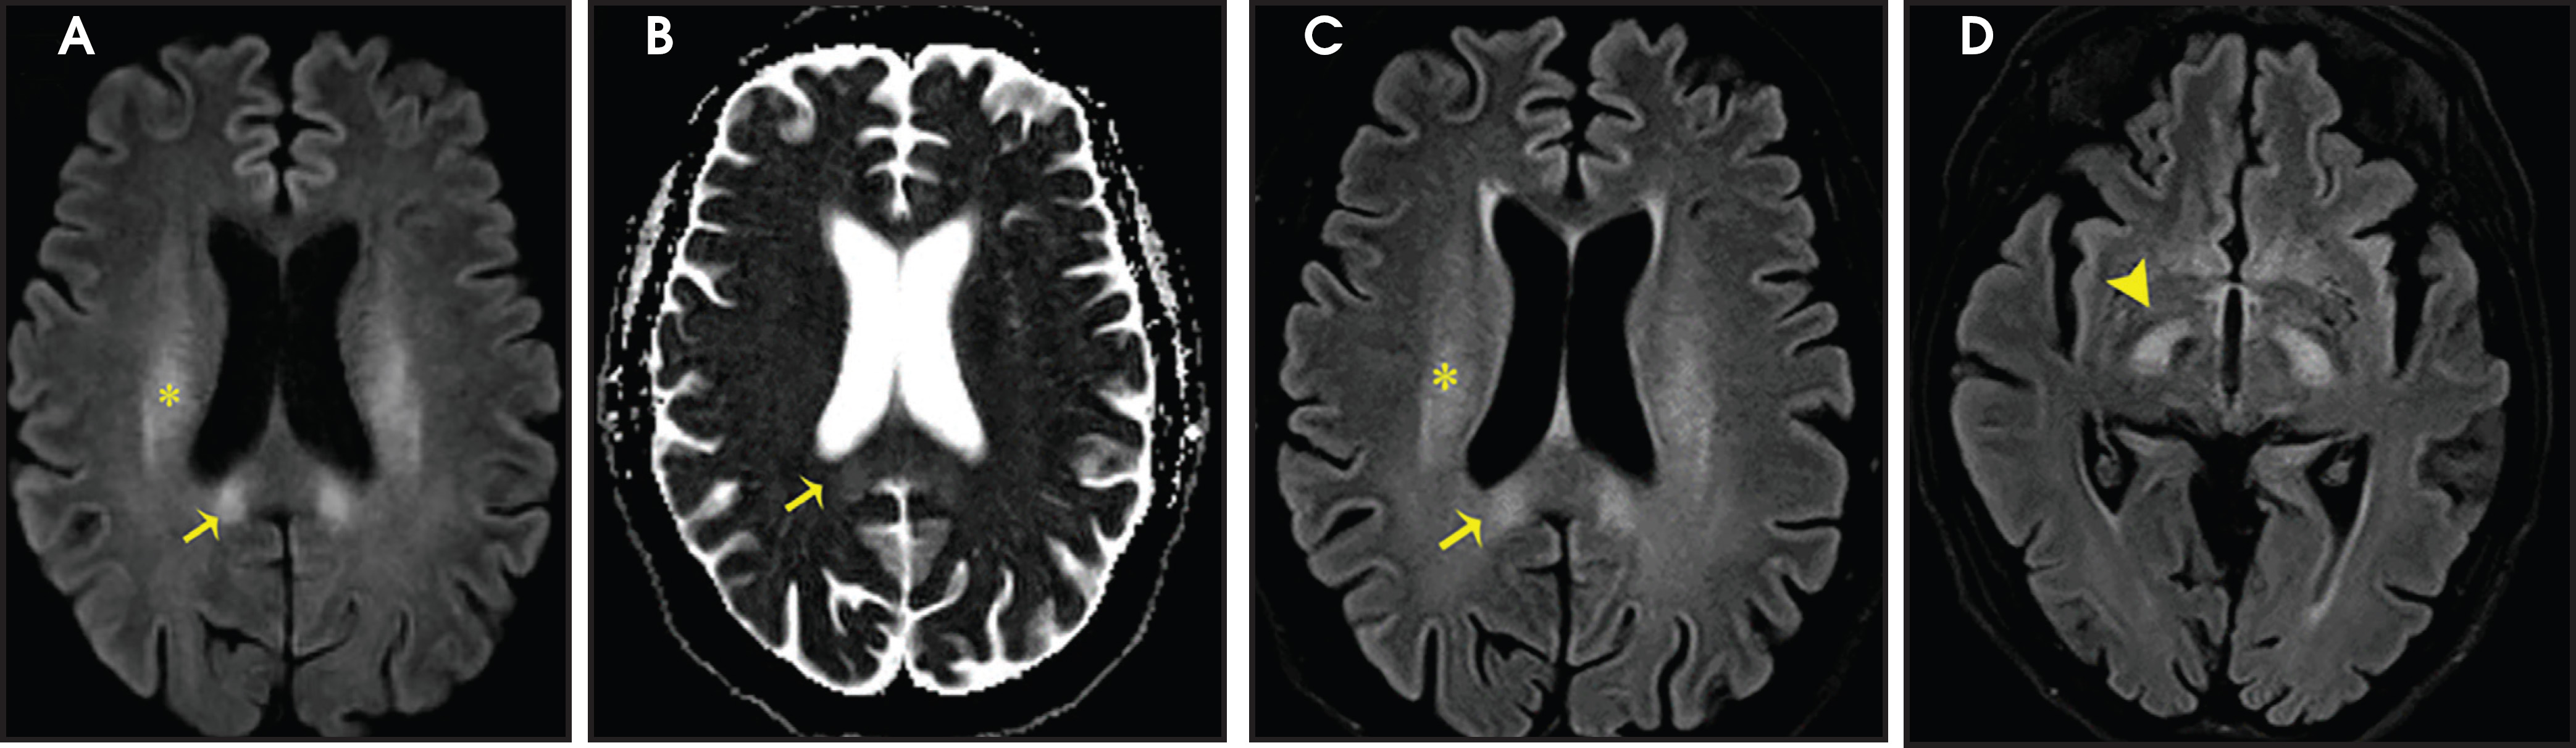
Decreased serum glucose levels lower than 50 mg/dl are most commonly associated with an unintentional overdose of sulfonylurea drugs or insulin in diabetics. Cerebral structures affected are the cortex, hippocampus, and basal ganglia, but involvement may be limited to white matter structures of the corpus callosum, internal capsule, and corona radiata in milder cases.1 Bilateral T2 hyperintensity with restricted diffusion on DWI are characteristic imaging findings and involvement of the basal ganglia yields a less optimistic prognosis of this potentially reversible condition (Figure 11).1
Hepatic Encephalopathy (HE)
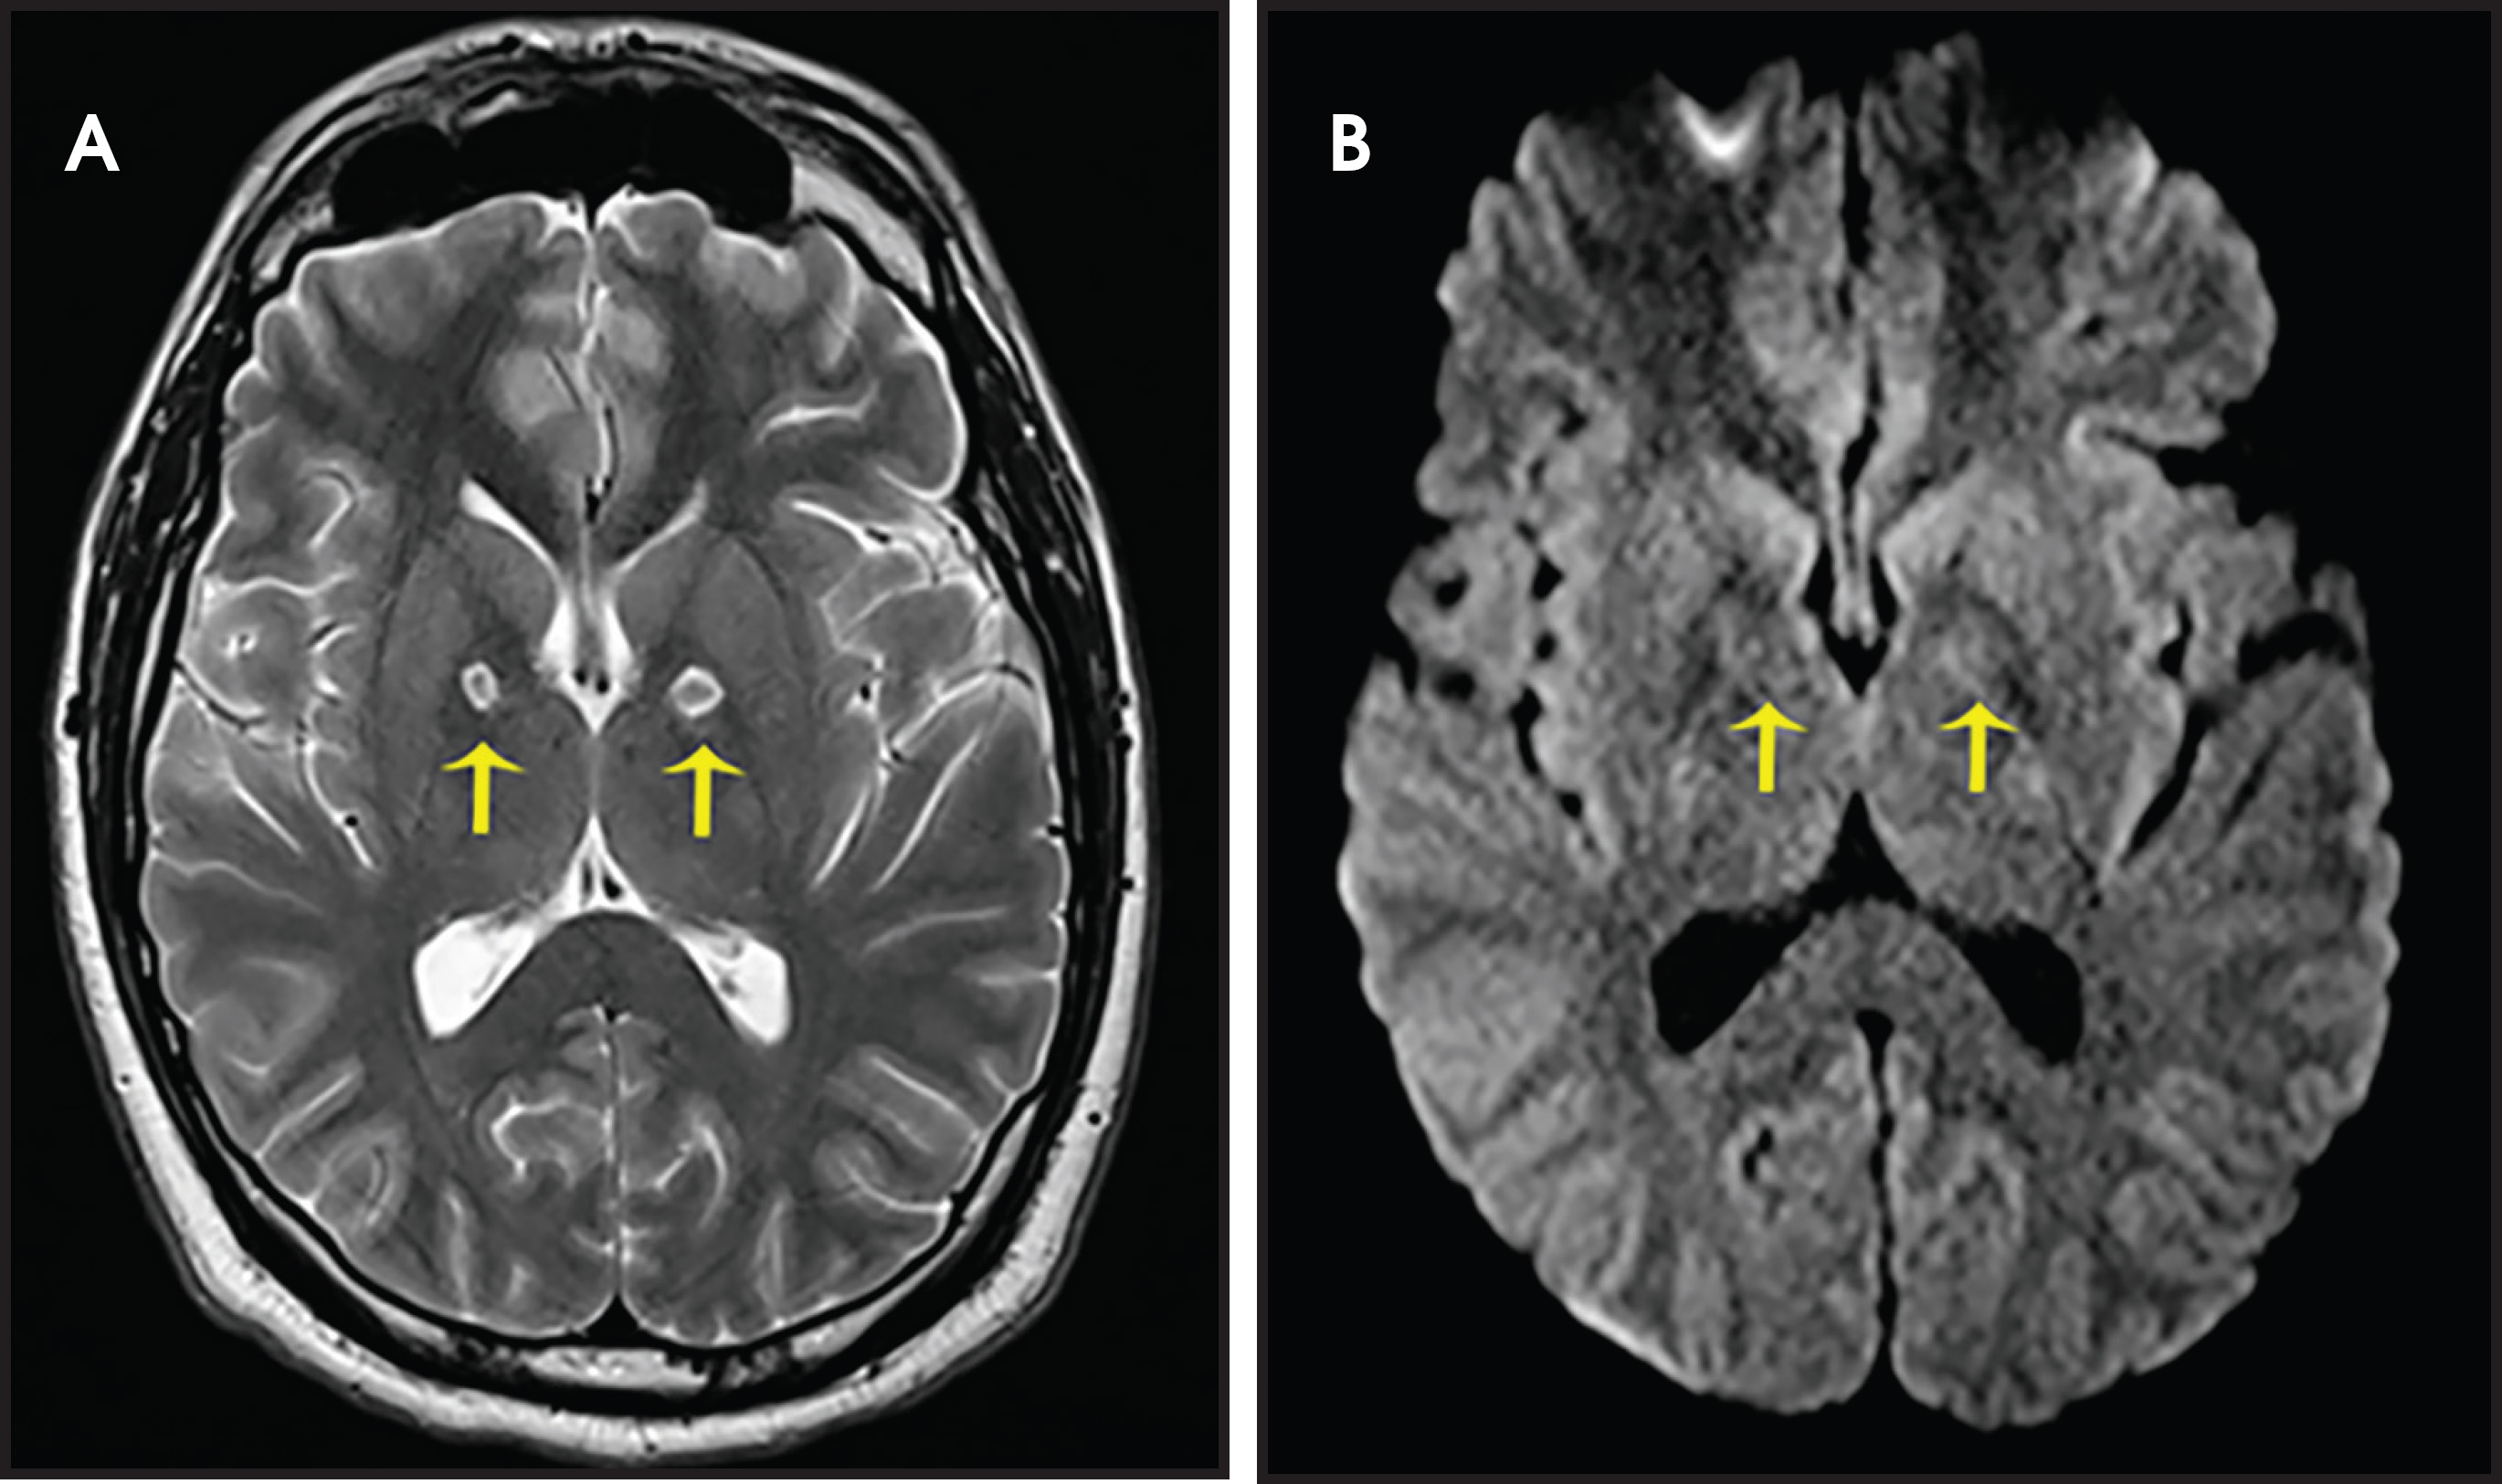
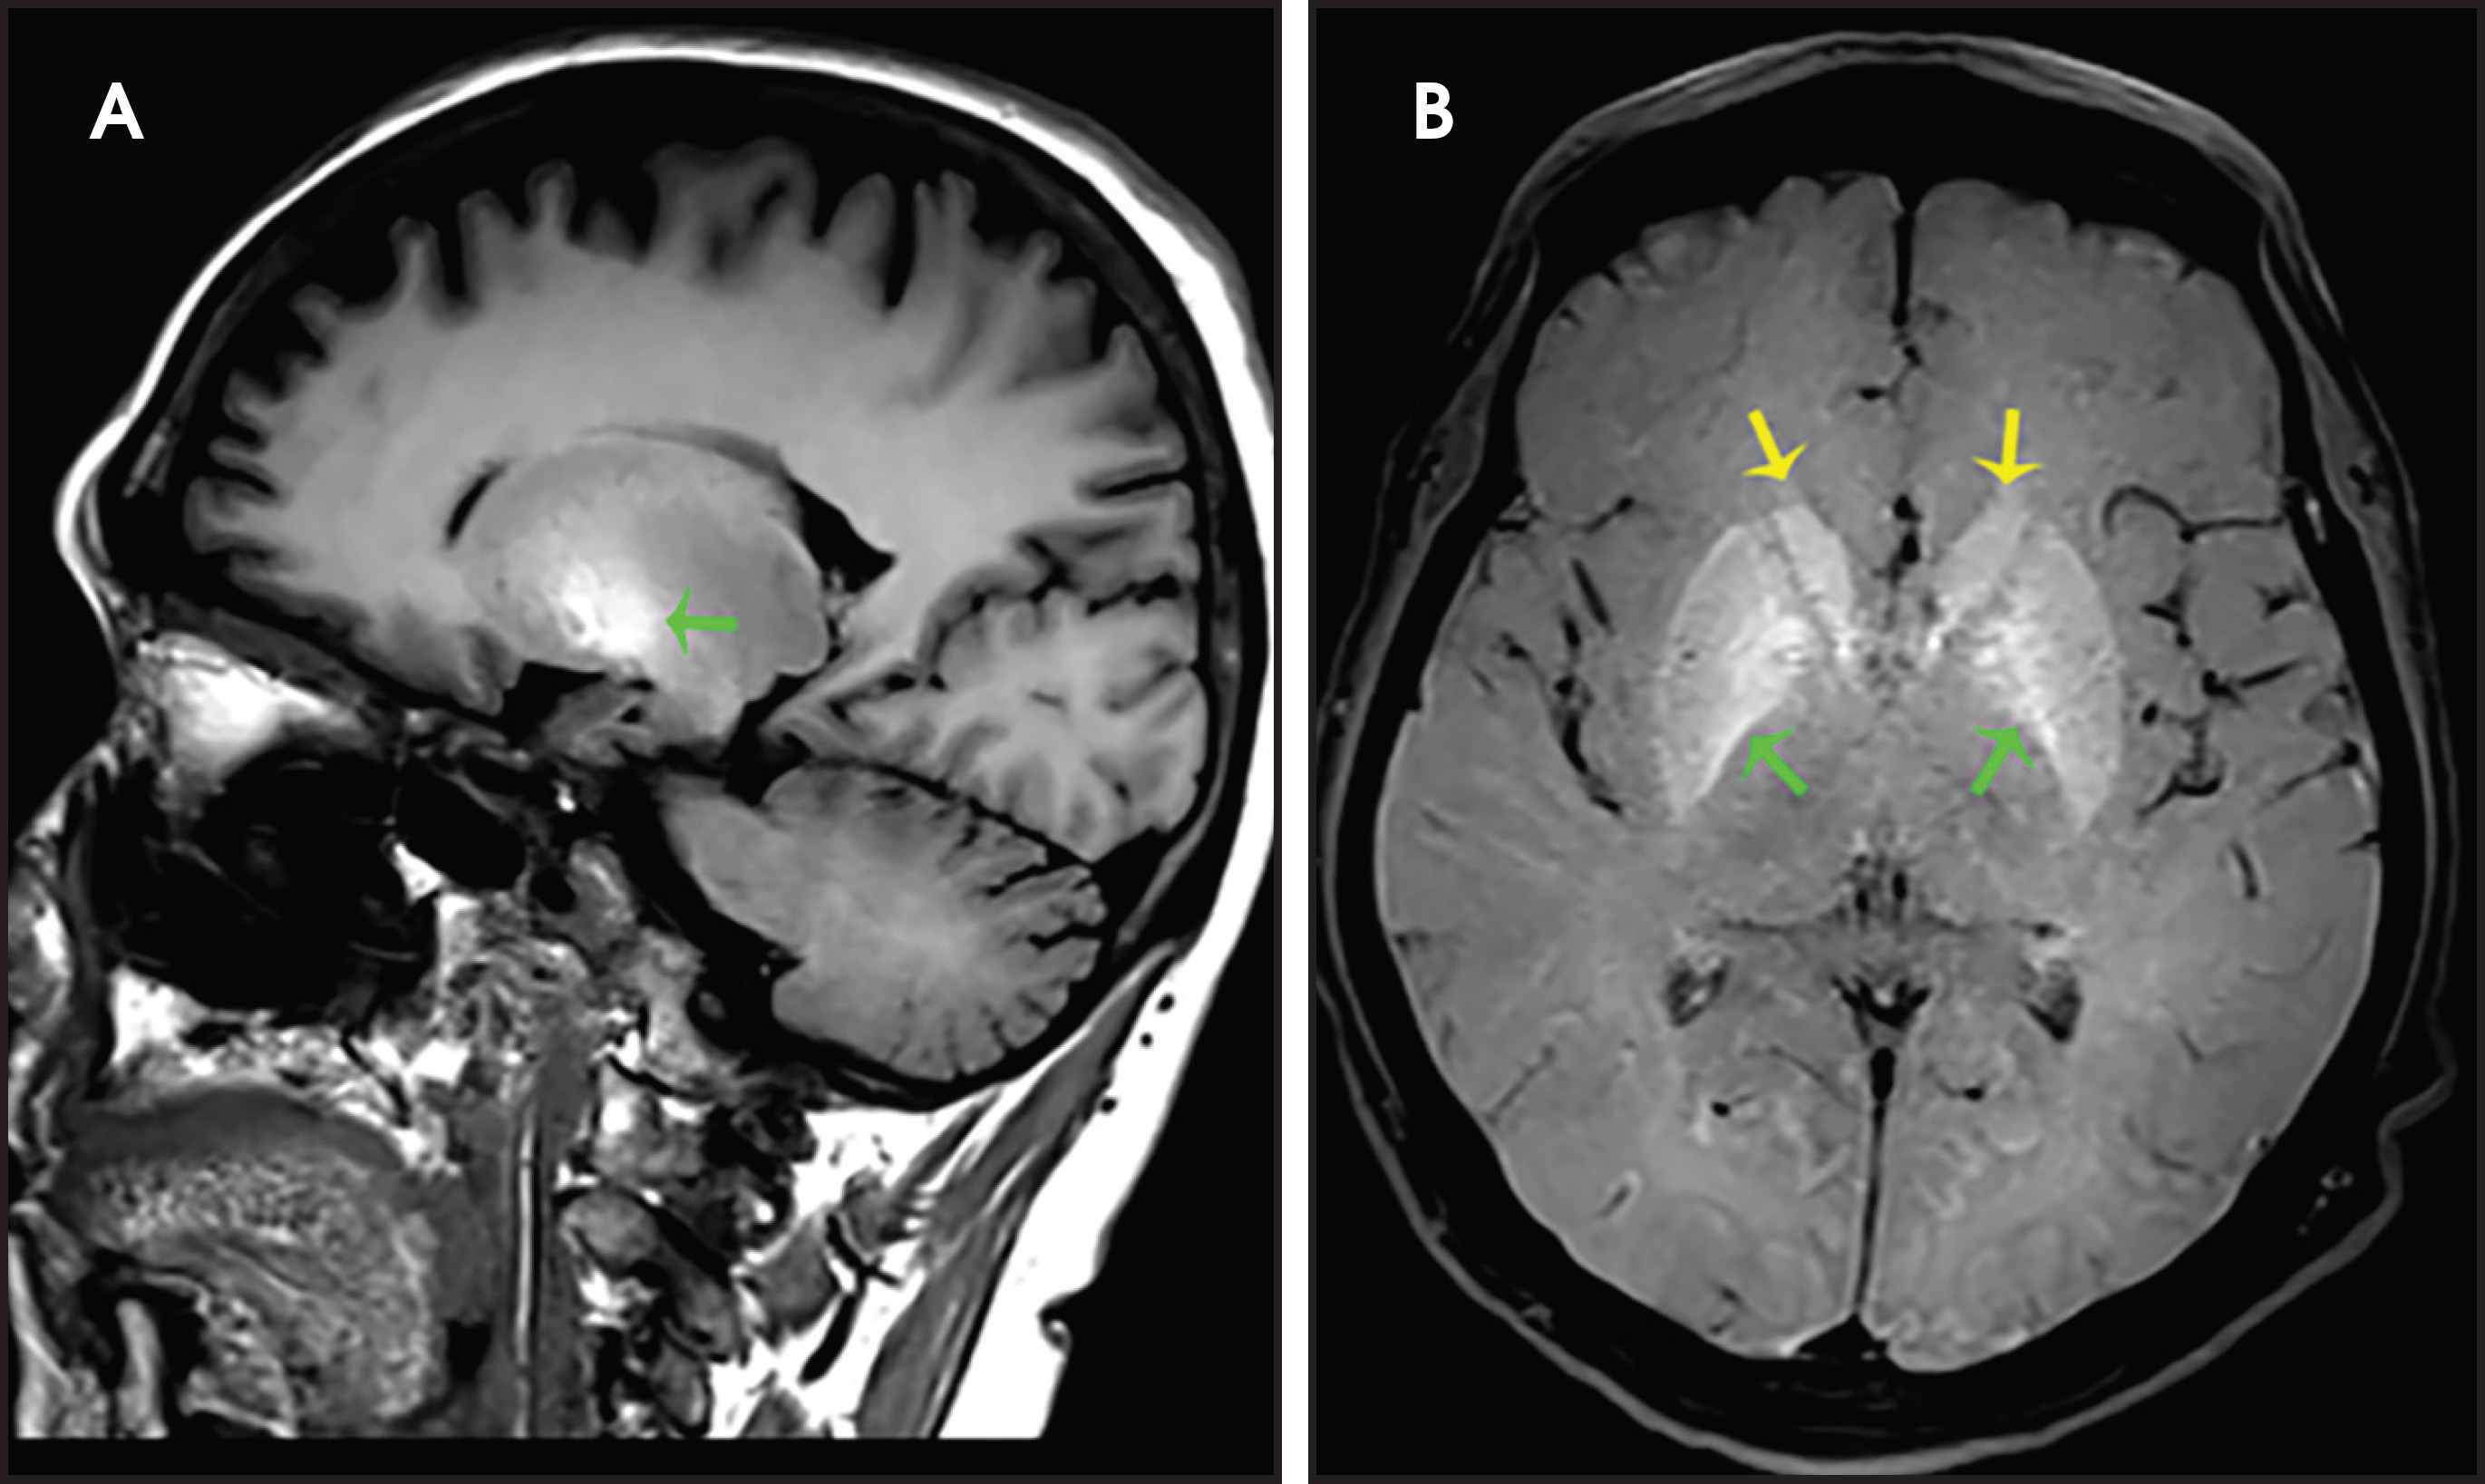
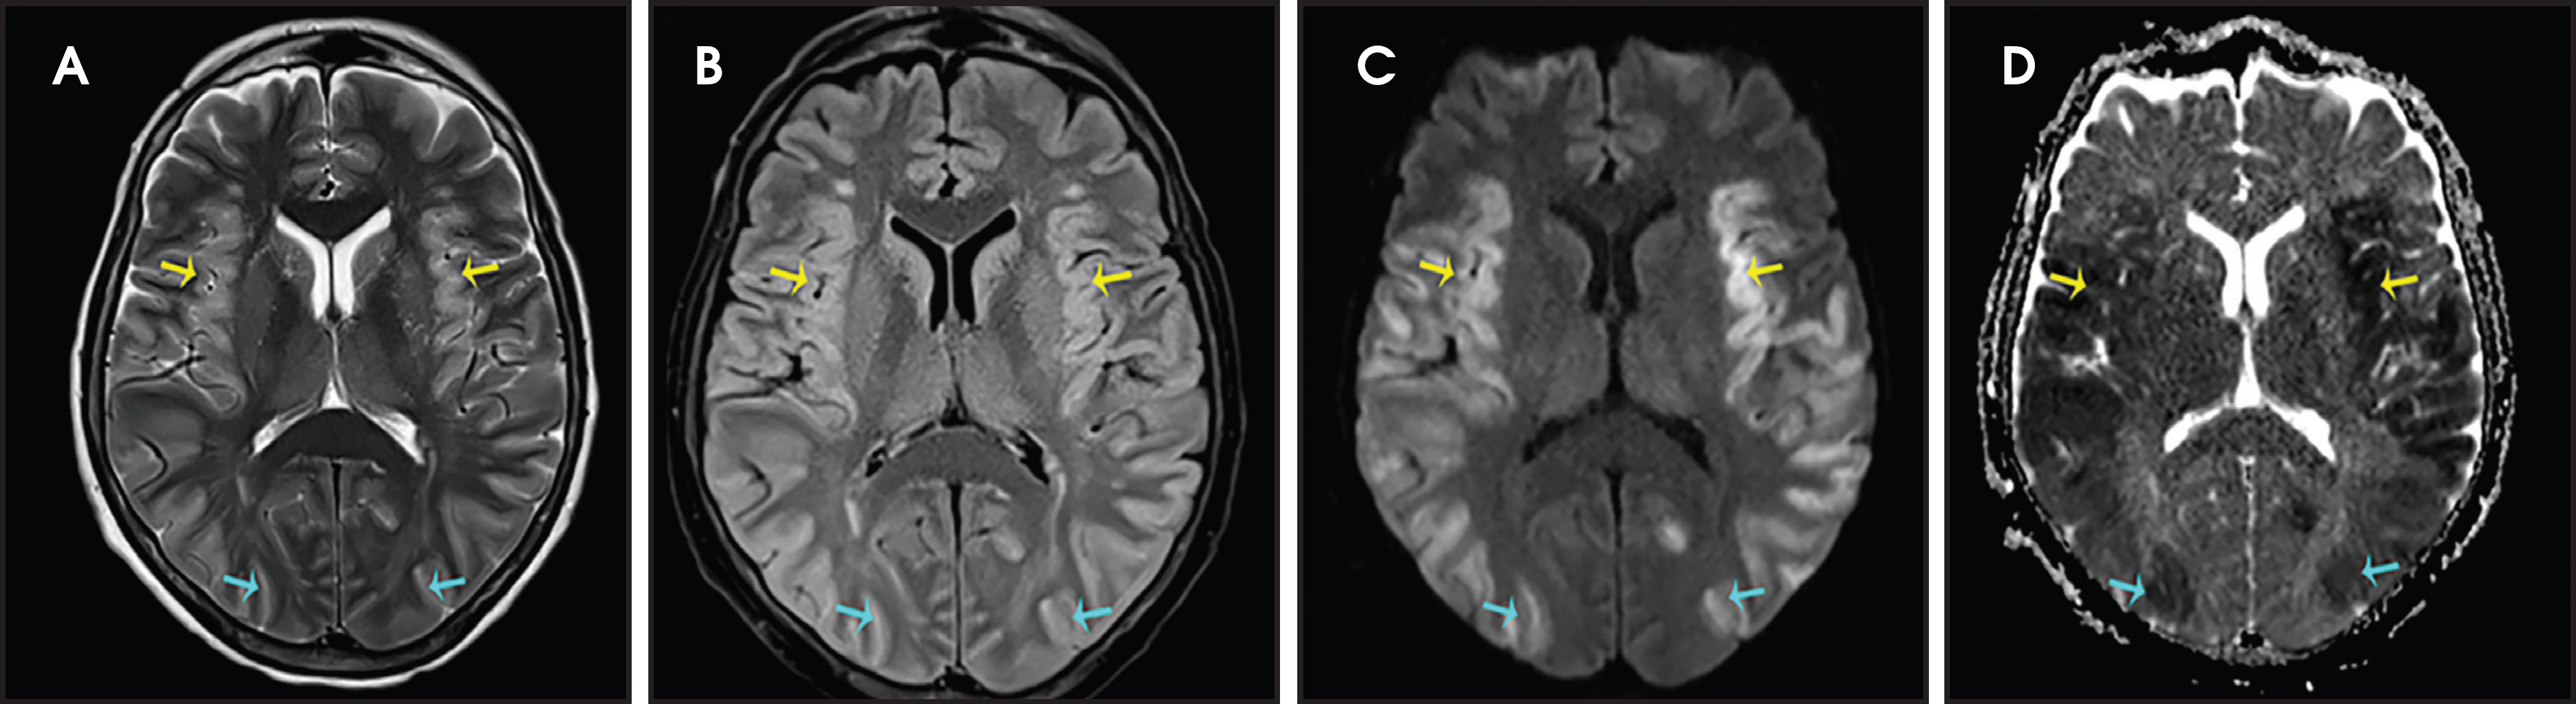
HE, which entails a wide range of symptoms owing to liver dysfunction such as cirrhosis and subsequent increase of usually metabolized substances, can present as an acute or chronic manifestation.4 Acute HE is often fatal, while chronic HE can be relapsing or persistent with dementia, parkinsonism, and myelopathy dominating the clinical picture.1 Involvement of the globi pallidi, subthalamic regions, and midbrain corresponding to hyperintensities on T1-WI, and T2 hyperintensity of the corticospinal tracts, the periventricular white matter, thalami, and internal capsules are characteristic imaging findings (Figures 12, 13).1,4
Hyperammonemic Encephalopathy
Central Pontine Myelinolysis / Osmotic Demyelination
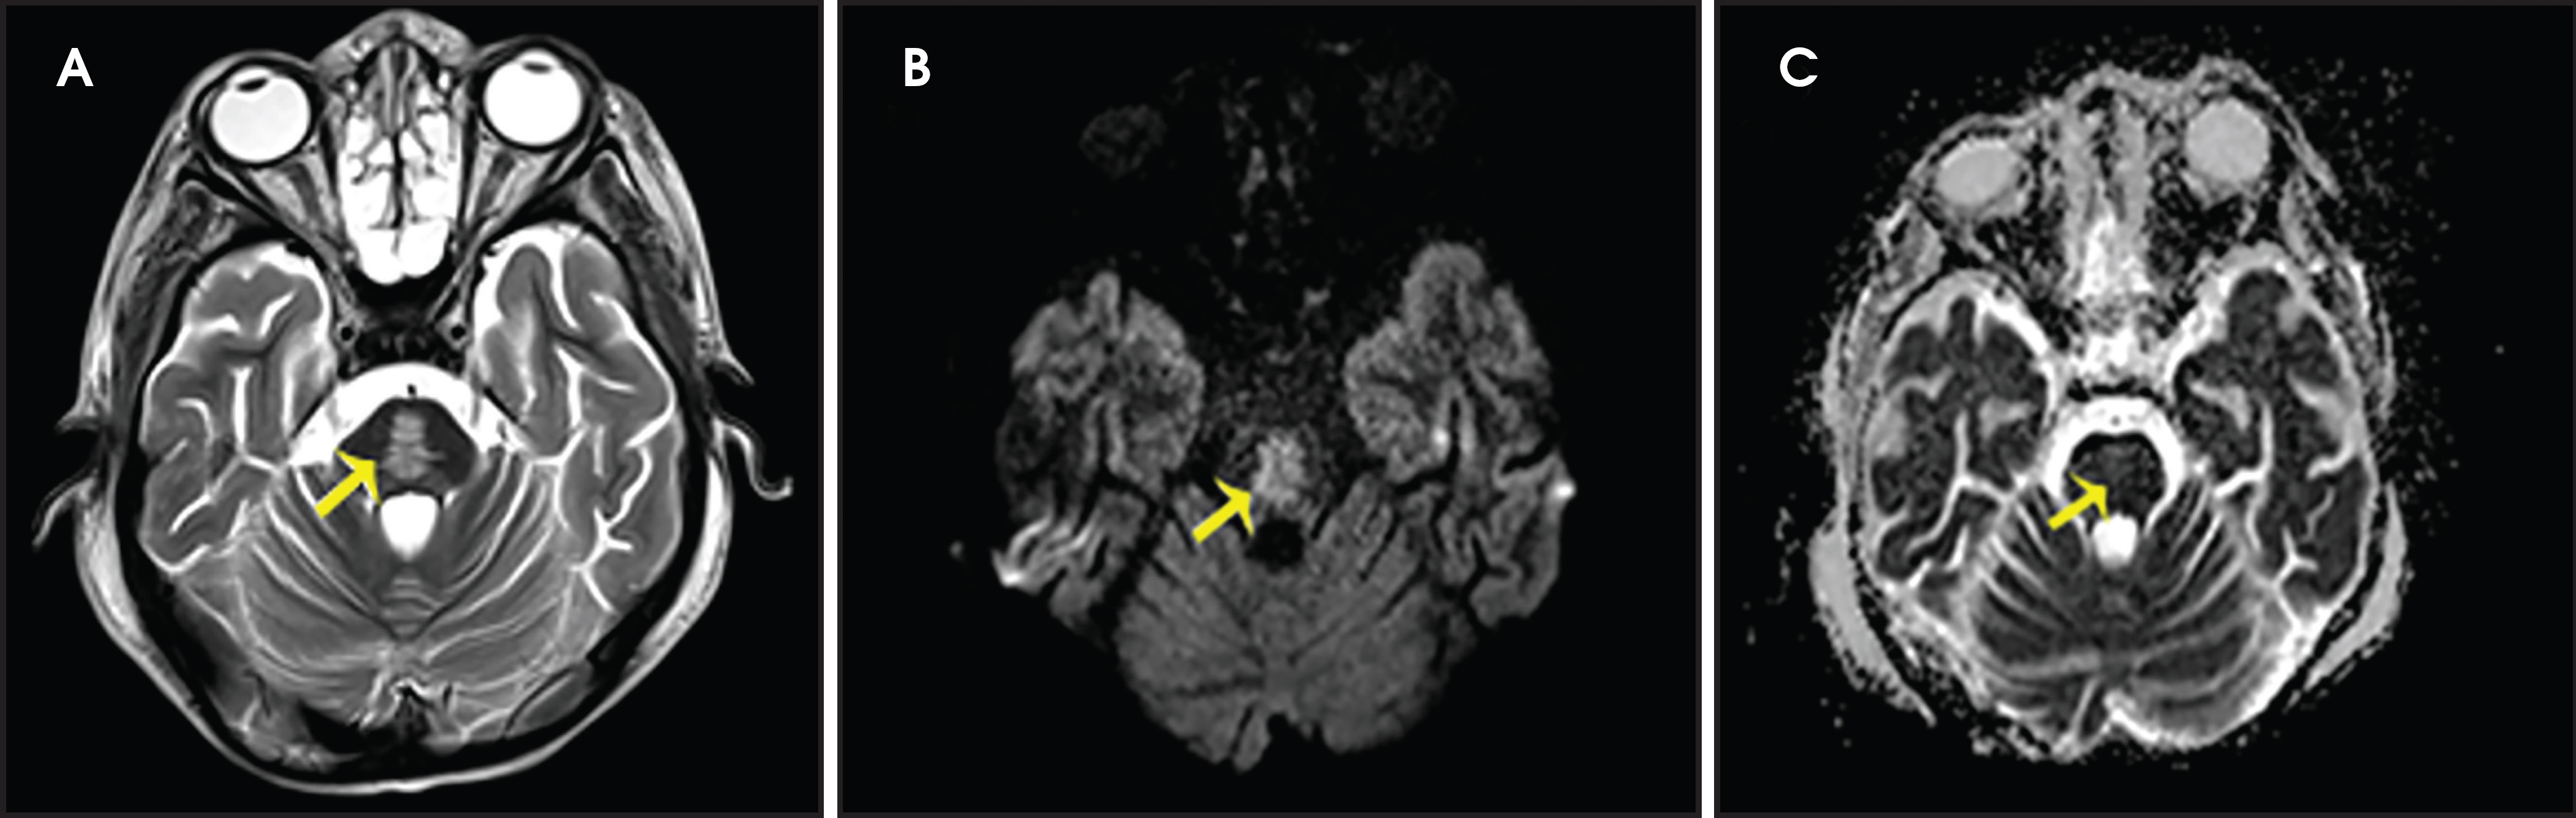
The overly rapid correction of hyponatremia is the classic association, which initially presents as an altered sensorium and progresses to spasticity, and pseudo-bulbar palsy, as well as locked-in-syndrome, after 2-7 days.1 Structures involved are the central pons, thalamus, putamen, and lateral geniculate bodies, with early restriction on DWI followed by hyperintensities on T2-WI and FLAIR sequences (Figure 15).1,4
Wernicke Encephalopathy (WE)
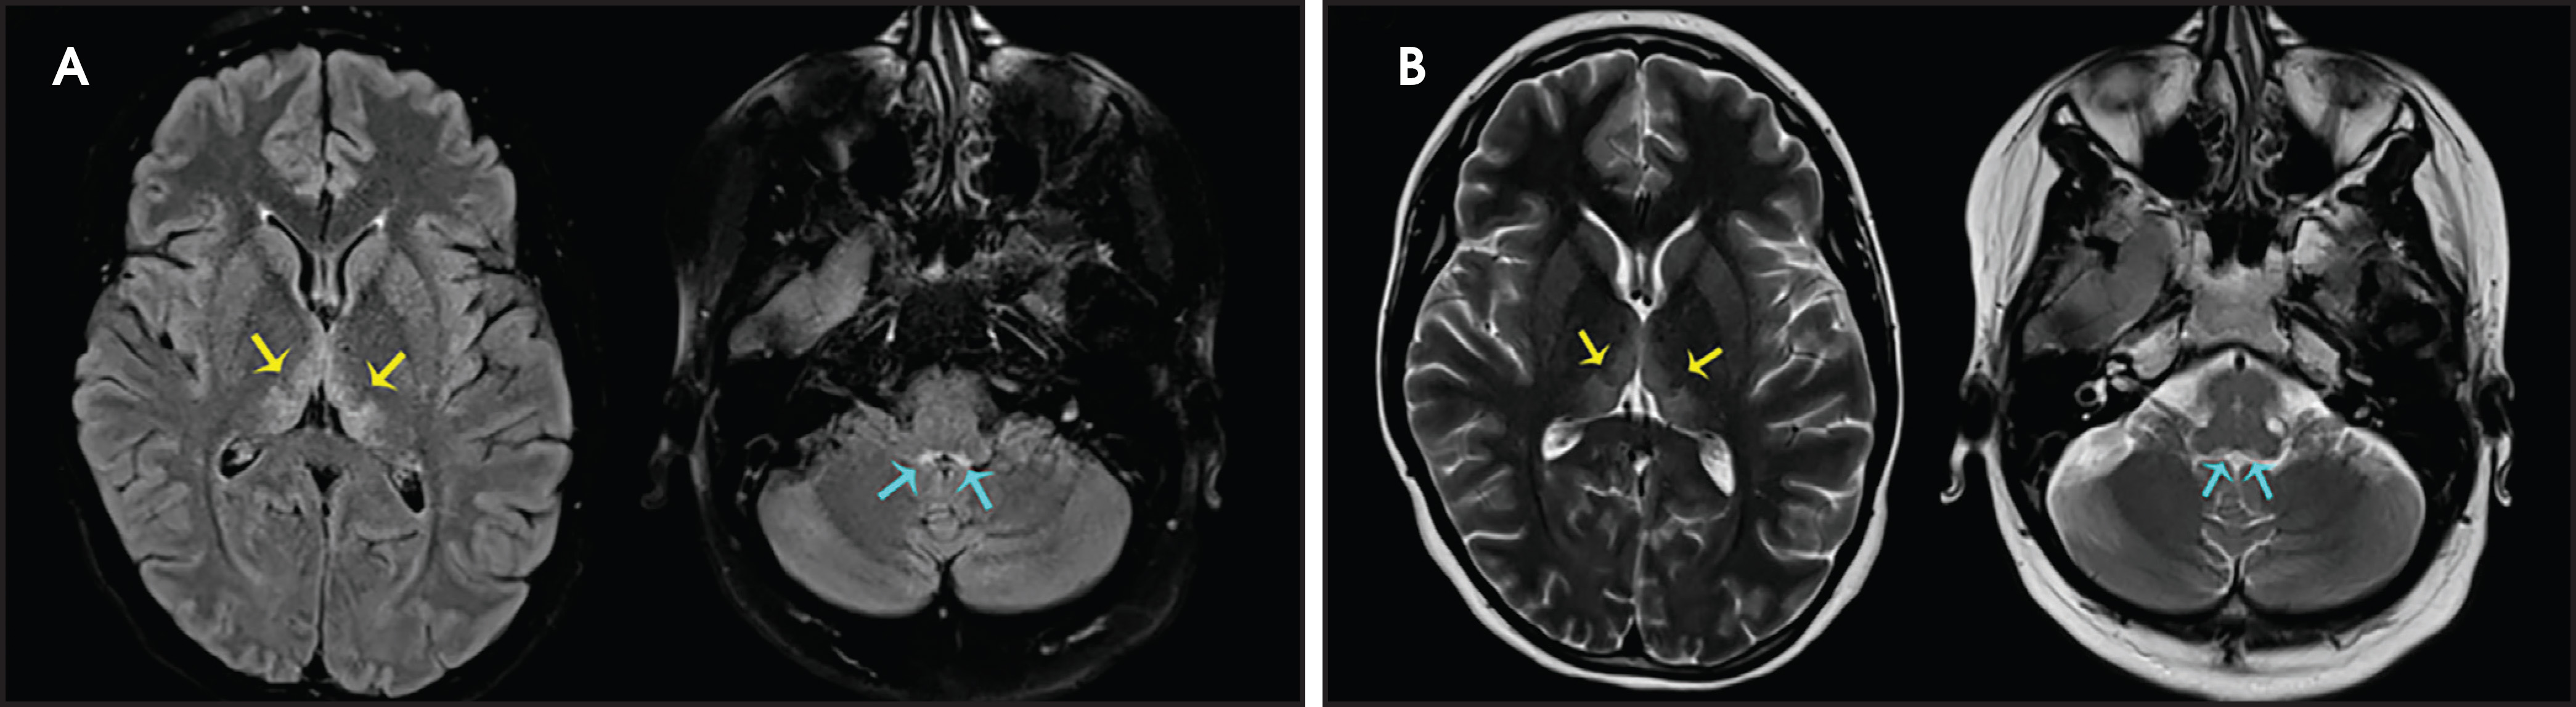
WE is related to thiamine (vitamin B1) deficiency, and the spectrum of affected patients includes alcoholics, as well as non-alcoholics with malabsorption syndromes or dietary deficits.1 Onset is usually acute; however, only 16-38 % of all patients present with the typical triad of ophthalmoplegia, ataxia, and altered consciousness.1 Structures involved are the medial thalami, mammillary bodies, the periaqueductal region, the floor of the fourth ventricle, and the tectal plate corresponding to hyperintensities on T2-WI (Figure 16).1
Summary
The brain is highly susceptible to toxins, autoimmune disorders, and metabolic changes, which can result in a broad range of encephalopathies. Signs are often nonspecific and can range from a hyper-alert agitated state, to coma, and death. Therefore, clinical assessment alone is often inconclusive. MR imaging is the modality of choice and frequently provides the first indication an encephalopathy as a possible cause of symptoms. By recognizing distinct imaging features, such as symmetry, characteristic topographic distribution, and enhancement patterns of the lesions, the radiologist plays a crucial role in narrowing the diagnosis to help improve patient outcome in an interdisciplinary approach.
References
- Bathla G, Hegde A. MRI and CT appearances in metabolic encephalopathies due to systemic diseases in adults. Clin Radiol. 2013;68((6)):545-554.
- Olivas-Chacon C, Treviño-Garcia M, Chua-Tuan J. Leukoencephalopathic changes on magnetic resonance imaging associated with a thermogenic dietary supplement (Thermatrim). Baylor University Medical Center Proceedings. 2015;28(3):389-391.
- Rubinstein D, Edward E, James P. Methanol intoxication with putaminal and white matter necrosis: MR and CT findings. Am J Neuroradiol. 1995;16((7)):1492-1494.
- Sharma P, Eesa M, Scott J. Toxic and acquired metabolic encephalopathies: MRI appearance. Am J Roentgenol. 2009;193((3)):879-886.
- Keogh C, Andrews G, Spacey S. Neuroimaging features of heroin inhalation toxicity: “chasing the dragon”. Am J Roentgenol. 2003;180((3)):847-850.
- Tamrazi B, Almast J. Your brain on drugs: imaging of drug-related changes in the central nervous system. Radiographics. 2012;32((3)):701-719.
- Shimono T, Miki Y, Toyoda H. MR imaging with quantitative diffusion mapping of tacrolimus-induced neurotoxicity in organ transplant patients. Eur Radiol. 2003;13((5)):986-993.
- Ramalho J, Mauricio C. Hashimoto’s encephalopathy. Radiol Case Rep. 2016;6((1)).
- Barry H, Byrne S, Barrett E. Anti-N-methyl-d-aspartate receptor encephalitis: review of clinical presentation, diagnosis and treatment. BJPsych Bull. 2015;39((1)):19-23.
- Urbach H, Soeder B, Jeub M. Serial MRI of limbic encephalitis. Neuroradiology. 2006;48((6)):380-386.
Citation
. MRI of Toxic, Metabolic, and Autoimmune Encephalopathies: A Review. Applied Radiology. 2020;49(1):10-19. doi:10.37549/AR2625.