Multidetector-row CT urography in clinical practice
Applied Radiology — Vol. 33 , Issue 7 , pp. 22 -32
DOI: 10.37549/AR1260
Published: July 1, 2004
Categories
Painless hematuria is a relatively common condition that is an important warning sign of urologic malignancy. The prevalence of microscopic hematuria has been reported to occur in 2.5% to 21.1% of the population.1-7 Urologic malignancy appears to occur in 2% to 3% of all patients with microscopic hematuria8,9 and has been reported to occur in up to 8% to 9% of those >50 years of age.1-5 Although the causes of hematuria include many benign etiologies, malignancies, such as renal cell and transitional cell carcinoma, must be ruled out by radiologic and urologic examination. It is widely accepted that the development of gross hematuria necessitates a thorough diagnostic evaluation. For microscopic hematuria, it is suggested that detection of >2 to 3 red blood cells (RBCs) per high-power field (HPF) warrants a full diagnostic work-up.9,10 Thorough evaluation for a finding of 1 to 3 RBCs per HPF is also encouraged in patients with formal risk factors for urologic malignancy, including: age >45 years, smoking history, exposure to arylamines found in chemicals or dyes, history of pelvic irradiation, and history of phena-cetin or cyclophosphamide use.11,12
The full diagnostic work-up for hematuria includes evaluation of the renal parenchyma and urothelium. Traditionally, this work-up has been performed with cystoscopy to evaluate the bladder and excretory urography (EU) to evaluate the upper urinary tract and kidneys. In the most recent American Urological Association (AUA) Best Practice Policy Recommendations, it was suggested that either EU or computed tomography (CT) is appropriate for the standard screening of adult patients with painless hematuria.12 Although EU can define the pelvicalyceal structures and ureters in exquisite detail, it is insensitive in detecting small renal parenchymal masses, even when conventional tomography is employed. The sensitivity of EU for detecting renal masses >3 cm in size was reported to be 85%, with the sensitivity dropping off to 52% for masses 2 to 3 cm in size and 21% for masses <2 cm in size.13 Although ultrasound is very effective at detecting renal cystic lesions, this modality also has poor sensitivity for detecting solid renal lesions <3 cm.14 For these reasons, even prior to the publication of the AUA recommendations, many institutions had already added cross-sectional imaging, including magnetic resonance imaging (MRI) or contrast-enhanced CT, to the standard work-up of hematuria to increase the sensitivity for detecting renal parenchymal lesions.
It is now widely accepted that nonenhanced CT is superior to EU for detecting urinary tract calculi in patients presenting with acute fiank pain.15-19 Additionally, contrast-enhanced helical CT is the most common cross-sectional imaging modality used to effectively evaluate the renal parenchyma. However, to date, CT has not replaced EU for evaluation of the upper urinary tract because conventional CT protocols do not depict the renal collecting structures and ureters to good advantage. Its sensitivity for detecting small urothelial lesions has been reported to range from 50% to 90%,20-22 with several limiting factors, including poor longitudinal resolution, poor distention of the collecting system, and obscuration of the urothelium by dense intraluminal contrast. Given these limitations, many medical centers have been reluctant to completely replace EU with CT and instead prefer to use both examinations to complement their sensitivities for detecting urothelial lesions, renal parenchymal pathology, and urinary calculi, respectively.
In order to simplify the approach, shorten the work-up duration, and reduce costs, there has been a drive to develop a single examination to effectively evaluate the kidneys and upper urinary tract to-gether. Various strategies have been used to achieve this end. Hybrid techniques have included following EU with immediate CT23 or following contrast-enhanced CT with immediate EU24 without using additional contrast medium. However, these techniques are limited by the logistical difficulties of transferring patients rapidly between the CT scanner and conventional radiography rooms. To overcome this limitation, the use of an auxiliary CT tabletop, as described by McCollough et al,25 allows the acquisition of plain radiographs with the patient on the CT table and, thus, permits the acquisition of a CT and EU study in a single sitting. This strategy is limited by the requirements for significant hardware modifications. Ideally, an examination performed with a single imaging modality would greatly simplify the process.
The advent of multidetector-row computed tomography (MDCT) has dramatically improved the speed with which isotropic CT data can be acquired. By combining the improved spatial resolution of MDCT with strategies to distend the urinary tract and scanning during appropriate phases of enhancement, it is possible to perform a study capable of showing the renal parenchyma, uro-thelium, and urinary tract calculi in a single examination, which is called CT urography (CTU).
CTU protocols
Considerations
A CTU protocol should be designed to optimize visualization of renal stones, the renal parenchyma, and the urothelium. Therefore, it is recommended that patients be imaged at three phases of renal enhancement: the precontrast, nephrographic, and excretory phases. Urinary tract calculi are optimally detected using nonenhanced images with very high sensitivity and specificity.15-19 Postcontrast images are less sensitive in diagnosing nephrolithiasis, as contrast material may obscure calculi. Thus, the first phase of a CTU study involves a nonenhanced, helical acquisition through the abdomen and pelvis, much like a renal colic protocol CT.
The detection of renal parenchymal abnormalities relies most heavily on images acquired during the nephrographic phase. Corticomedullary phase images are of limited value in this clinical context, as several studies have suggested that, compared with images at the nephrographic phase alone, they offer little added sensitivity for detecting renal parenchymal lesions.26-29 Nonenhanced images are also important in this context because they help depict enhancement of potential renal lesions, distinguishing neoplasms from simple cysts.
The urothelium is best depicted during the delayed, excretory phase, with opacification of the renal collecting structures, pelvis, and uteters (Figure 1). In order to best evaluate these urothelium-lined structures, spatial resolution must be maximized. The in-plane resolution of CT of approximately 0.6 mm combined with a longitudinal resolution (slice-thickness) of 1.0 to 1.25 mm should be sufficient to depict urothelial lesions of interest. Clearly, a multidetector-row scanner is necessary to obtain such a dataset within a single breath-hold.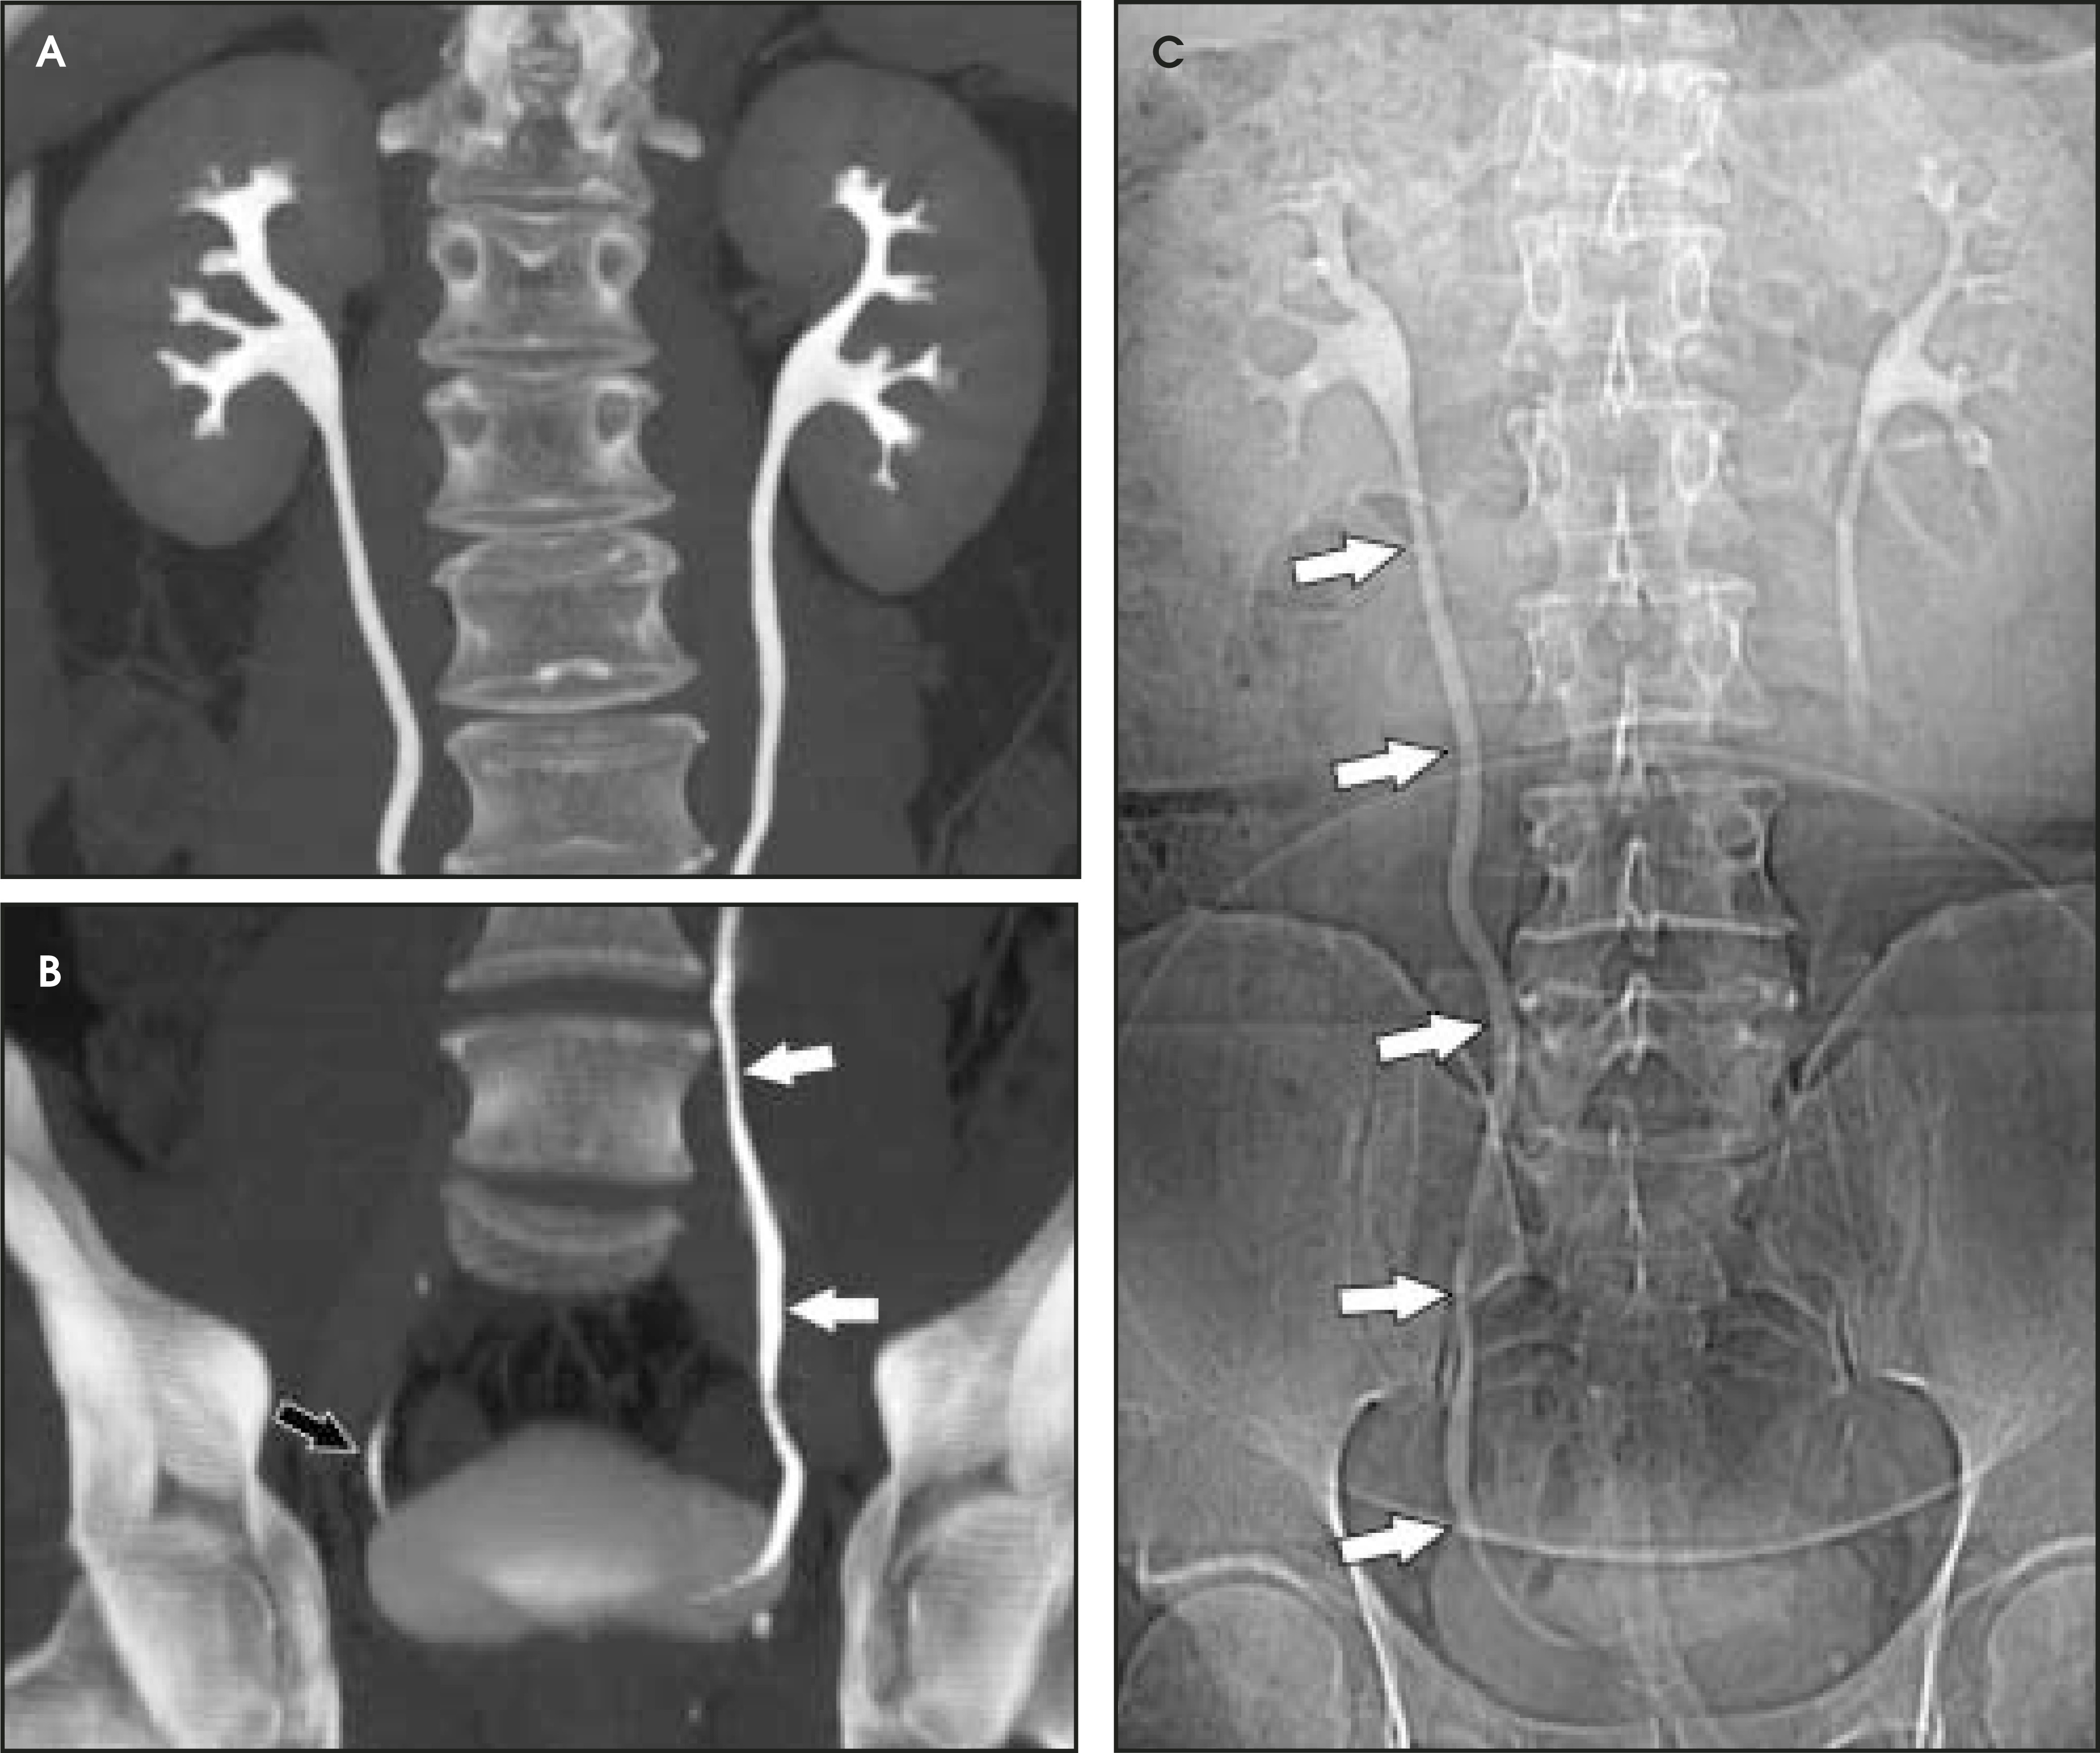
While MDCT technology has resolved the problems with longitudinal spatial resolution that were previously encountered with CT, limitations from incomplete opacification of the ureters and dense intraluminal contrast still need to be addressed. Incomplete opacification of the ureters can result from inadequate distension or from peristalsis. With these phenomena, urothelial lesions can escape detection if they lie within unopacified segments. Oral or intravenous hydration immediately prior to the examination promotes a natural diuresis, which, in turn, helps distend the urinary tract more uniformly.
More adequate distension can be achieved when hydration is complemented with other techniques. One of these supplemental strategies is the use of abdominal compression, a technique that has been employed in EU for decades. Infiation of the balloon promotes distension of the renal collecting structures and abdominal ureters, and release of compression allows pooled contrast and fiuid to fiood the distal ureters. In several studies, CTU with balloon compression appeared to yield equal or better opacification of the urinary collecting system compared with EU.30,31 With this technique, however, the collecting structures/abdominal ureters and the pelvic ureters must be imaged in separate acquisitions yielding two separate volumetric datasets. Additionally, one must be cognizant of contraindications to abdominal compression that include abdominal aortic aneurysms with or without stent grafts, recent abdominal surgery, abdominal pain, urinary tract diversions, severe ascites, horseshoe kidney, and inferior vena cava filters. An alternate strategy used to achieve uniform opacification is pharmacologic diuresis (Figure 2). Nolte-Ernsting et al32 described the use of 10 mg of furosemide intravenously prior to scanning in 16 patients and achieved complete or near-complete opacification of the ureters and pelvicaliceal systems in 94% and 100% of cases, respectively.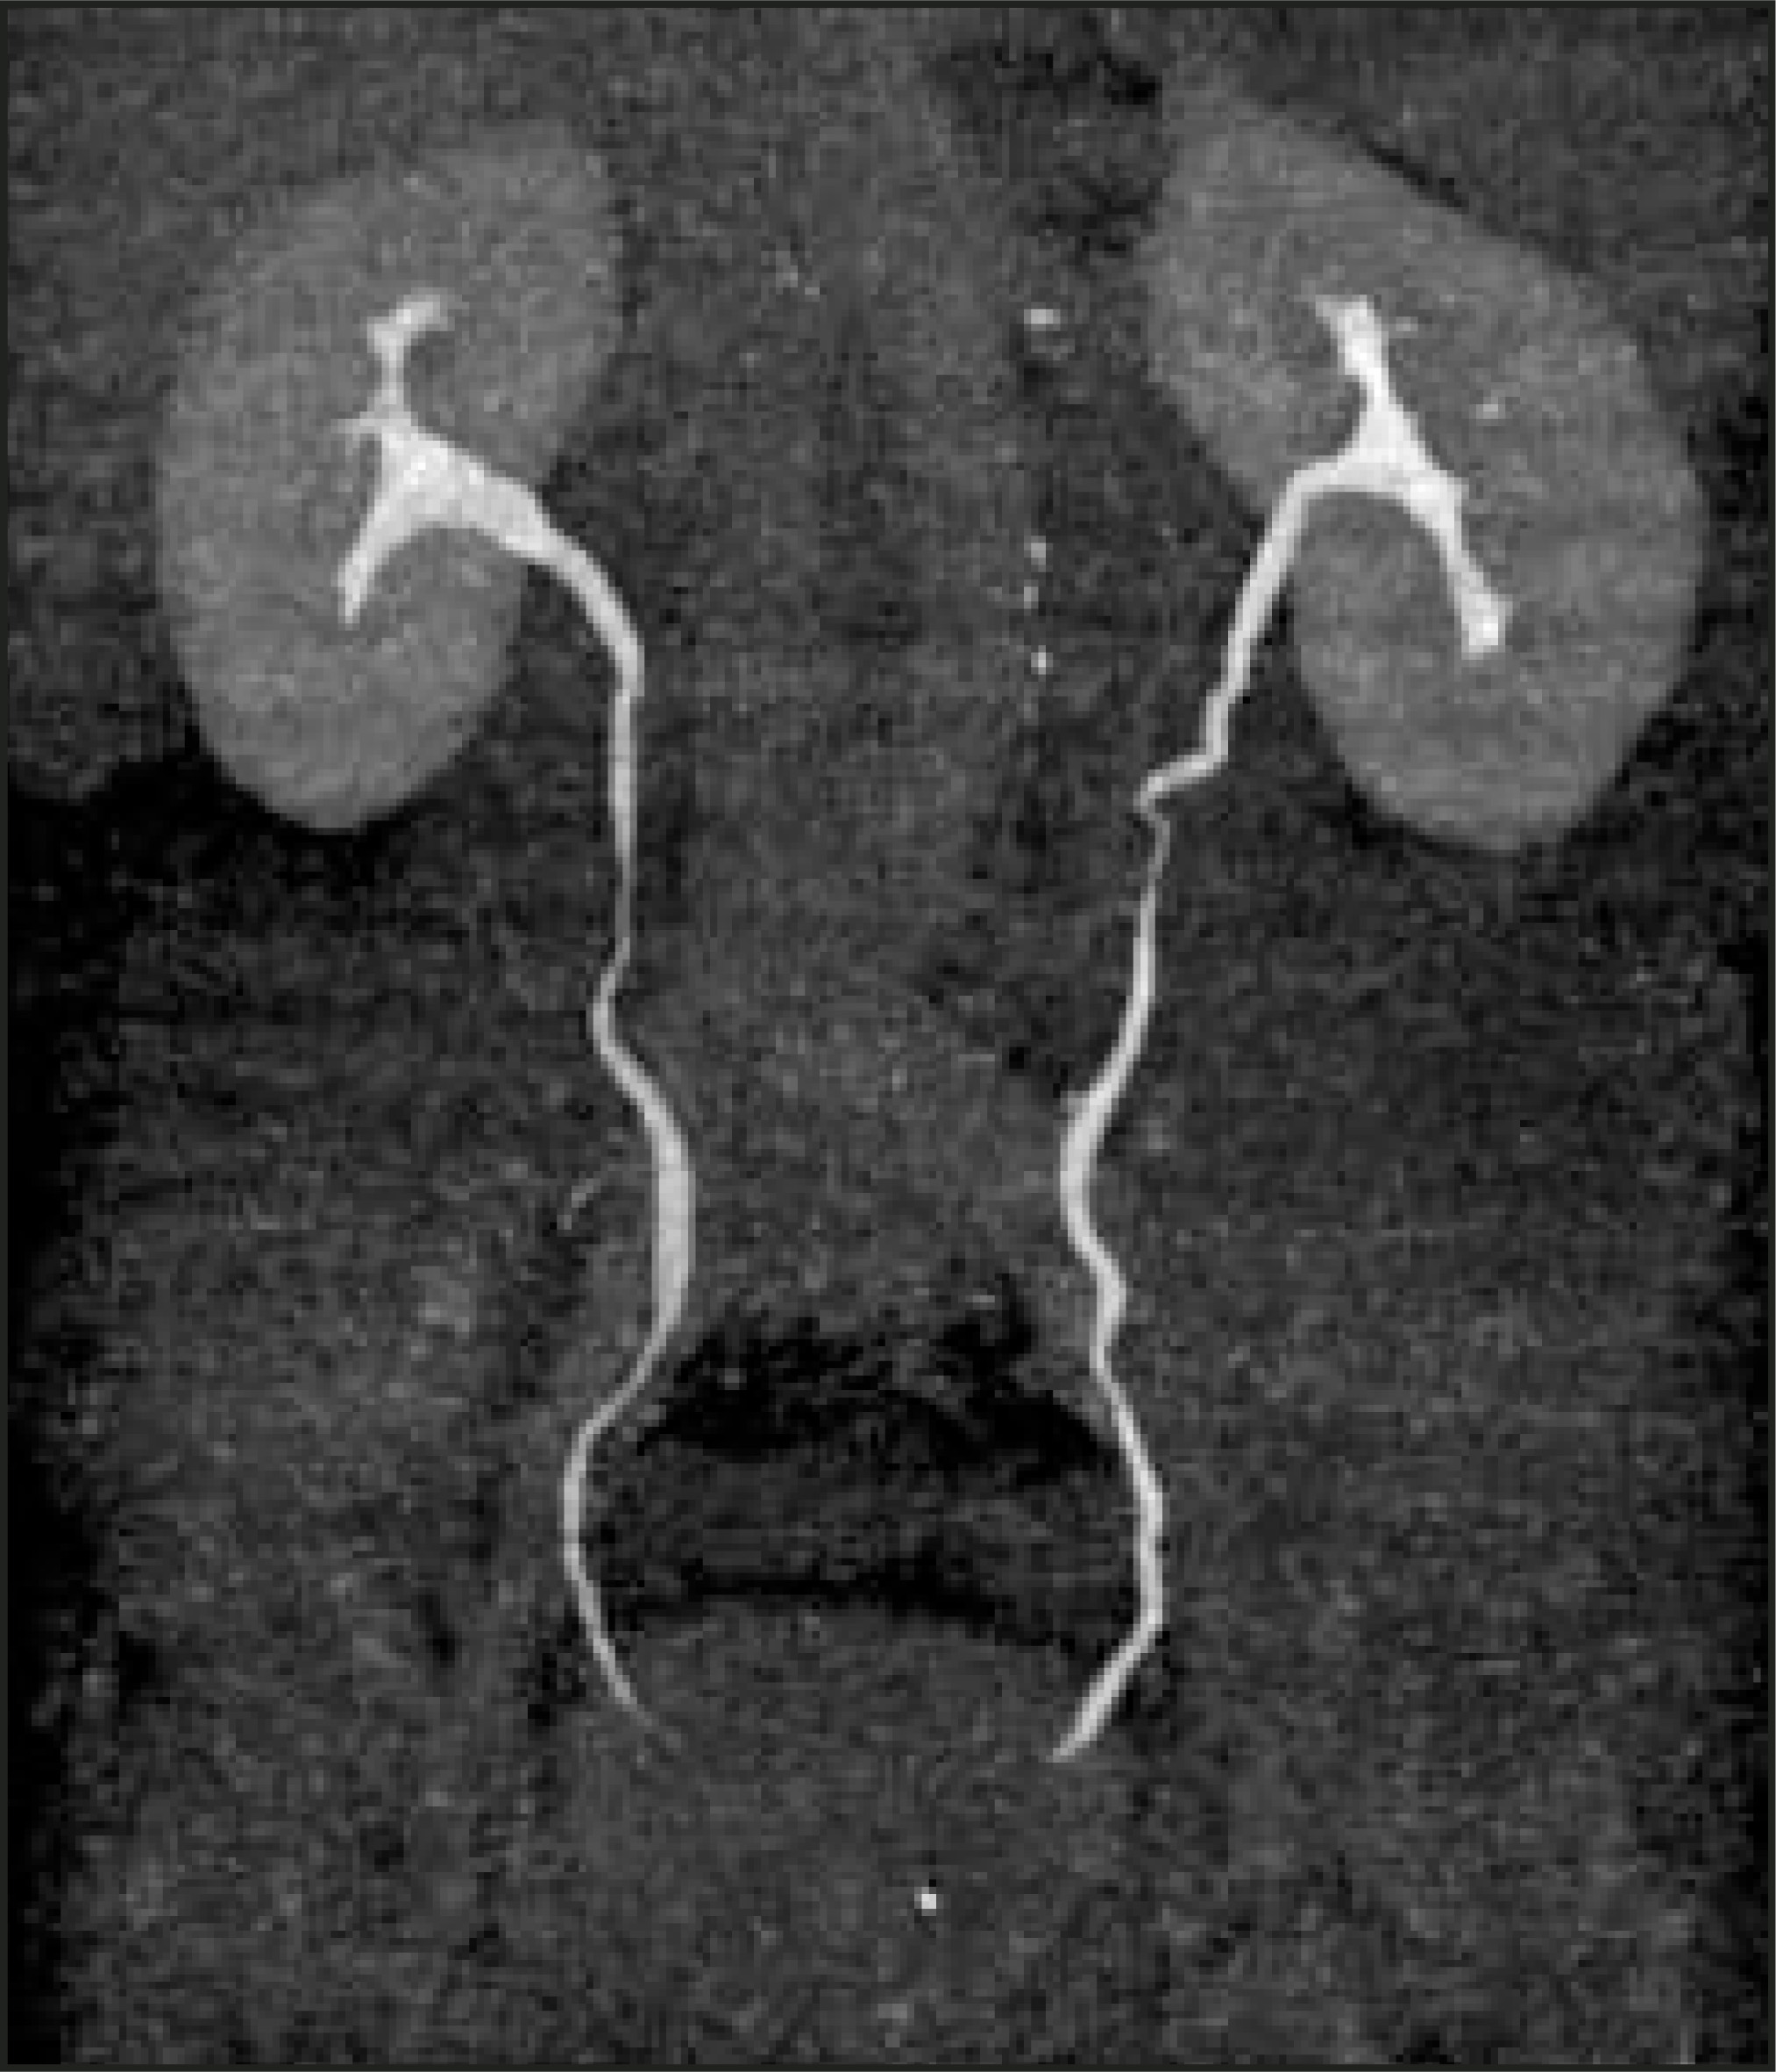
Difficulty in evaluating the urothelium can also arise with high intraluminal contrast density. High concentrations of contrast can result in linear streak artifacts and loss of fine calyceal detail that can prevent the detection of small urothelial lesions.30 Adequate prehydration not only helps minimize potential nephrotoxicity33-35 but also helps maximize image quality by diluting excreted contrast material. Pharmacologic diuresis may also help dilute contrast material sufficiently to better depict calyceal anatomy and eliminate streak artifact. In the study performed by Nolte-Ernsting et al,32 patients receiving furosemide achieved 4- to 5-fold lower attenuation in the collecting structures and more even distribution of excreted contrast compared with patients receiving only 250 mL of normal saline. The authors also noted that the high density of contrast in the proximal collecting system of the patients who received saline alone resulted in blurring and blunting of the fine calyceal structures, which was not seen in patients who received furosemide.32
Finally, because unopacified segments may also result from peristalsis, a digital scout image of the abdomen and pelvis acquired at each phase of the examination can be helpful. The additional scout images provide opportunities for visualizing any nondistended segments resulting from peristalsis and can provide complementary information to the CT acquisition36 without a substantial increase in radiation dose (Figure 1).
Technical parameters and reconstruction techniques
Image acquisitions for CTU should be performed on a multidetector-row scanner in order to maximize spatial resolution. With 4-, 8-, and 16row scanners, each phase of the study can be performed with a single breath-hold of <25 seconds. All CT images are obtained helically with a high pitch value. For nonenhanced CT acquisitions, axial sections of 3.75-mm slice thickness and 2.5-mm increment are generated for primary interpretation. Enhanced CT acquisitions are reconstructed with overlapping 1.0 or 1.25 mm nominal section thickness in order to produce two-dimensional reconstruction images of highest quality. Drawbacks for acquiring such thin sections include decreased signal-to-noise ratios and large numbers of axial source images.
Coronally reformatted images through the kidneys and collecting structures can be produced rapidly on the source scanner and do not require a separate workstation, yet they present the relevant anatomy in a more intuitive display plane. If the institution has access to a dedicated workstation, oblique coronal sliding thin-slab images can also be postprocessed with maximum intensity projections (MIP) and minimum intensity projections (MINIP). Coronal sliding thin-slab reconstructions, initially des-cribed for use in the thorax by Napel et al,37 display the calices and infundibula individually in an intuitive anatomic plane. Lesions within these structures become easier to detect as superimposition of overlying structures is eliminated. This technique also provides an additional plane to help characterize anatomic relationships (Figure 3). However, with MIP and average projection (AP) images, smaller filling defects may be missed if they are contained within the same voxel as intraluminal contrast due to volume averaging and MIP effects. For this reason, thinner sections (≤2.5 mm) should be used to minimize voxel size or additional MINIP images should be produced. Both of these techniques have the benefit of obviating the need for manual editing of osseous structures.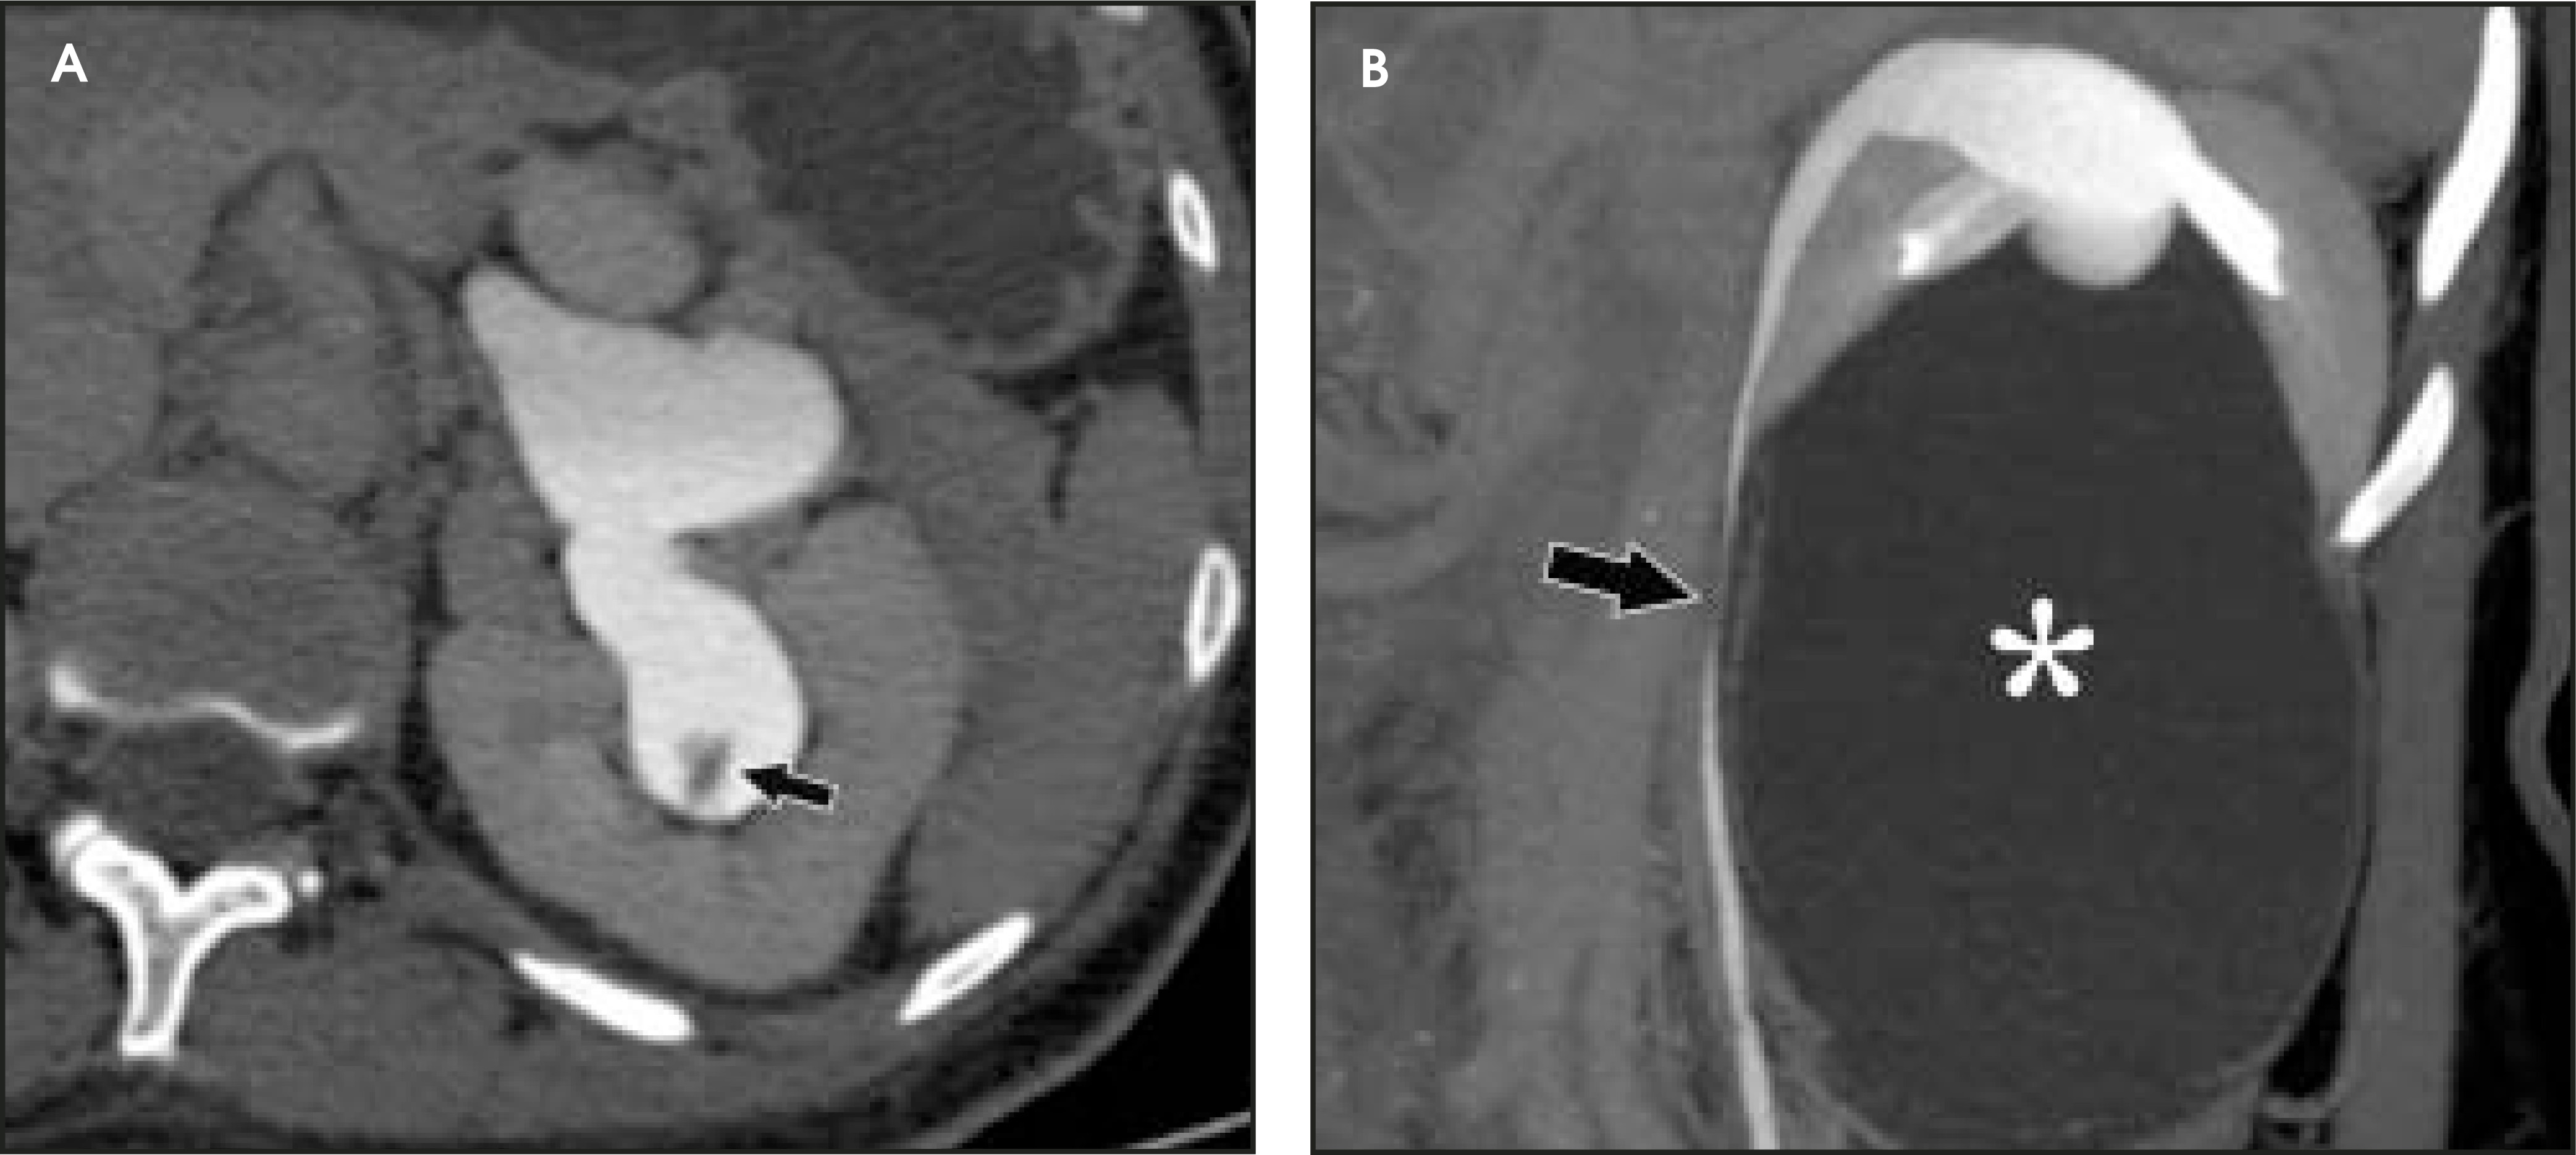
Anteroposterior thick-slab (35 to 50 mm) MIP and AP images of both kidneys and proximal ureters in an oblique coronal plane can also be helpful by providing images similar to those created by traditional EU, to which many clinicians are accustomed. Additionally, a MIP image of the distal ureters and urinary bladder can be generated to give clinicians another global look at the lower urinary tract on a single image. Although suboptimal for detecting small lesions and subtle pathology, both of these reconstructions together can enhance communication with referring physicians by depicting the relevant urinary tract anatomy on only two or three images.
Strengths and weaknesses of various protocol techniques
Although obtaining multiple postcontrast scans during nephrographic and excretory phases can be advantageous by providing redundancy, which allows for the potential to capture an unopacified segment of ureter or collecting system on another imaging pass, this strategy yields more images for interpretation and results in higher radiation doses. For a three-phase multidetector-row CT protocol, McTavish et al38 reported an estimated skin dose of 74.1 mGy and an estimated total effective dose of 22.6 mGy.38 Additionally, average effective radiation doses for multi-detector-row CTU are reported to range from 5 to 10 mSv to 25 to 35 mSv, depending on protocol design.39 In order to reduce radiation exposure and the number of images generated, intravenous contrast material can be administered in a split bolus to allow for only a single contrast-enhanced scan. By injecting intravenous contrast material in two se-quential boluses separated by an appropriate time delay, imaging during synchronous nephrographic and excretory phases is possible.40 If other technical factors are held constant, this strategy reduces the effective radiation dose associated with the CTU examination simply by reducing the number of CT acquisitions obtained. The split-bolus protocol amounts to a roughly equivalent radiation dose as a standard pre- and post-contrast CT of the abdomen and pelvis, which many patients will undergo in addition to EU in their diagnostic evaluation. Therefore, CTU could potentially reduce overall radiation dose by eliminating the need for two separate radiologic studies.
Although it is widely accepted that prehydration provides nephroprotective effects and is likely to provide imaging benefits in this context, it is currently not clear whether abdominal compression or pharmological diuresis provides better results, as both techniques have been separately shown to improve urinary tract distension. Abdominal compression can be advantageous because many radiologists and technologists are familiar with this technique from their experience with EU and it does not require the administration of an additional medication. Indeed, to date, most studies comparing EU with CTU were performed with this technique.30,31,38 Although further work in this area is necessary, there are several potential advantages for using pharmacologic diuresis. Furosemide achieves distension with dilution of contrast, as described by Nolte-Ernsting et al.32 Another advantage of pharmacologic diuresis is that the entire urinary collecting system can be imaged by only one acquisition, allowing for reconstructions that depict the urinary collecting system in its entirety (Figure 2). When abdominal compression is employed, separate reconstructions of the urinary tract must be produced for the abdomen and pelvis.
CTU interpretation
An interpretation of the initial digital scout image should be performed prior to the examination. This brief preliminary read is important in order to rule out the above-mentioned contraindications to abdominal compression and to ensure proper positioning of the balloon device. Once the study is complete, the source axial images are interpreted. This primary interpretation should be performed on a picture archiving and communication system (PACS) workstation in a cine mode, as it is impractical to read such a large number of images on hard copy. While the reformatted images may simplify communication with referring physicians, these images should not replace an initial systematic interpretation of the axial source images. Rather, these reconstructions should be used as an adjunct that may clarify questionable findings or supplement sensitivity by providing a different anatomic plane for interpretation.
The unenhanced series is generally interpreted first in similar fashion to a renal colic study. Note is made of urinary tract calculi (Figure 4), and the native attenuation of any renal lesions may be obtained. Additionally, transitional cell carcinomas can often be identified on this series, as they are outlined by slightly lower-attenuation, unopacified urine. Interpretation of the postcontrast compression images should follow. As these images capture the kidneys and abdominal ureters in both the nephrographic and delayed excretory phases, they are optimal for identifying renal parenchymal lesions (Figure 5) and urothelial lesions (Figure 6). After a thorough evaluation of the renal parenchyma with standard abdominal window/level settings, a dedicated evaluation of the collecting structures should be performed with different window/level settings appropriate for these structures. Unfortunately, because of the variable concentration of contrast material within the collecting structures, window/level settings must often be individually tailored on a case-by-case basis. Bone windows represent a good first approximation, but further adjustment is often necessary.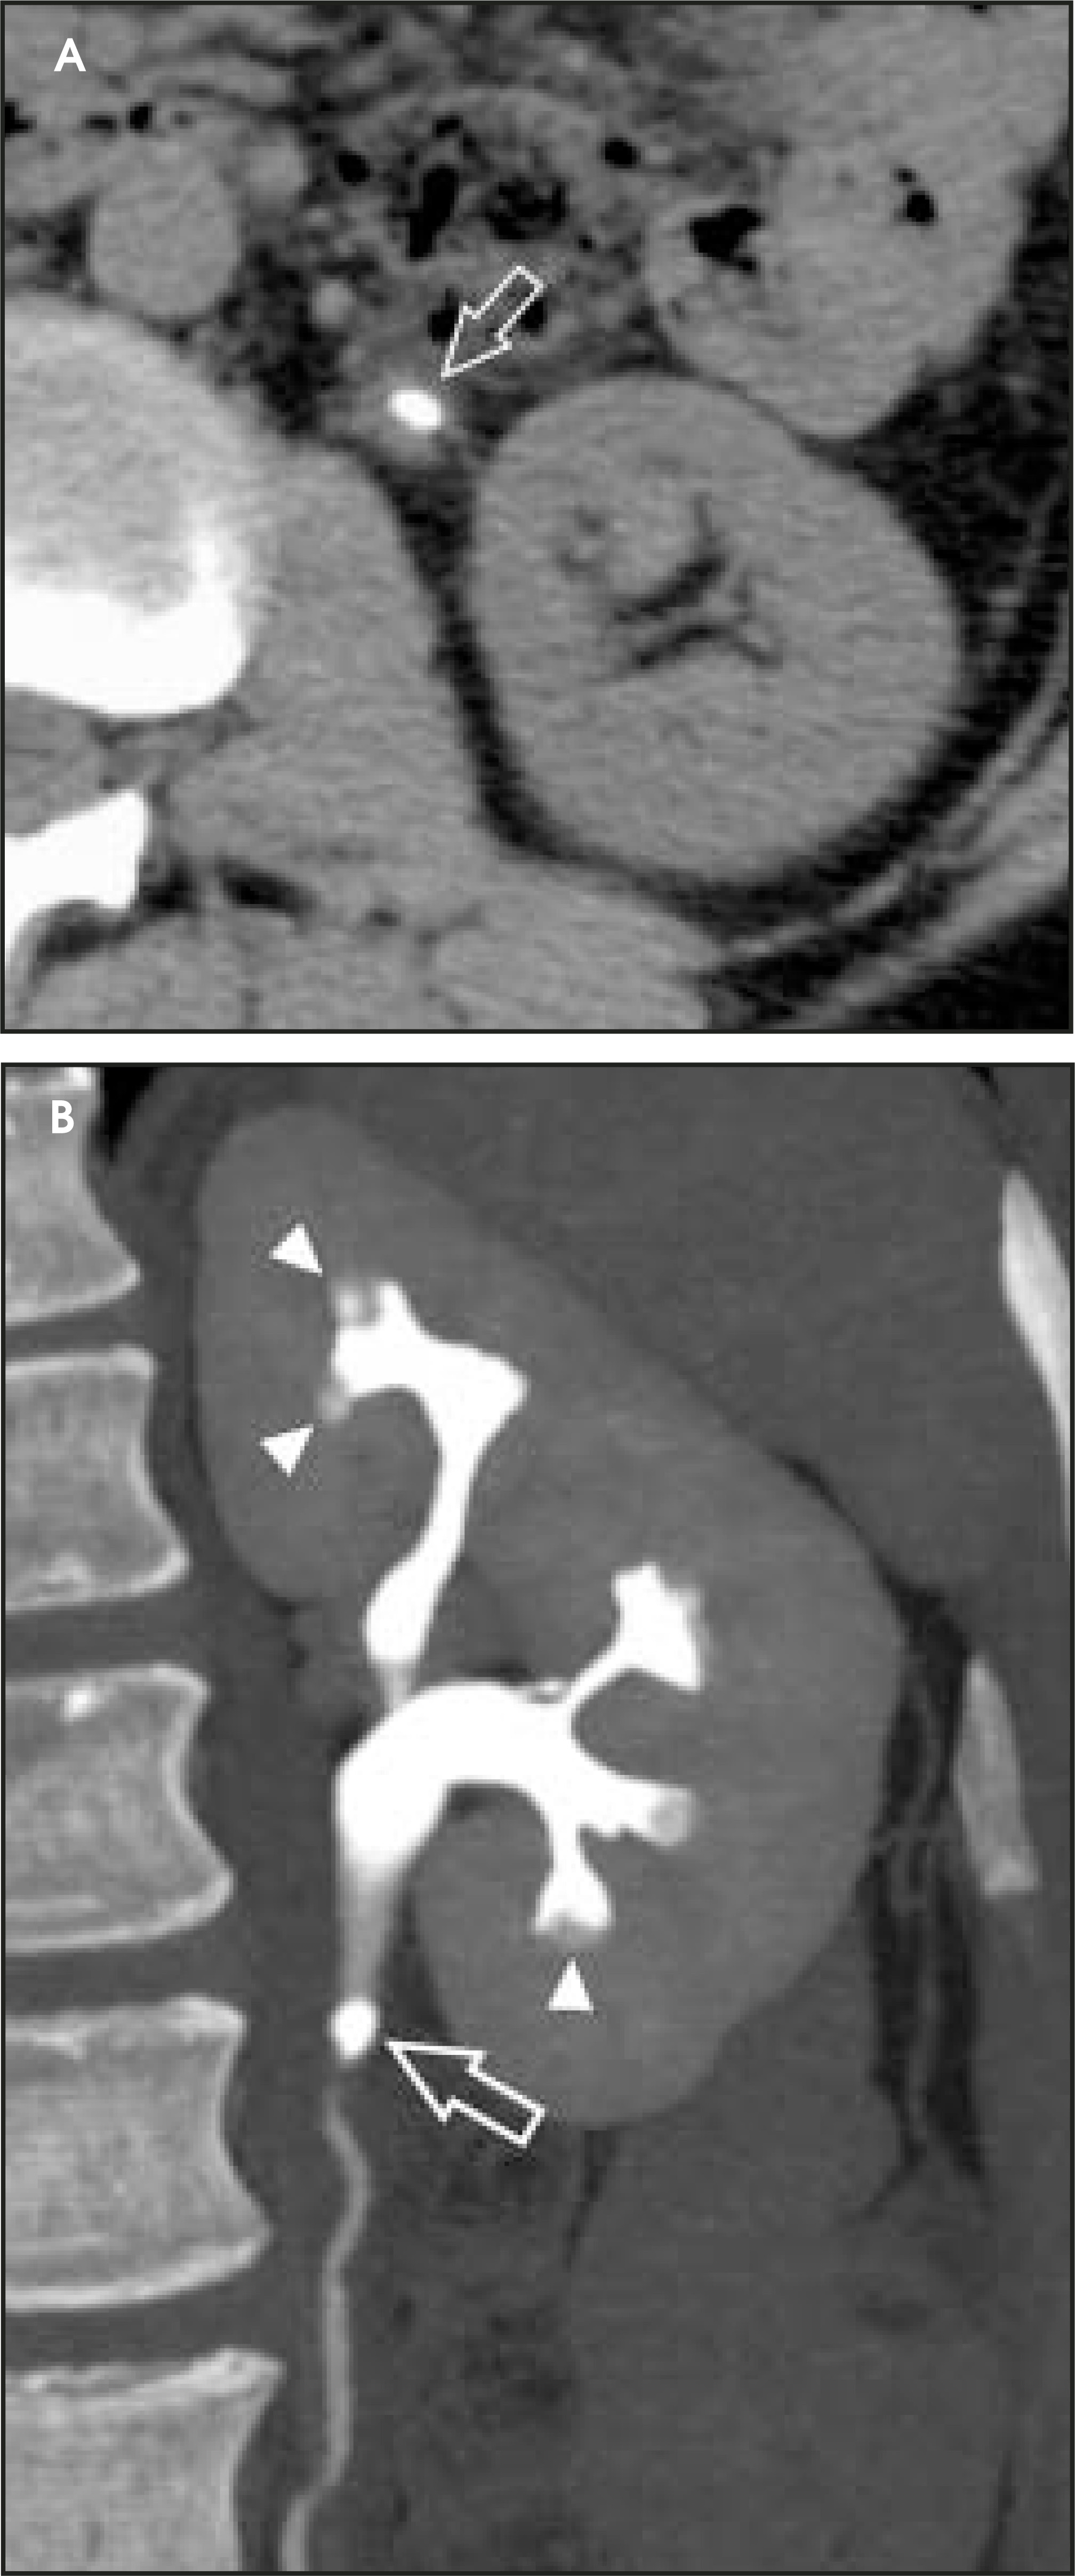
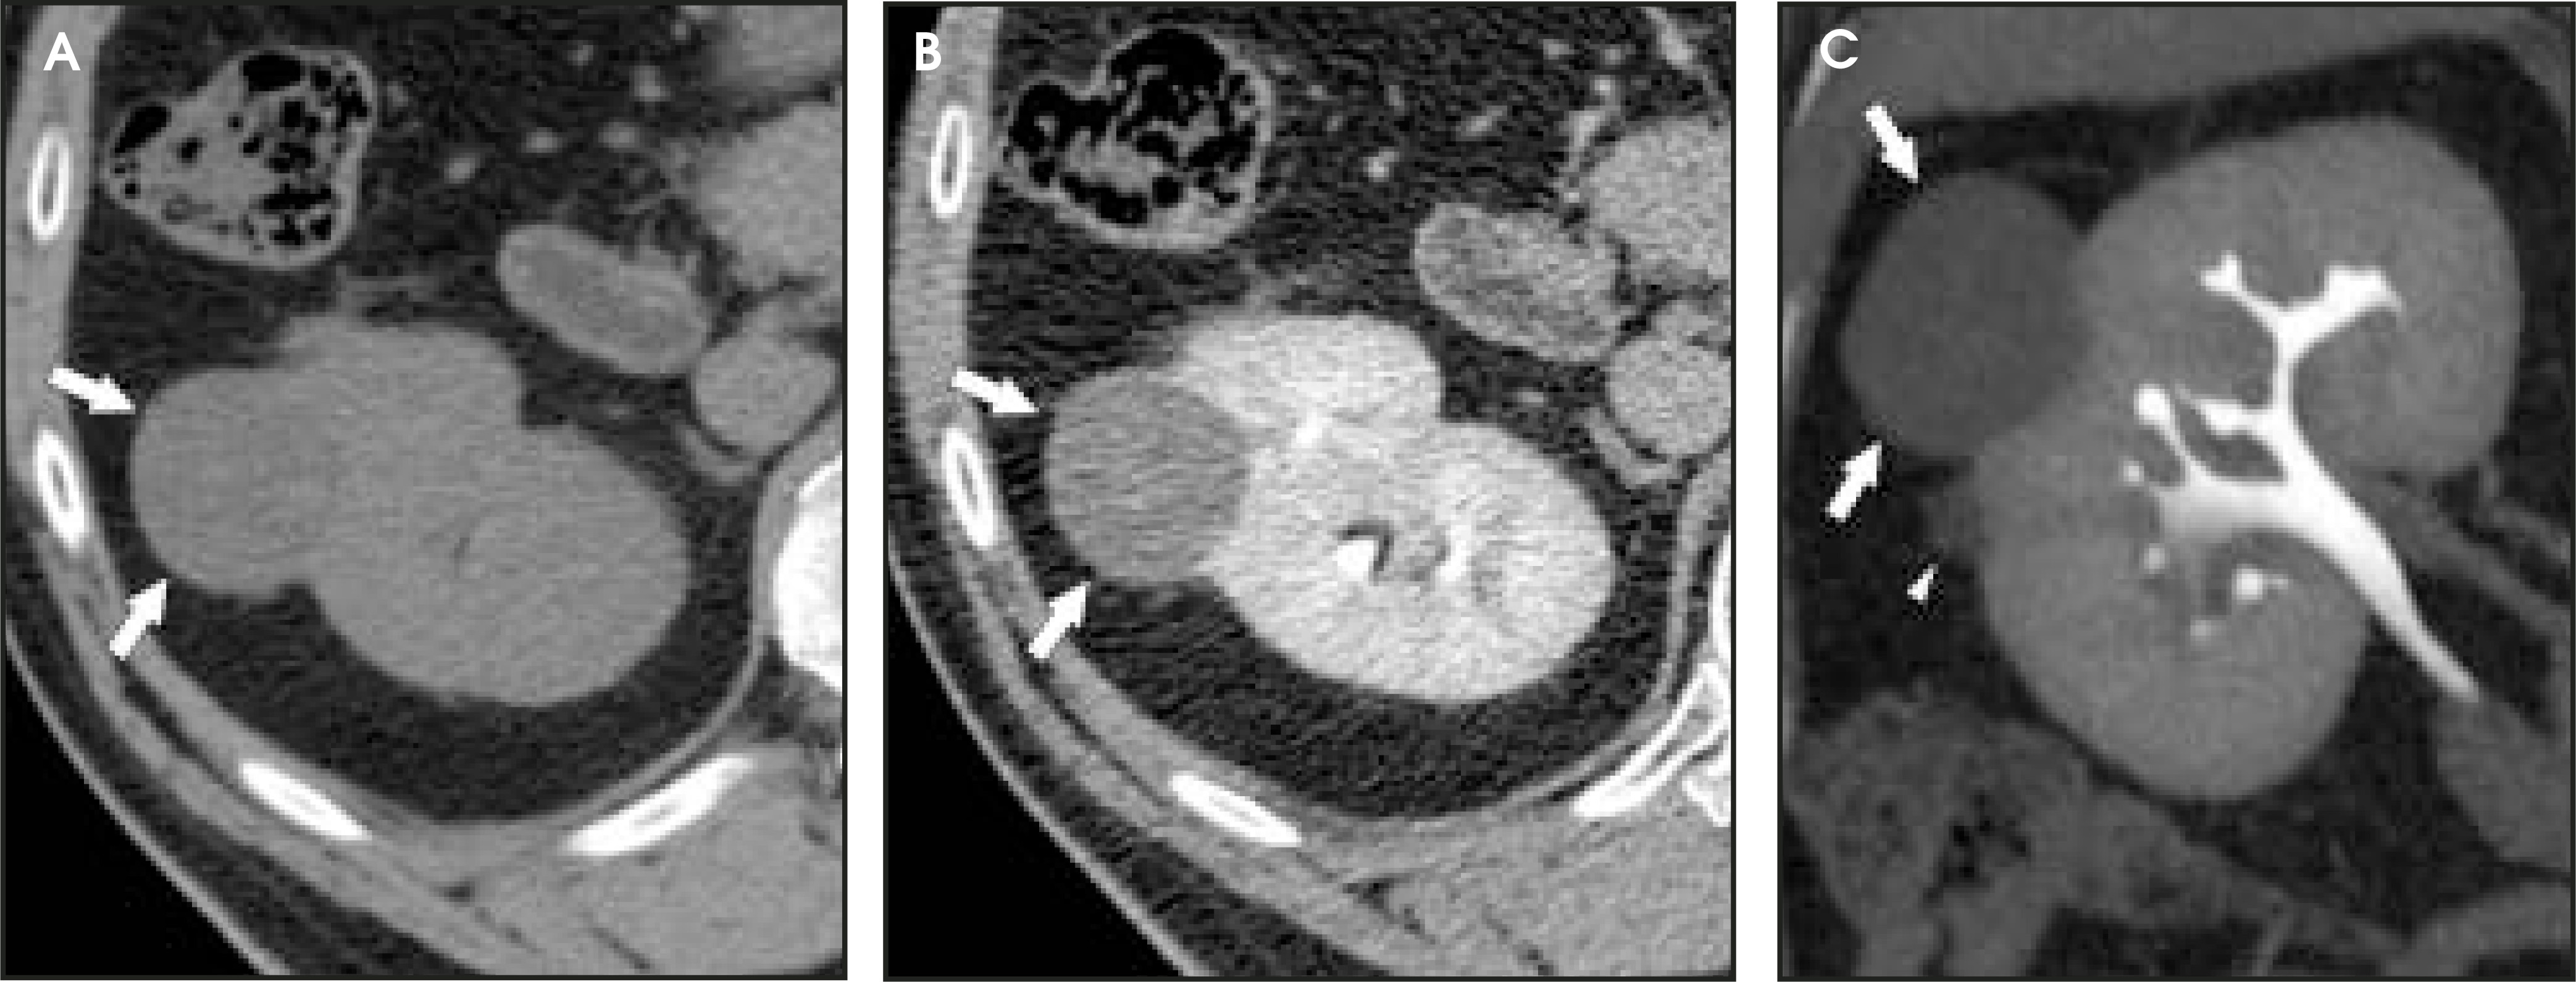
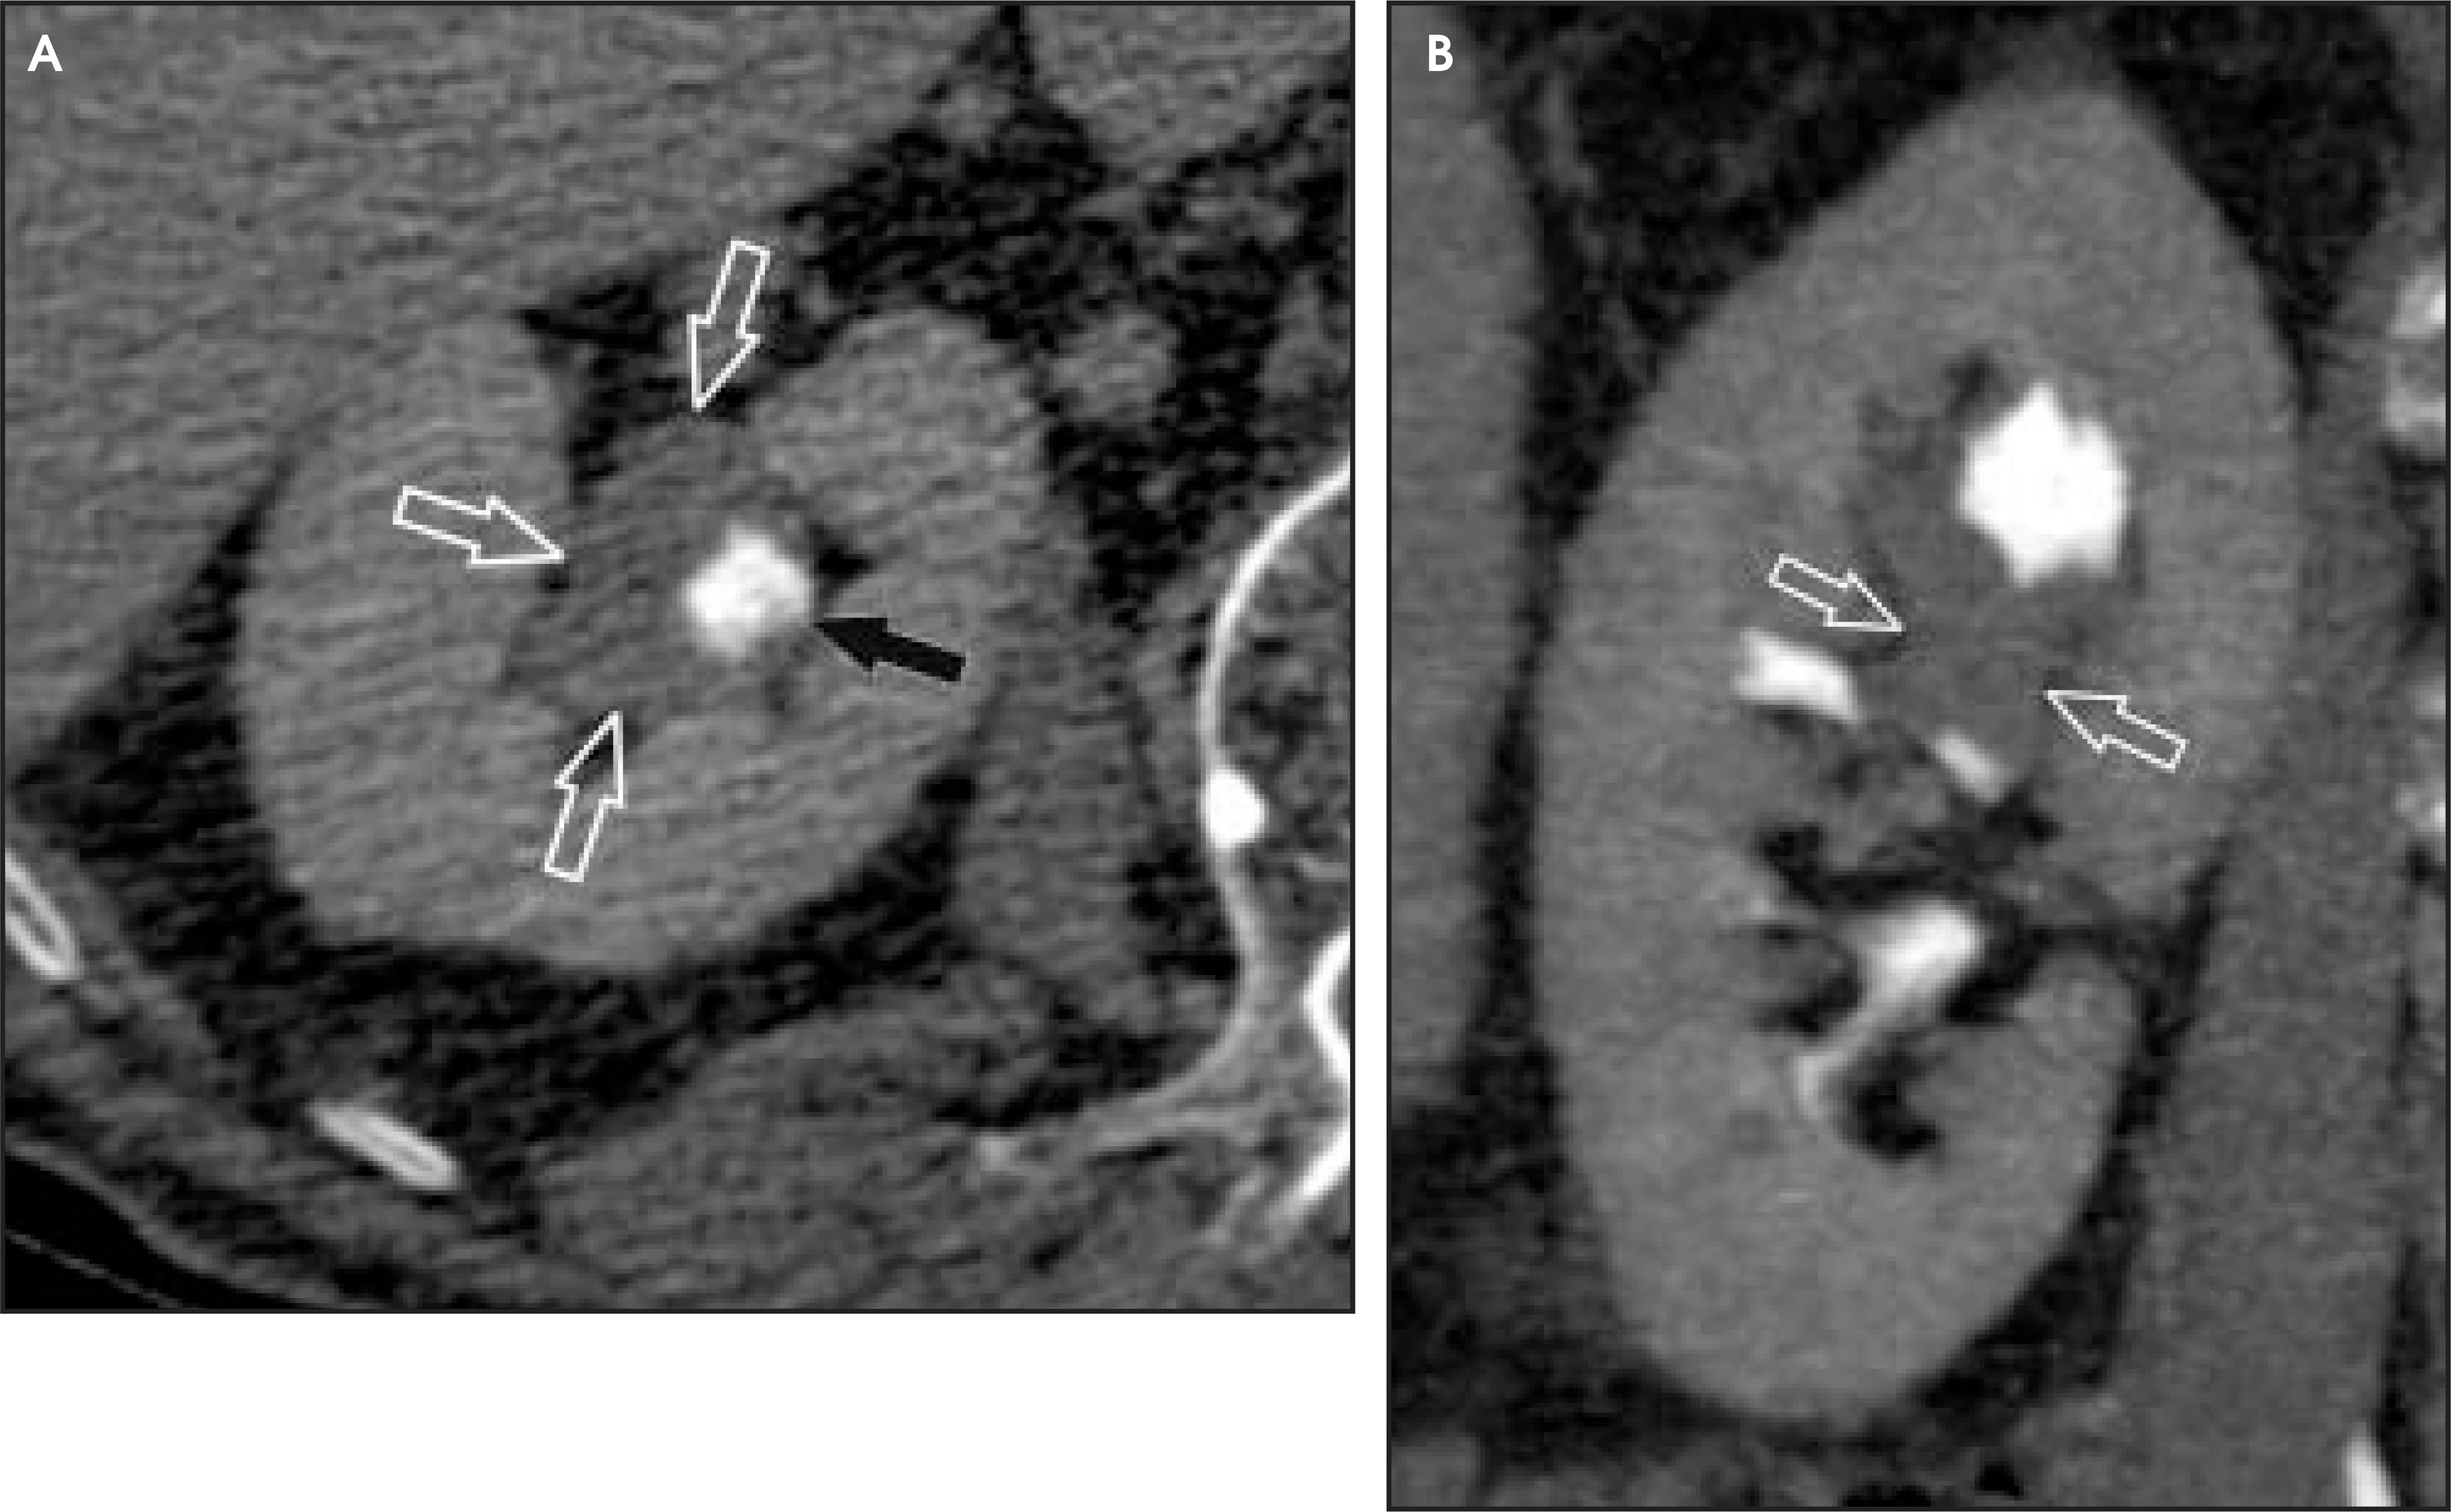
With abdominal compression protocols, review of the compression volume set should be followed by a review of the postrelease volume set to evaluate the pelvic ureters and bladder for urothelial lesions as well. The same window/level settings used in the axial images of the abdomen should also be used in the axial images of the pelvis.
Larger transitional cell carcinomas are easy to detect, particularly when an obstruction is present. Smaller lesions, however, pose a greater diagnostic challenge. Based on CT findings, Baron et al41 classified these lesions into three morphologic categories: focal intraluminal mass, urethral wall thickening, and infiltrating mass.41 Focal intraluminal mass lesions may only appear as filling defects within the collecting structures and ureters (Figure 7). They may be confused with blood clots or calculi, which also appear as filling defects. However, transitional cell carcinomas have a comparatively lower attenuation value, which is slightly greater than the water density of the surrounding urine42,43 on unenhanced scans. Also, transitional cell carcinomas exhibit modest enhancement with intravenous contrast.43,44 While analyzing the collecting structures, it is important not to confuse renal papilla for pathologic filling defects. This misinterpretation is easily avoided, as a papilla should be centrally located within a calyx.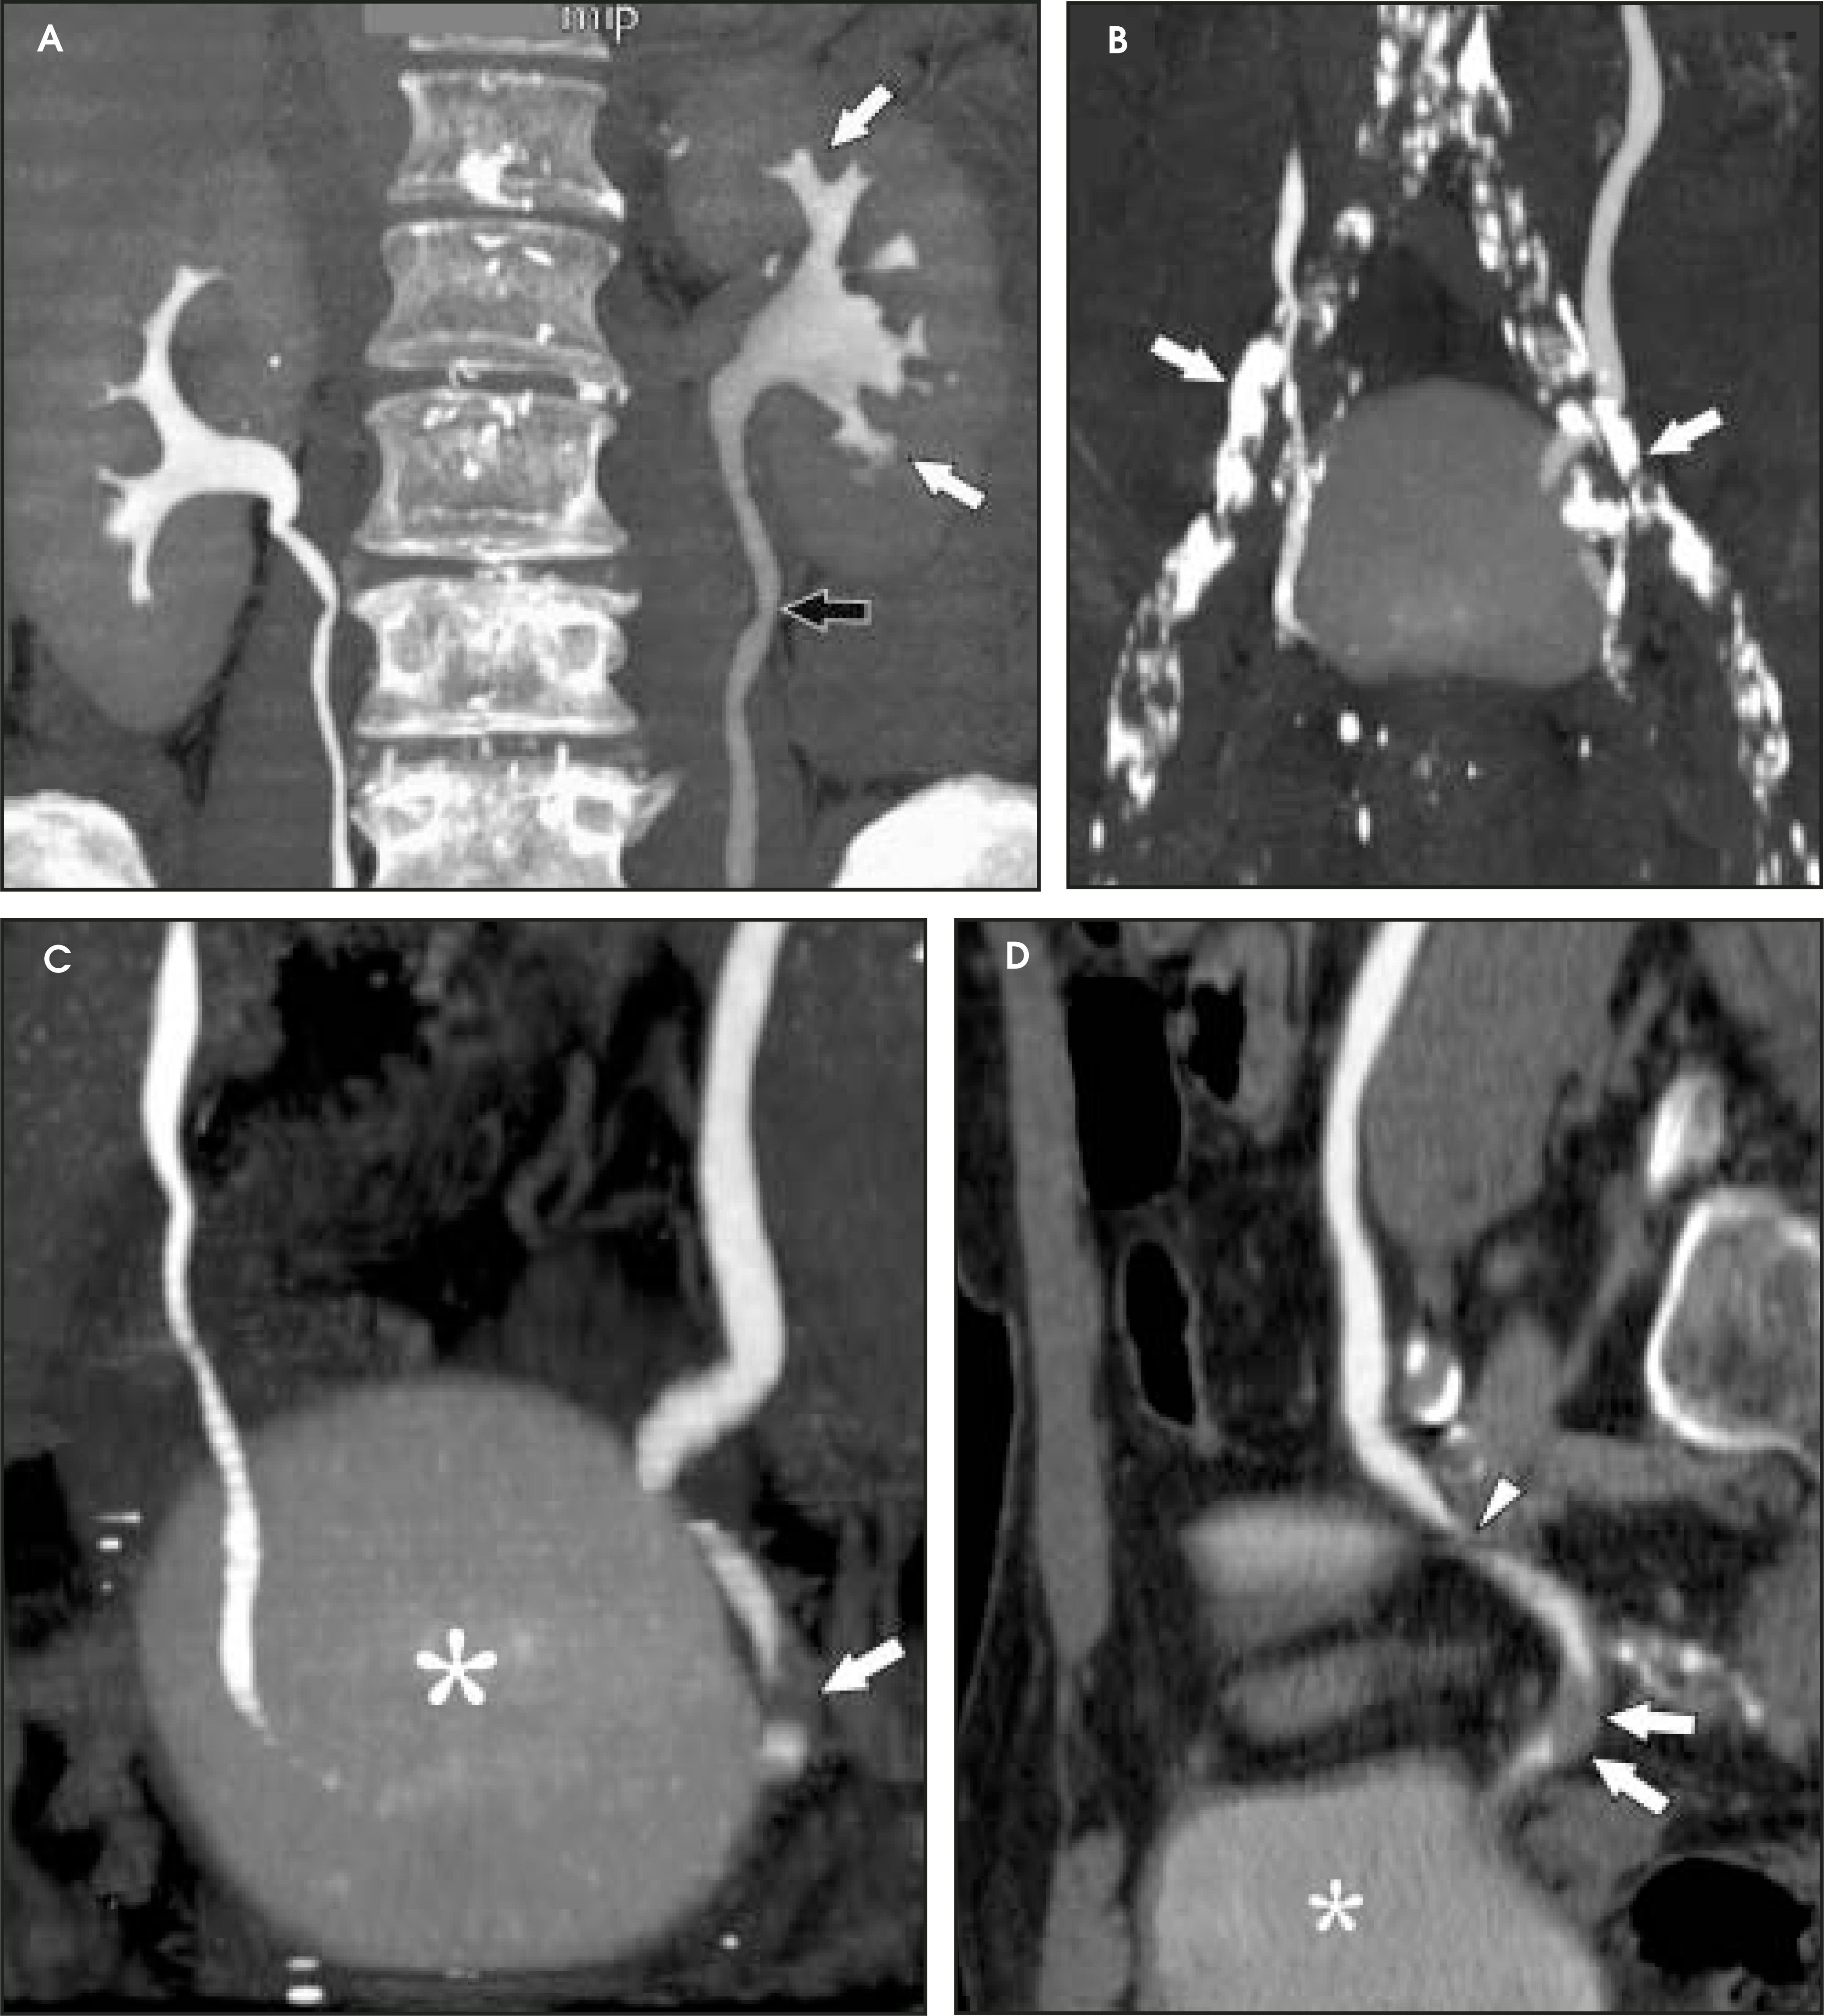
While CTU is a very effective tool for evaluating the upper urinary tract, the protocol described in this paper (Table 1) is currently is not optimized for depicting the bladder. Because of the delayed phase of imaging the pelvis after contrast, mixing artifacts within the bladder can result in both false-positive and false-negative interpretations (Figure 8). While CT has been shown to detect bladder lesions to good advantage with CT cystography protocols and reconstruction strategies,45 conventional cystoscopy remains the standard screening tool, as it not only effectively detects lesions, but also provides tissue diagnosis at the time of the procedure. At the author’s institution, patients with painless hematuria generally undergo both CTU and cystoscopy as part of their evaluation.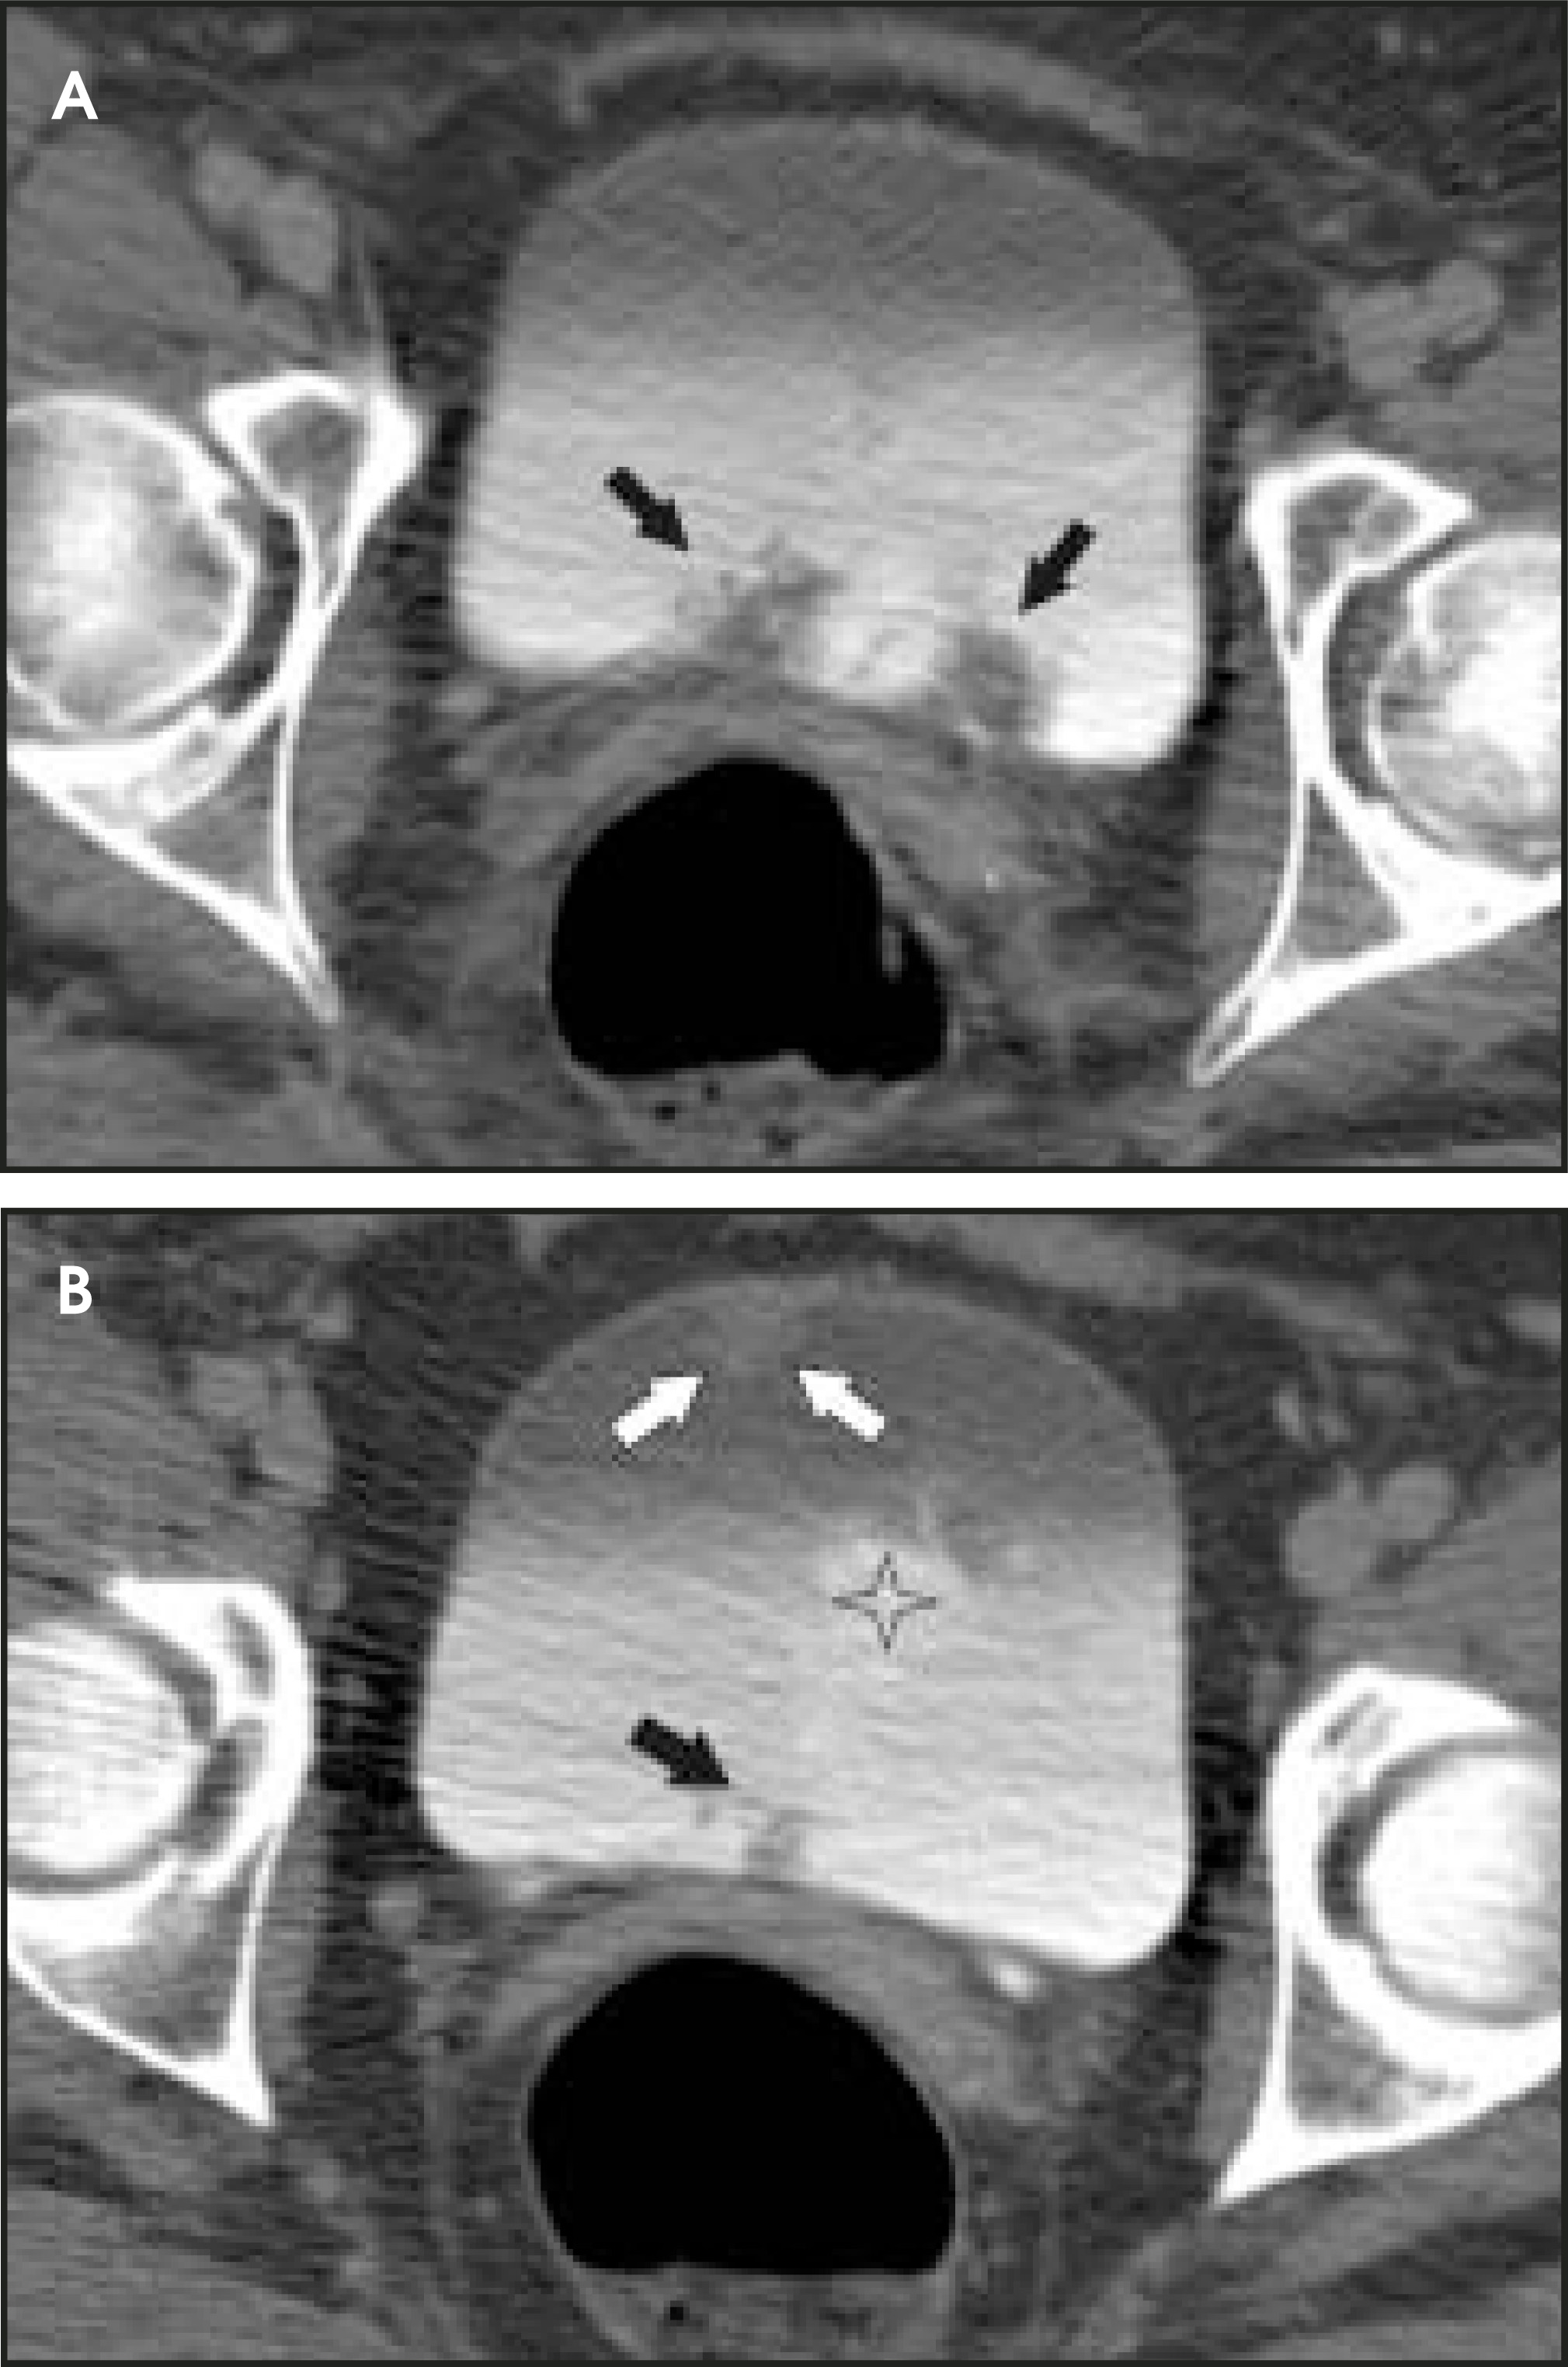
Conclusion
There has been rapid progress in the development and implementation of CTU for detailed evaluation of the urinary tract in patients presenting with painless hematuria. With improved spatial resolution afforded with MDCT, CTU has the potential to replace the need for EU in many cases. Optimization of these techniques is ongoing to resolve several remaining limitations. The ability to use only one radiologic test with CTU could potentially reduce costs, ionizing radiation exposure, iodinated contrast administration, and the procedural duration and complexity in the standard work-up of painless hematuria.
References
- Messing E, Young T, Hunt V. The significance of asymptomatic microhematuria in men 50 or more years old: Findings of a home screening study using urinary dipsticks. J Urol. 1987;137:919-922.
- Messing E, Young T, Hunt V. Urinary tract cancers found by homescreening with hematuria dipsticks in healthy men over 50 years of age. Cancer. 1989;64:2361-2367.
- Britton J, Dowell A, Whelan P. Dipstick haematuria and bladder cancer in men over 60: Results of a community study. BMJ. 1989;299:1010-1012.
- Britton J, Dowell A, Whelan P. A community study of bladder cancer screening by the detection of occult urinary bleeding. J Urol. 1992;148:788-790.
- Messing E, Young T, Hunt V. Home screening for hematuria: Results of a multiclinic study. J Urol. 1992;148:289-292.
- Ritchie C, Bevan E, Collier S. Importance of occult haematuria found at screening. Br Med J (Clin Res Ed). 1986;292:681-683.
- Thompson I. The evaluation of microscopic hematuria: A population-based study. J Urol. 1987;138:1189-1190.
- Murakami S, Igarashi T, Hara S. Strategies for asymptomatic microscopic hematuria: A prospective study of 1,034 patients. J Urol. 1990;144:99-101.
- Sutton J. Evaluation of hematuria in adults. JAMA. 1990;263:2475-2480.
- Copley J. Isolated asymptomatic hematuria in the adult. Am J Med Sci. 1986;291:101-111.
- Grossfeld G, Litwin M, Wolf J. Evaluation of asymptomatic microscopic hematuria in adults: The American Urological Association best practice policy—Part I: Definition, detection, prevalence, and etiology. Urology. 2001;57:599-603.
- Grossfeld G, Litwin M, Wolf J. Evaluation of asymptomatic microscopic hematuria in adults: the American Urological Association best practice policy—Part II: Patient evaluation, cytology, voided markers, imaging, cystoscopy, nephrology evaluation, and follow-up. Urology. 2001;57:604-610.
- Warshauer D, McCarthy S, Street L. Detection of renal masses: Sensitivities and specificities of excretory urography/linear tomography, US, and CT. Radiology. 1988;169:363-365.
- Jamis-Dow C, Choyke P, Jennings S. Small (≤ 3-cm) renal masses: Detection with CT versus US and pathologic correlation. Radiology. 1996;198:785-788.
- Fielding J, Silverman S, Samuel S. Unenhanced helical CTof ureteral stones: A replacement for excretory urography in planning treatment. AJR Am J Roentgenol. 1998;171:1051-1053.
- Smith R, Rosenfield A, Choe K. Acute flank pain: Comparison of non-contrast-enhanced CT and intravenous urography. Radiology. 1995;194:789-794.
- Miller O, Rineer S, Reichard S. Prospective comparison of unenhanced spiral computed tomography and intravenous urogram in the evaluation of acute flank pain. Urology. 1998;52:982-987.
- Niall O, Russell J, MacGregor R. A comparison of noncontrast computerized tomography with excretory urography in the assessment of acute flank pain. J Urol. 1999;161:534-537.
- Yilmaz S, Sindel T, Arslan G. Renal colic: Comparison of spiral CT, US and IVU in the detection of ureteral calculi. Eur Radiol. 1998;8:212-217.
- McCoy J, Honda H, Reznicek M. Computerized tomography for detection and staging of localized and pathologically defined upper tract urothelial tumors. J Urol. 1991;146:1500-1503.
- Planz B, George R, Adam G. Computed tomography for detection and staging of transitional cell carcinoma of the upper urinary tract. Eur Urol. 1995;27:146-150.
- Badalament R, Bennett W, Bova J. Computed tomography of primary transitional cell carcinoma of upper urinary tracts. Urology. 1992;40:71-75.
- Perlman E, Rosenfield A, Wexler J. CT urography in the evaluation of urinary tract disease. J Comput Assist Tomogr. 1996;20:620-626.
- . 2000.
- McCollough C, Daly T, King B. An auxiliary CT tabletop for radiography at the time of CT. J Comput Assist Tomogr. 2001;25:876-880.
- Cohan R, Sherman L, Korobkin M. Renal masses: Assessment of corticomedullary-phase and nephrographic-phase CT scans. Radiology. 1995;196:445-451.
- Birnbaum B, Jacobs J, Ramchandani P. Multiphasic renal CT: Comparison of renal mass enhancement during the corticomedullary and nephrographic phases. Radiology. 1996;200:753-758.
- Kopka L, Fischer U, Zoeller G. Dual-phase helical CTof the kidney: Value of the corticomedullary and nephrographic phase for evaluation of renal lesions and preoperative staging of renal cell carcinoma. AJR Am J Roentgenol. 1997;169:1573-1578.
- Szolar D, Kammerhuber F, Altziebler S. Multiphasic helical CT of the kidney: Increased conspicuity for detection and characterization of small (<3-cm) renal masses. Radiology. 1997;202:211-217.
- McNicholas M, Raptopoulos V, Schwartz R. Excretory phase CTurography for opacification of the urinary collecting system. AJR Am J Roentgenol. 1998;170:1261-1267.
- Heneghan J, Kim D, Leder R. Compression CT urography: A comparison with IVU in the opacification of the collecting system and ureters. J Comput Assist Tomogr. 2001;25:343-347.
- Nolte-Ernsting C, Wildberger J, Borchers H. Multi-slice CTurography after diuretic injection: Initial results. Rofo Fortschr Geb Rontgenstr Neuen Bildgeb Verfahr. 2001;173:176-180.
- Eisenberg R, Bank W, Hedgock M. Renal failure after major angiography can be avoided with hydration. AJR Am J Roentgenol. 1981;136:859-861.
- Gerlach A, Pickworth K. Contrast medium-induced nephrotoxicity: Pathophysiology and prevention. Pharmacotherapy. 2000;20:540-548.
- Thomsen H, Morcos S. Contrast media and the kidney: European Society of Urogenital Radiology (ESUR) Guidelines. Br J Radiol. 2003;76:513-518.
- Chow L, Sommer F. Multidetector CT urography with abdominal compression and reconstruction by sliding thin-slab maximum intensity projection. Radiology. 2001;221:183.
- Napel S, Rubin G, Jeffrey R. STS-MIP: A new reconstruction technique for CT of the chest. J Comput Assist Tomogr. 1993;17:832-838.
- McTavish J, Jinzaki M, Zou K. Multi-detector row CT urography: Comparison of strategies for depicting the normal urinary collecting system. Radiology. 2002;225:783-790.
- Caoili E, Cohan R, Korobkin M. Effectiveness of abdominal compression during helical renal CT. Acad Radiol. 2001;8:1100-1106.
- Chow L, Sommer F. Multidetector CT urography with abdominal compression and three-dimensional reconstruction. AJR Am J Roentgenol. 2001;177:849-855.
- Baron R, McClennan B, Lee J. Computed tomography of transitional-cell carcinoma of the renal pelvis and ureter. Radiology. 1982;144:125-130.
- Urban B, Buckley J, Soyer P. CT appearance of transitional cell carcinoma of the renal pelvis: Part 1. Early-stage disease. AJR Am J Roentgenol. 1997;169:157-161.
- Gatewood O, Goldman S, Marshall F. Computerized tomography in the diagnosis of transitional cell carcinoma of the kidney. J Urol. 1982;127:876-887.
- Leder R, Dunnick N. Transitional cell carcinoma of the pelvicalices and ureter. AJR Am J Roentgenol. 1990;155:713-722.
- Conrad L, Kirsh E, Steinberg G. Comparative viewing modalities for CTcystography. Abdom Imaging. 2001;26:92-97.
Citation
. Multidetector-row CT urography in clinical practice. Applied Radiology. 2004;33(7):22-32. doi:10.37549/AR1260.