Osseous Findings in Sickle Cell Disease
Applied Radiology — Vol. 49 , Issue 2 , pp. 30 -34
DOI: 10.37549/AR2638
Published: March 1, 2020
1 Division of Musculoskeletal Imaging, University of Mississippi Medical Center, Jackson, MS
Categories
Sickle cell disease results from a single gene mutation that causes an amino acid substitution on the β globin chain of hemoglobin A. This abnormal form of hemoglobin, called Hb S, aggregates into long chains when deoxygenated.1 These aggregated hemoglobin chains irreversibly deform erythrocytes into a sickle shape. Sickled red cells can cause microvascular occlusion, leading to tissue ischemia and infarction. Additionally, hemolytic anemia results from the breakdown of the abnormal sickle cells by the reticuloendothelial system. The sickle cell gene mutation is inherited in an autosomal recessive pattern. Patients who are homozygous for Hb S have the most severe disease manifestation, termed sickle cell anemia. Patients who are heterozygous, with one Hb S gene and one normal Hb A gene, termed sickle cell trait, usually do not have significant disease. Sickle cell anemia occurs most commonly in patients of African origin and affects approximately 0.2% of African Americans. The multiple complications of sickle cell anemia that involve the skeletal system are related to both microvascular occlusion and the consequences of prolonged anemia. This article reviews the presentation of these complications on radiographs and magnetic resonance imaging (MRI).
Bone Infarction
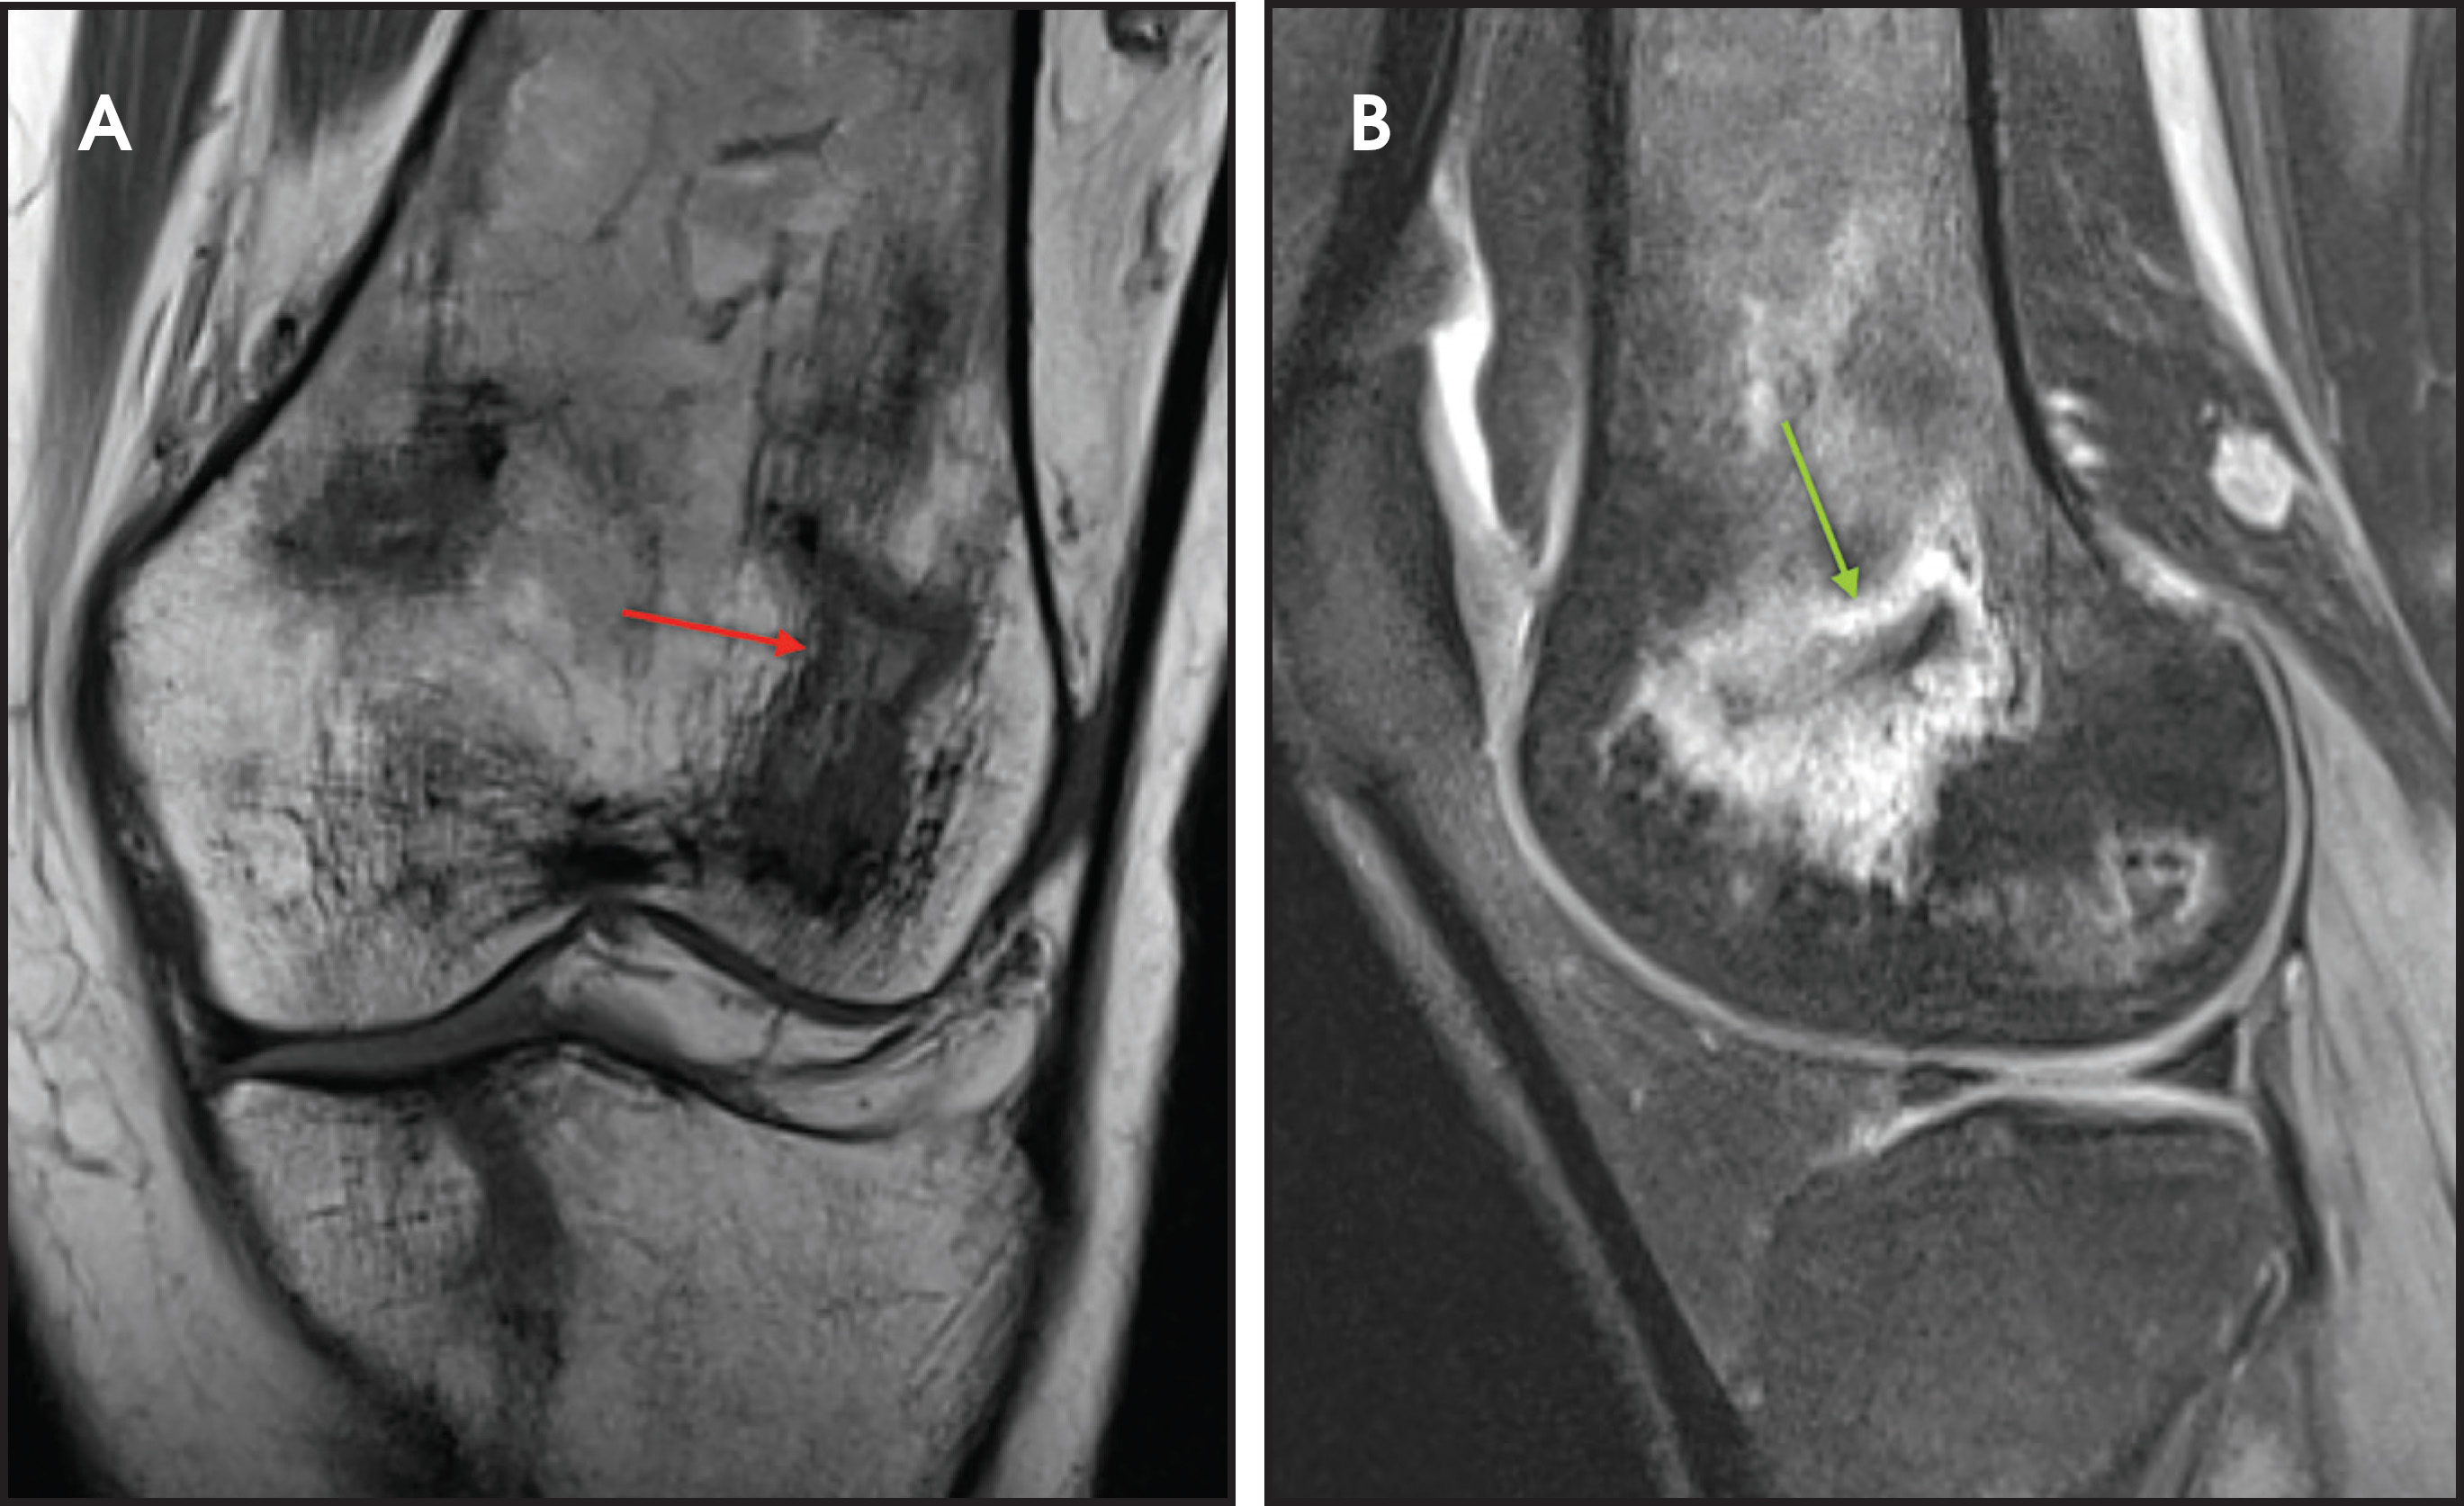
Bone infarction results from microvascular stasis or occlusion by sickled red blood cells, with subsequent ischemic and hypoxia. The tissue hypoxia then induces further erythrocyte sickling. Bone infarctions are typically seen in the medullary cavities and epiphyses of the long bones.2 They are usually painful but may be silent and discovered incidentally. Radiographs are initially negative, but eventually a centrally lucent, peripherally sclerotic area with serpiginous borders becomes evident. On MRI, the signal in the center of the infarction usually resembles that of normal marrow (Figure 1).3 Acutely, an ill-defined area of high signal may be present, and the peripheral borders may enhance. Over time, a low T1 serpiginous rim develops. The “double-line sign” represents T2 hyperintense granulation tissue adjacent to dark T2 signal reflecting sclerosis (Figure 1).
Osteonecrosis
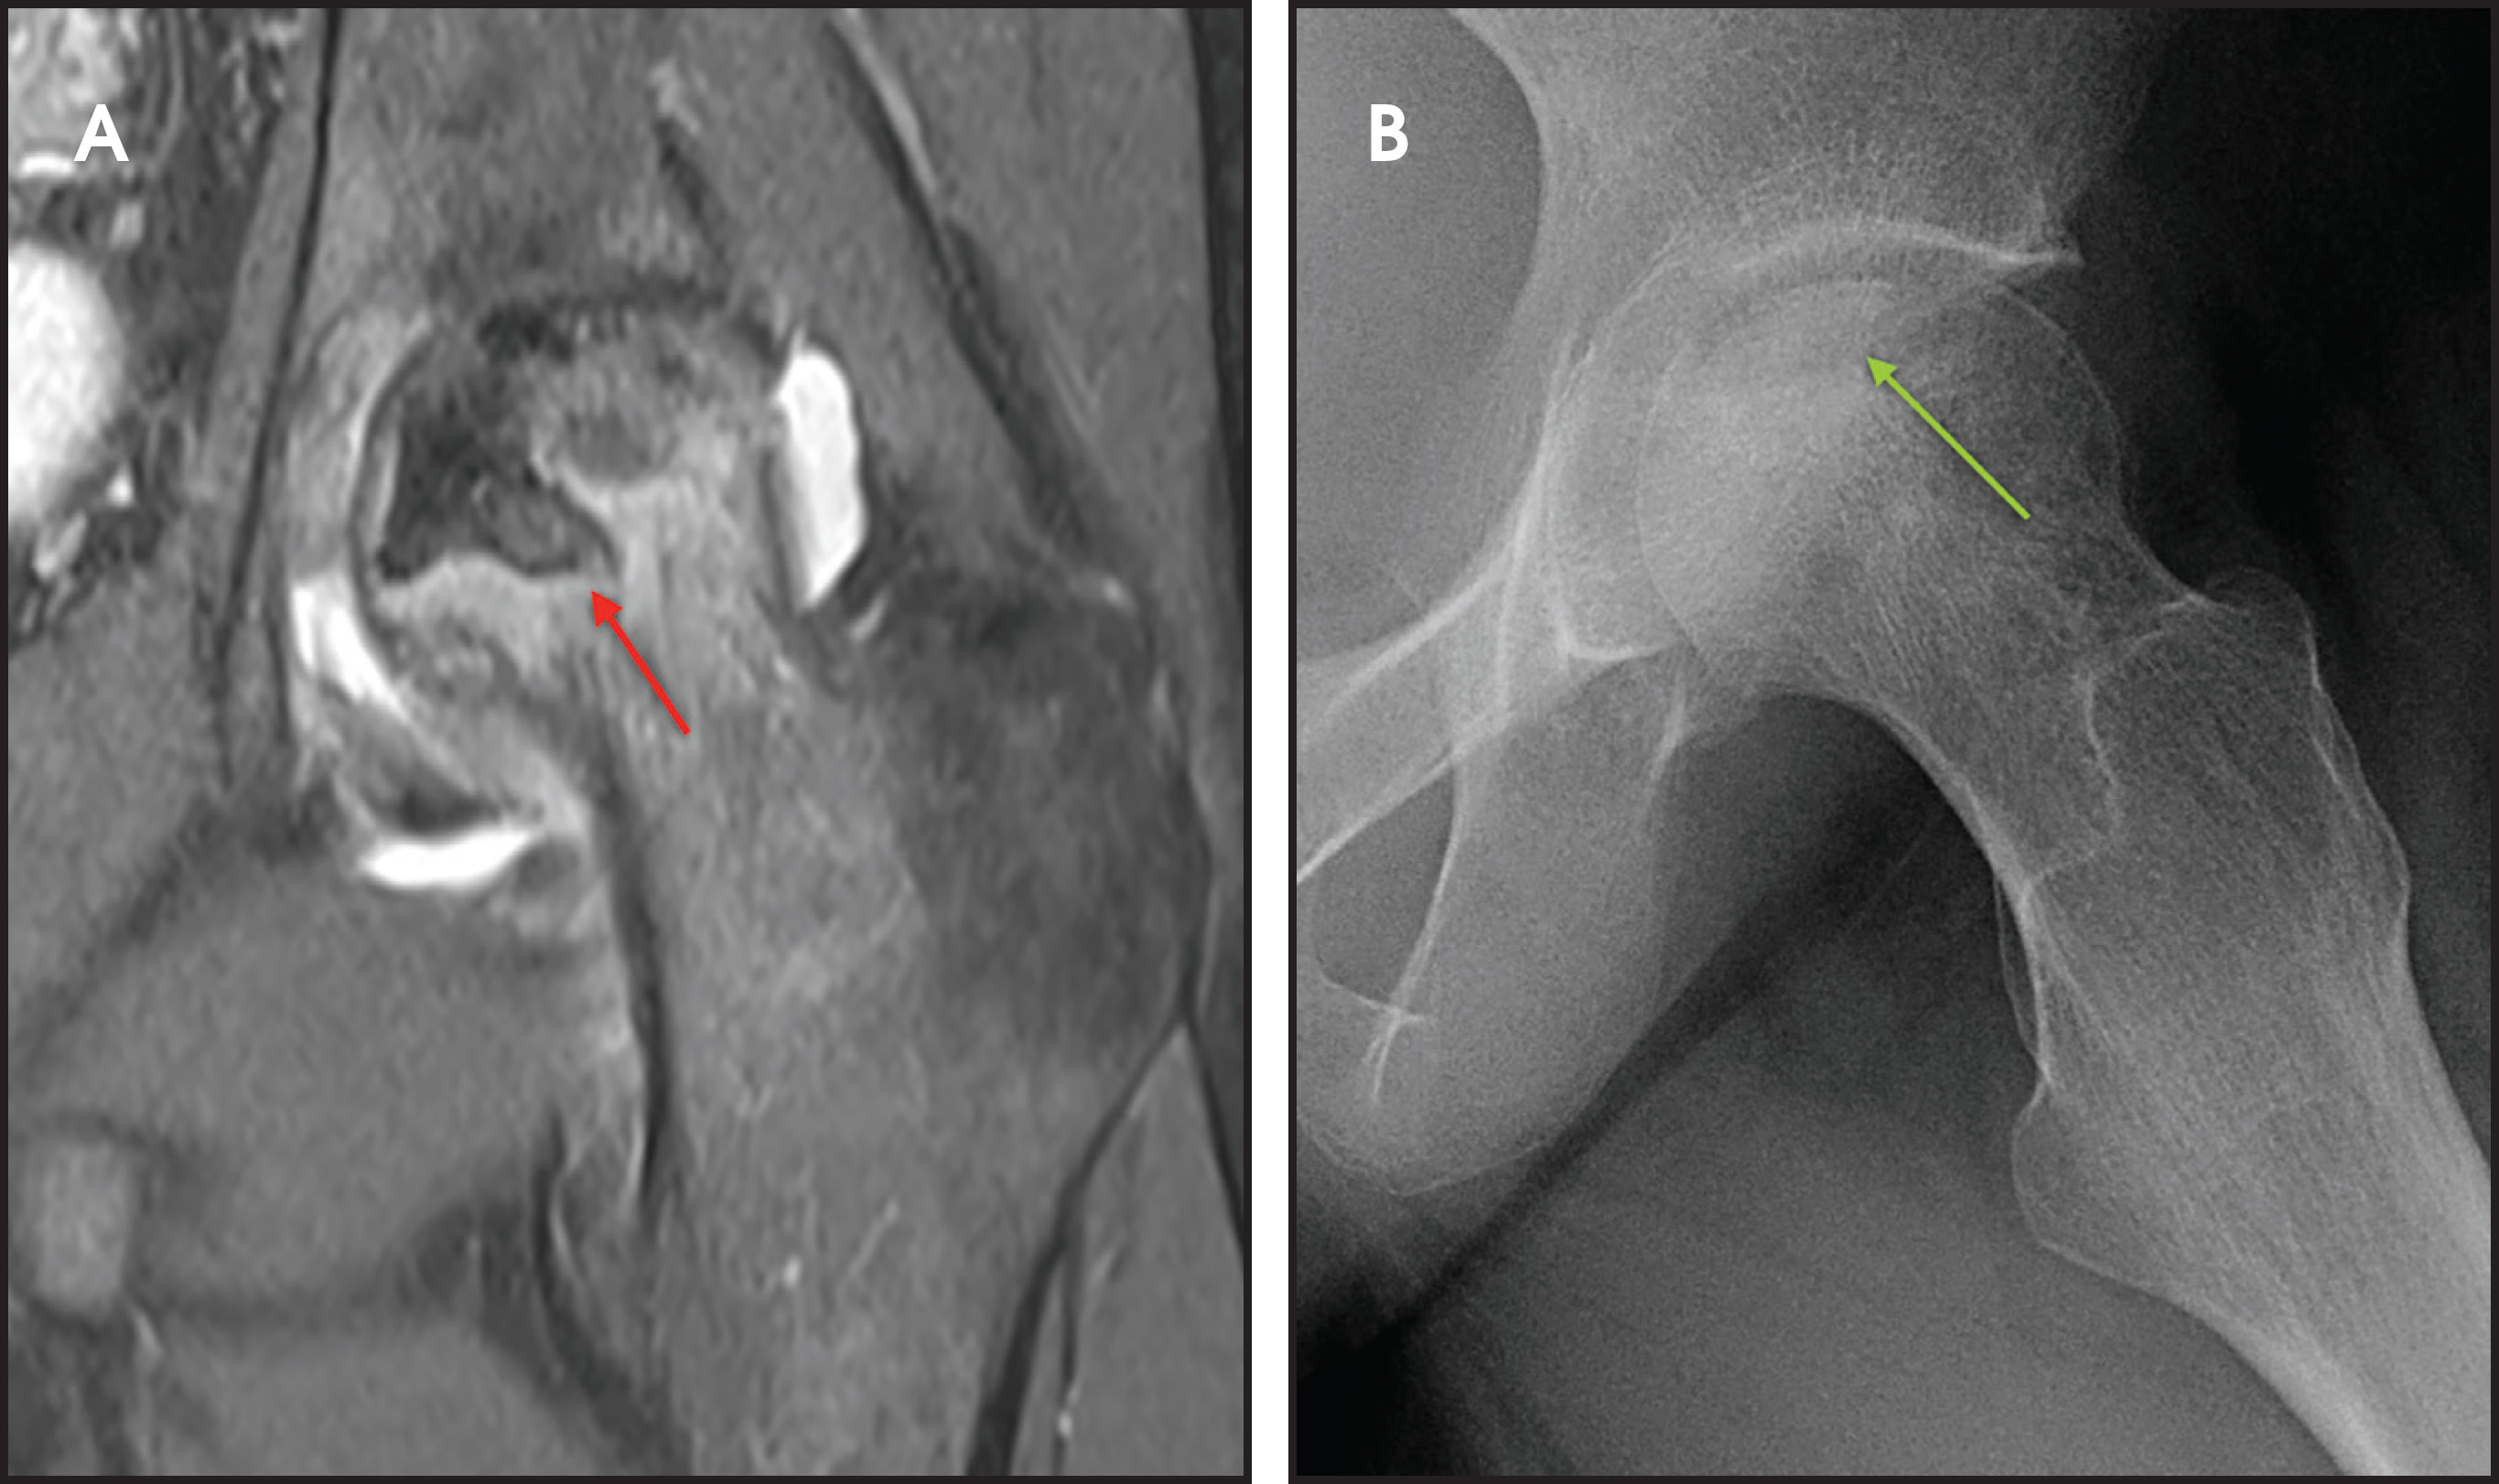
Osteonecrosis, or avascular necrosis, refers to infarction and necrosis of subchondral bone. This occurs through the same microvascular occlusion mechanism as marrow infarction, but the subchondral location can result in greater morbidity owing to its effect on the adjacent joint. Osteonecrosis is most common in the femoral head, likely a result of increased mechanical pressure related to weight bearing.4 On MRI, the early findings are related to bone marrow edema. The “double-line sign” may develop as necrosis progresses (Figure 2). Early radiographic signs include lucency or sclerosis within the epiphysis. Subsequently, a crescent-shaped lucency develops deep to the necrotic bone, and then depression of the articular surface with collapse and fragmentation can occur (Figure 2). Secondary osteoarthritis usually develops following subchondral bone collapse.
Vertebral Changes
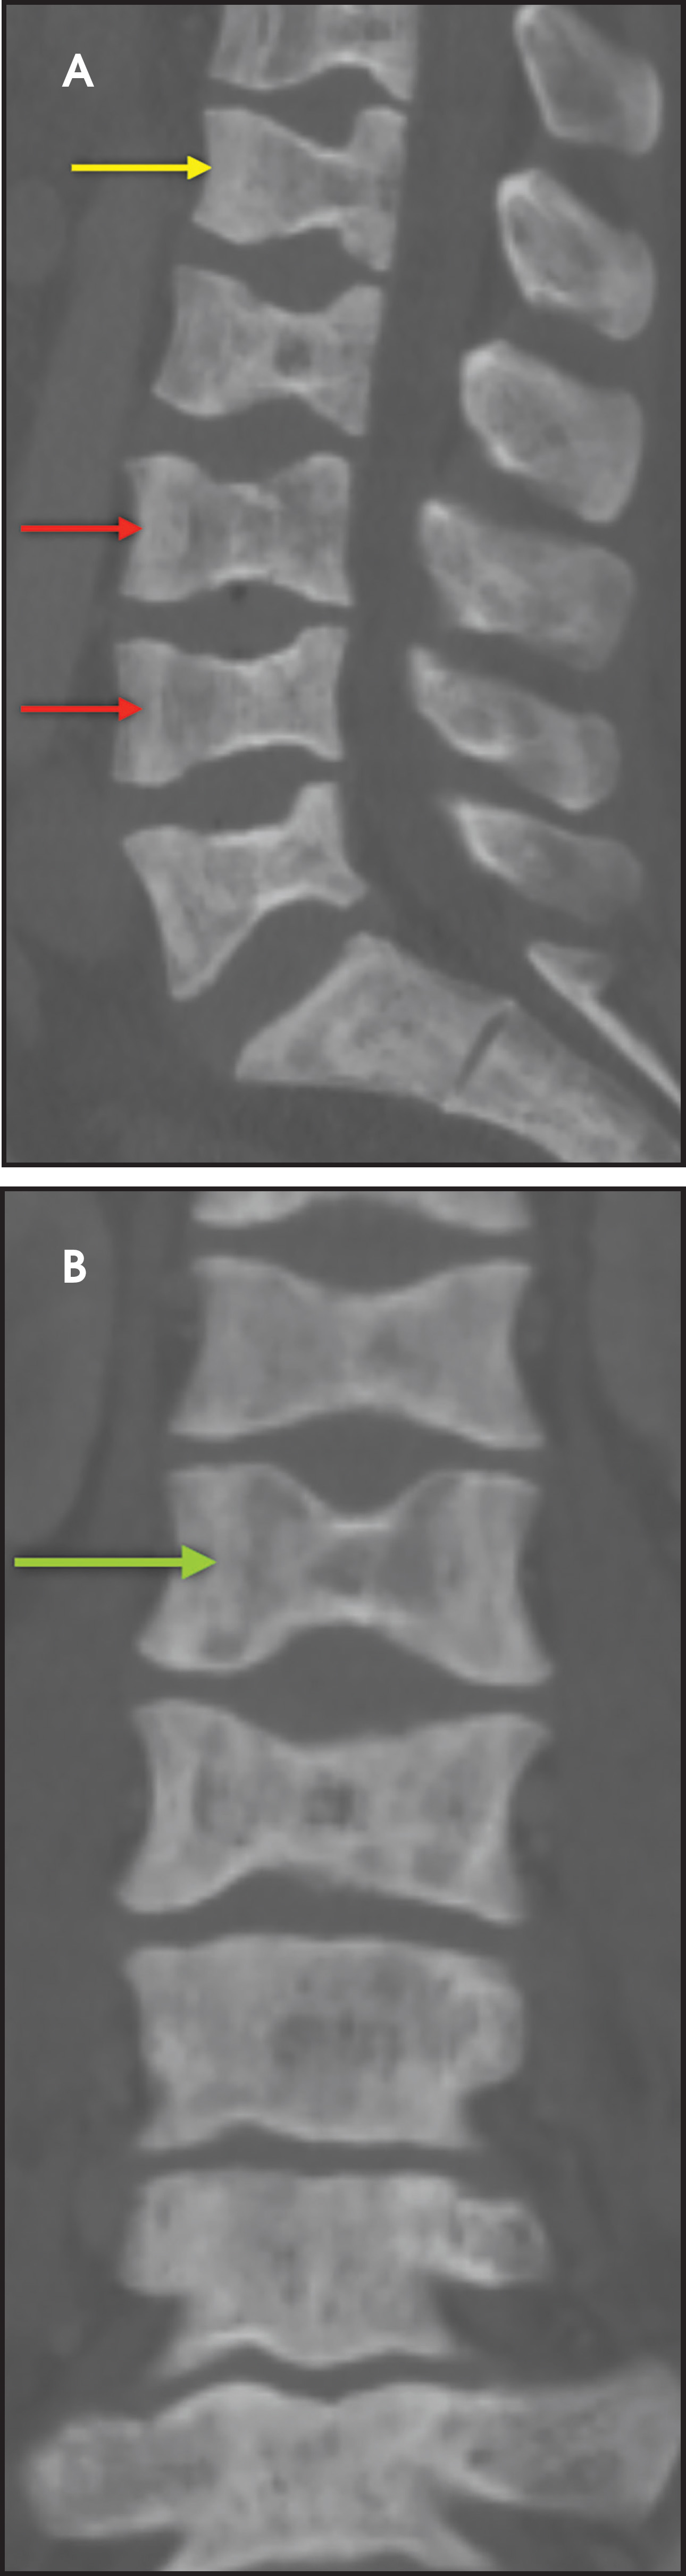
Vertebral endplate infarction causes cortical thinning and softening of the bone. The intervertebral disks can then compress the weakened endplates, giving the vertebral bodies a biconcave or H-shaped appearance (Figure 3).5 Bone marrow expansion secondary to increased production of red cells also contributes to thinning of cortical bone and osteopenia, owing to thinning of the trabeculae.6 This weakening of the bone can result in vertebral body compression or collapse, with resultant kyphosis.
Dactylitis
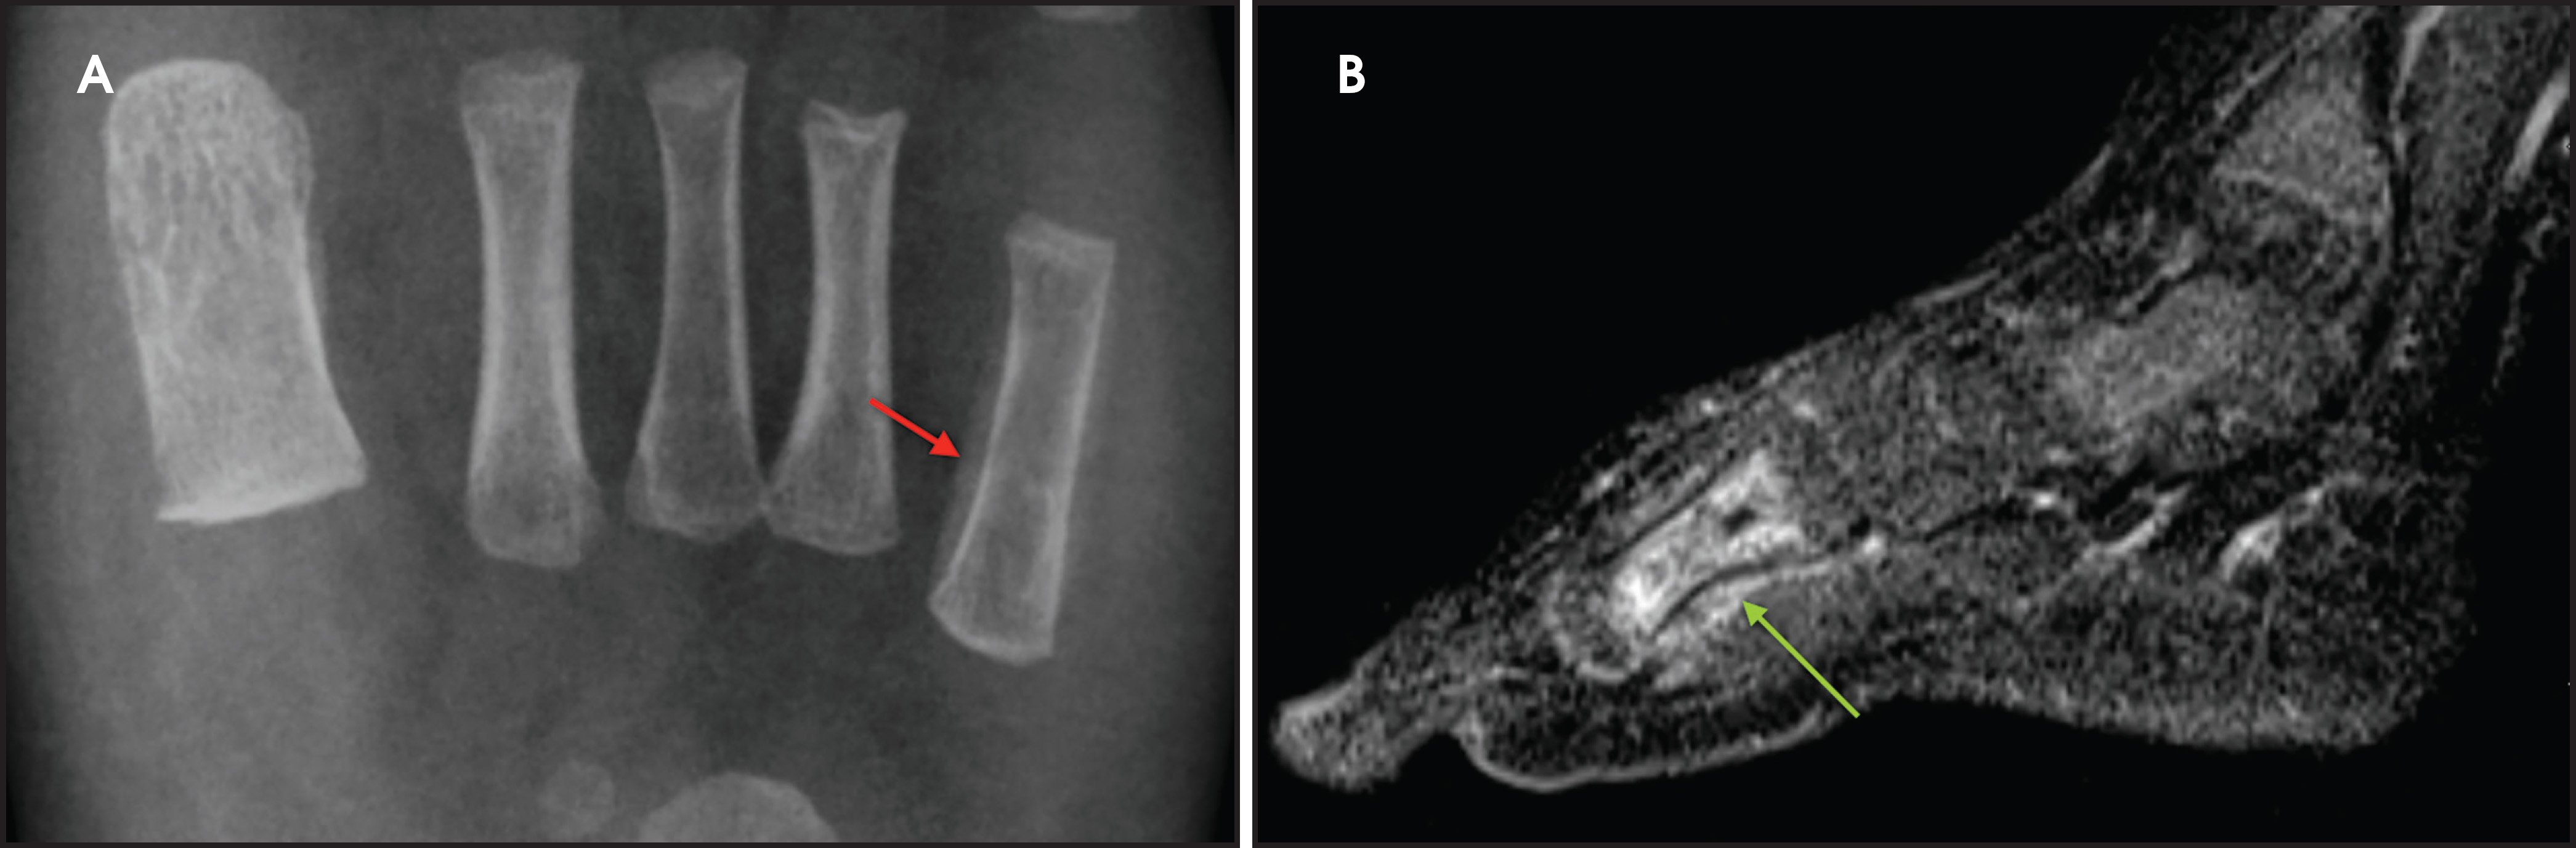
Infarction of small tubular bones of the hands and feet in children causes dactylitis, also referred to as hand-foot syndrome. This is most common between 6 months and 6 years of age, when red marrow is most abundant in the small bones.7 Dactylitis is rare in patients over 6 years, secondary to regression of red marrow in these areas. This syndrome occurs in half of children with sickle cell anemia. The child will present with tender and swollen hands or feet and fever. On radiographs, there is patchy lucency with periosteal reaction early in the process (Figure 4), followed by sclerosis with possible bone destruction and deformity over time. MRI will show osseous and soft-tissue edema and contrast enhancement (Figure 4), along with periosteal reaction.
Salmonella Osteomyelitis
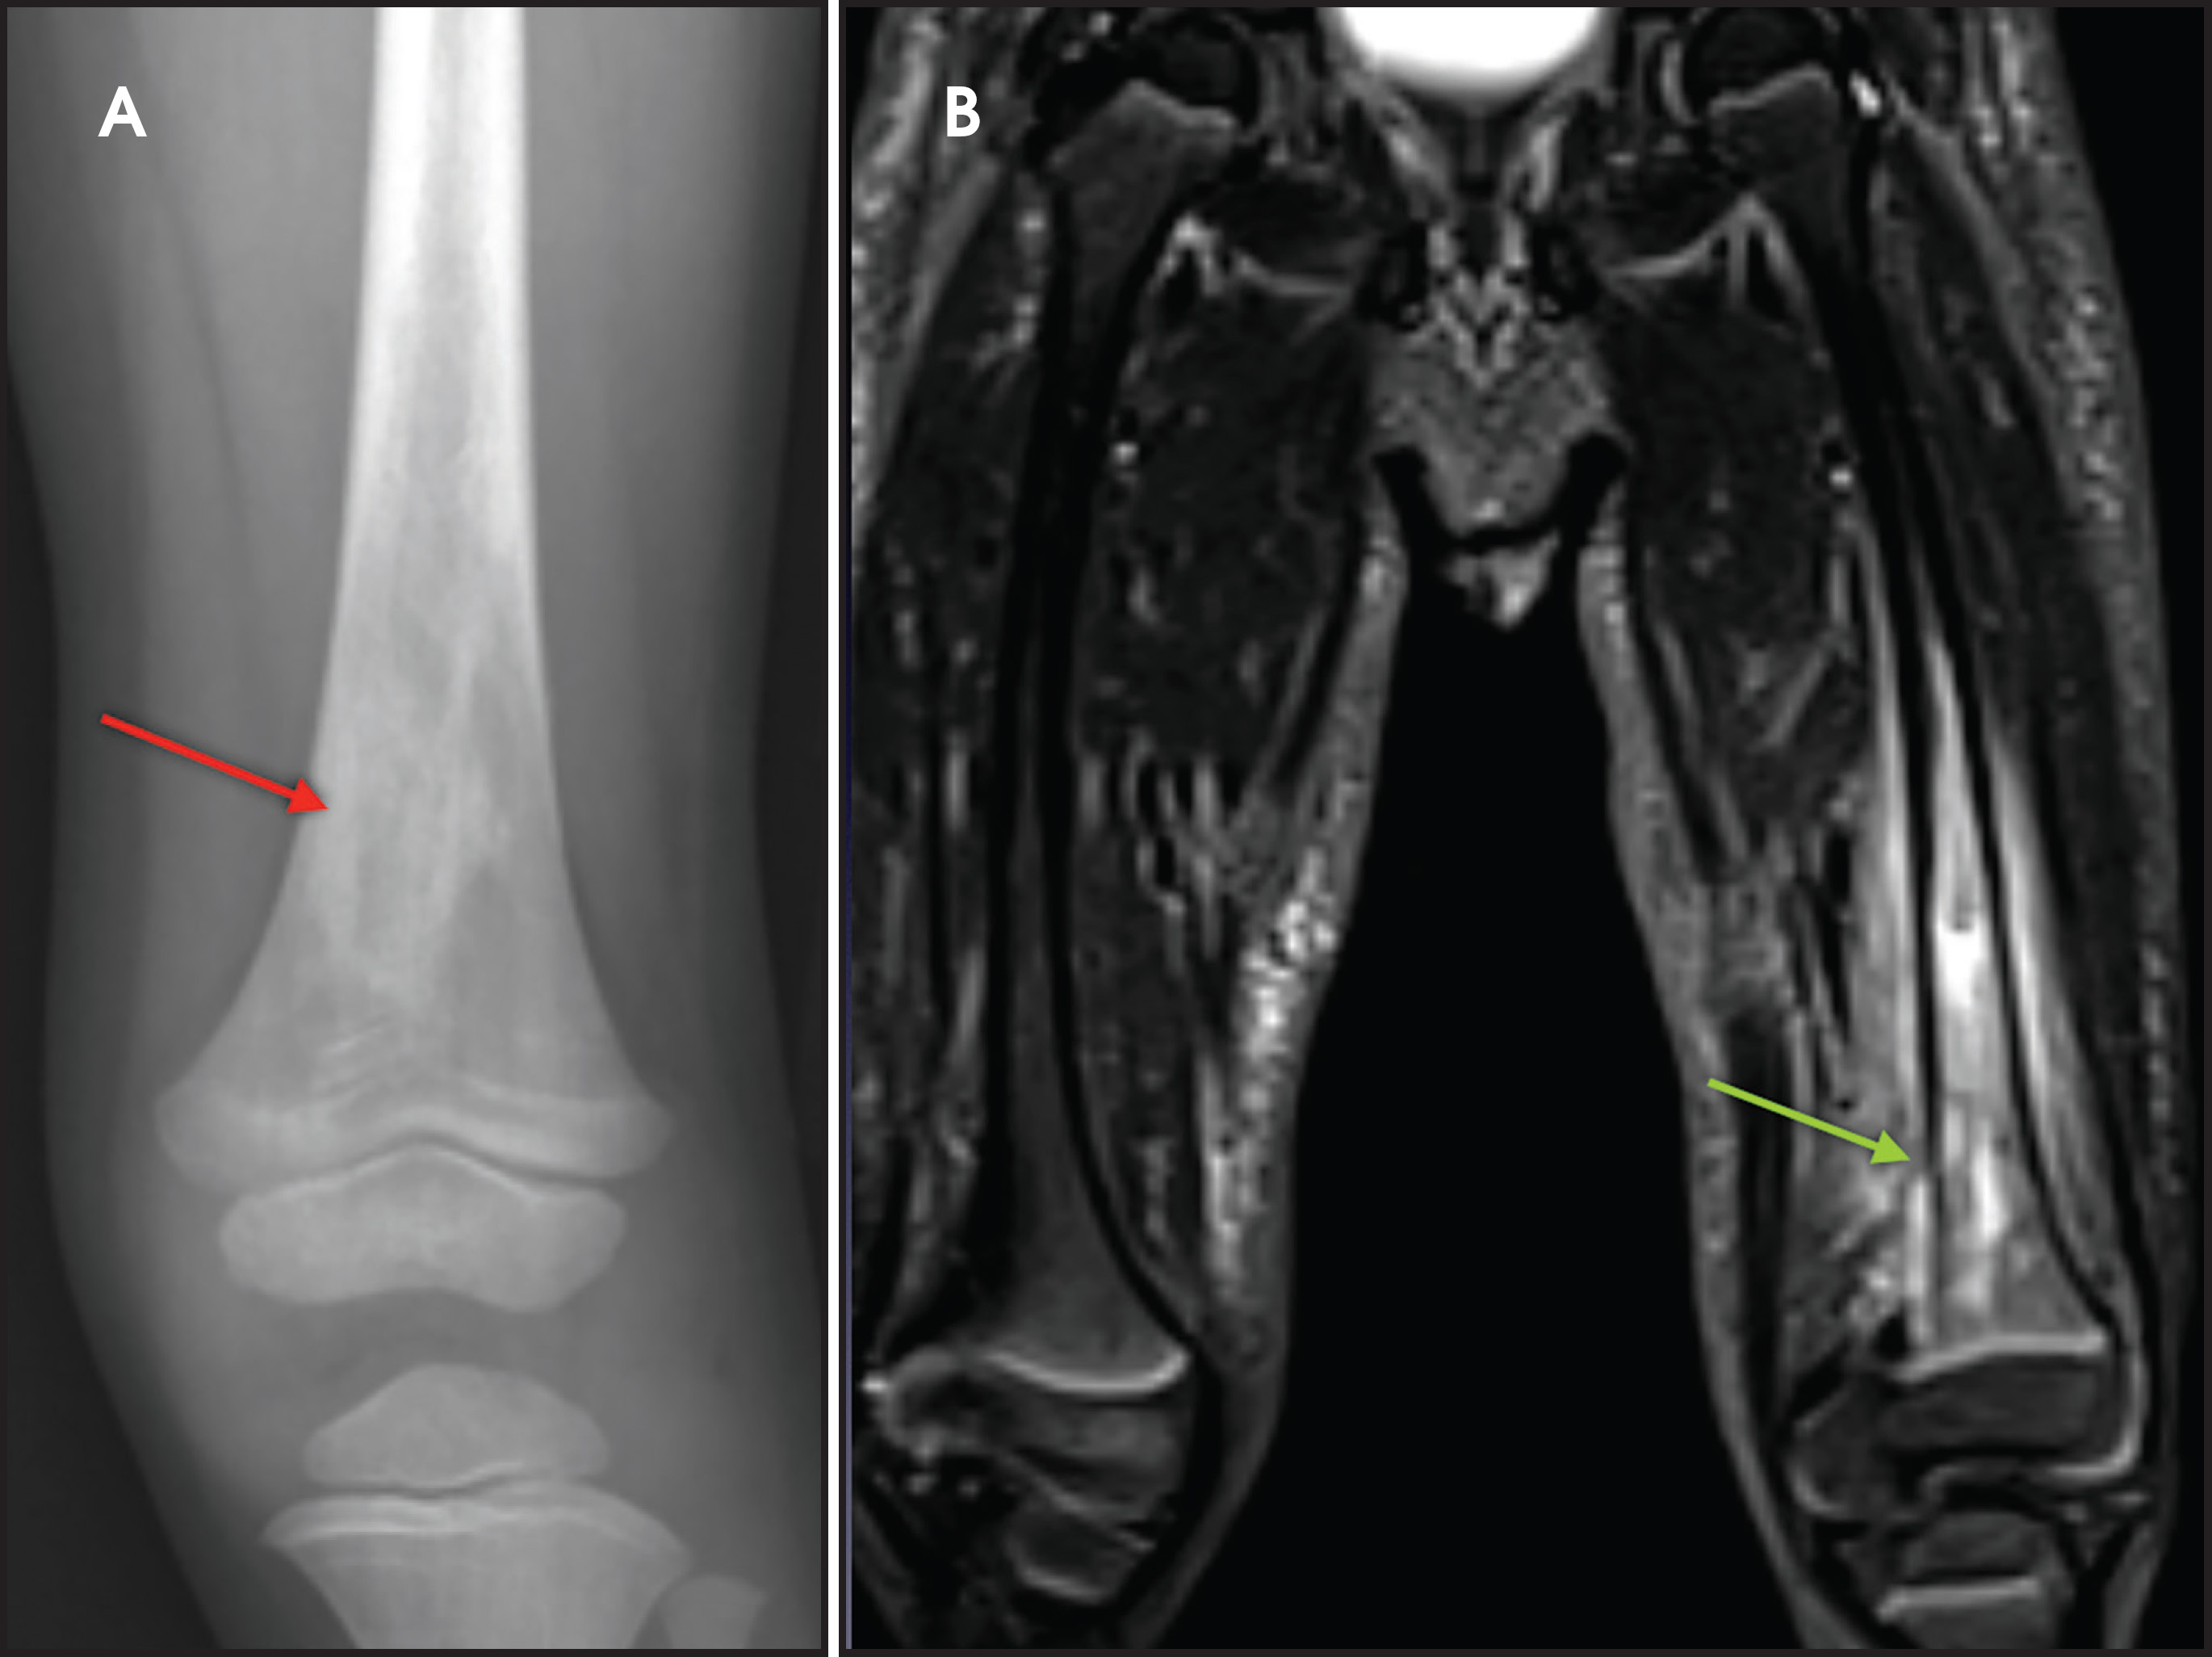
Osteomyelitis due to salmonella occurs with high frequency in sickle cell patients, with an estimated relative risk of at least 200 times the general population.8 This is thought to be secondary to a combination of hyposplenism from splenic autoinfarction, a more favorable culture medium owing to bone infarction/necrosis and multiple hospital admissions with subsequent exposure to more pathogens. Salmonella osteomyelitis usually affects the long bones, with clinical features similar to acute bone infarction. Multiple serotypes of Salmonella have been implicated, and blood cultures will be positive for Salmonella species in approximately 50% of patients. The radiographic features are nonspecific and may be normal initially. Potential radiographic findings include periosteal reaction, regional osteopenia, sclerosis, and cortical destruction (Figure 5). MRI can show changes before they are evident on radiographs, including marrow edema, fluid collection/abscess, and abnormal marrow contrast enhancement (Figure 5).
Vertebral Osteomyelitis/Discitis
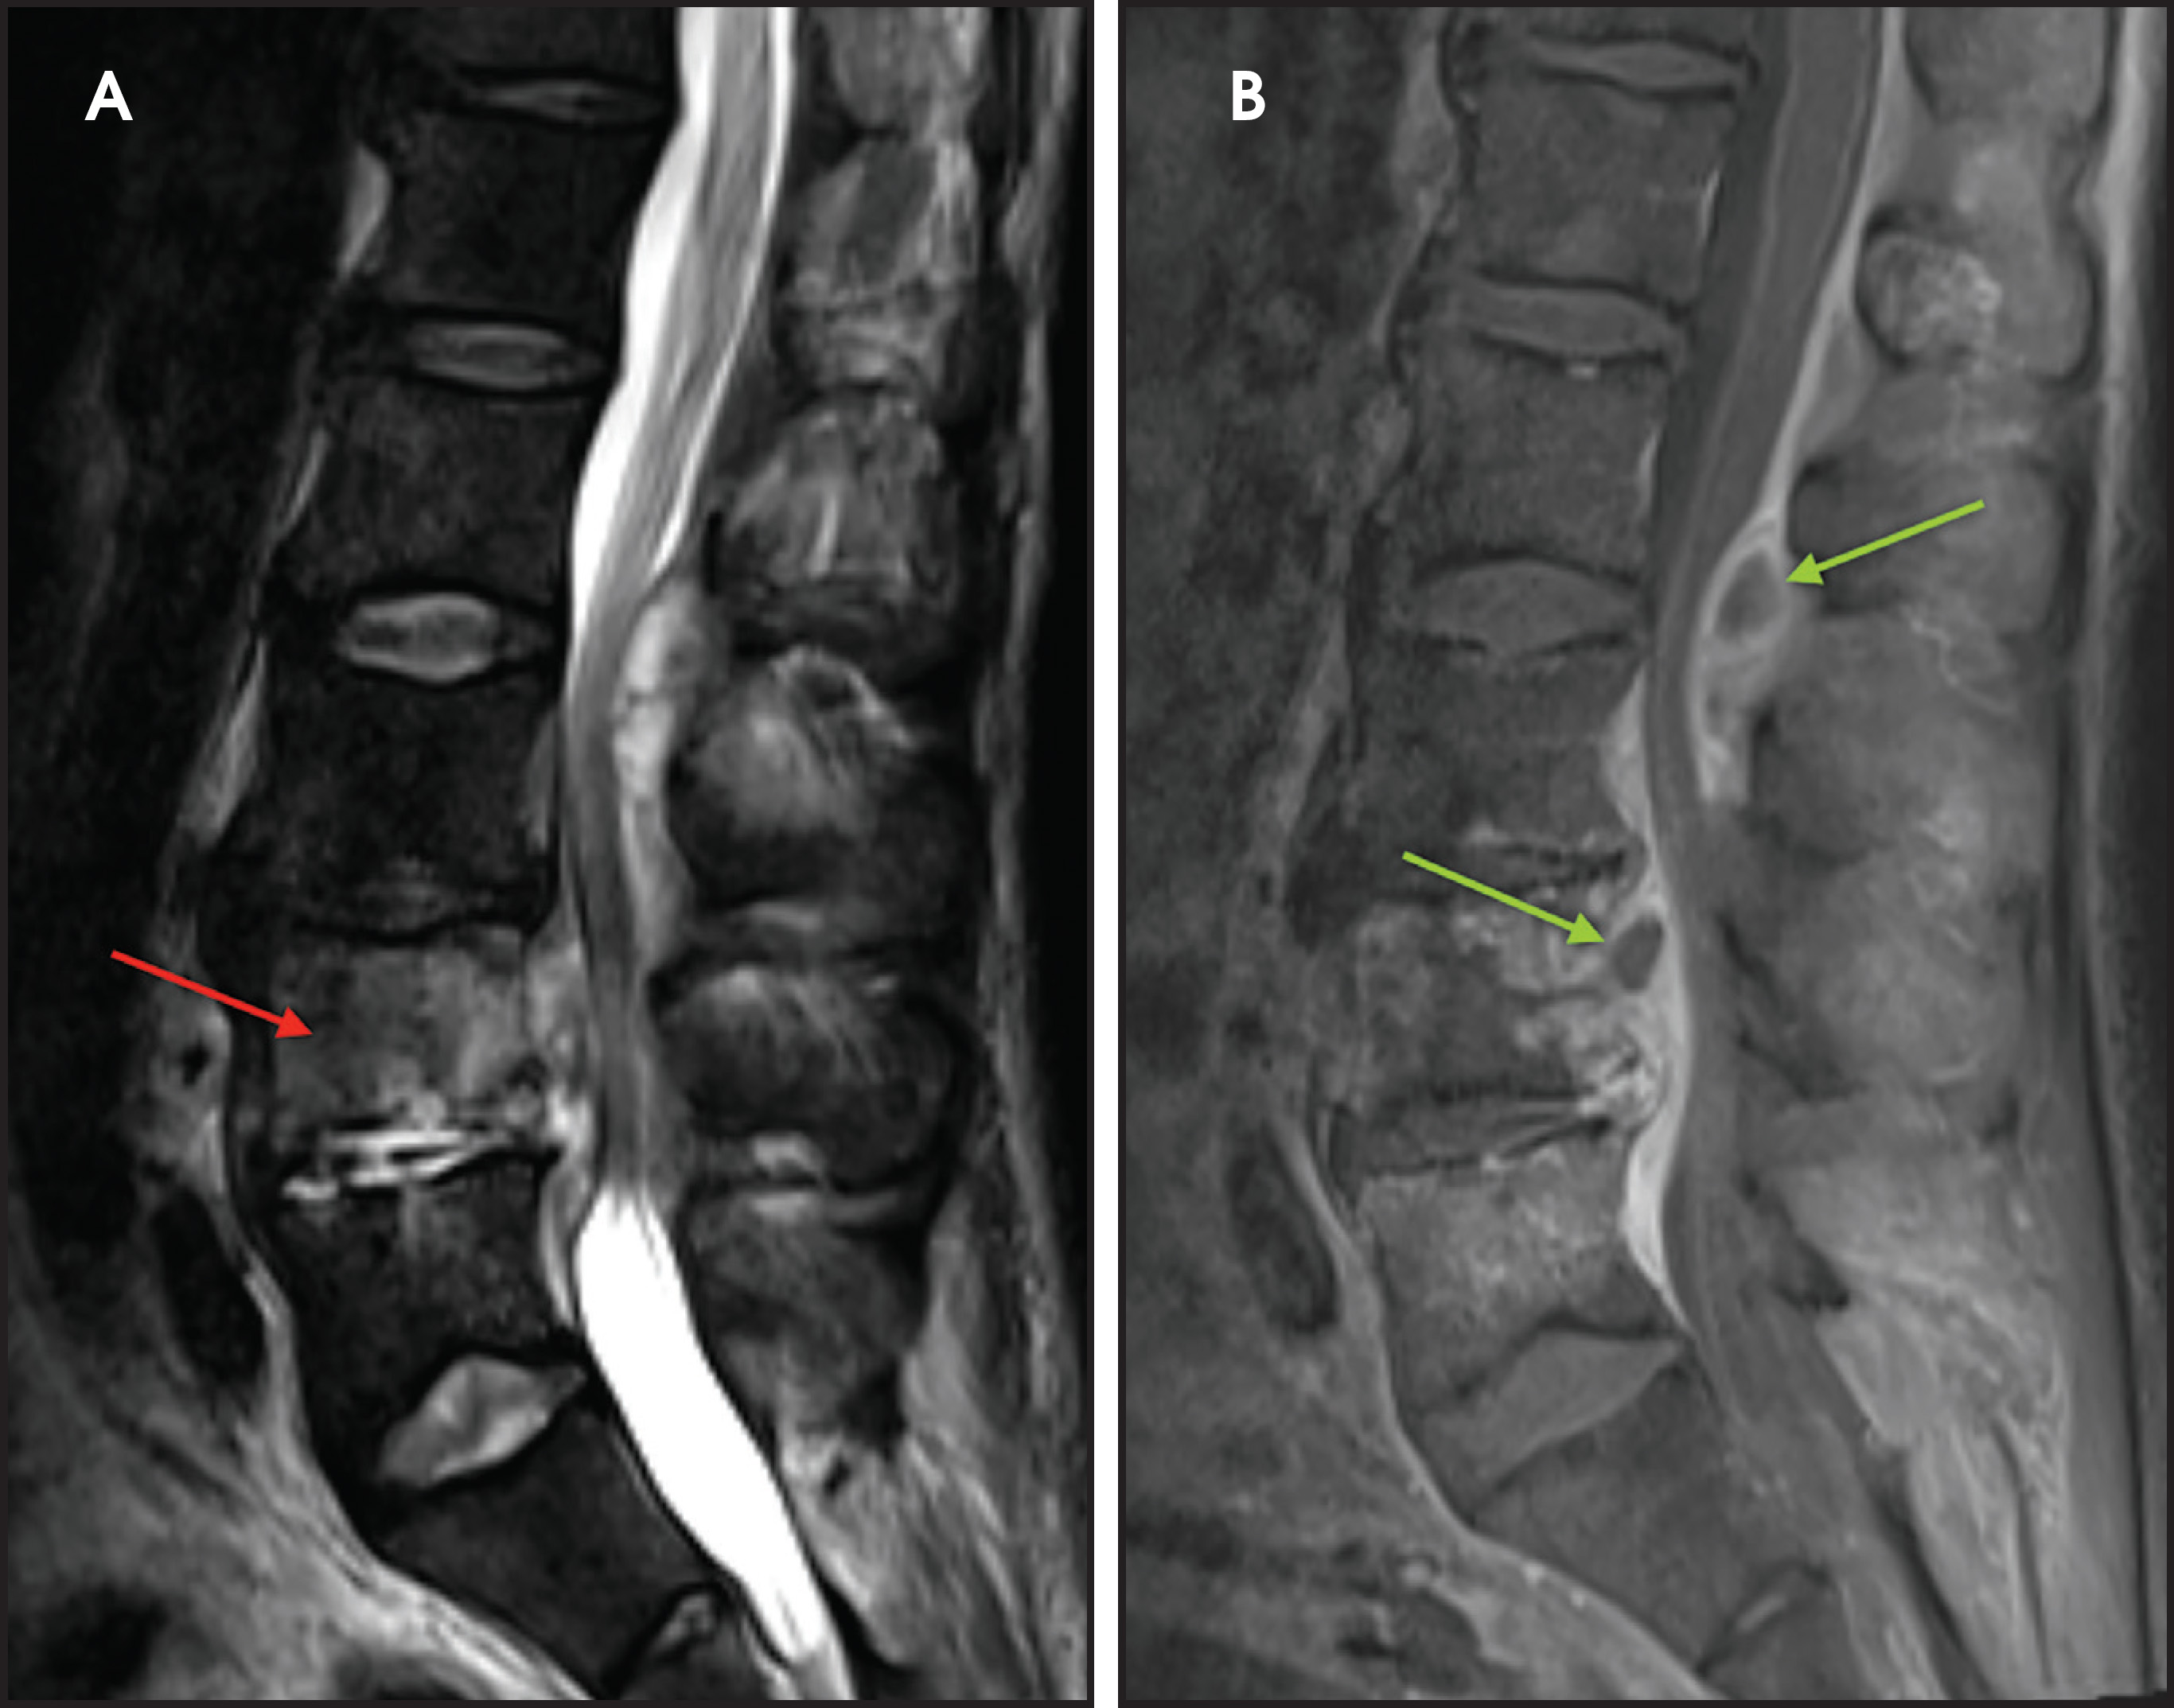
Vertebral osteomyelitis and discitis also occur with increased frequency in sickle cell patients. The most common causative agents are Staphylococcus and Salmonella species.9 Radiographs are often negative, particularly in the early stage of the infection. Osteopenia of the affected vertebrae may be present, possibly with disc space narrowing. On MRI, edema of the affected vertebra may be evident, along with low T1 marrow signal and contrast enhancement (Figure 6). Contrast administration and fat suprression will also highlight paraspinal and epidural abscesses (Figure 6).
Red Marrow Reconversion
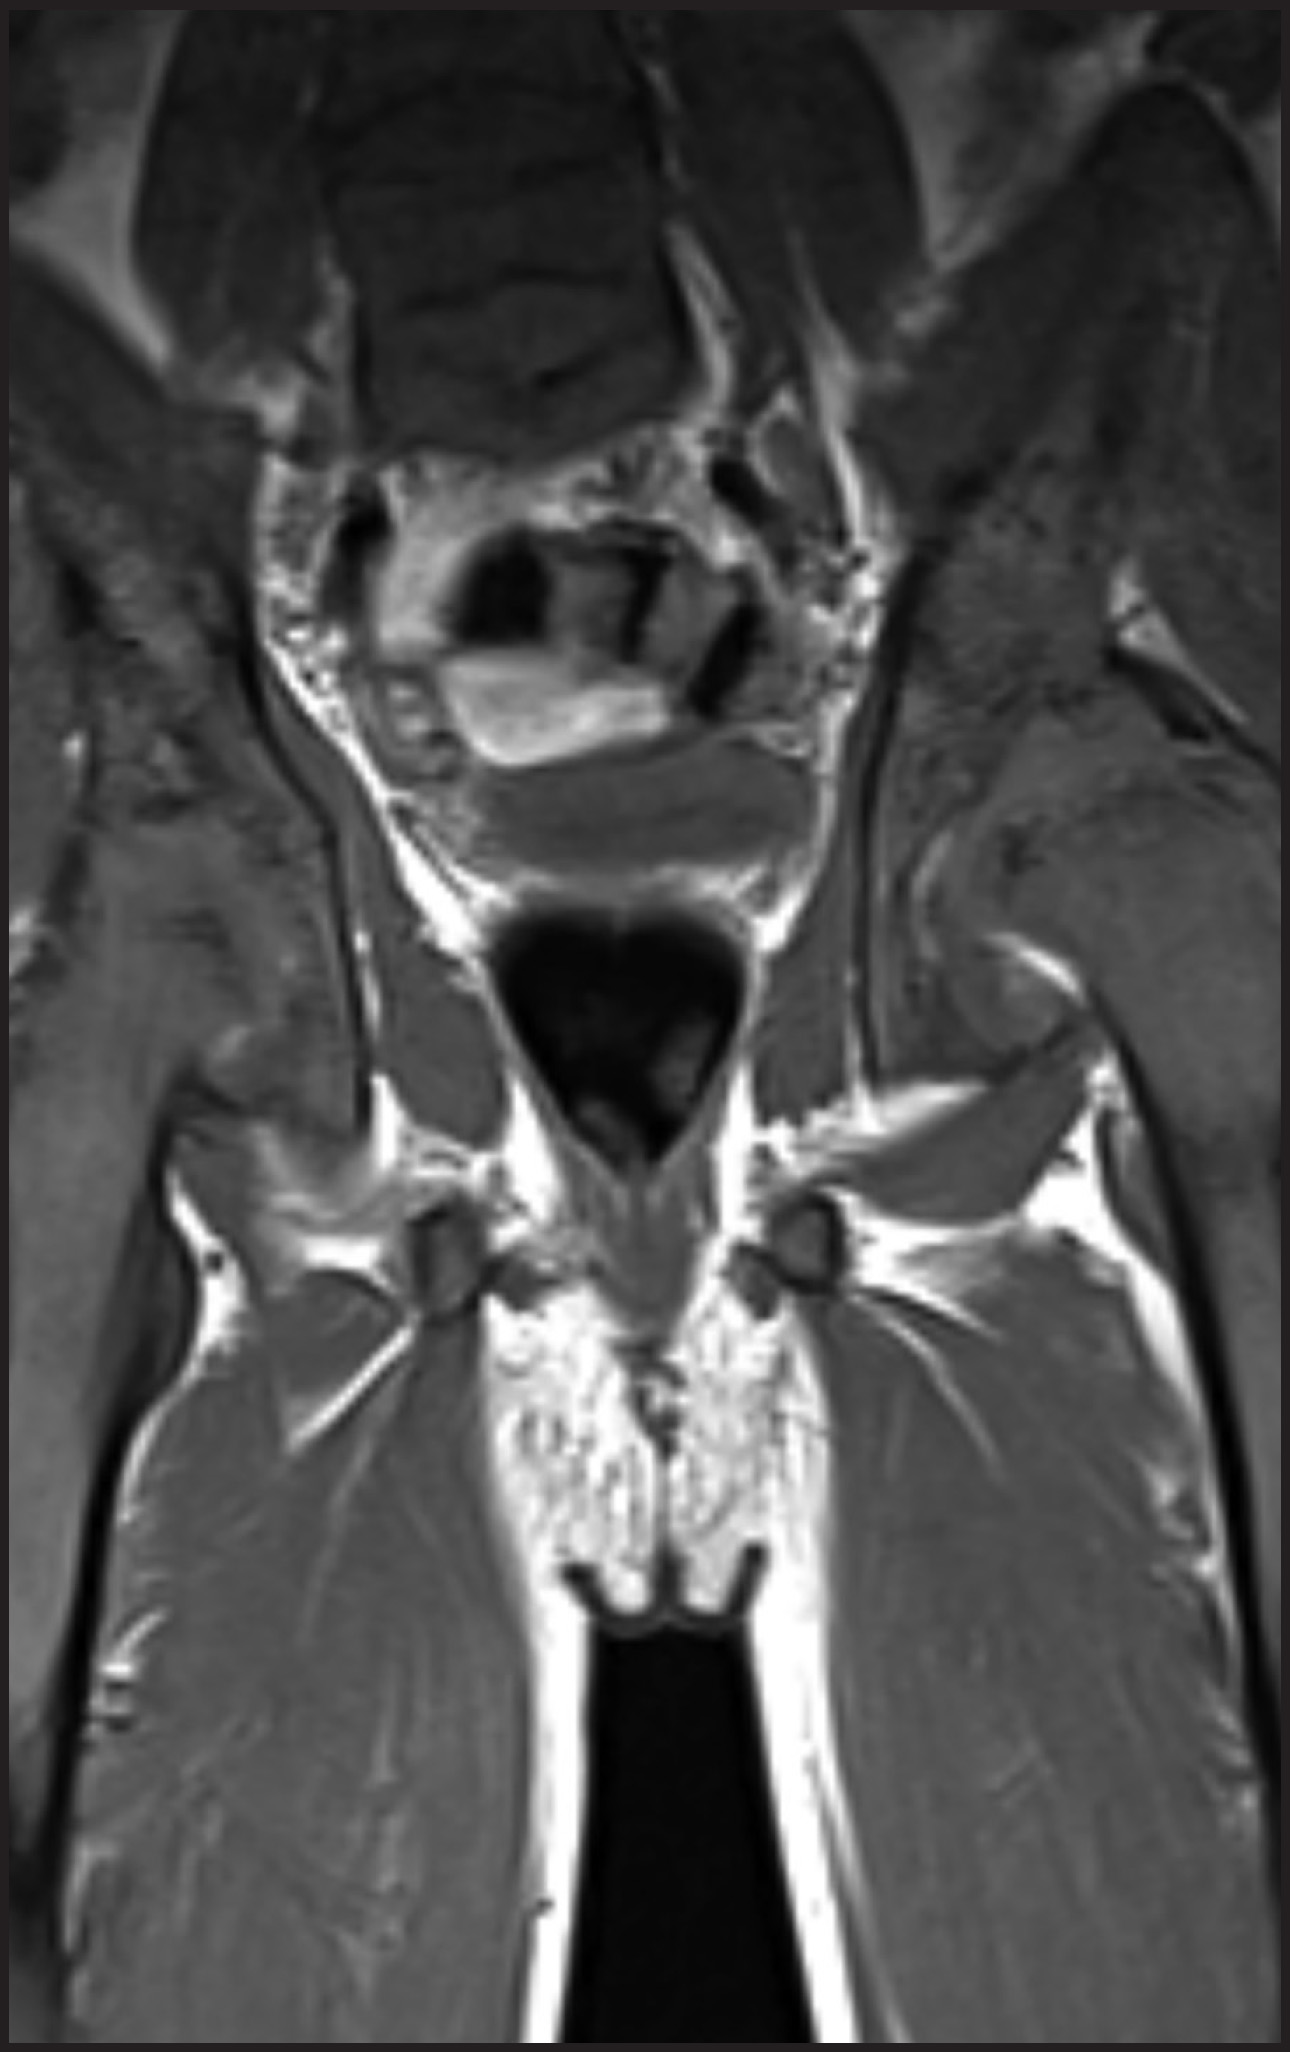
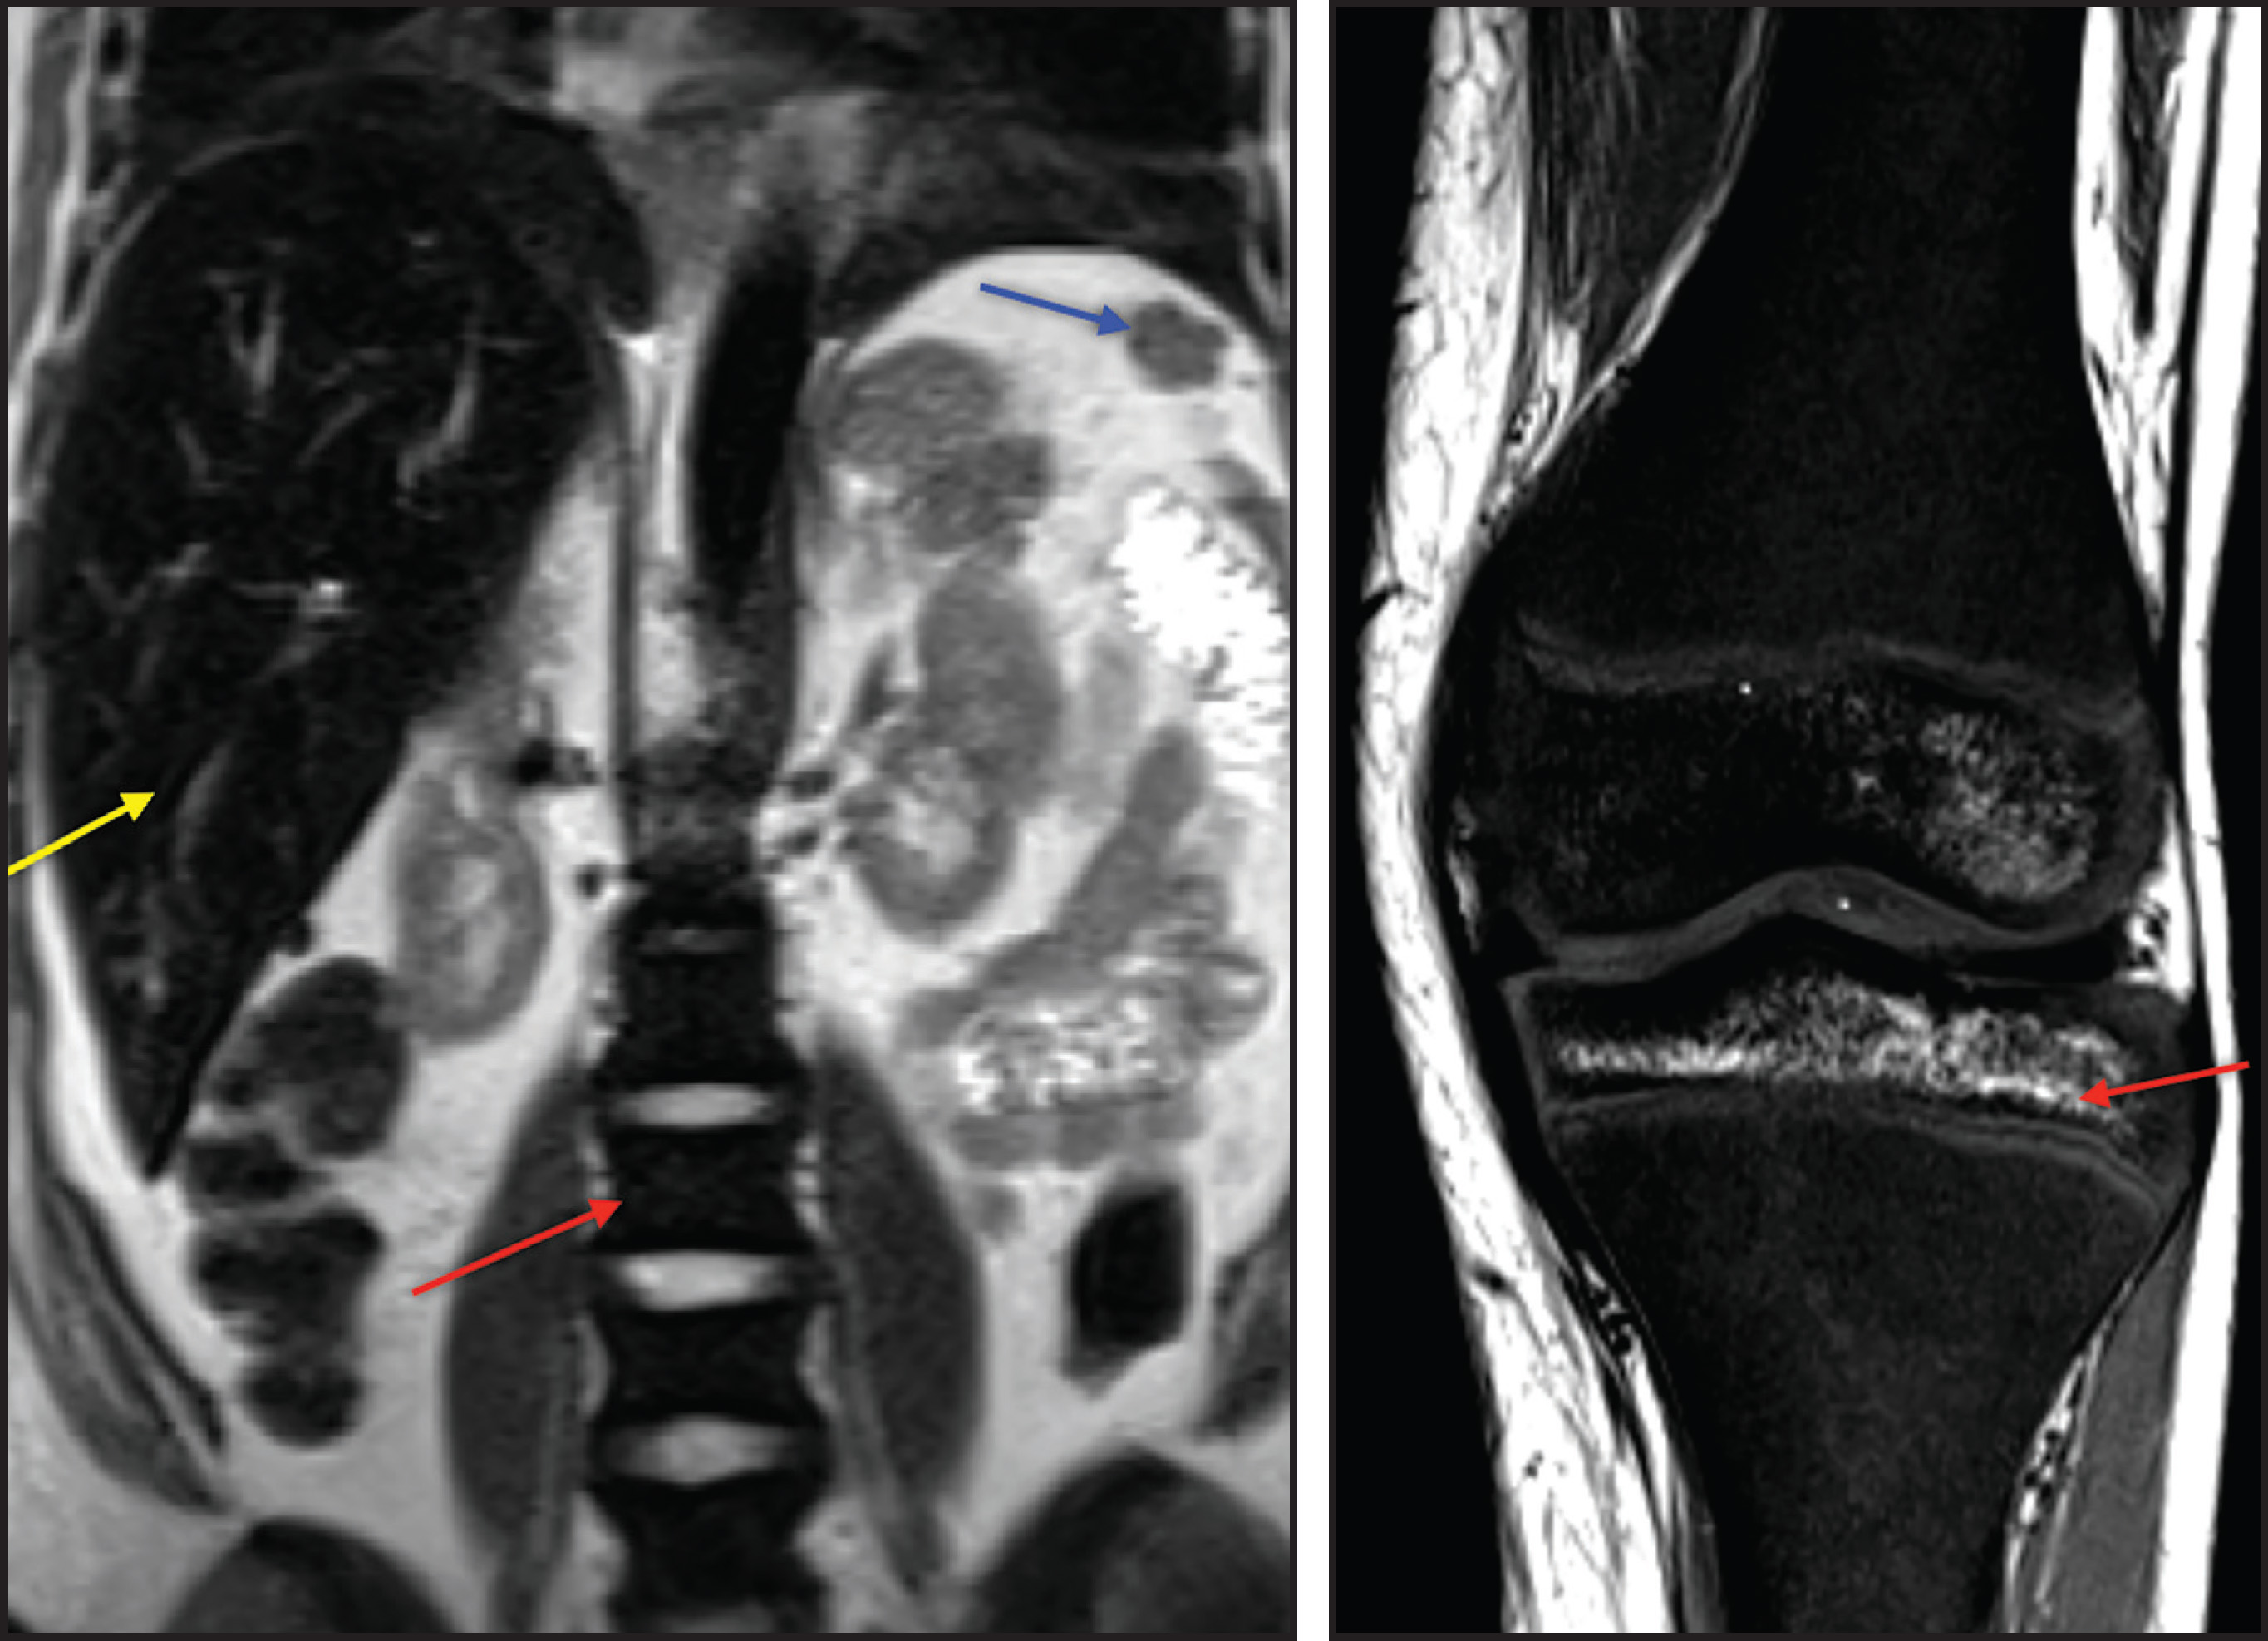
Hemolytic anemia increases demand for red blood cell production, which leads to recruitment of hematopoietic red marrow.10 Constant stimulation of red blood cell production also leads to widening of medullary spaces and thinning of the cortical bone. This marrow expansion can contribute to osteopenia. On MRI, red marrow signal intensity is lower than yellow marrow on T1 (Figure 7) and mildly hyperintense on T2. Red marrow reconversion is seen where there is usually fatty yellow marrow in an adult, including the axial skeleton and the epiphyses of the long bones. Red marrow is usually hyperintense to skeletal muscle on T1, due to interspersed yellow marrow, but iron deposition from hemolysis and blood transfusions can result in T1 signal lower than that of skeletal muscle.
Extramedullary Hematopoiesis
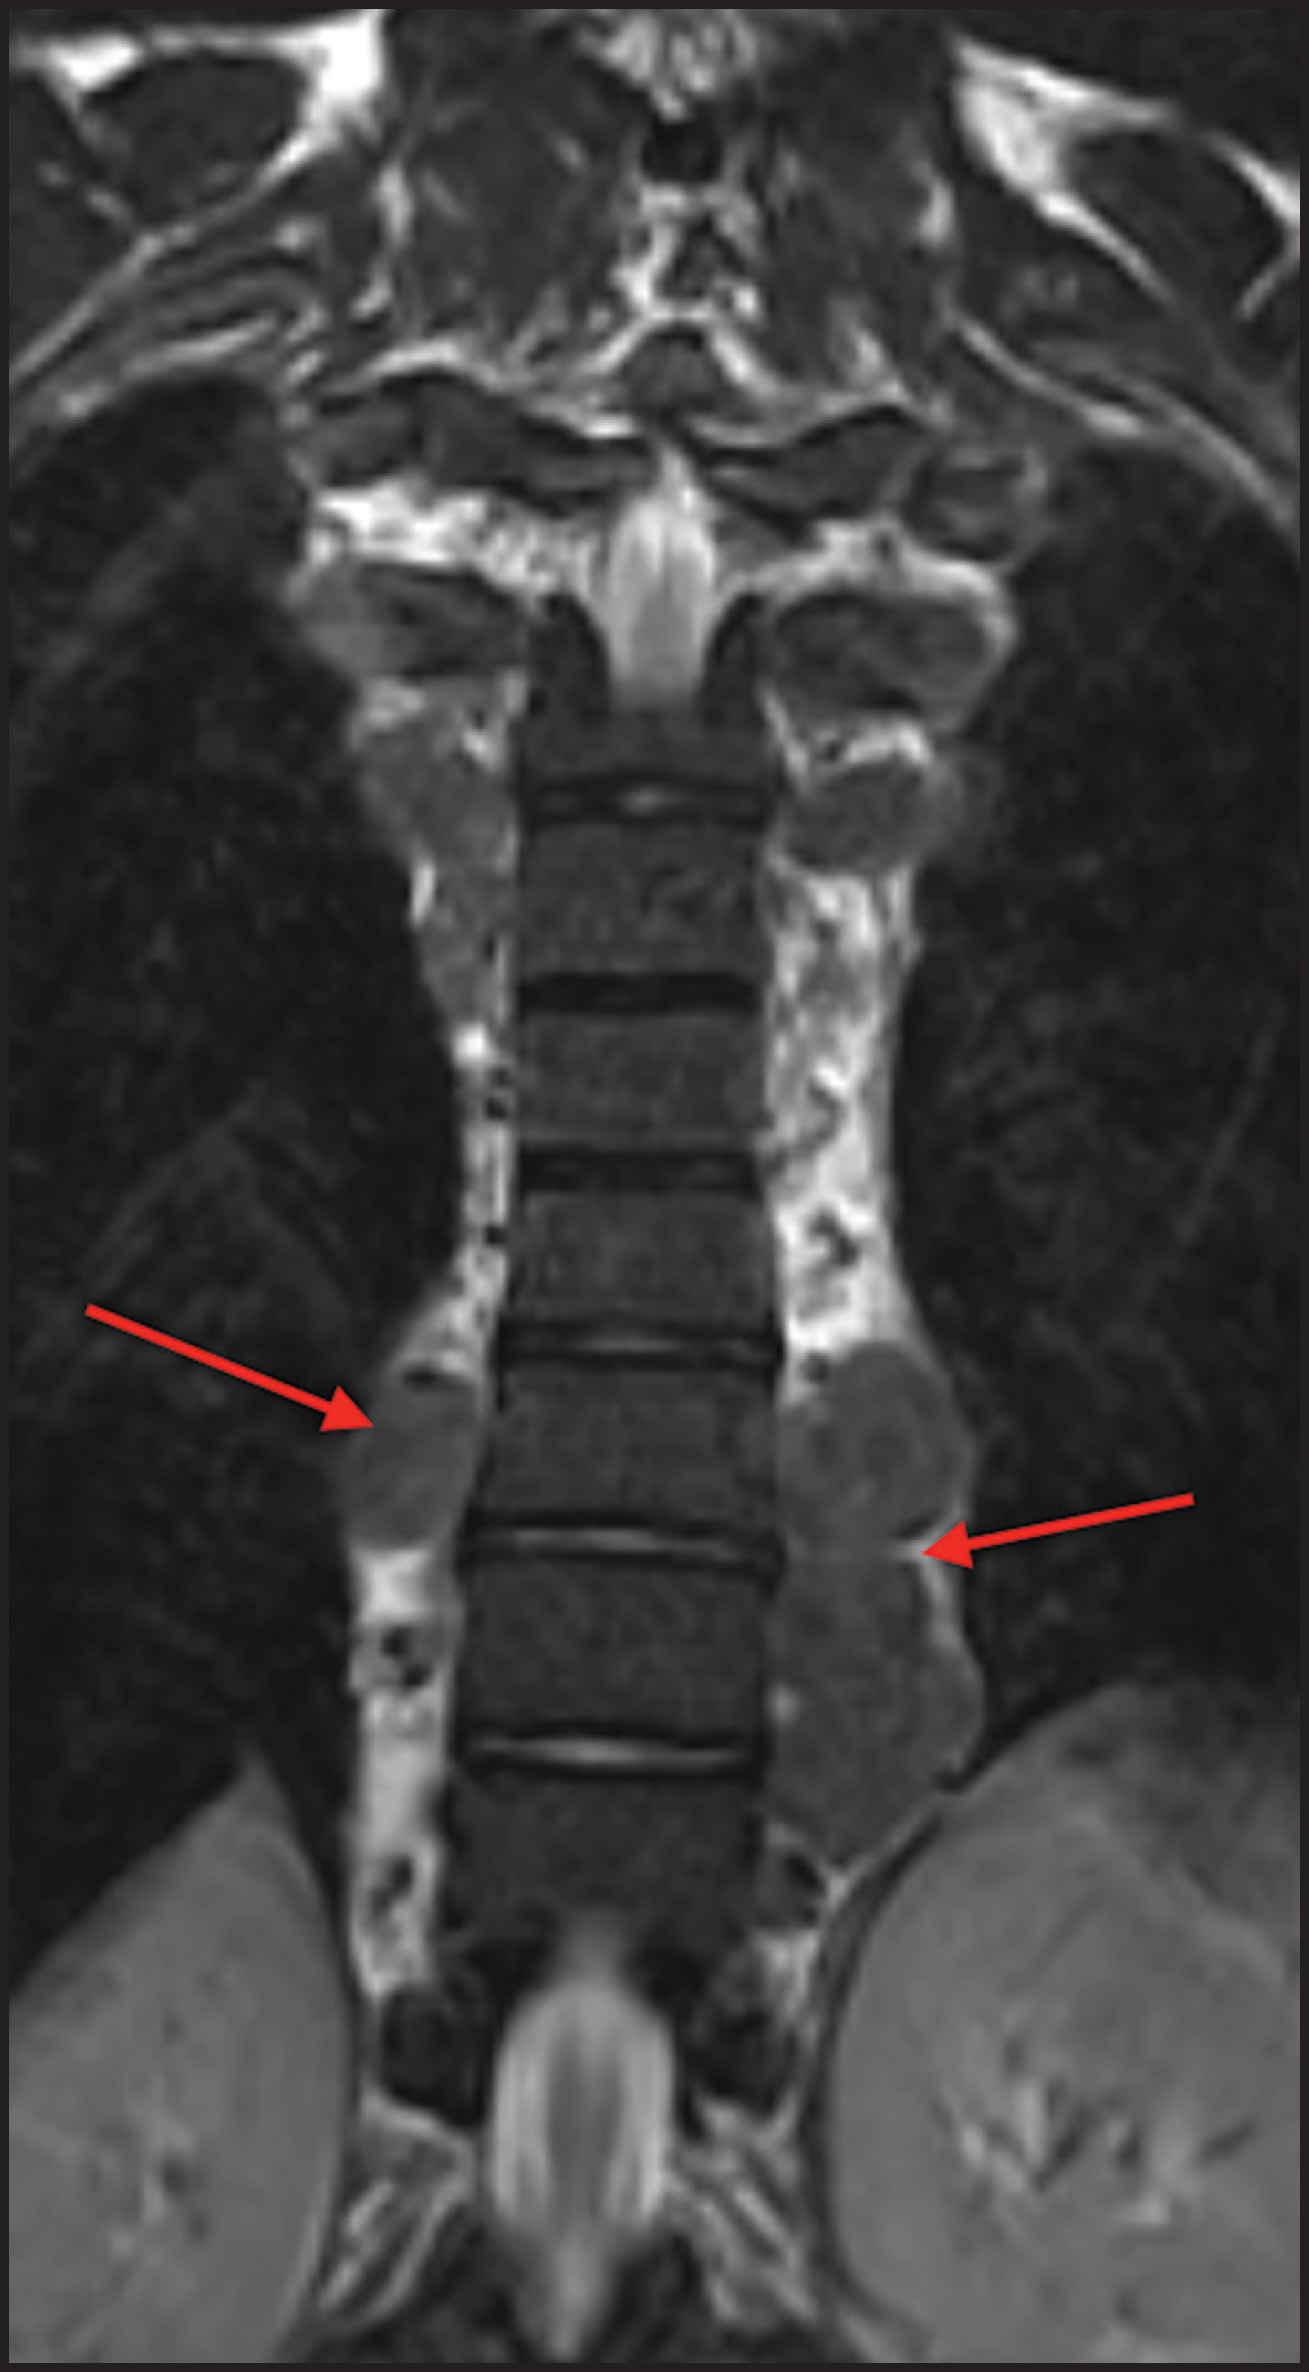
Demand for erythrocyte production due to chronic anemia can result in hematopoietic tissue growth outside of the skeleton, termed extramedullary hematopoiesis. Extramedullary hematopoiesis is actually more common in other hemolytic anemias and sickle cell variants (sickle-β thalassemia, hemoglobin SC disease) than in sickle cell anemia. The extramedullary hematopoietic tissue has signal characteristics similar to that of normal intramedullary hematopoietic marrow.11 Extramedullary hematopoiesis that involves an organ results in enlargement of that organ, most often seen in the spleen and liver. Soft-tissue masses of hematopoietic tissue may develop in the thorax or paraspinal soft tissues (Figure 8). Technetium 99m-labeled sulfur colloid can be used to confirm extramedullary hematopoietic tissue.
“Hair-on-End” Appearance
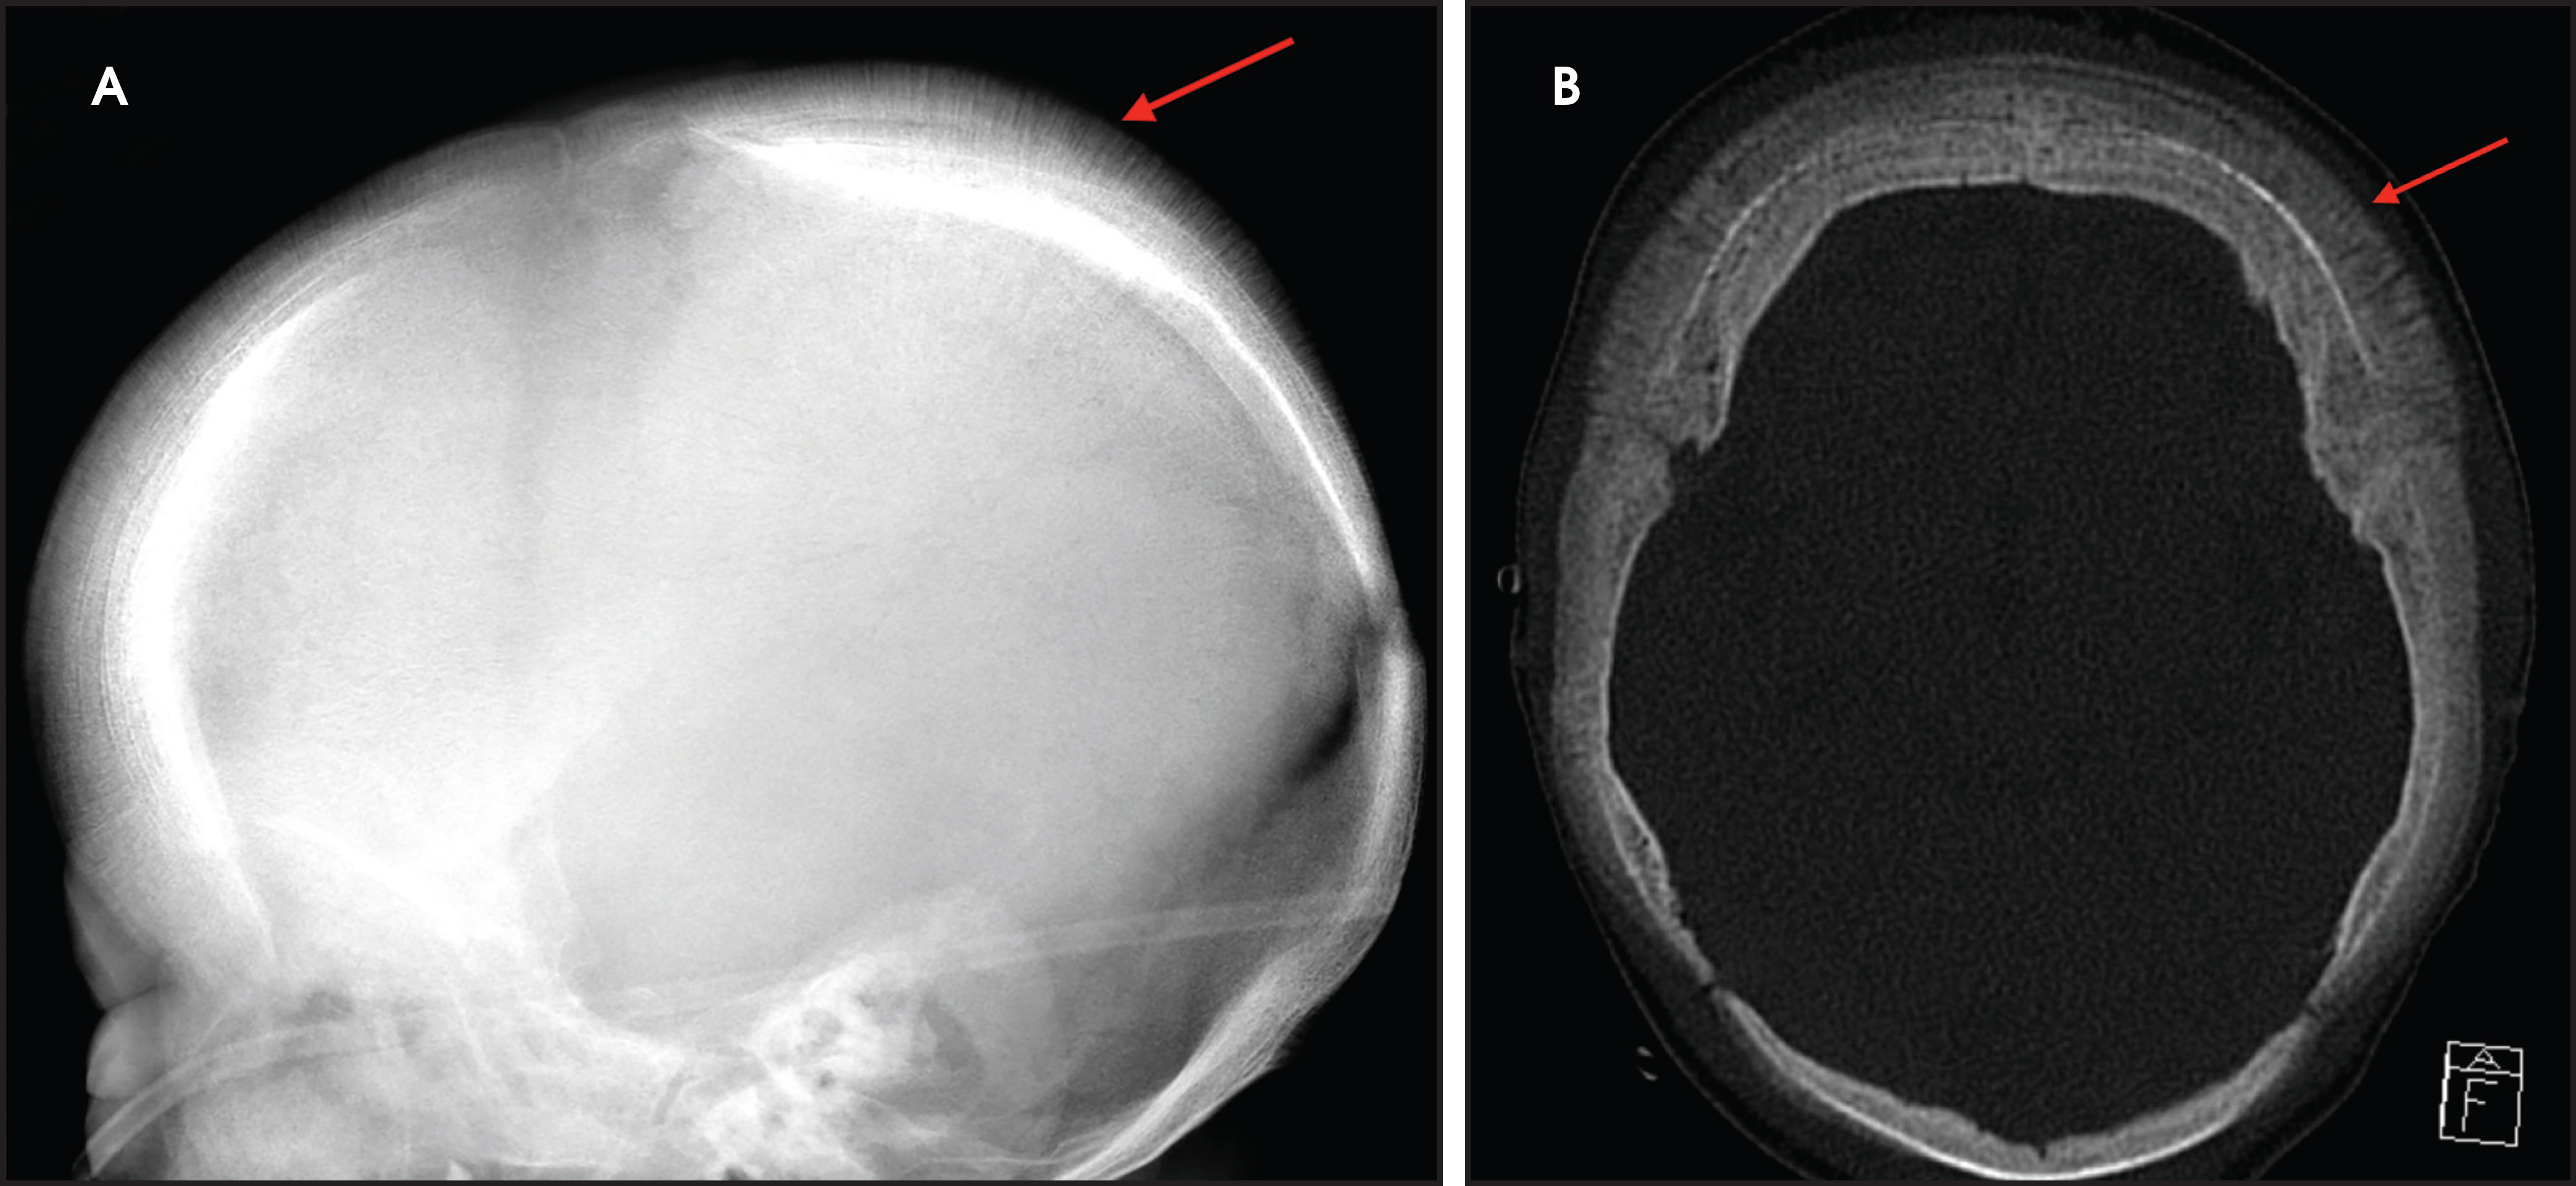
The “hair-on-end” appearance of the skull is secondary to marrow hyperplasia in response to anemia.12 This marrow hyperplasia results in enlargement of the diploic space of the skull.
The perpendicular proliferation of trabeculae look like hair standing on end on radiographs and CT (Figure 9). This appearance is not specific for sickle cell disease, and may be seen in other hemolytic anemias
Iron Overload
Iron overload due to multiple blood transfusions can cause iron deposition within the reticuloendothelial system, primarily the liver, spleen, and bone marrow (Figure 10). MRI findings are diffuse low T1 and T2 signal within the bone marrow owing to the susceptibility effects of iron (Figure 10).13 Iron deposition in bone marrow also results in chronic inflammation, inhibition of osteoblast function, and increased osteoclast activity leading to decreased bone mineralization. Additionally, iron deposition within endocrine organs leads to hypogonadism and hypopituitarism, which also decrease bone mineralization.
Conclusion
Sickle cell disease may result in a variety of imaging findings in the skeletal system. Many of these findings are the result of microvascular occlusion. Others are due to the marrow response to anemia and effects of treatment. Knowledge of these osseous manifestations will aid in the interpretation of radiologic exams in patients with sickle cell anemia and related disorders.
References
- Piel F, Steinberg M, Reed D. Sickle Cell Disease. N Engl J Med. 2017;376((16)):1561-1573.
- Rowe C, Haggard M. Bone infarcts in Sickle-Cell Anemia. Radiology. 1957;68((5)):661-668.
- Rao V, Mitchell D, Rifkin M. Marrow infarction in sickle cell anemia: correlation with marrow type and distribution by MRI. Magn Reson Imaging. 1989;7((1)):39-44.
- Moseley J, Manly J. Aseptic necrosis of bone in Sickle-Cell Disease. Radiology. 1953;60((5)):656-665.
- Ejindu V, Hine A, Mashayekhi M. Musculoskeletal manifestations of Sickle Cell Disease. RadioGraphics. 2007;27((4)):1005-1021.
- Ganguly A, Boswell W, Aniq H. Musculoskeletal manifestations of Sickle Cell Anaemia: A pictorial review. Anemia. 2011:794283.
- Babhulkar S, Pande K, Babhulkar S. The hand-foot syndrome in sickle-cell haemoglobinopathy. J Bone Joint Surg Br. 1995;77((2)):310-312.
- Anand A, Glatt A. Salmonella osteomyelitis and arthritis in sickle cell disease. Semin Arthritis Rheum. 1994;24((3)):211-221.
- Rudy H, Yang D, Nam A, Cho W. Review of Sickle Cell Disease and spinal pathology. Global Spine Journal. 2018.
- Mankad V, Williams J, Harpen M. Magnetic resonance imaging of bone marrow in sickle cell disease: clinical, hematologic, and pathologic correlations. Blood. 1990;75((1)):274-283.
- Gumbs R, Higginbotham-Ford E, Teal J. Thoracic extramedullary hematopoiesis in sickle-cell disease. AJR Am J Roentgenol. 1987;149((5)):889-893.
- Martin L, Rackard F. Hair-on-End Sign. N Engl J Med. 2016;374((19)).
- Levin T, Sheth S, Hurlet A. MR marrow signs of iron overload in transfusion-dependent patients with sickle cell disease. Pediatr Radiol. 1995;25((8)):614-618.
Citation
. Osseous Findings in Sickle Cell Disease. Applied Radiology. 2020;49(2):30-34. doi:10.37549/AR2638.