Ovarian Masses and O-RADS: A Systematic Approach to Evaluating and Characterizing Adnexal Masses with MRI
Applied Radiology — Vol. 50 , Issue 4 , pp. 8 -18
DOI: 10.37549/AR2749
Published: July 1, 2021
1 UC Davis Health, Sacramento, CA
Categories
Part 1 of this article summarized the role of ultrasound as a definitive modality for ovarian mass characterization, even for more aggressive-appearing tumors using the O-RADS classification system. In many circumstances, however, initial imaging results may be inconclusive in certain adnexal masses. In these cases, the O-RADS group recommends further evaluation by an ultrasound specialist, or the use of MRI to classify the mass.1 The majority of cases may be accurately diagnosed by an ultrasound expert. However, pelvic MRI may provide a more definitive diagnosis in difficult cases. This article reviews the modality’s role in the evaluation and diagnosis of these masses.
MRI in Diagnosis of Ovarian Masses
Magnetic resonance imaging is commonly used to evaluate cystic or solid adnexal masses with inconclusive or worrisome ultrasound features. The modality often helps identify the origin of the mass and determine if it is cystic, solid, or complex. It can also be used to identify macroscopic fat within a mass, which is diagnostic of a dermoid. A mass that is completely or partially hyperintense on T1 imaging and loses signal after applying fat saturation contains macroscopic fat. MRI can also identify chronic hemorrhage as T2 “shading” within a mass, which refers to a lesion that is hyperintense on a T1 sequence, but with decreased signal intensity on a T2 sequence. This feature is sensitive, but not specific, for an endometrioma. Dark spots on T2 imaging are highly specific for chronic hemorrhage, thereby differentiating endometriomas from hemorrhagic cysts.2 MRI may show solid ovarian masses with decreased signal intensity on T1 and T2 images, potentially indicating a fibroma, fibrothecoma, or Brenner tumor. Finally, MRI will reveal a combination of findings, including avidly enhancing solid components, suggesting more aggressive ovarian malignancies.
Risk Stratification Using MRI
The American College of Radiology (ACR) has recently developed an MRI risk stratification and management system for ovarian masses,3 featuring certain governing concepts within this O-RAD MRI scoring system. Patients are categorized as either pre- or post-menopausal, with post-menopausal patients defined as those with greater than one year of amenorrhea. In patients with multiple lesions, each lesion should be characterized, and management is based on the lesion with the highest O-RADS MRI score. Like the O-RADS ultrasound system, the O-RADS MRI score ranges between 0 and 5. Within this system, soft tissue is defined as a lesion component that enhances and conforms to one of these morphological descriptors: papillary projection, mural nodule, irregular septation/wall, or other larger solid portions. For instance, a lesion featuring peritoneal, mesenteric, or omental nodularity with or without ascites is classified as O-RADS MRI-5.
T2 signal intensity within solid tissue (eg, low or intermediate compared to the outer myometrium) and diffusion-weighted signal intensity within the solid tissue (eg, high diffusion-weighted signal intensity within the solid tissue as compared to serous tissue, such as urine in the bladder) is also analyzed. For instance, an MRI score of 2 is given for a purely cystic mass, a purely fatty mass, or a purely endometriotic mass. Furthermore, an MRI score of 2 is given for solid tissue that has homogeneous T2 signal hypointensity as well as homogeneous hypointense high b-value of DWI solid tissue, also known as a dark-dark pattern.
Dynamic contrast enhancement (DCE) with perfusion-timed intensity curves are preferred over non-dynamic postcontrast imaging for risk assessment. Dynamic contrast enhancement timing should be 15 seconds or lower. Time intensity curves are graphed from low risk to high risk; the lesions are then scored 0-5, in a fashion like those classified under the O-RADS ultrasound system. However, if DCE time intensity curves are not available, then lesions may be classified based on their enhancement at 30-40 seconds. O-RADS MRI 4 lesions have less enhancement than the myometrium at 30-40 seconds, while O-RADS MRI 5 lesions have enhancement greater than the myometrium at 30-40 seconds (excluding T2 dark/DWI dark solid tissue). A more complete review of all the parameters used in the O-RADS MRI system is beyond the scope of this review but is better detailed in reference 3 (Table 1, 2).
| ABBREVIATED SCHEMATIC FOR INITIAL ASSESSMENT FOR O-RADS MRI SCORES 1 (NO ADNEXAL LESION), 2 (ALMOST CERTAINLY BENIGN ADNEXAL LESION) AND 5 (HIGH RISK FOR MALIGNANT ADNEXAL LESION) | |
| O-RADS MRI 1 | No tubo-ovarian lesion. |
| Physiologic follicle, corpus luteum, or hemorrhagic cyst < 3cm in pre-menopausal woman. | |
| O-RADS MRI 2 | Unilocular cyst with no enhancing wall and no solid tissue. |
| Characteristic simple hydrosalpinx, peritoneal inclusion cyst, endometrioma, or mature teratoma with no solid tissue. | |
| Solid tissue with very low homogeneous signal on T2 and DWI. | |
| O-RADS MRI 5 | Adnexal lesion with solid tissue with a high-risk time intensity curve on DCE MRI. |
| Adnexal lesion with solid tissue enhancing > myometrium at 30-40 seconds on the non-DCE MRI. | |
| Definite peritoneal or omental thickening or nodules. | |
| LEXICON DESCRIPTION | |||
| 0 | Incomplete Evaluation | N/A | N/A |
| 1 | Normal Ovaries | N/A | No ovarian lesion |
| Follicle defined as simple cyst < 3 cm in a premenopausal woman | |||
| Hemorrhagic cyst < 3 cm in a premenopausal woman | |||
| Corpus luteum +/- hemorrhage < 3 cm in a premenopausal woman | |||
| 2 | Almost Certainly Benign | < 0.5%^ | Cyst: Unilocular- any type of fluid content
|
Cyst: Unilocular - simple or endometriotic fluid content
| |||
Lesion with lipid content**
| |||
Lesion with "dark T2/dark DWI" solid tissue
| |||
Dilated fallopian tube - simple fluid content
| |||
Para-ovarian cyst - any type of fluid
| |||
| 3 | Low Risk | ~ 5%^ | Cyst: Unilocular - proteinaceous, hemorrhagic or mucinous fluid content***
|
Cyst: Multilocular - Any type of fluid, no lipid content
| |||
Lesion with solid tissue (excluding T2 dark/DWI dark)
| |||
Dilated fallopian tube
| |||
| 4 | Intermediate Risk | ~ 50%^ | Lesion with solid tissue (excluding T2 dark/DWI dark)
|
Lesion with lipid content
| |||
| 5 | High Risk | ~90%^ | Lesion with solid tissue (excluding T2 dark/DWI dark)
|
| Peritoneal, mesenteric or omental nodularity or irregular thickening with or without ascites | |||
A Simplified Approach to Ovarian Mass Evaluation
Some characteristic masses can be confidently diagnosed with MRI regardless of their O-RADS MRI score. A simple way to evaluate ovarian masses with MRI is to use four key sequences: T1 imaging, T1 imaging with fat saturation, T2 imaging, and contrast-enhanced imaging. Differentiating and diagnosing ovarian or adnexal masses requires only a few steps. The first consists of evaluating the signal characteristics of masses on T1 imaging. Masses may demonstrate either increased or decreased signal and may be categorized accordingly.
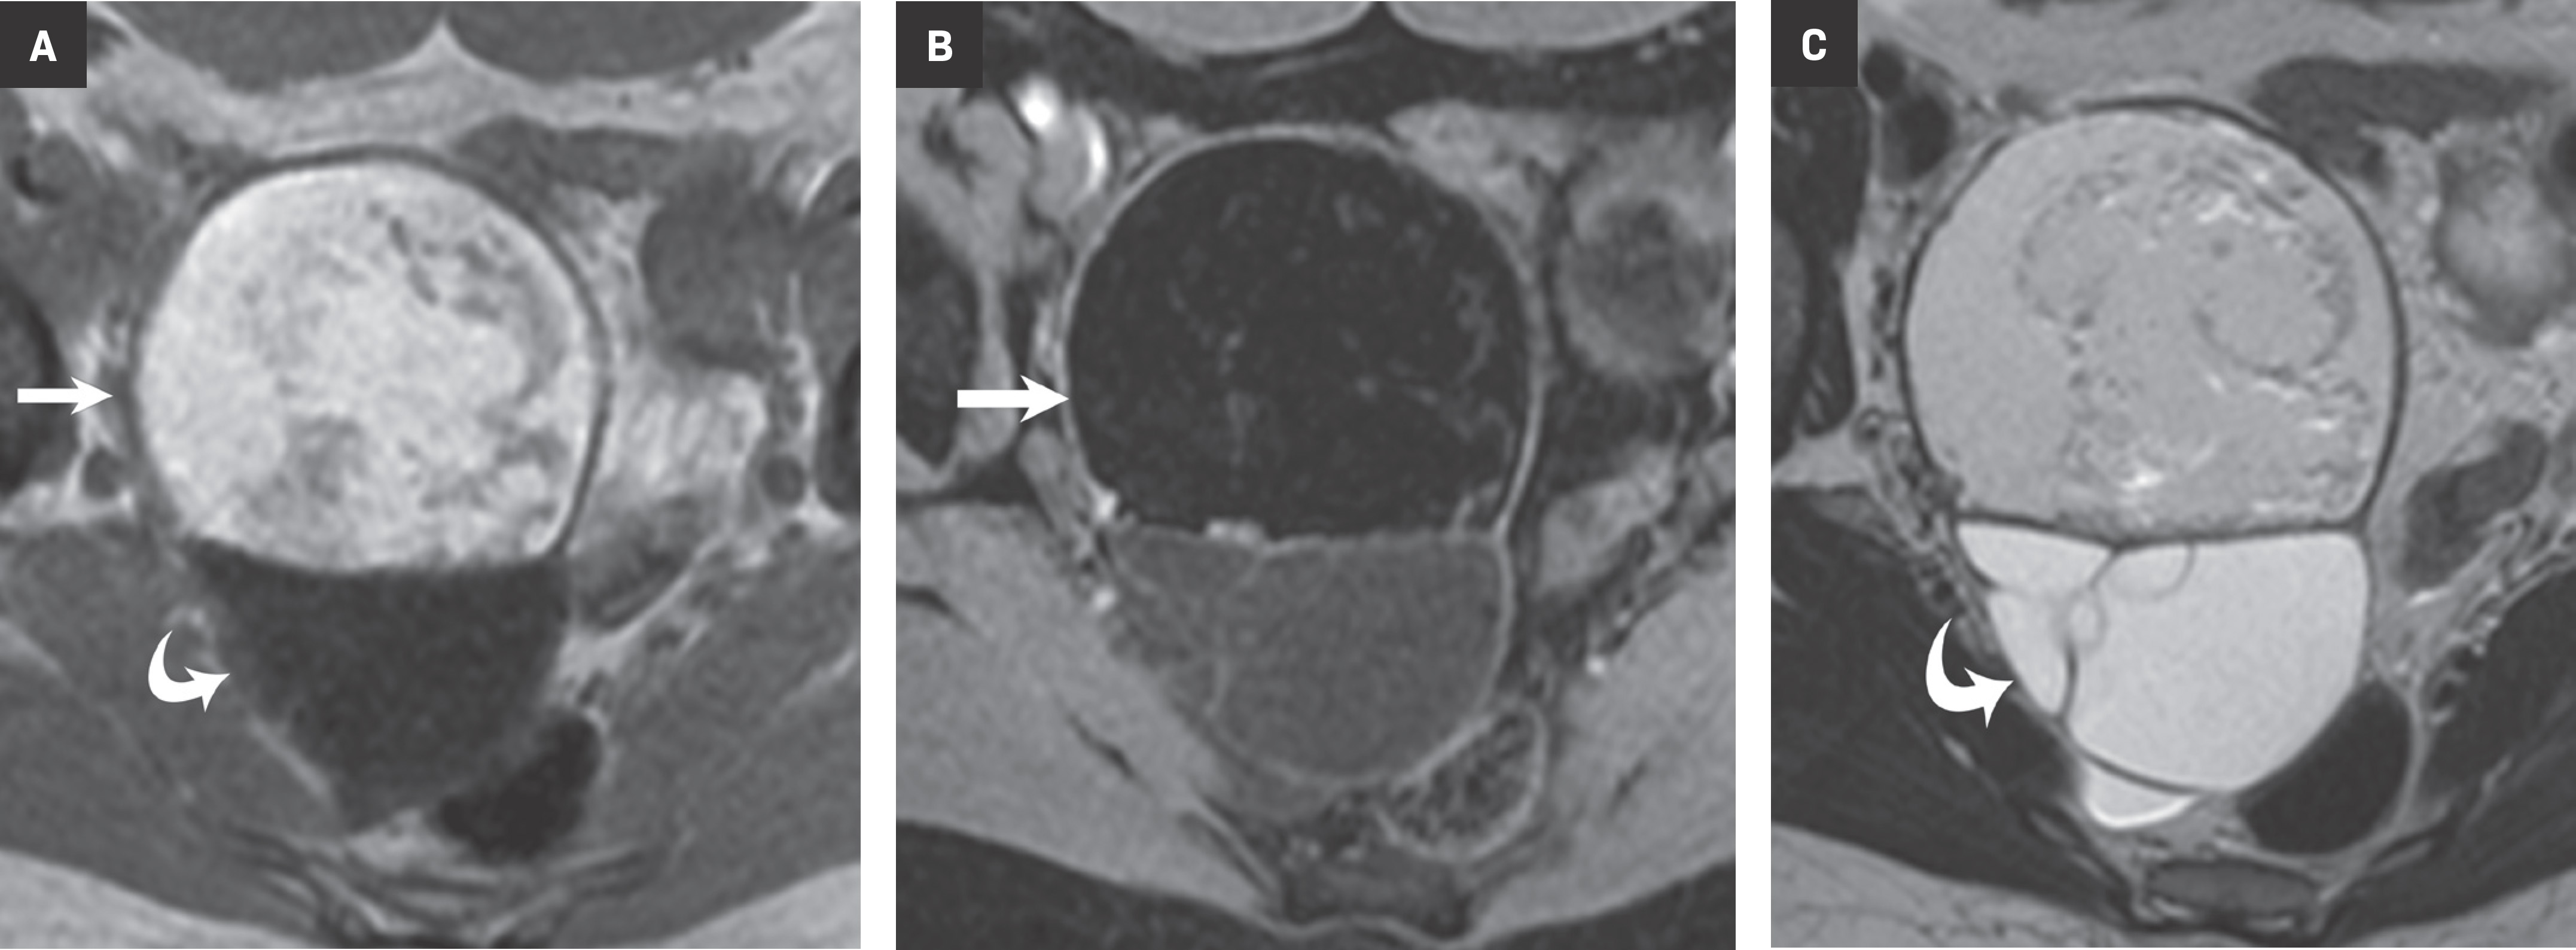
MRI can easily distinguish teratomas from most other adnexal masses by demonstrating macroscopic fat within the ovarian mass (Table 3). Masses that are hyperintense on T1 imaging may reflect fat, hemorrhage, or other proteinaceous materials. Signal loss after applying fat saturation, however, indicates macroscopic fat and is characteristic of a teratoma (Figure 1). Most teratomas are mature, at which point they are known as dermoids. Within the O-RADS MRI grading system, mature teratomas (dermoids) are characteristic cystic lesions containing macroscopic fat and scored as O-RADS MRI 2, owing to their low risk of malignancy. Characteristic benign mature teratomas may contain septations or mild enhancement of the Rokitansky nodules, but these findings do not upgrade these lesions. However, fatty adnexal lesions that contain much enhancing soft tissue are classified as O-RADS MRI 4 owing to the risk of immature teratomas. Immature teratomas are rare, constituting only 1% of all teratomas. Growing rapidly, they are seen in younger patients and often malignant. Dysgerminoma is another unusual germ cell tumor and usually appears as a multilobulated solid mass, often with a low-attenuation center on CT (Table 4).
| ORIGIN | ||||
| Surface epithelium | Germ cells | Parenchyma (sex cord- stroma) | Metastases | |
| Frequency | 65 - 70% | 15 - 20% | 5 - 10% | 5% |
| % malignant | 90% | 3 - 5 % | 2 - 3% | 5% |
| Age | 20+ | 0-25+ | All | Variable |
| Types |
|
|
| |
| Adapted from: Robbins and Cotran; Pathologic Basis of Disease, 7th Ed. Copyright © 2005 Elsevier Junqueira and Carneiro; Basic His-tology, 11th Ed Copyright © 2005 McGraw-Hill | ||||
A lesion with increased T1 signal that does not drop out with fat saturation sequences should undergo T2 imaging to see if it contains shading (Table 3). The majority of endometriomas have T2 shading, while only about 40% of hemorrhagic cysts have T2 shading. Unfortunately, malignant tumors with chronic hemorrhage may have T2 shading. T2 dark spots are seen only in endometriomas and malignant tumors.
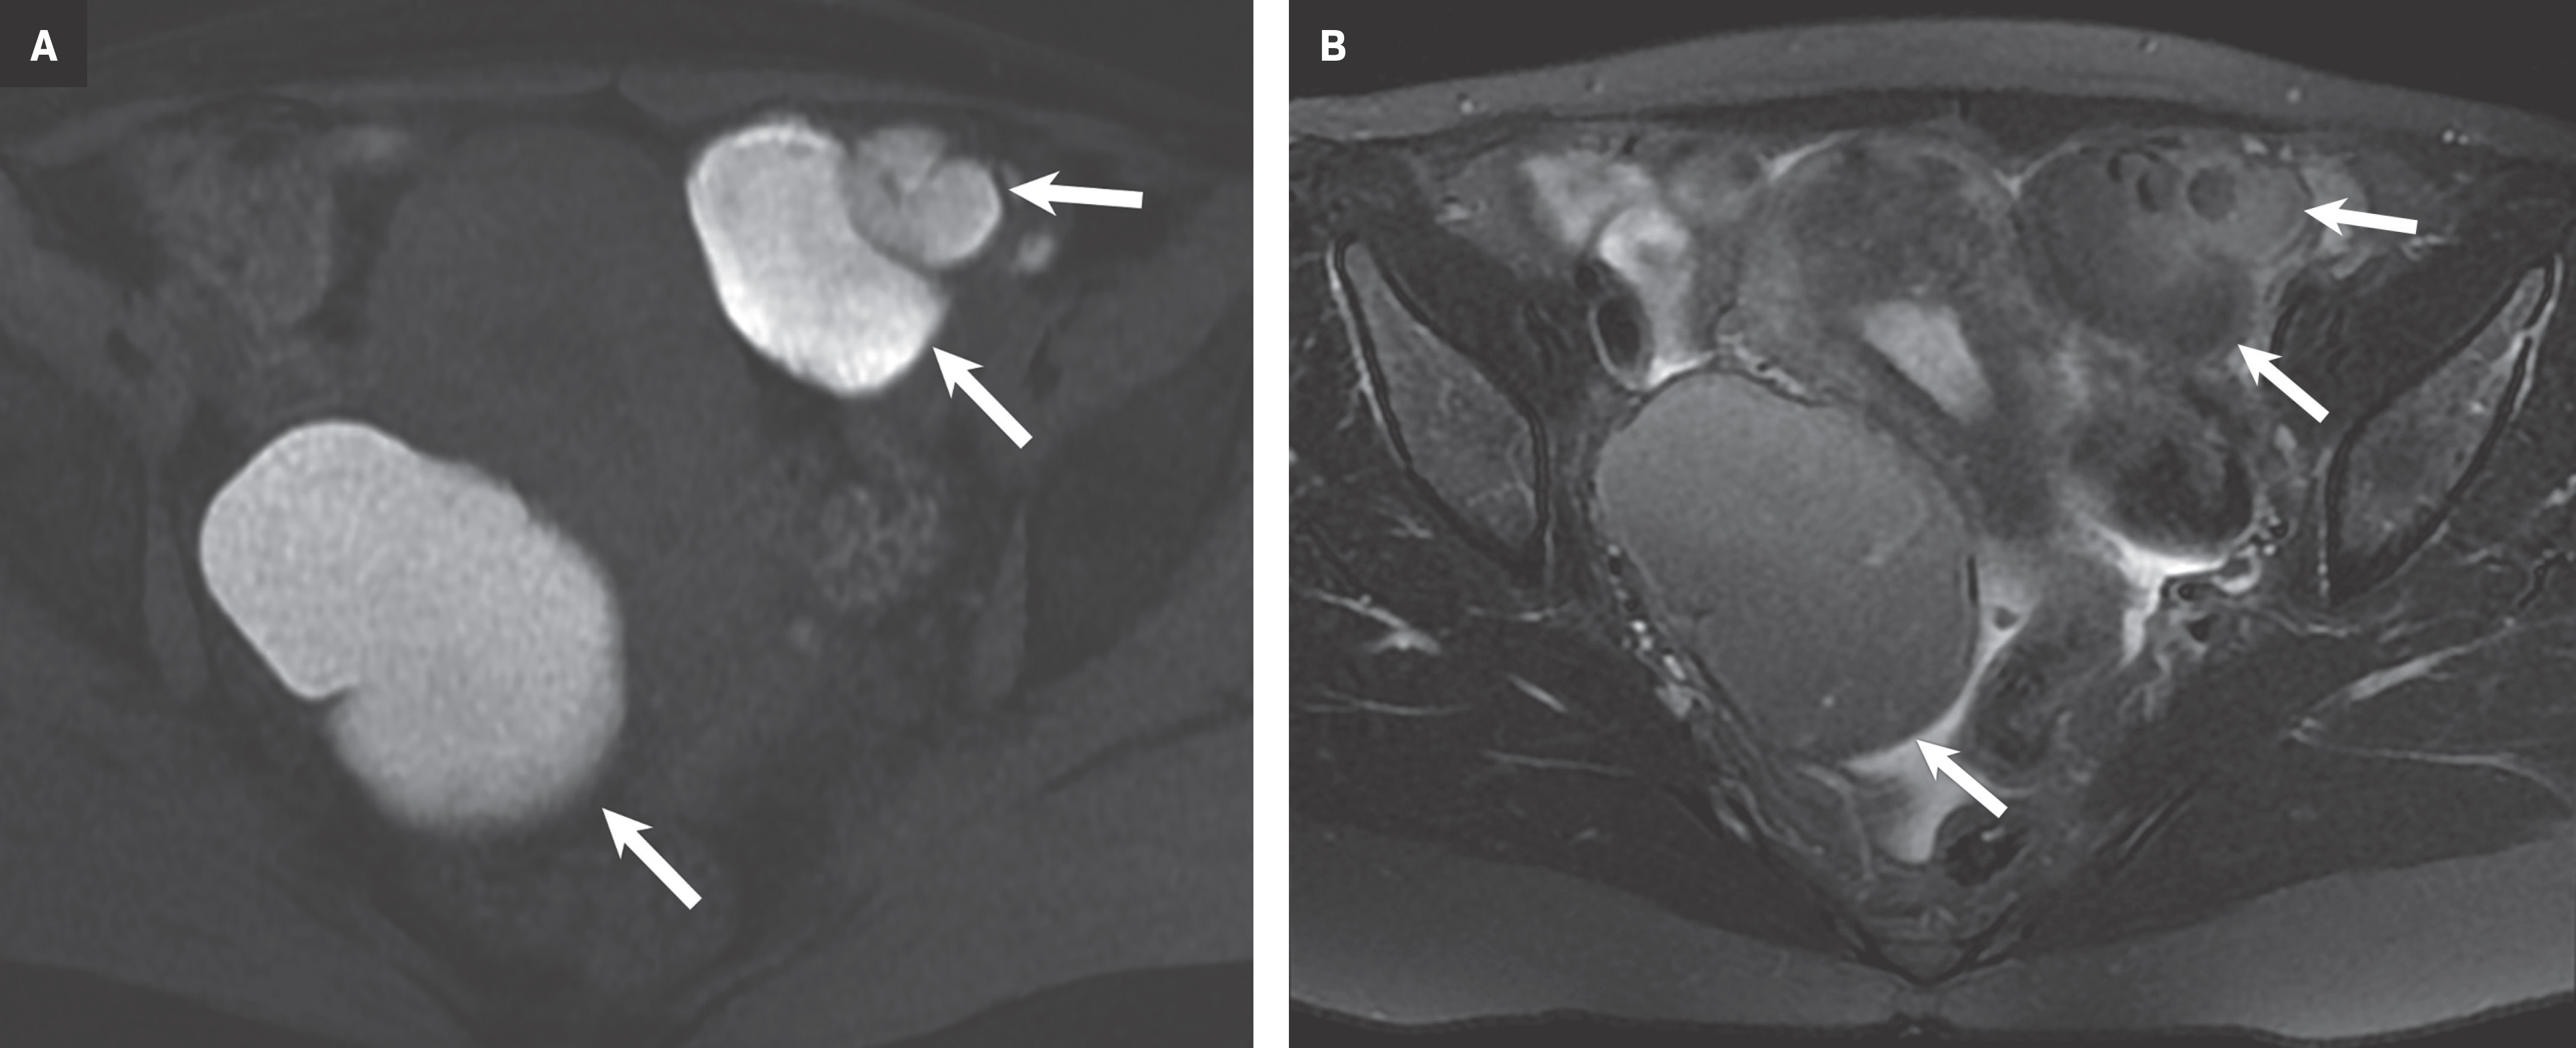
The final step is to perform contrast-enhanced MR imaging to identify any nodularity or areas of abnormal enhancement. On MRI, endometriomas most commonly demonstrate increased signal intensity on T1 images and no loss of signal on fat saturation images. T2 images demonstrate the “shading” decrease in signal intensity (Figure 2). This is a classic appearance of endometriomas, but it can also be seen in hemorrhagic cysts or hemorrhage occurring within certain neoplasms, such as clear cell carcinomas. Administration of a gadolinium-based contrast agent may help to ensure there are no regions of contrast enhancement along the wall of the presumed endometrioma, which may be indicative of a necrotic ovarian tumor, such as a clear cell carcinoma.
Masses with Decreased Signal Intensity on T1 Imaging
When the T1 signal of a mass is decreased, the next step is to perform T2 imaging, followed by gadolinium contrast-enhanced imaging, independent of the T2 signal finding (Table 3). If the mass is of decreased signal intensity on T1, with no significant increase signal on T2 imaging and with fairly homogeneous enhancement after administration of gadolinium, an ovarian stromal (sex cord) tumor should be considered.
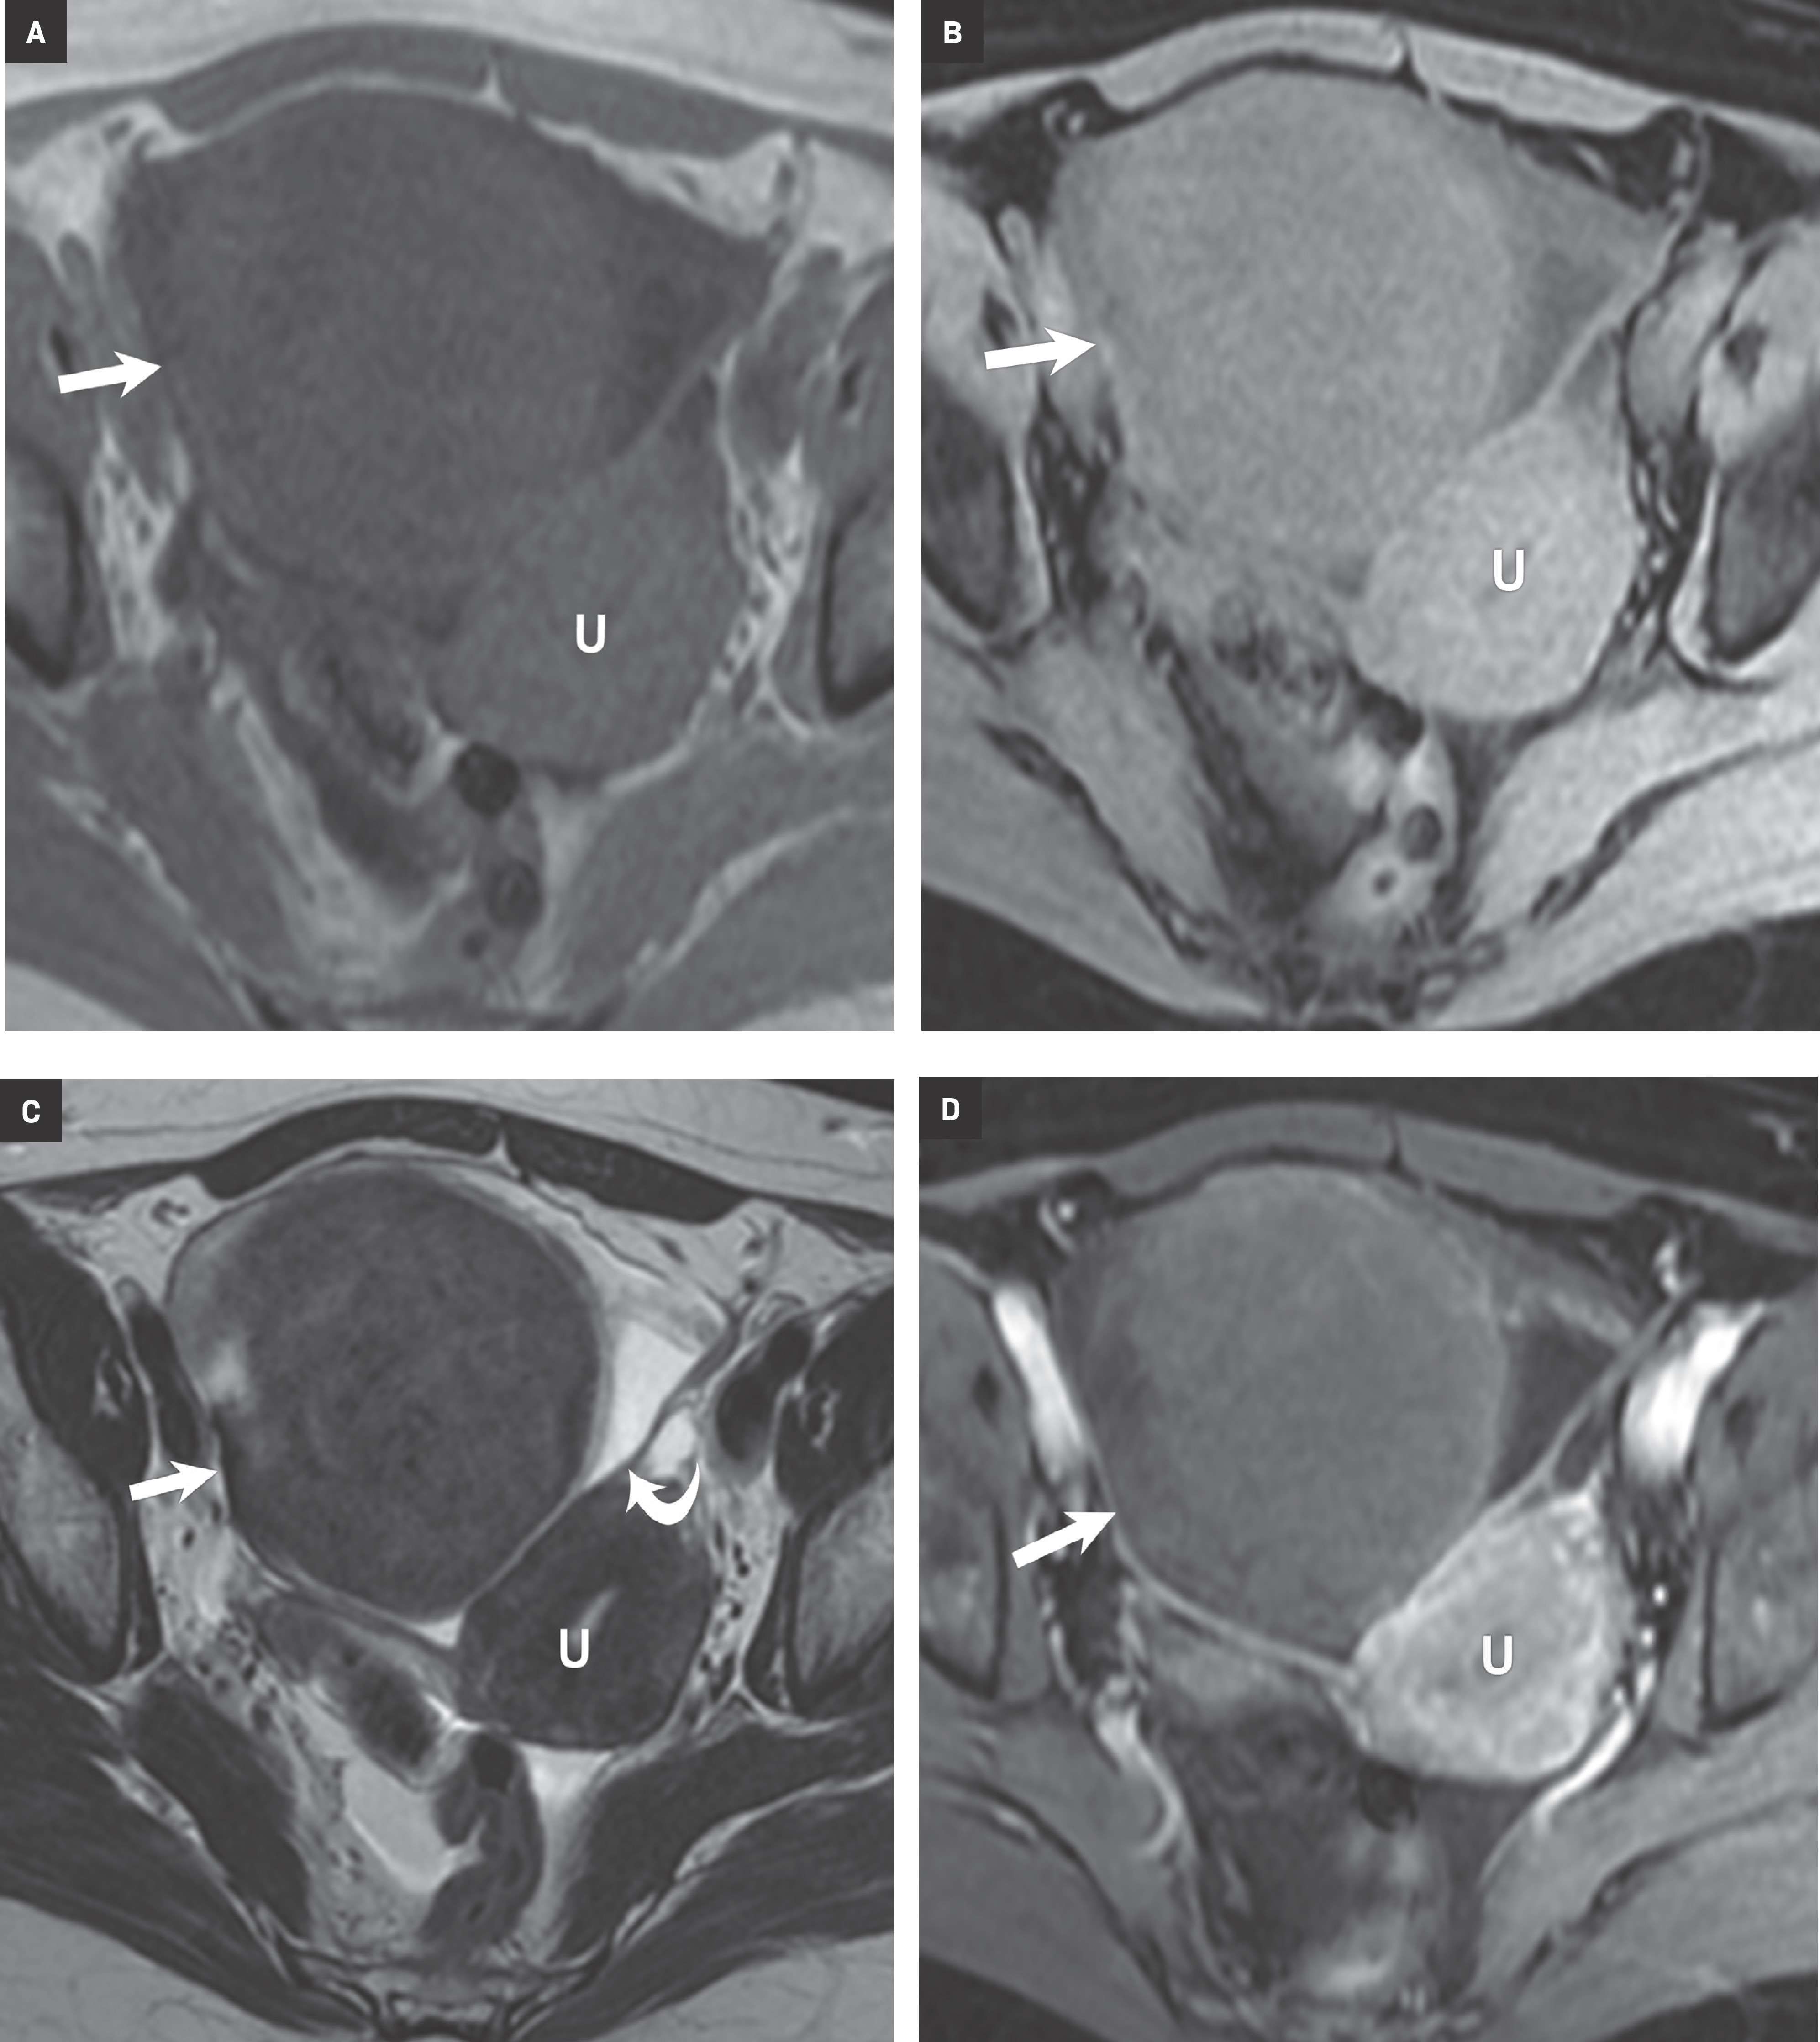
Ovarian stromal tumors are an interesting group of tumors that appear as solid ovarian masses (Table 4) but are rarely malignant. This group is composed of a variety of tumors including fibroma, fibrothecoma, cystadenofibroma, Sertoli-, and Leydig-cell tumors. More common sex-cord stromal tumors include components of fibrous tissue, which are fibromas and/or lipid-rich tissues, including thecomas. Many of these tumors, such as fibrothecomas, have combined elements. These tumors may, rarely, result in Meig syndrome (fibroma with ascites and pleural effusions). Ultrasound can determine the solid nature of these neoplasms. MRI will demonstrate a solid tumor with decreased signal intensity on T1 and T2 images (Figure 3).3 Thus, the differential diagnosis includes fibroma, fibrothecoma, or cystadenofibroma (Table 3).
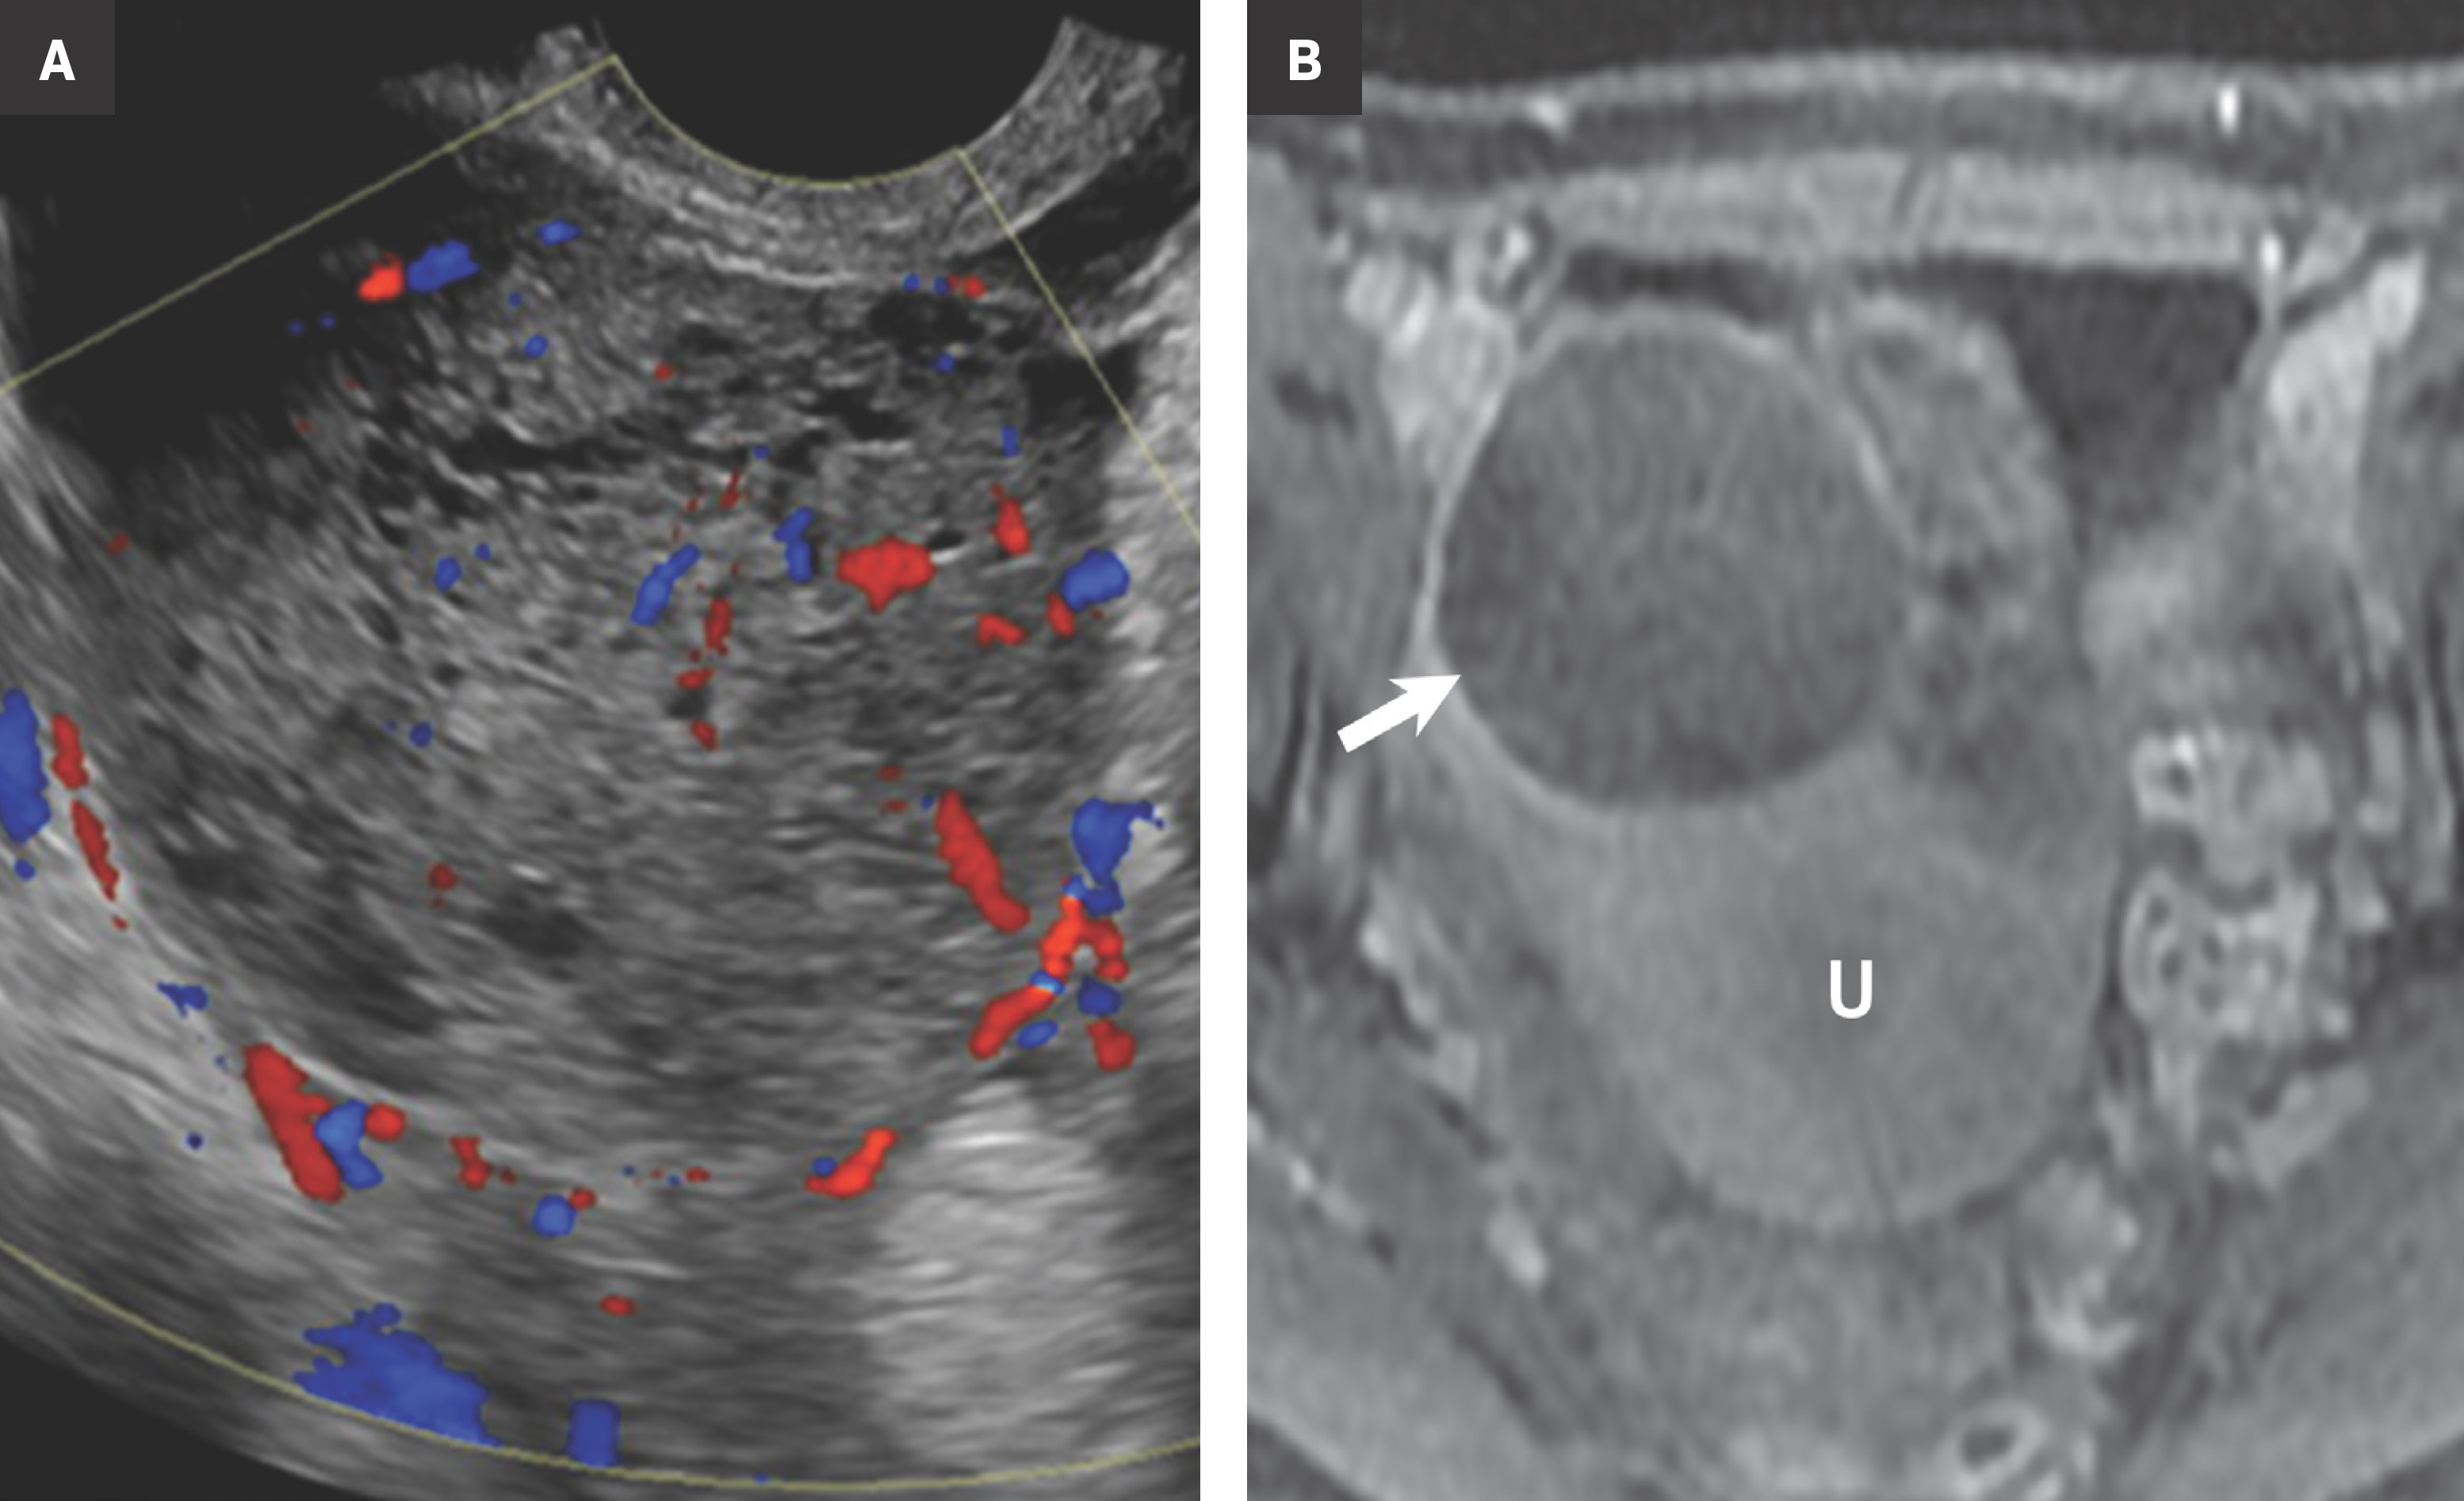
Potential pitfalls include a Brenner tumor, which is usually solid or mostly solid. Ovarian metastases, including Krukenberg tumor, may be mistaken for a solid sex-cord stromal tumor and can appear as solid or complex ovarian masses (Figure 4). However, most solid ovarian masses will be surgically removed, except for pedunculated leiomyomata (fibroids) that mimic ovarian masses (Figure 5). Distinguishing a benign, solid ovarian mass from a solid metastasis may be difficult. In rare situations, biopsy may be performed. Usually the solid component of the mass is biopsied, with good diagnostic yield in select cases.4
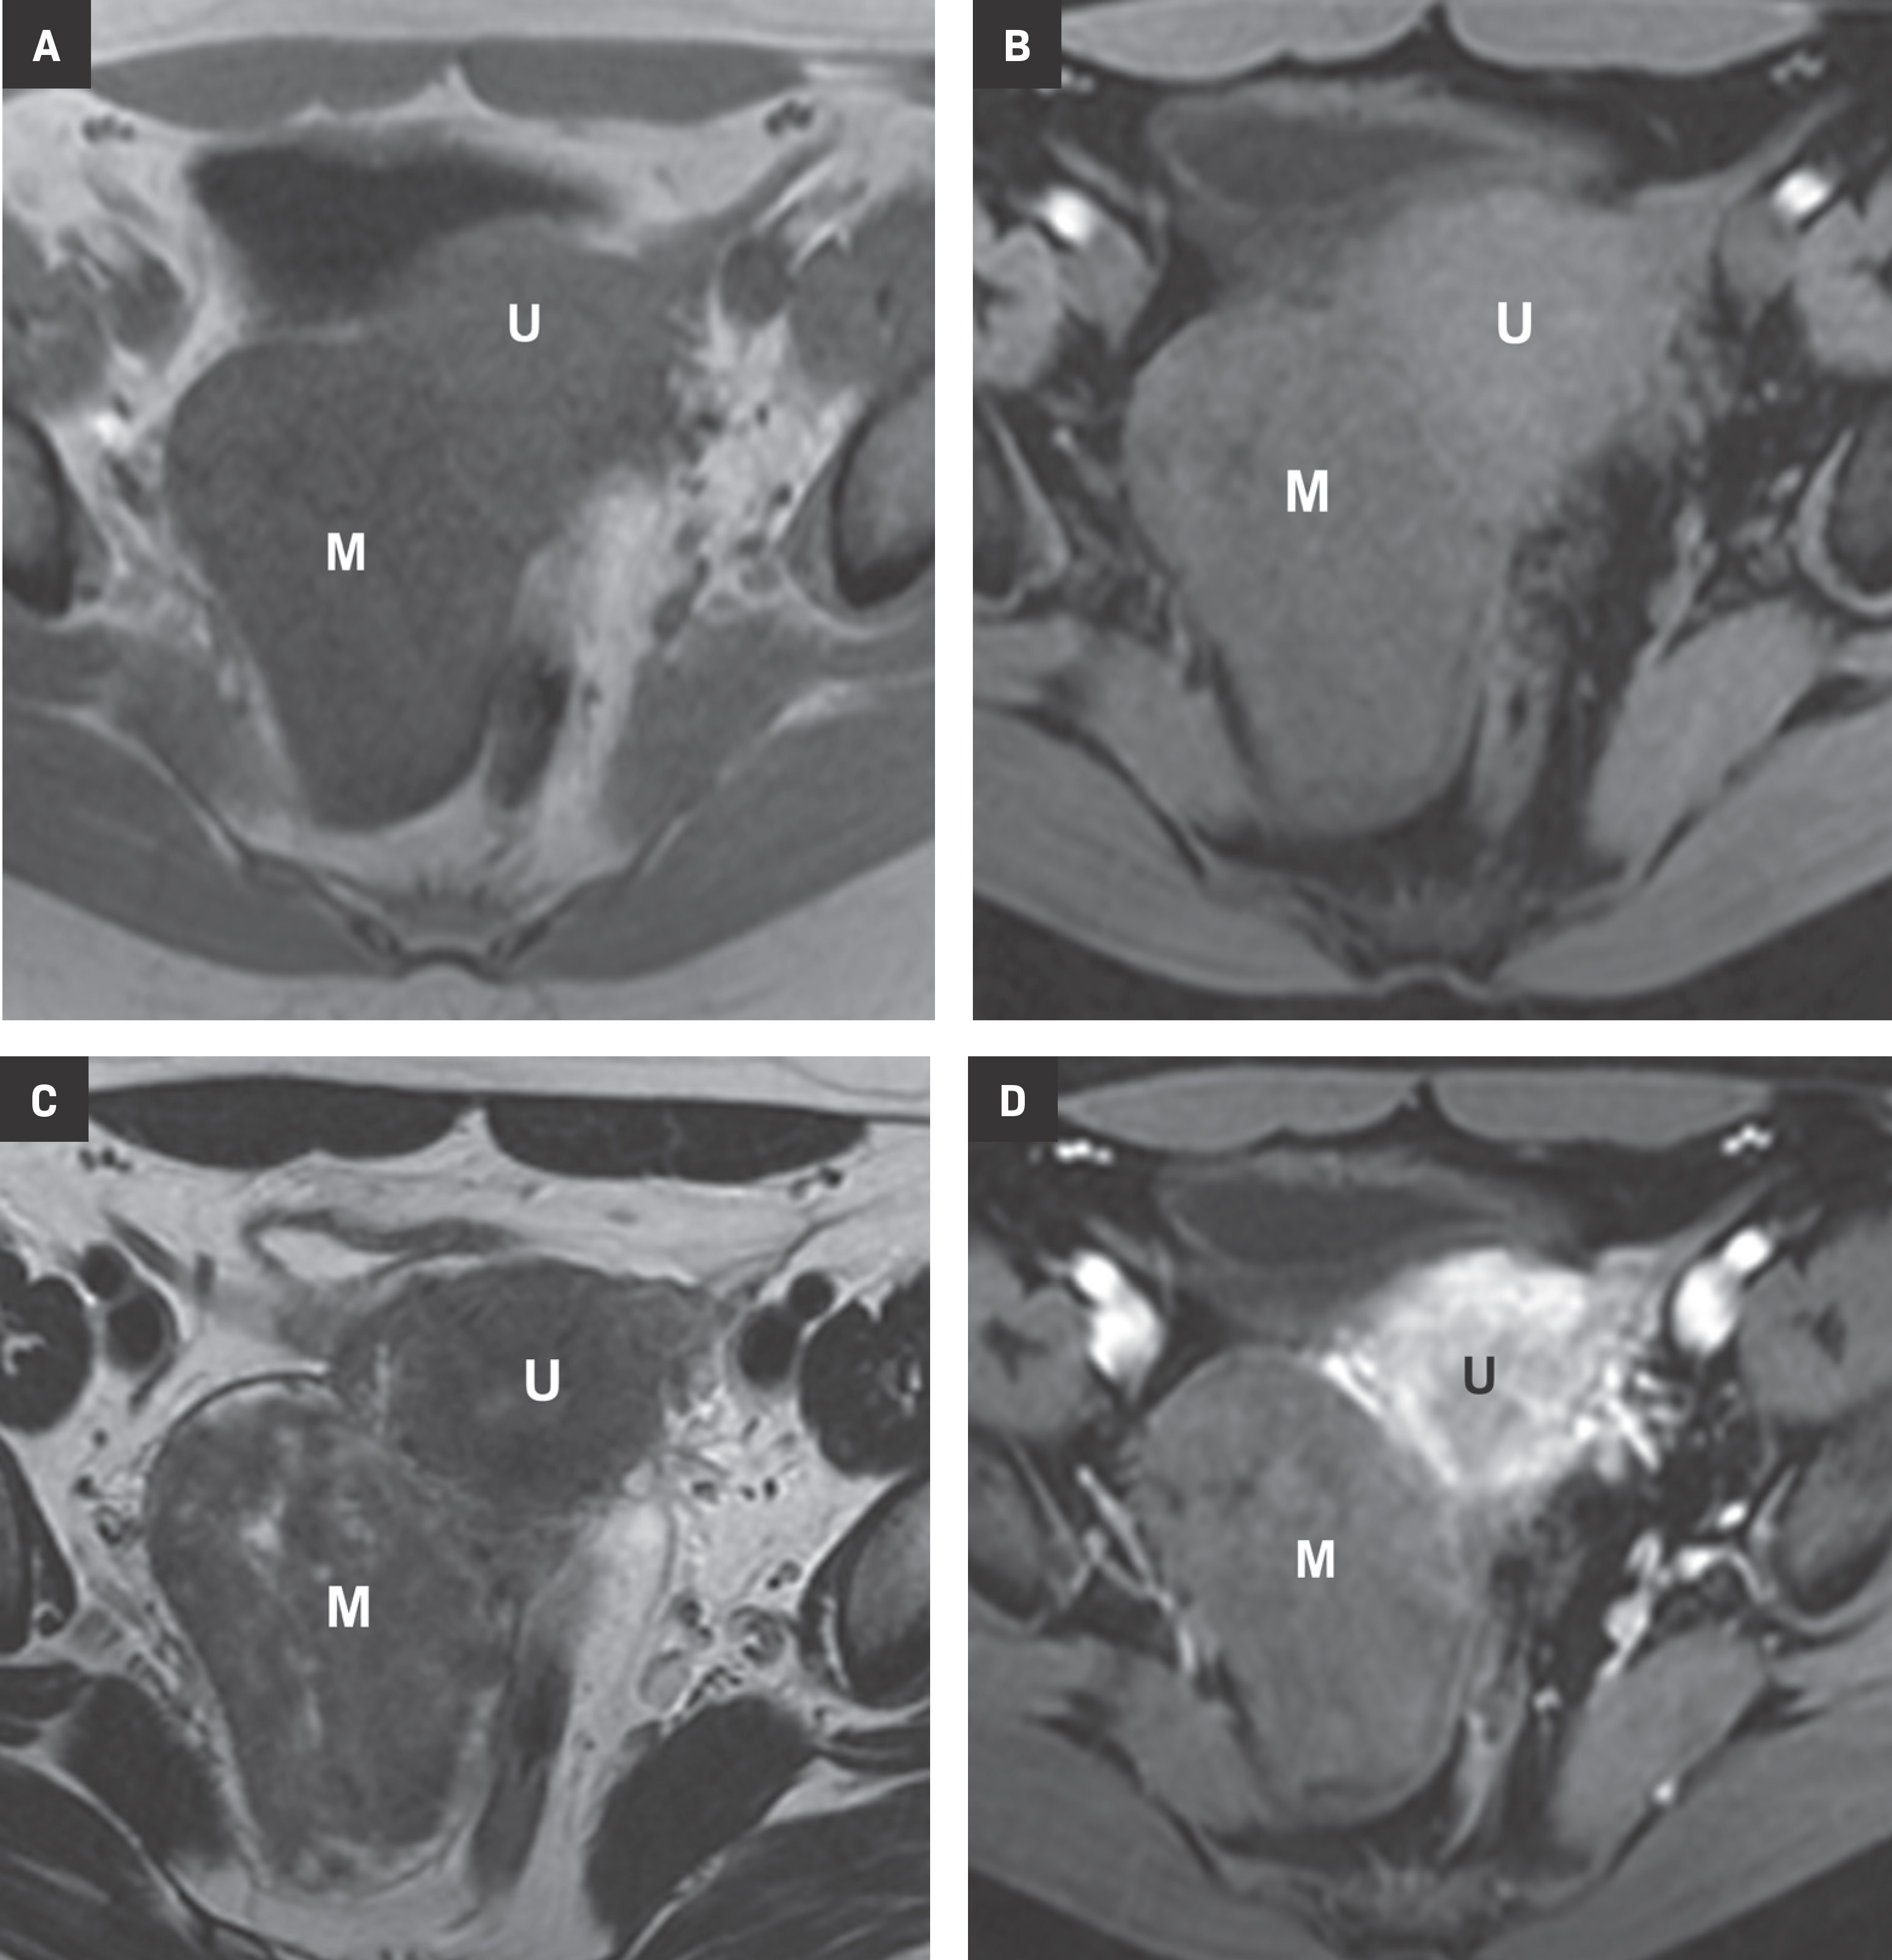
Masses with decreased signal intensity on T1 but increased signal intensity on T2 have a cystic component. If these cysts are simple, they should have been characterized by ultrasound and no further evaluation is needed.1, 5 Similarly, as previously described, O-RADS 2 lesions such as hemorrhagic cysts, dermoid cysts, endometriomas, hydrosalpinx, and peritoneal inclusion cysts have a fairly classic appearance and no further imaging is needed.1 If there is doubt, O-RADS recommends consultation with an ultrasound expert or the use of MRI, since the range of cystic ovarian neoplasms is broad.
For instance, both benign and malignant ovarian masses may have a cystic component on ultrasound or MRI. After identifying such a cystic component, the next step is to administer gadolinium for evaluation of any solid components or papillary projections. O-RADS MRI prefers DCE with perfusion time intensity curves over non-dynamic DCE postcontrast imaging for risk assessment. The guidelines recommend time resolution less than 15 seconds. As mentioned previously, if DCE is not available, contrast enhancement of the mass is compared to being less than (O-RADS MRI 4) or greater than (O-RADS MRI 5) the contrast enhancement of the myometrium at 30 to 40 seconds (Table 1,2). Gadolinium-enhanced imaging may show these solid components, surface nodularity, and/or thick septa, which are worrisome for a malignant ovarian neoplasm.3
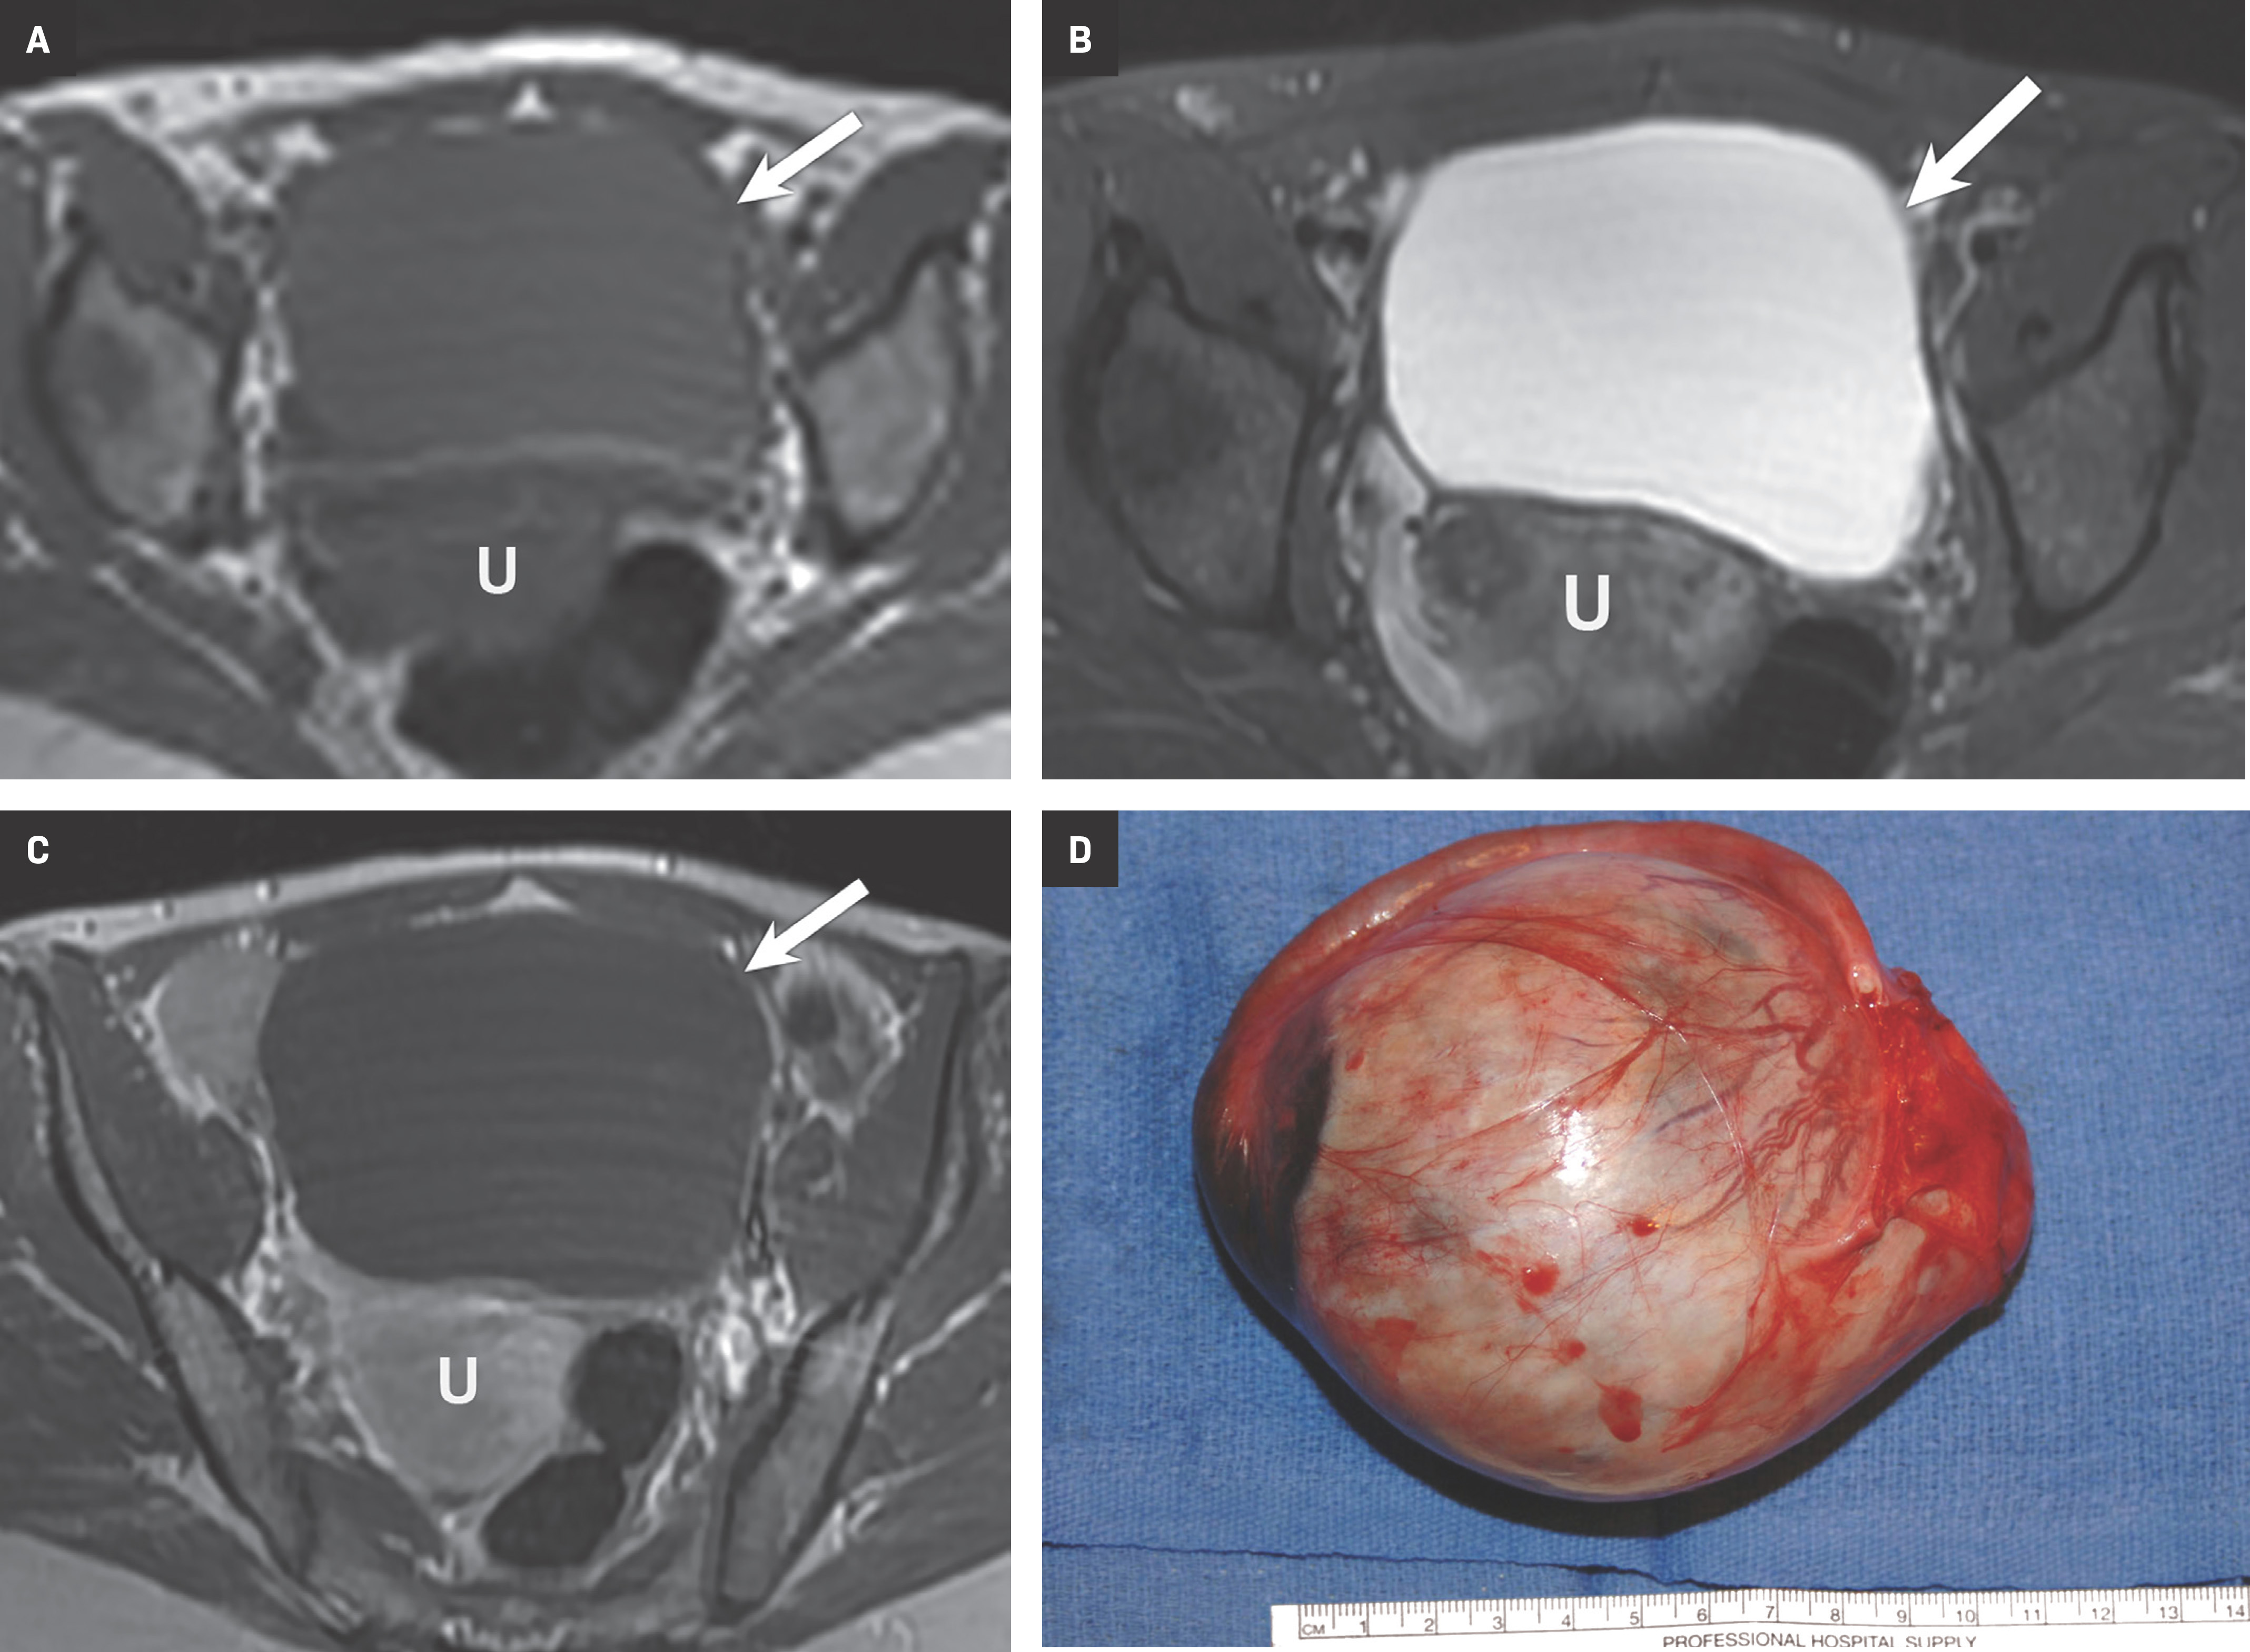
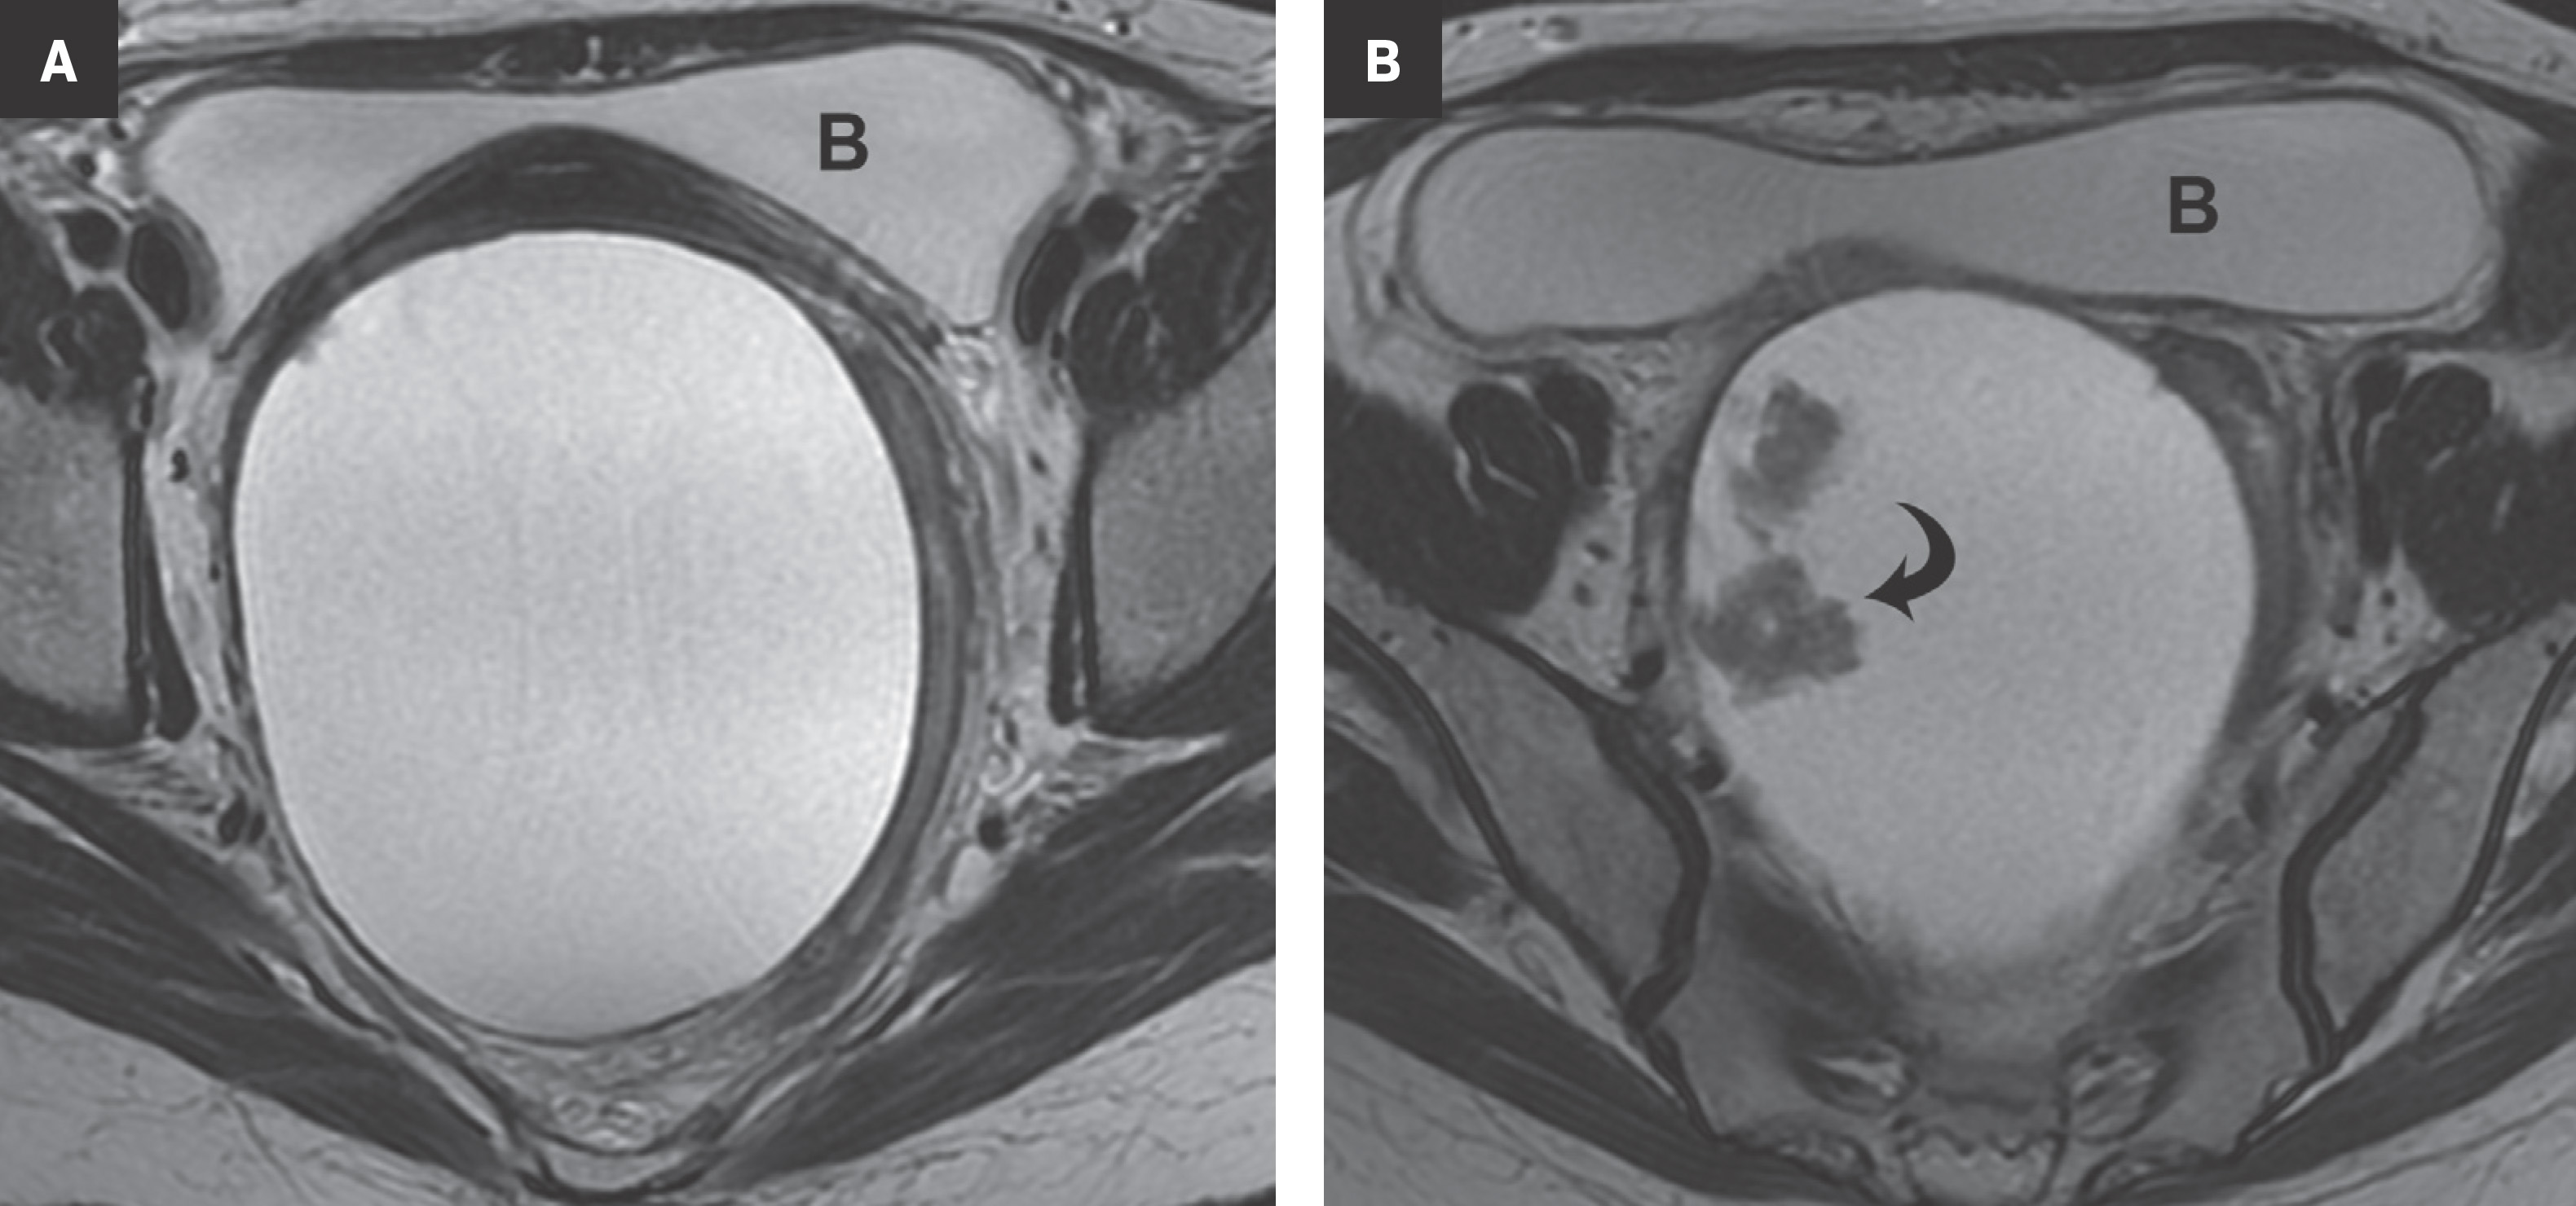
The most concerning tumors are surface epithelial neoplasms (Table 3, 4). These include serous or mucinous cystadenomas and serous or mucinous cystadenocarcinomas. Serous neoplasms have a higher frequency of malignancy than mucinous ovarian neoplasms. Some of these tumors are simple in appearance with no worrisome features, such as a serous cystadenoma (Figure 6). Clear cell carcinoma is another type of surface epithelial neoplasm that is predominantly cystic, with few solid components. Clear cell carcinoma accounts for 5% of all ovarian cancers. They are predominantly cystic, but they do have solid components along the wall of the tumor. Although the cystic component is the dominant feature, the peripheral nodularity must not be overlooked (Figure 7) as it may be indicative of a malignant neoplasm, and thus alter management. However, this nodularity in clear cell carcinoma may be subtle and located only at the periphery of the mass.
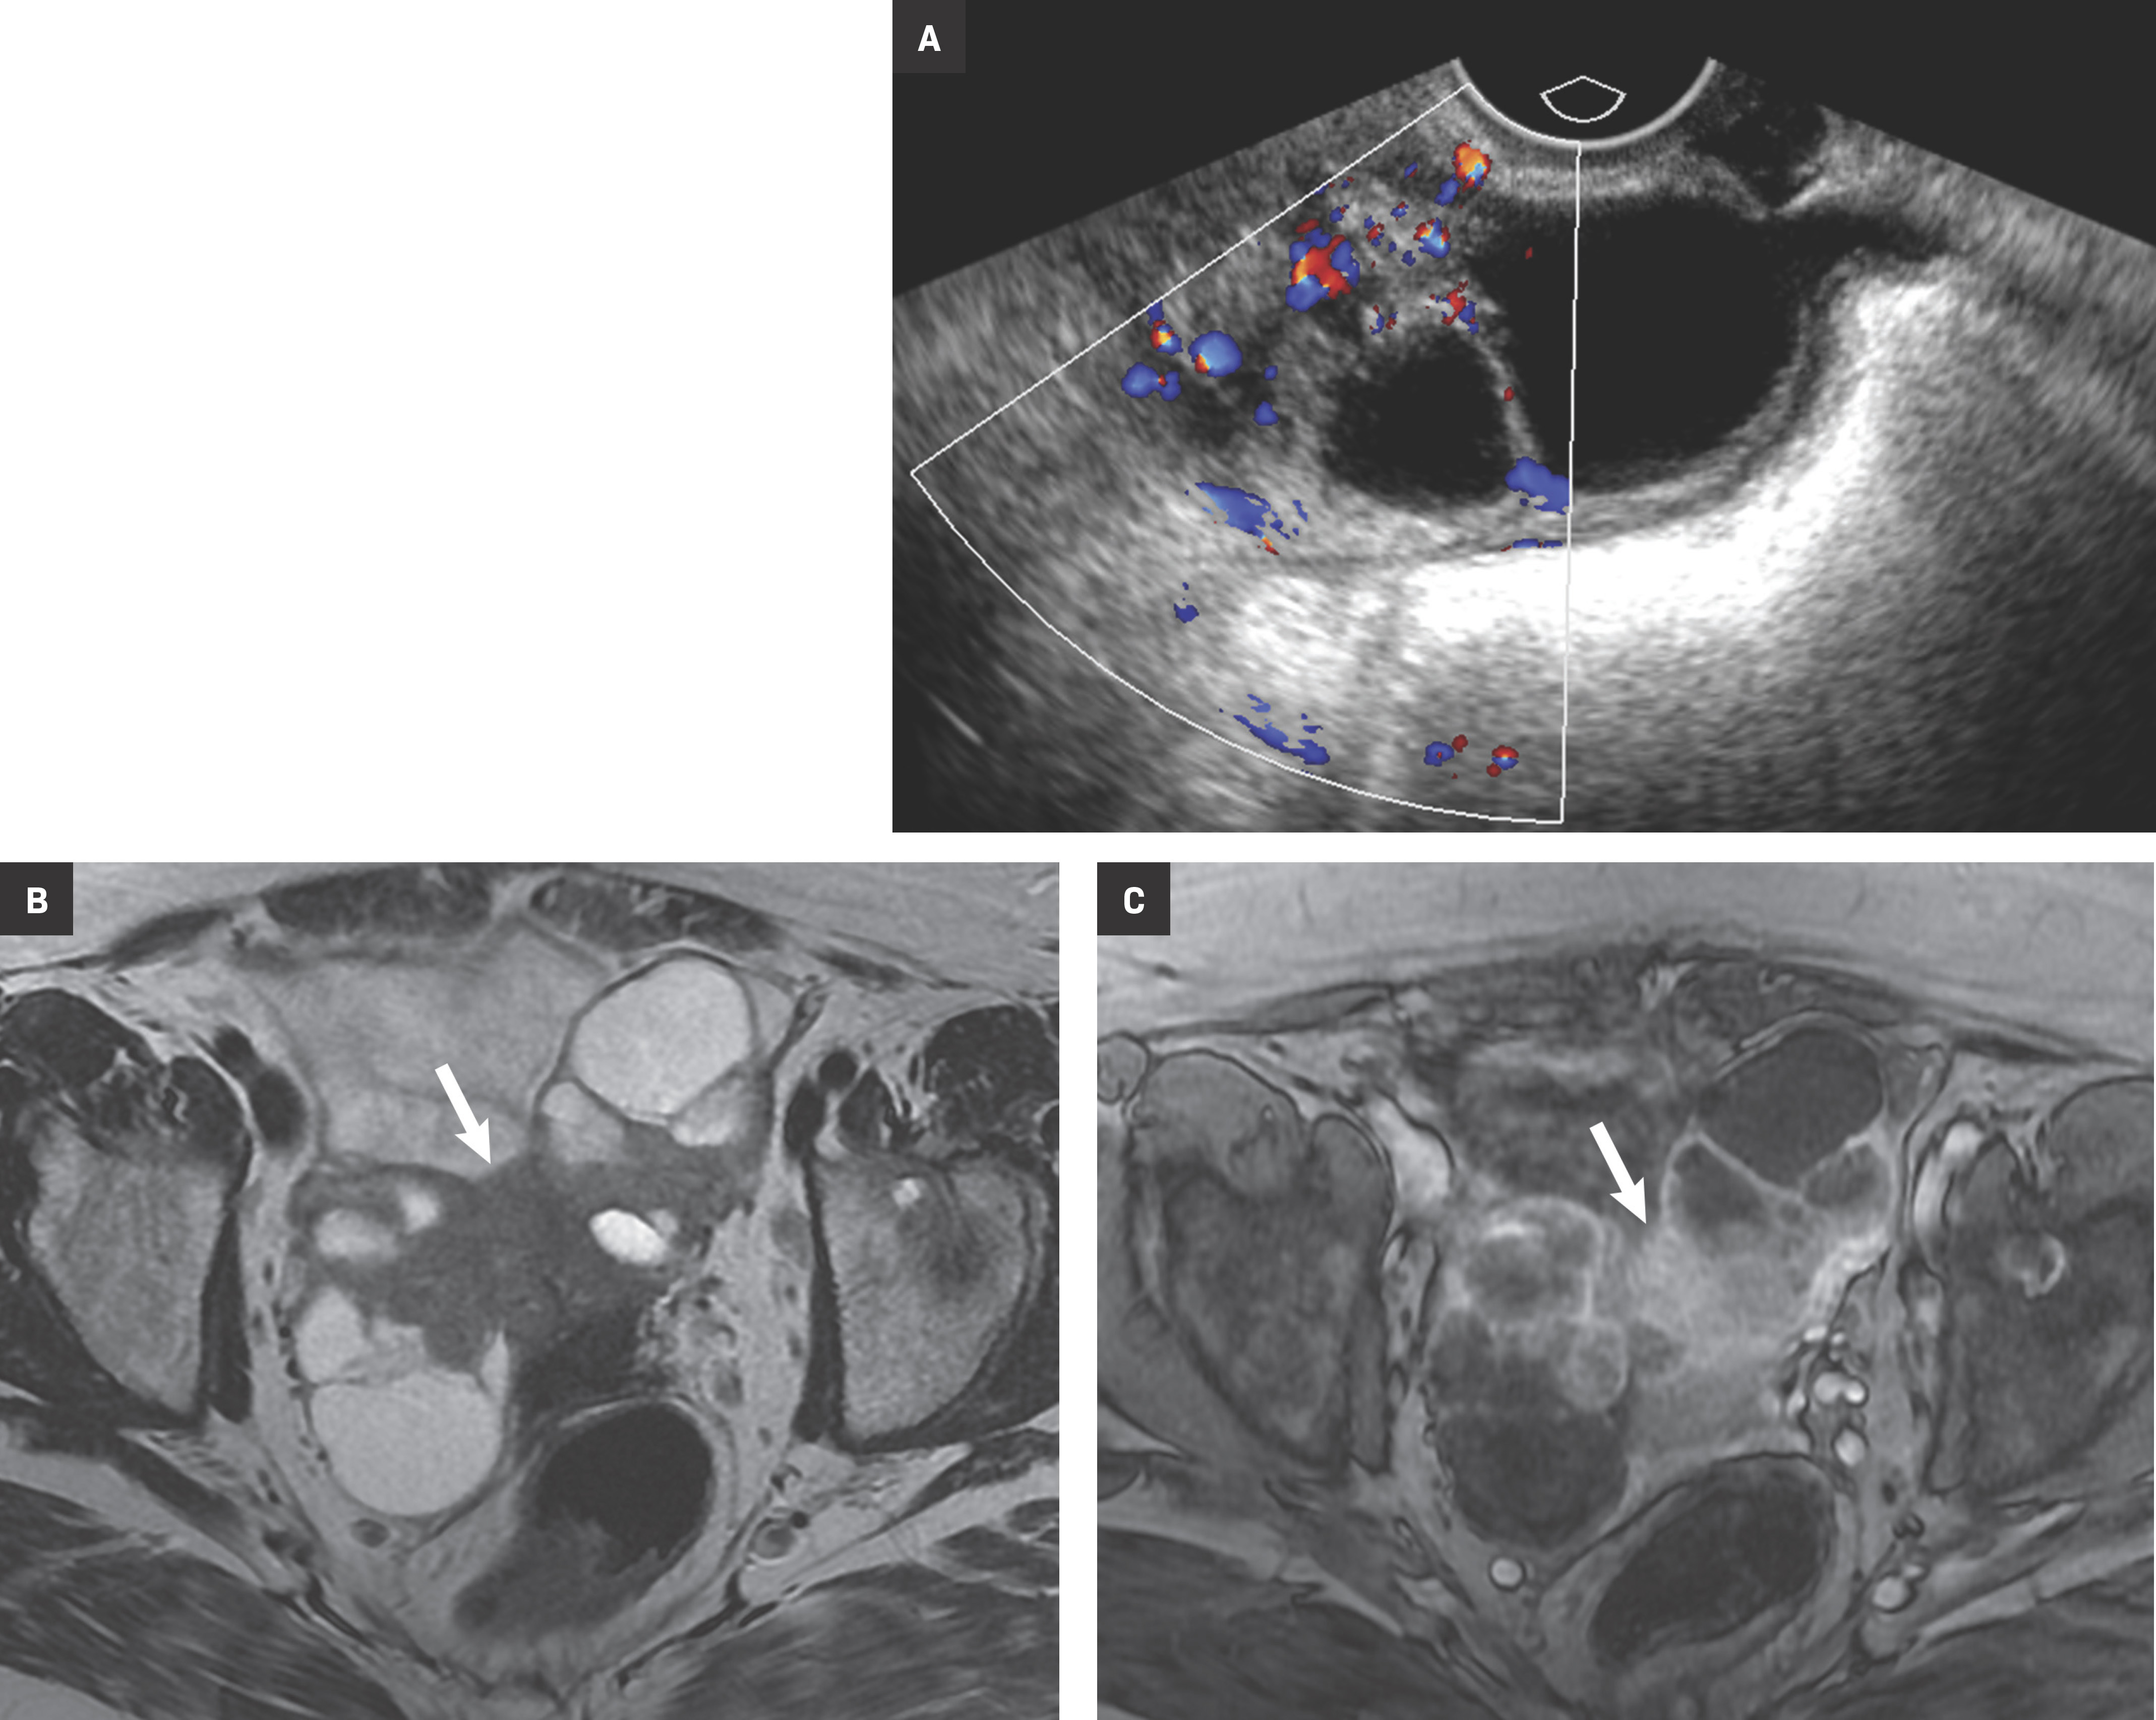
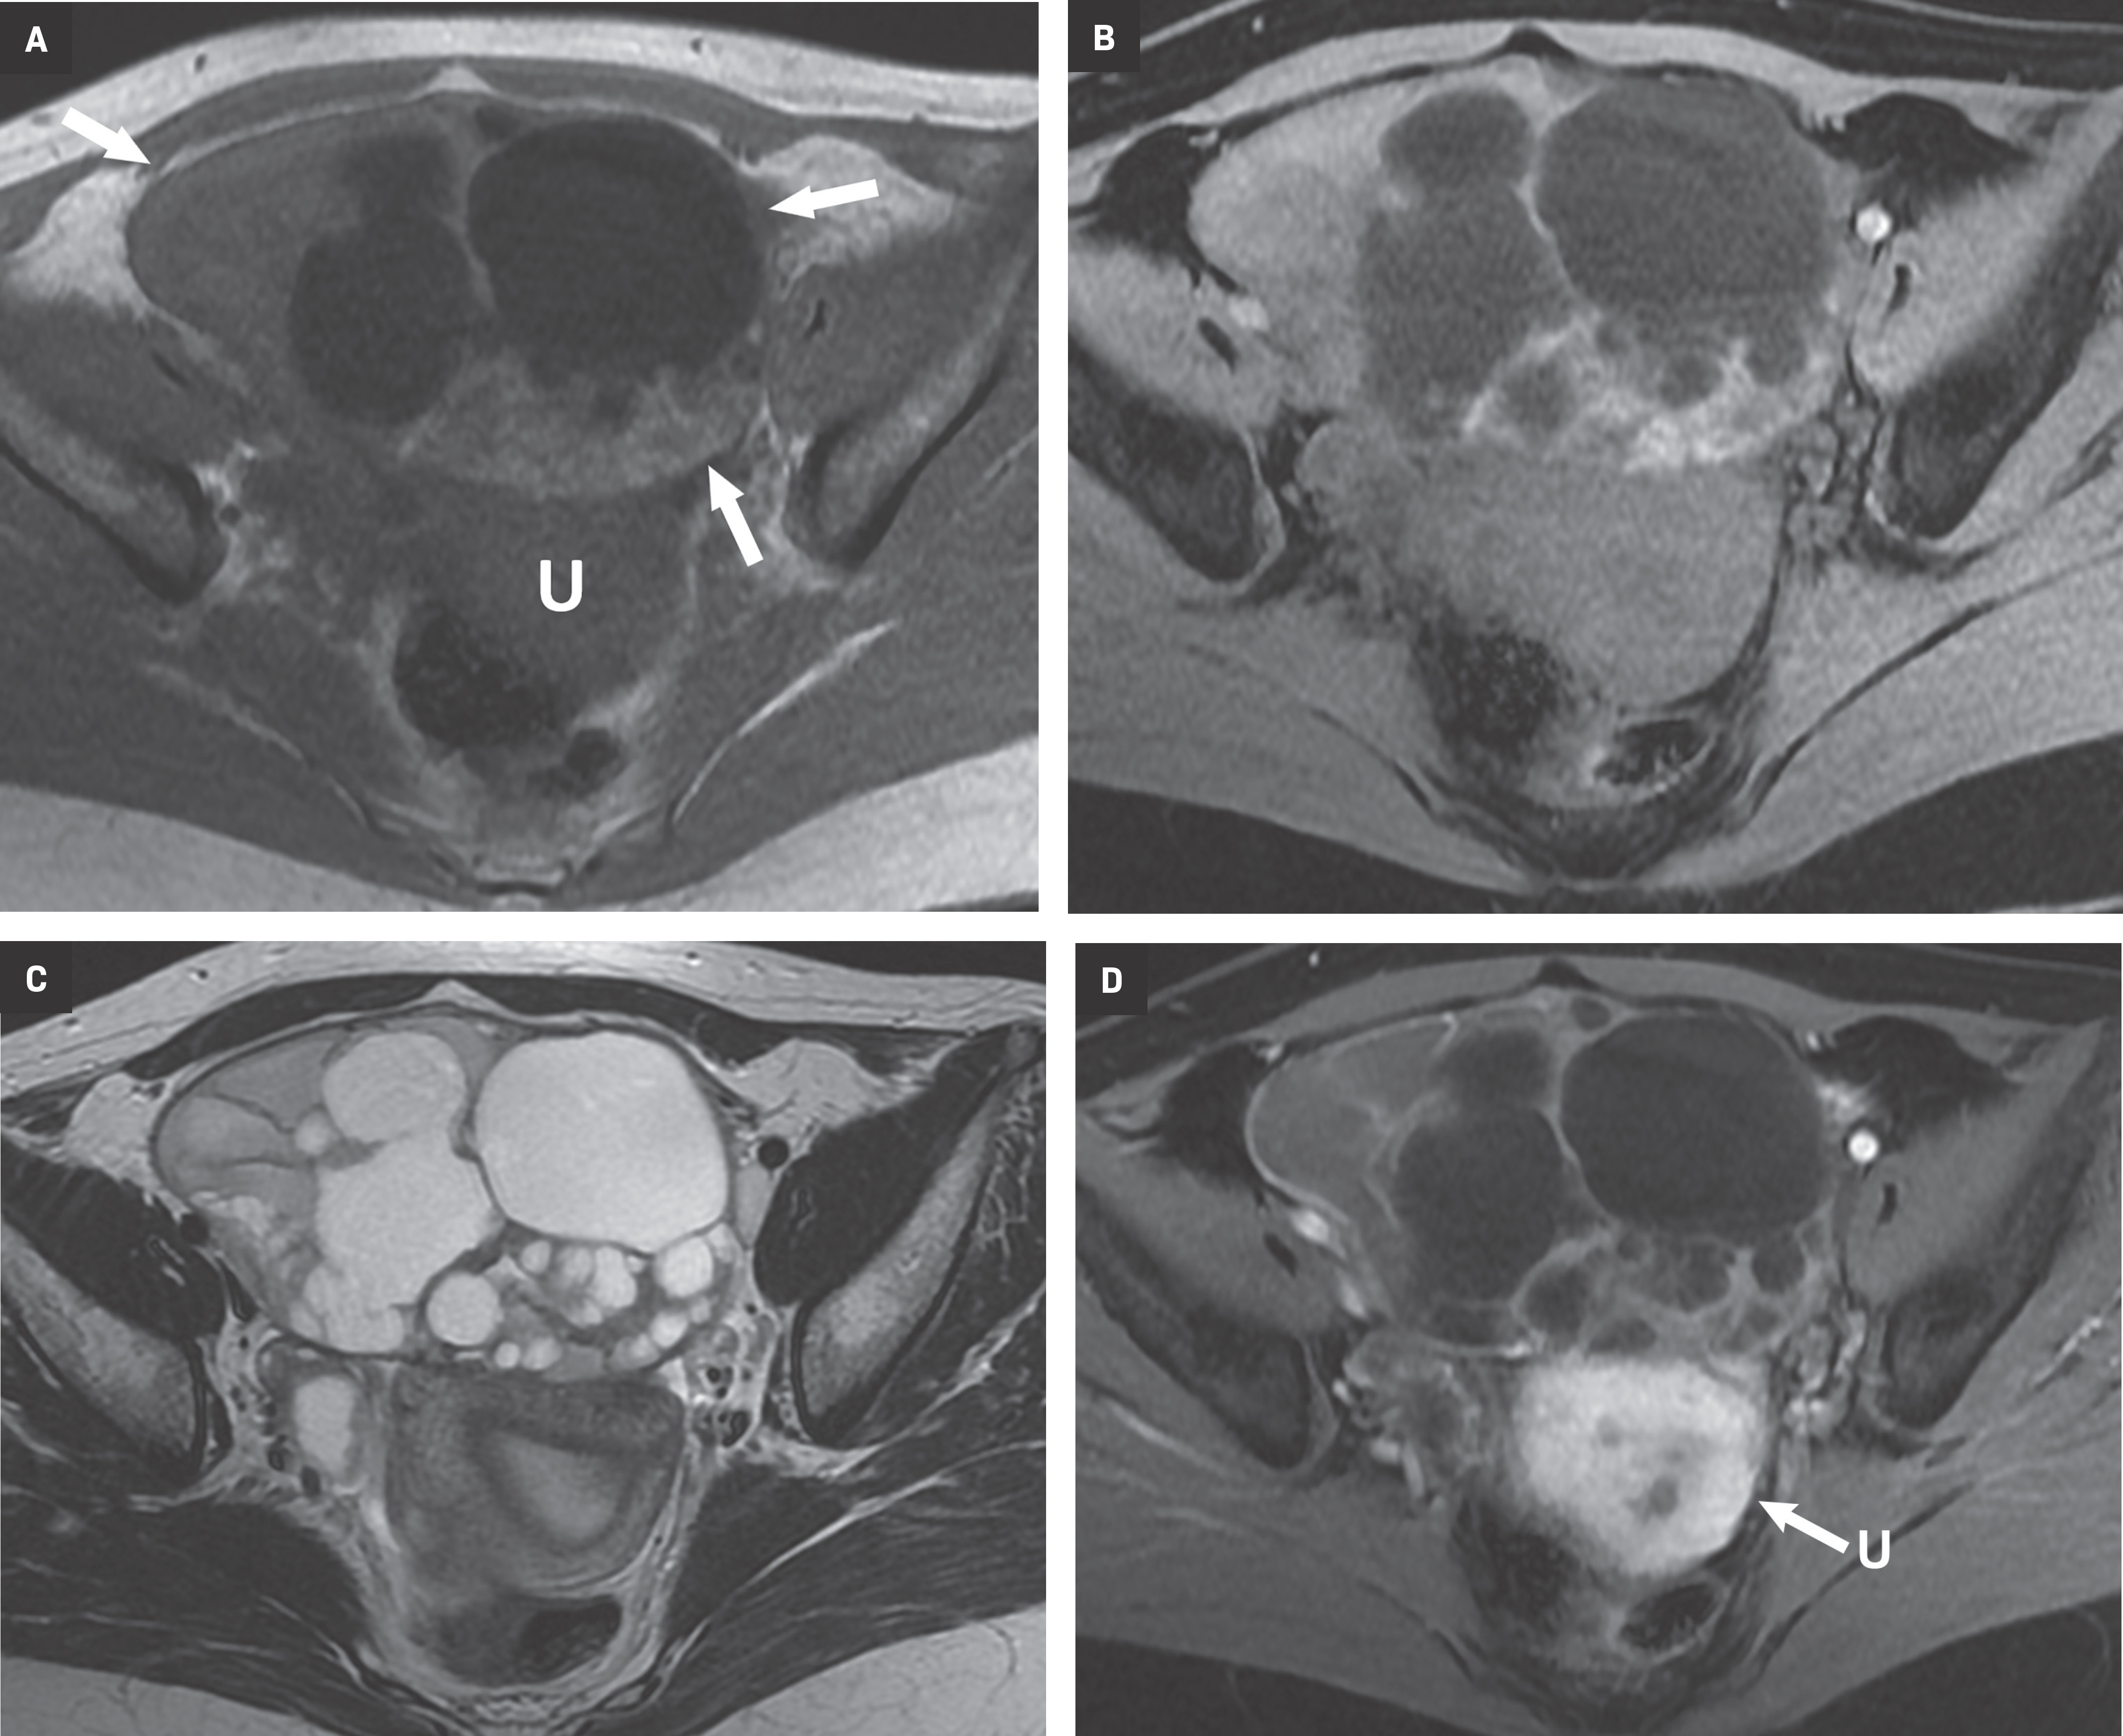
Mucinous tumors often have multiple septations with the appearance of multiple cysts. Concerning features include septations with Doppler flow on ultrasound, and papillary projections or solid enhancing components on MRI within the cystic portions of the tumor. It is important to identify imaging features that may differentiate benign from malignant cystic ovarian neoplasms. Malignancies are usually larger and have a heterogeneous architecture and thick walls. Septations are often thick and/or irregular with regions of enhancement. Mural nodularity and necrosis are often present (Figure 8; Table 1, 2). MRI may be useful to identify peritoneal nodularity with or without ascites, a high-risk feature (O-RADS MRI).3 At times, some of these tumors may appear malignant on imaging but are considered pathologically as “borderline” tumors. These have a low potential for malignancy, occur in a younger population, and have a 10-year survival rate as high as 95%. However, these tumors may be difficult to distinguish from other, more aggressive surface epithelial neoplasms. Ultrasound color Doppler or MRI enhancement is usually not as robust with borderline neoplasms as with more aggressive lesions (Figure 9). Ovarian metastases are not surface epithelial neoplasms, but they may mimic the imaging appearance of some of these tumors, often being more solid or mixed solid and cystic.
Conclusion
Ultrasound can be used to classify ovarian lesions under most circumstances. However, there are cases where MRI is needed to problem solve and establish a more conclusive diagnosis. This stepwise approach should be helpful as a general guide to help radiologists differentiate ovarian pathology on MRI.
References
- American College of Radiology Ovarian-Adnexal Reporting & Data System (O-RADS). 2021.
- Corwin M, Gerscovich E, Lamba R, Wilson M, McGahan J. Differentiation of ovarian endometriomas from hemorrhagic cysts at MR imaging: utility of the T2 dark spot sign. Radiology. 2014;271((1)):126-132. doi:10.1148/radiol.13131394.
- Thabet A, Somarouthu B, Oliva E, Gervais D, Hahn P, Lee S. Image-guided ovarian mass biopsy: efficacy and safety. J Vasc Interv Radiol. 2014;25((12)):1922-1927.
- Levine D, Patel M, Suh-Burgmann E. Simple adnexal cysts: SRU consensus conference update on follow-up and reporting. Radiology. 2019;293((2)):359-371.
Citation
. Ovarian Masses and O-RADS: A Systematic Approach to Evaluating and Characterizing Adnexal Masses with MRI. Applied Radiology. 2021;50(4):8-18. doi:10.37549/AR2749.