Pulmonary embolism in segmental and subsegmental arteries: Optimal technique, imaging appearances, and potential pitfalls in multidetector CT
Applied Radiology — Vol. 36 , Issue 2 , pp. 34 -40
DOI: 10.37549/AR1484
Published: February 1, 2007
Categories
Multidetector CT (MDCT) has become the gold standard imaging modality for the diagnosis of pulmonary embolism (PE). Detection of small emboli in segmental and subsegmental pulmonary arteries is still a diagnostic challenge, however. The reported incidence of isolated segmental PE ranges from 4% to 30% in various series.1-3 Small segmental or subsegmental PE are of importance in patients with limited cardiopulmonary reserve and for diagnosis of chronic pulmonary hypertension. They may be an indicator of silent deep venous thrombosis, which may predispose patients to more severe embolic events.2 This article will present optimal technical parameters and scan interpretation techniques for MDCT evaulation of PE, will review key imaging appearances of acute and chronic PE in small vessels, and discuss potential interpretation errors.
Technical considerations
Multidetector CT has extended the assessment of pulmonary vessels to distal segmental and subsegmental levels primarily due to a number of advantages of CT for this indication. CT provides uniform arterial enhancement of vessels as small as 2 to 3 mm in diameter. It also provides thinner slices with reduced partial volume artifact and decreased noise as well as isotropic imaging with almost equal resolution in all planes. The speed of MDCT scanning offers faster scanning and results in fewer motion artifacts. Finally, MDCT has a lower rate of inter-observer variability and a lower error rate than does pulmonary angiography for the assessment of PE in segmental and subsegmental vessels.4-9
CT technique
Currently available 16-slice MDCT scanners are used to acquire images of the thorax after administration of nonionic intravenous contrast media. The scanning is best performed in a caudocranial direction since PE are more common in the lower lobes,2 and images are less likely to be affected by breathing artifacts if the scan is started from the caudal direction. The field of view is the widest rib-to-rib distance acquired during a breath-hold after inspiration. With the 1.25-mm detector thickness and submillimeter reconstruction intervals available on a 16-slice CT scanner (Table 1), there is an excellent chance of detecting small emboli and greater interobserver agreement in reading the PE studies.7-9
An 18- to 20-gauge antecubital line or a central catheter is ideal for contrast injection. With the shorter scan durations offered by MDCT, an effective approach for optimal contrast opacification is to reduce the contrast volume, increase the injection rate, and increase the contrast medium concentration.10
Contrast is ideally administered with the patient’s arm alongside the thorax, which offers physician control of the venous access during the injection and avoids venous compression at the thoracobrachial junction.8 The patients receive an injection of 100 to 140 mL of 270 to 360 mgI/mL iodinated nonionic contrast media at a rate of 3 to 4 mL/sec. Bolus tracking yields more homogeneous enhancement than does the test bolus technique.11 In one study, the use of an isosmolar contrast agent for MDCT angiography to exclude PE did not significantly improve enhancement quality compared with the use of a low-osmolar contrast agent.12
To interpret the enormous number of thin slices acquired as part of an MDCT PE study and evaluate small vessels in multiple planes, a satellite console with a computer workstation is essential. In our institution, we magnify and evaluate each lung separately (Figure 1). Pulmonary vessels are best evaluated by scrolling every segmental branch in and out from its origin to distal visible branch. Images are displayed with 3 different gray scales for interpretation of lung window (window width/level [HU] = 1500/-600), mediastinal window (350/40), and PE-specific (700/90) window settings.13-17 The postprocessing of MDCT data sets is best termed “volume interrogation.”6,9
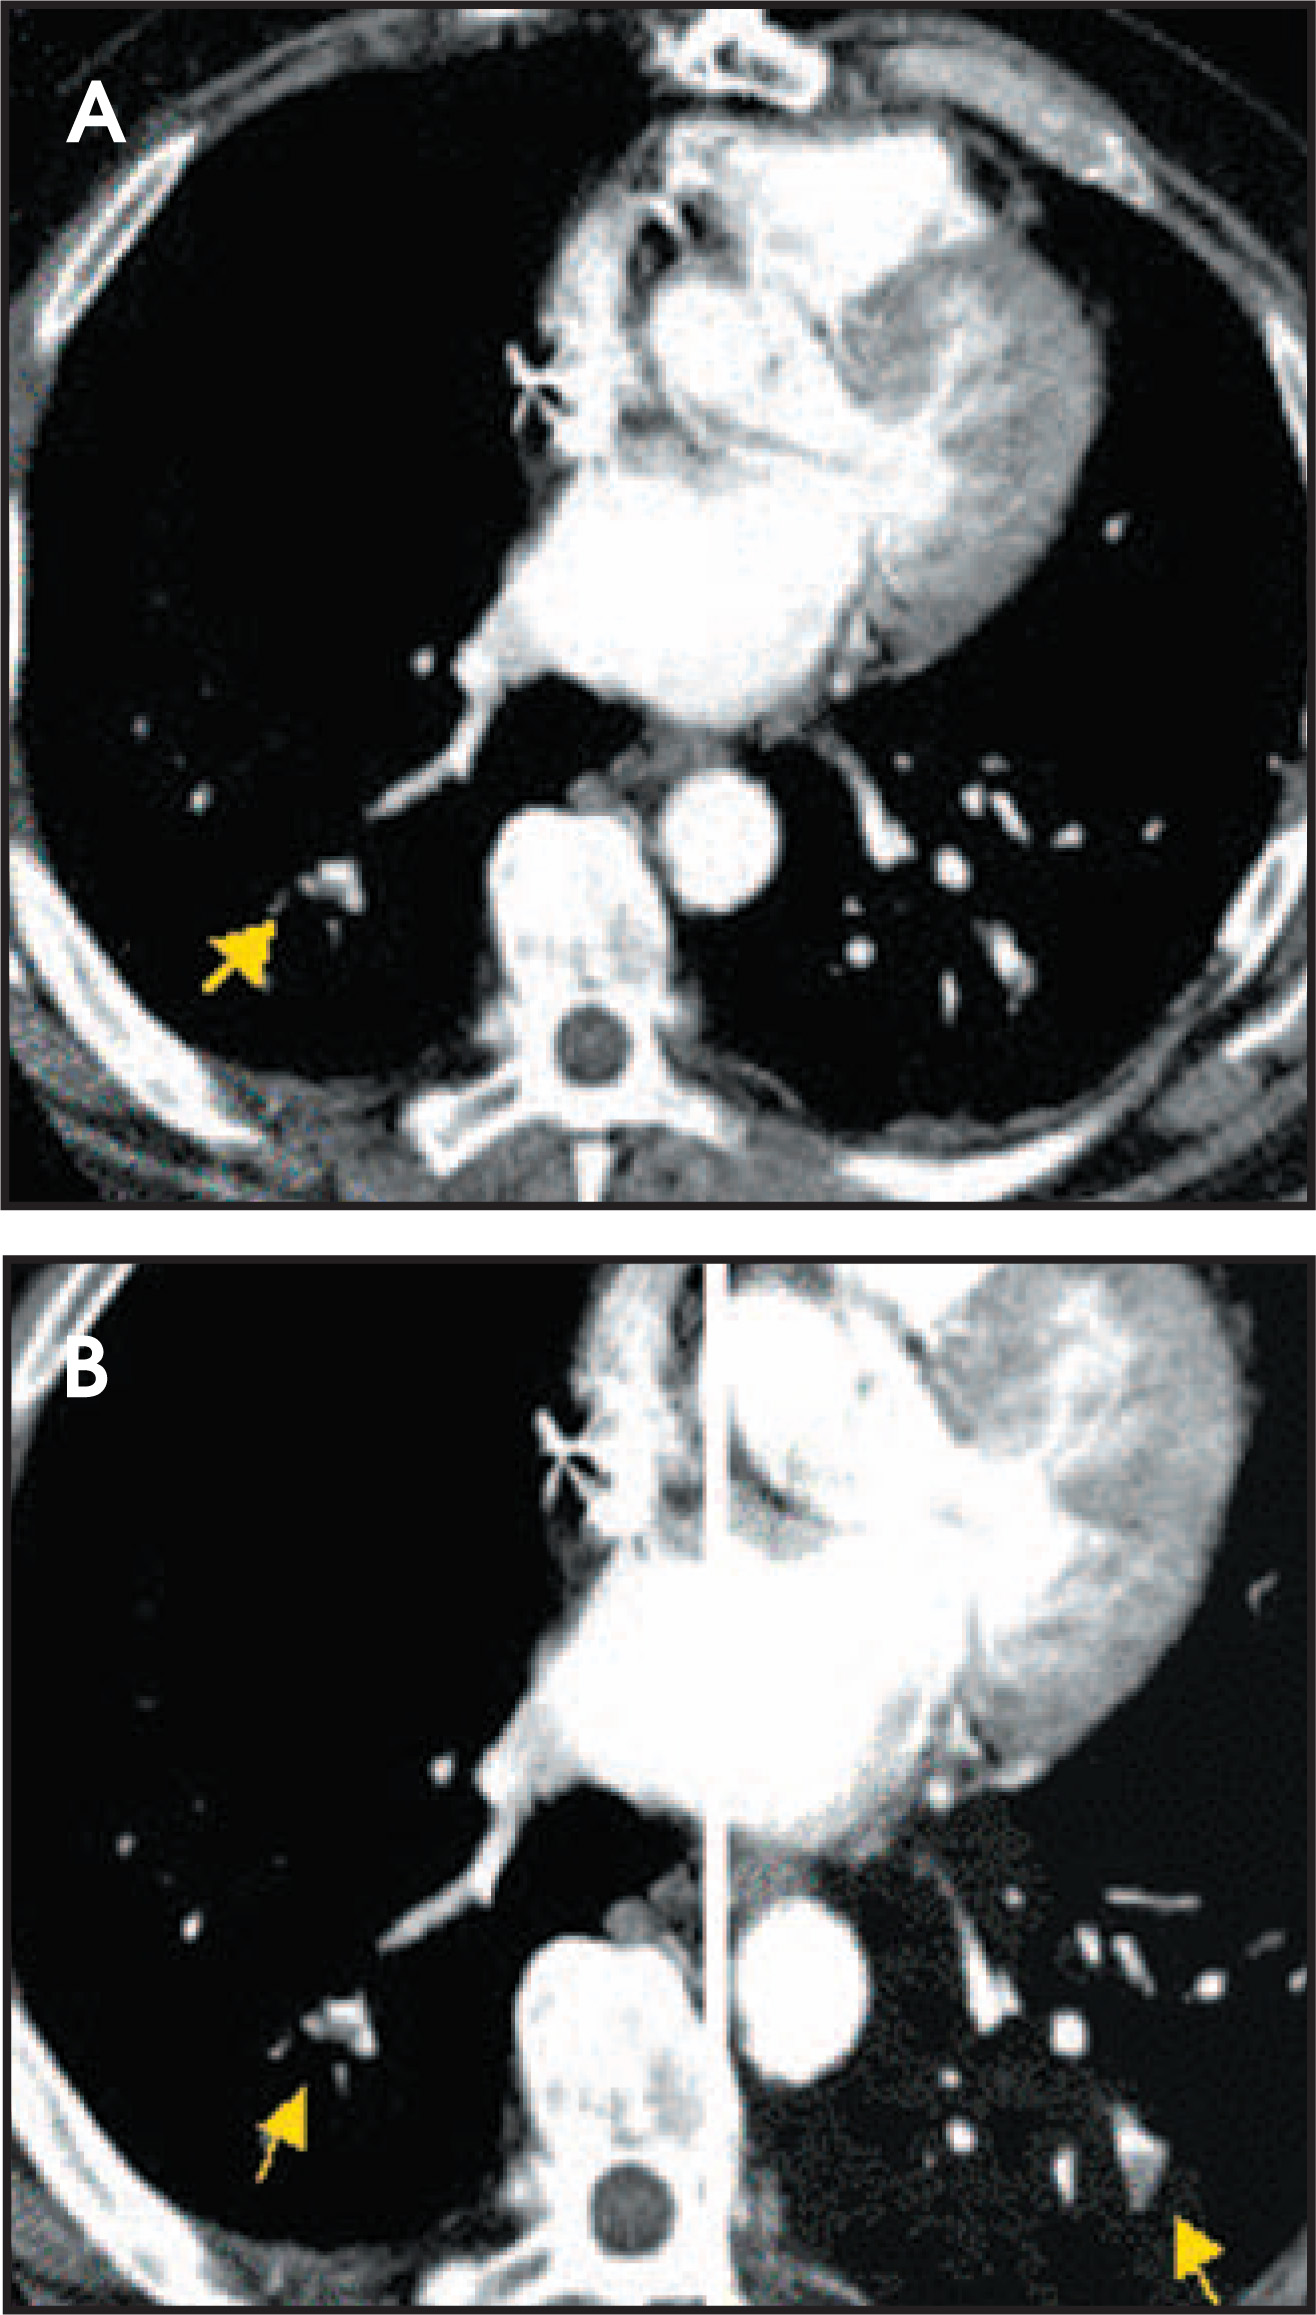
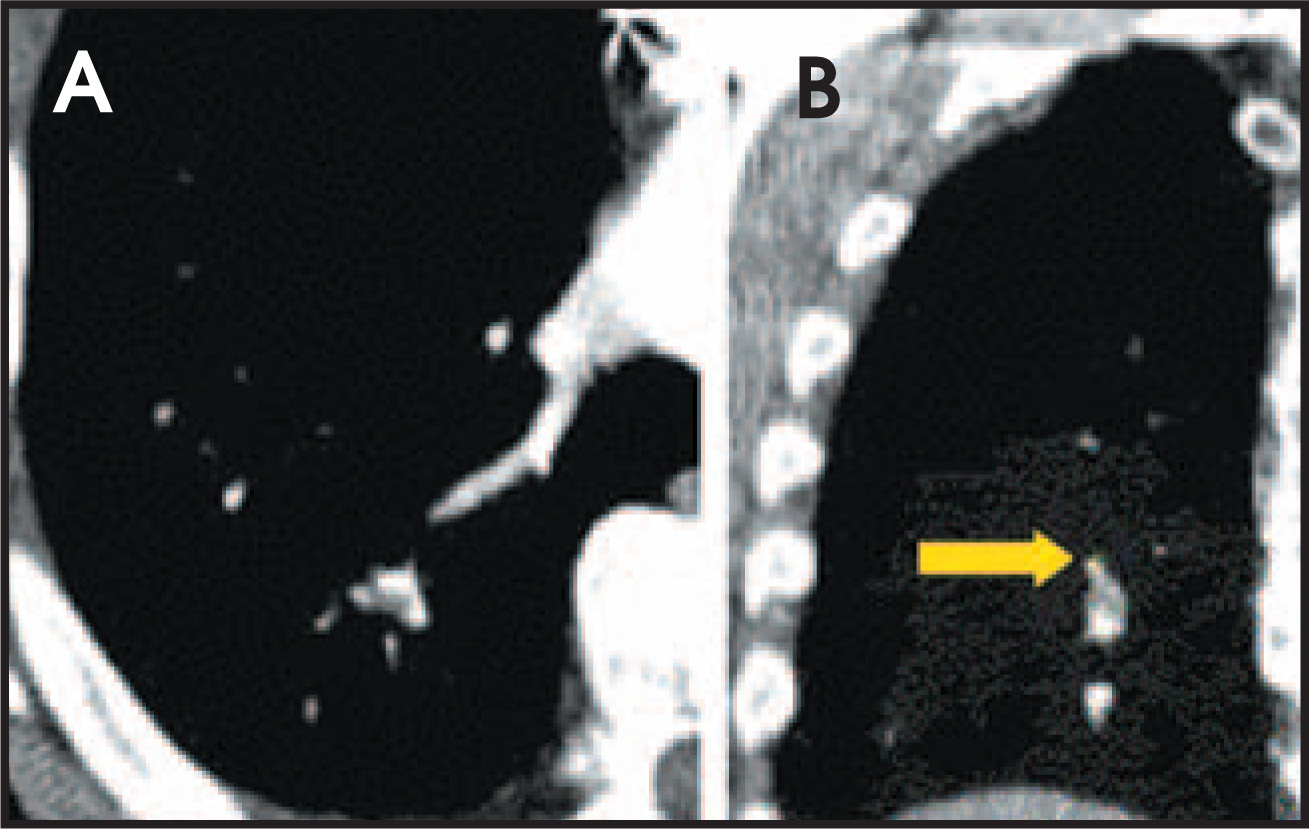
In the era of MDCT, axial image review alone is rapidly becoming not only impractical, but also suboptimal. Using radial multiplanar reformatting of the MDCT data sets offers significant improvement in the recognition of subsegmental PE.18 Reformatted images through the longitudinal axis of a vessel are often used to overcome various difficulties encountered with axial sections of oblique- or axial-oriented arteries. These images help to differentiate true PE and a variety of patient-related, technical, anatomic, and pathologic factors (Figure 2) that can mimic 6,9,13,14 Multiplanar images are also beneficial as communication tools for our referring colleagues and can enhance the role of the radiologist as part of the clinical team.
For documentation and interpretation purposes, it can be useful to subjectively grade the level of contrast opacification as good to excellent, diagnostic but of limited value, or not of diagnostic quality, since it reflects clinical situations. In our departments, we grade the opacification objectively as excellent, good, or poor, depending upon the visualization of small peripheral arteries, segmental arteries, and only central main and lobar arteries, respectively. It is important to also make note of respiratory motion and image noise.
CT signs of PE
Acute small PE
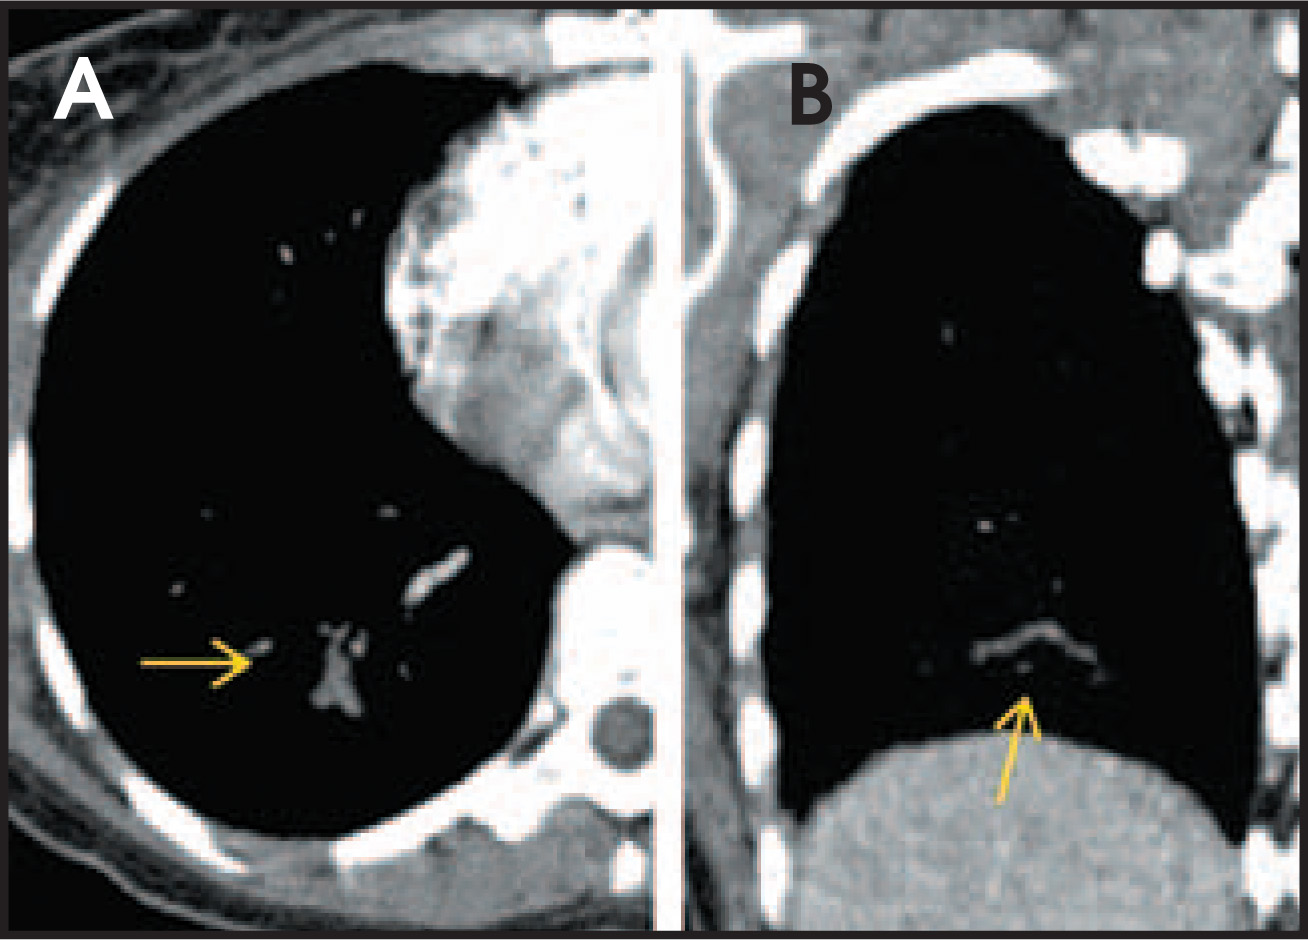
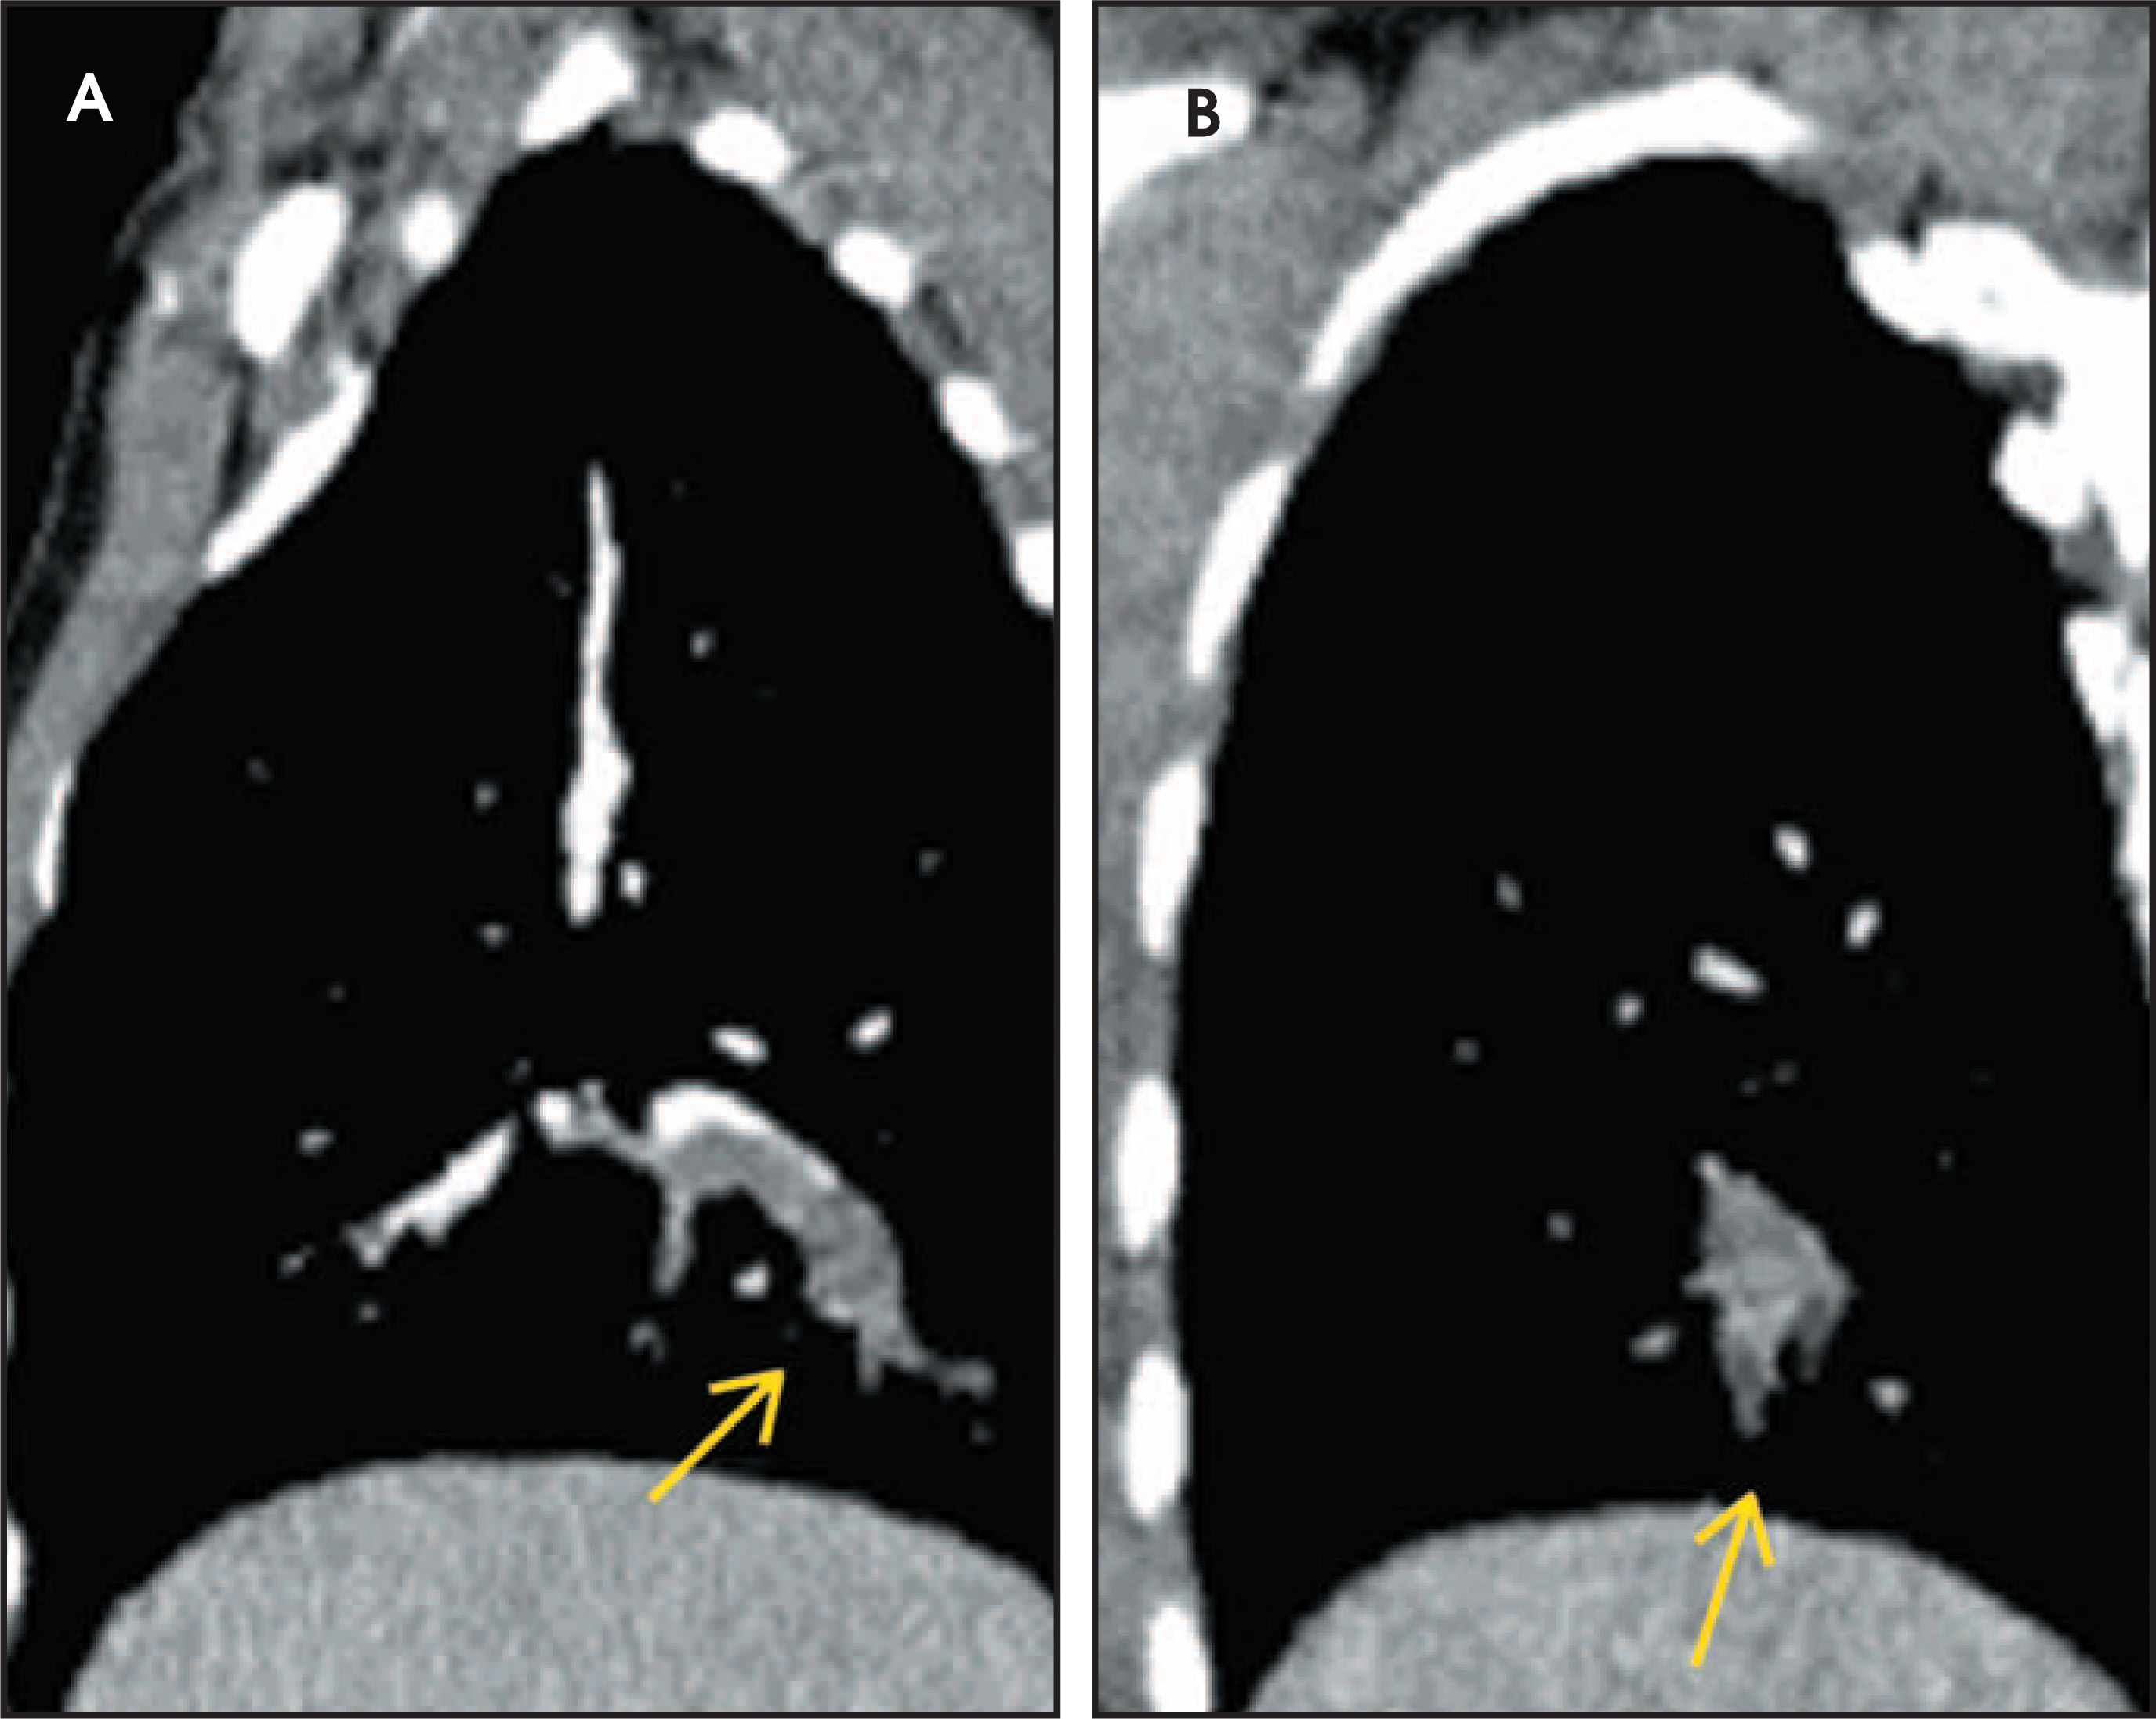
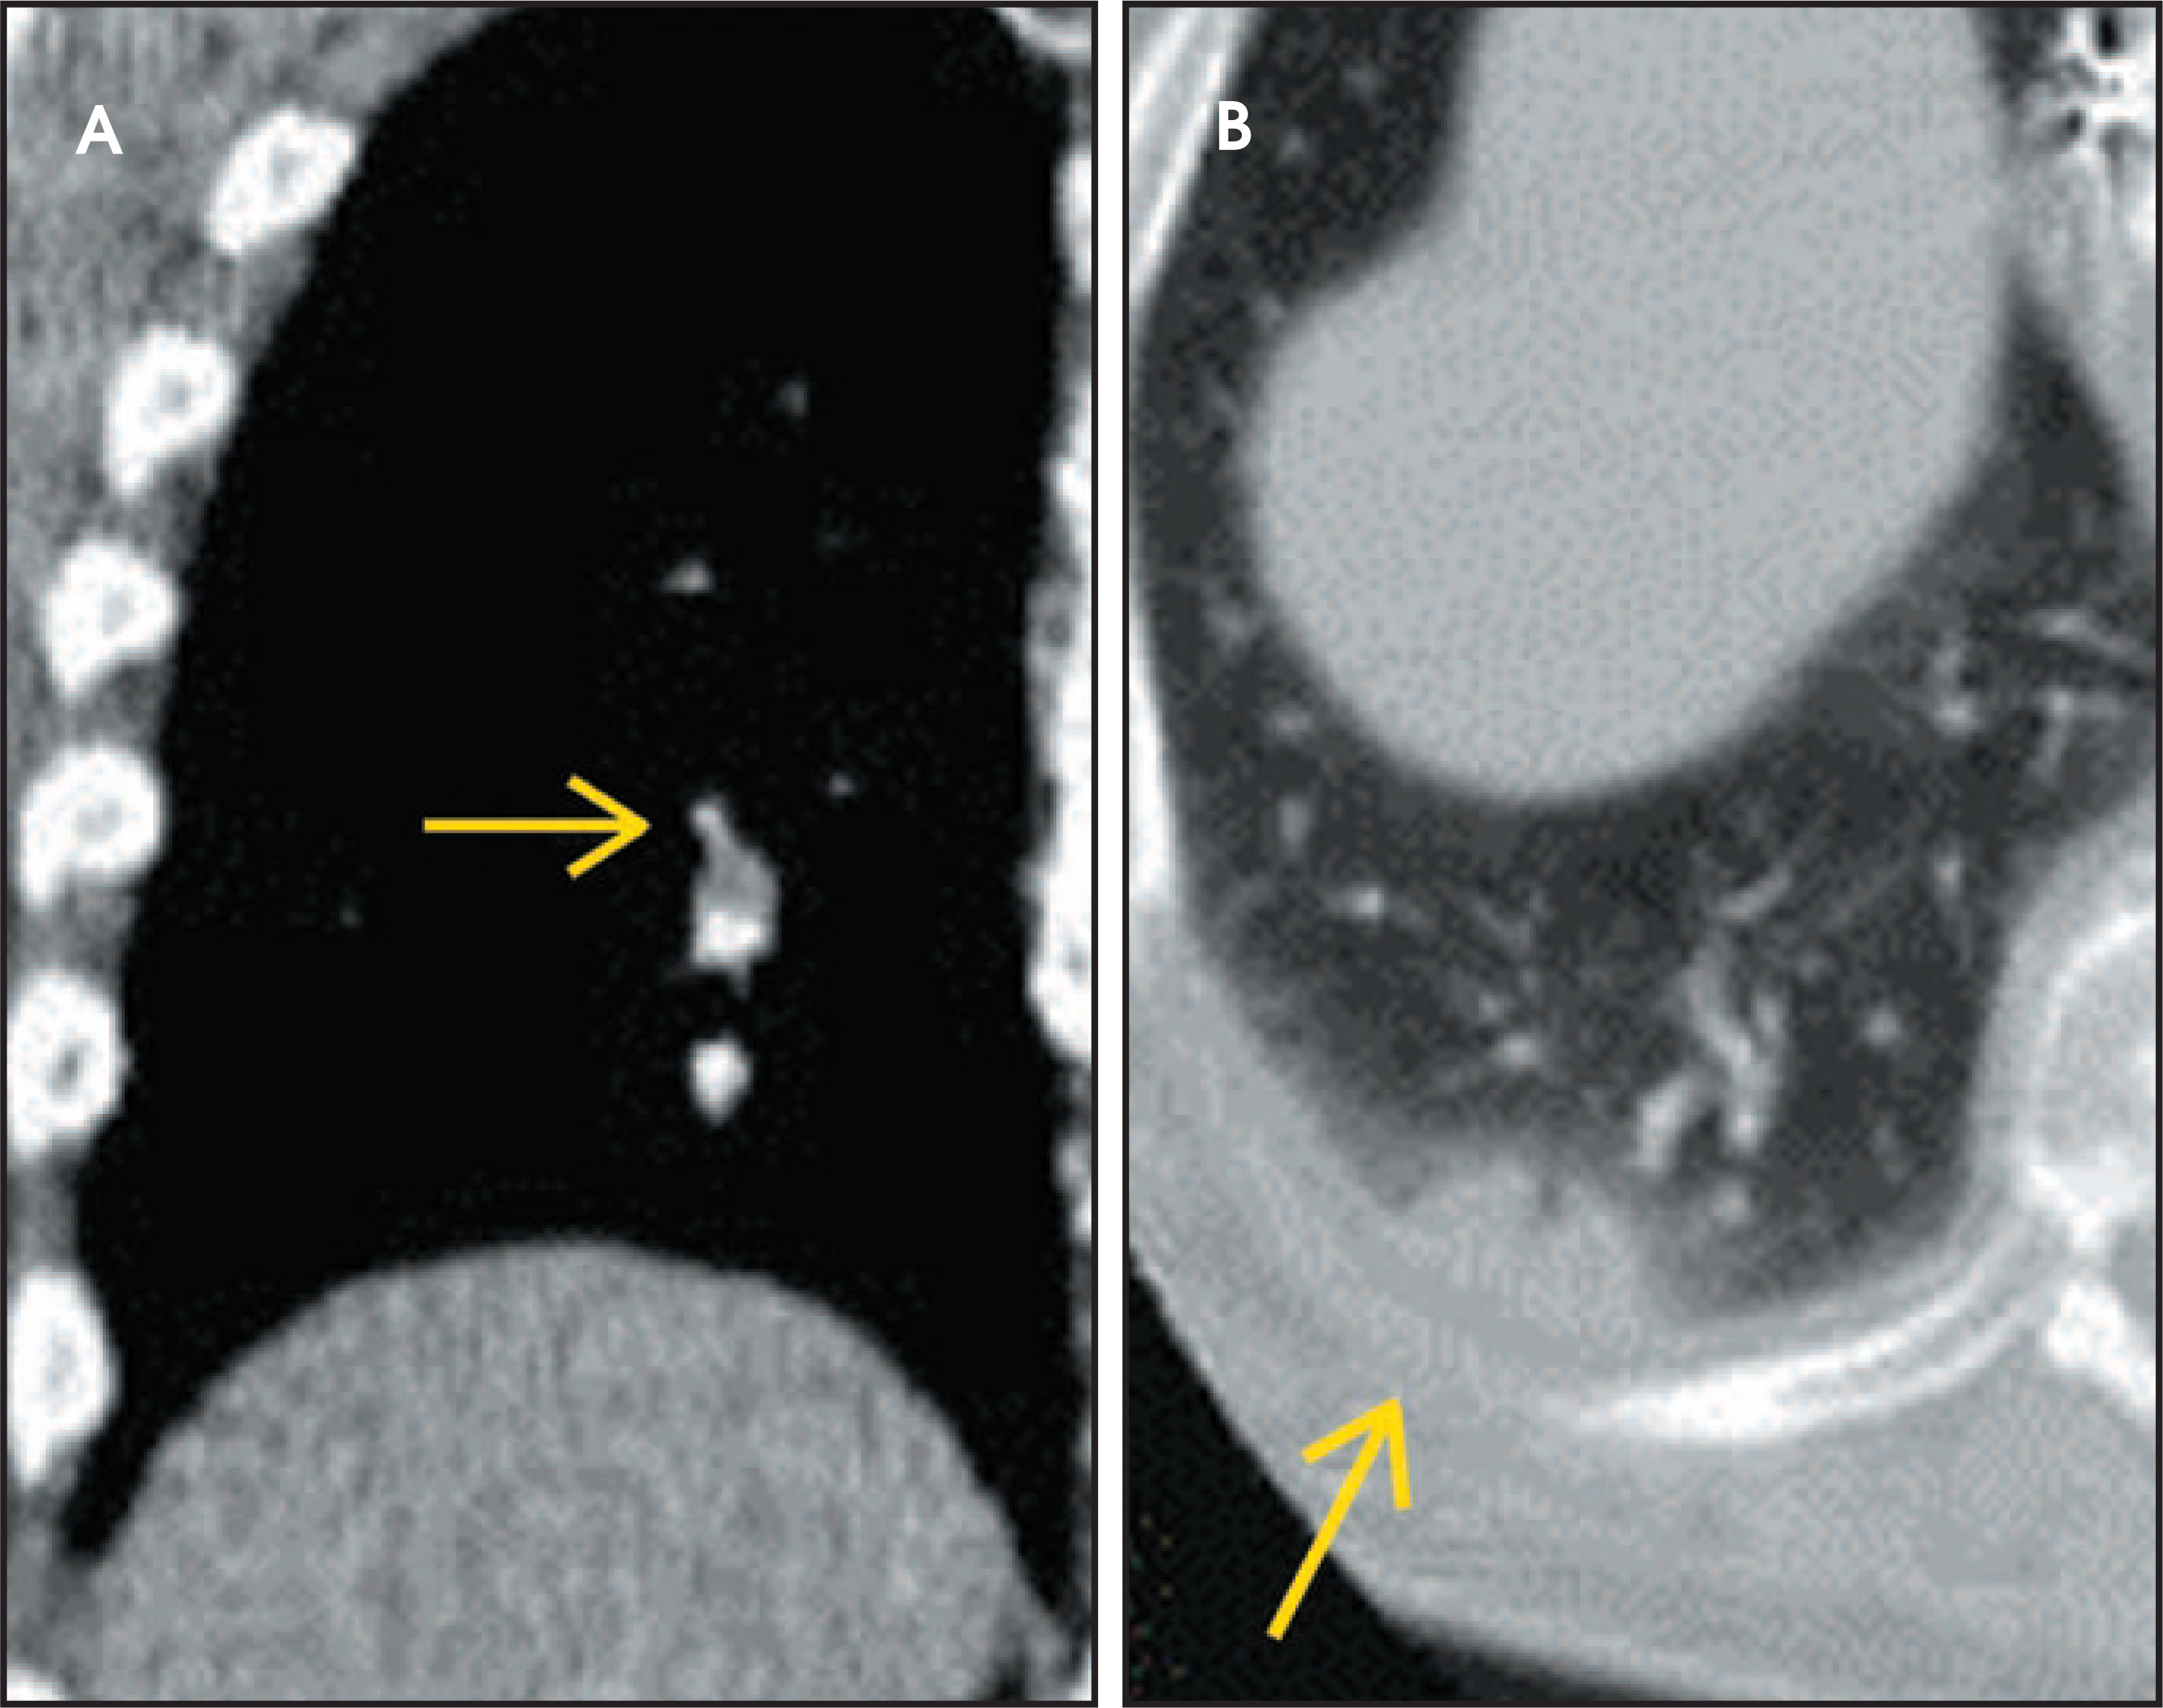
There are a number of very useful signs on MDCT that can help to identify acute small PE.15,16,19-22 Figure 3 illustrates complete arterial occlusion and Figure 4 depicts an artery that appears enlarged compared with adjacent patent vessels. A partial arterial occlusion may appear as a “donut” sign on images ac-quired perpendicular to the long axis of a vessel (Figure 5A) or as the “tram track” sign on longitudinal images of the vessel (Figure 5B). Figure 6 provides an example of a peripheral intraluminal filling defect that formed an acute angle with the arterial wall. A small PE may also appear as a peripheral wedge-shaped infarct (Figure 7), discoid atelectasis, or pleural reaction. Infarcts, right ventricle dilatation, and interventricular septal deviation are uncommon with small emboli.18
Chronic PE
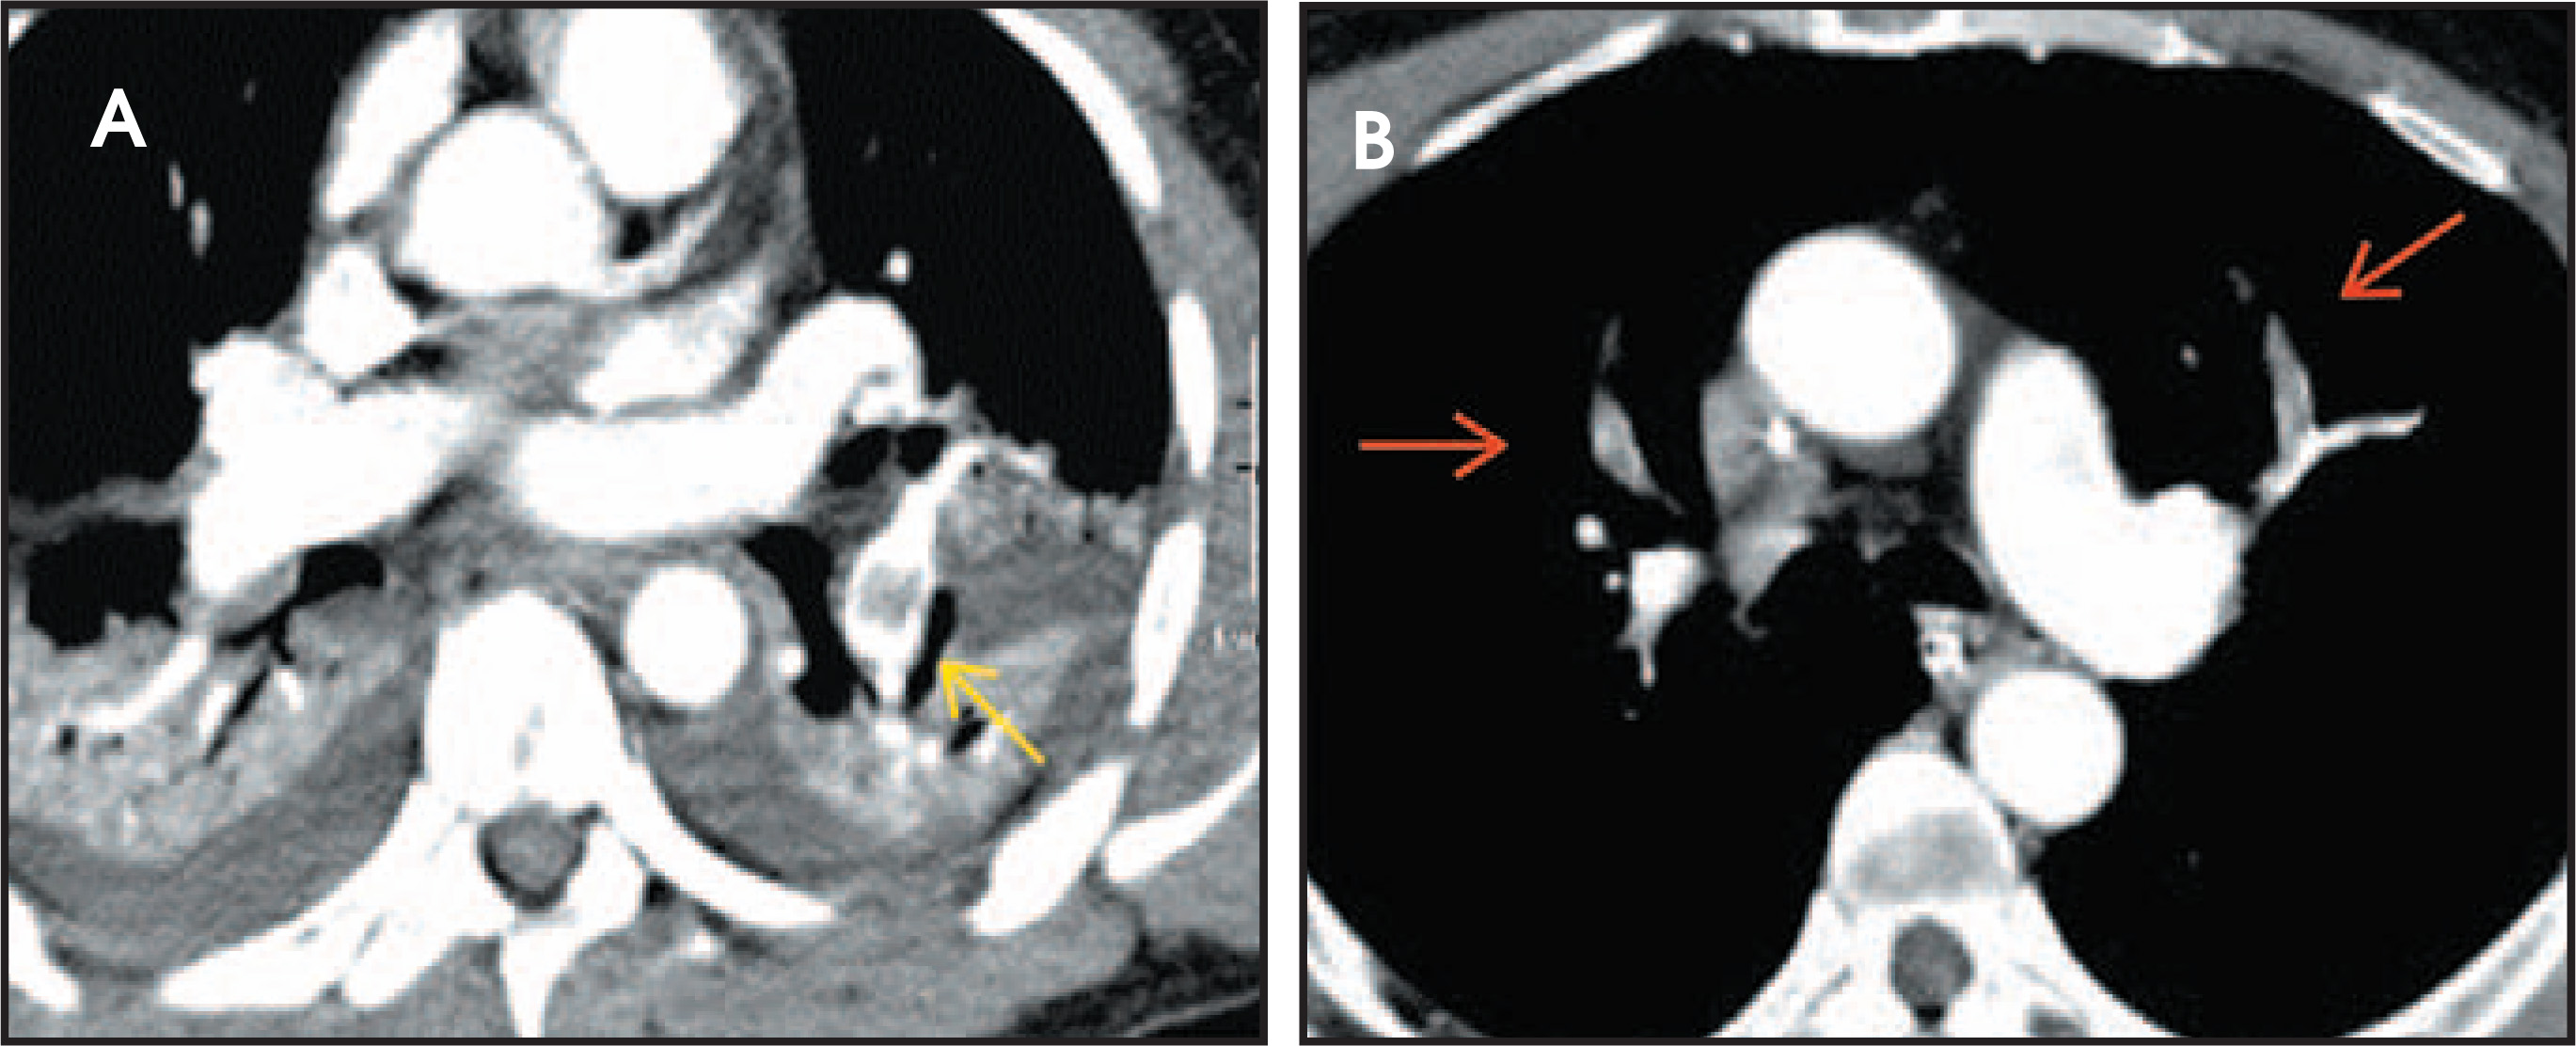
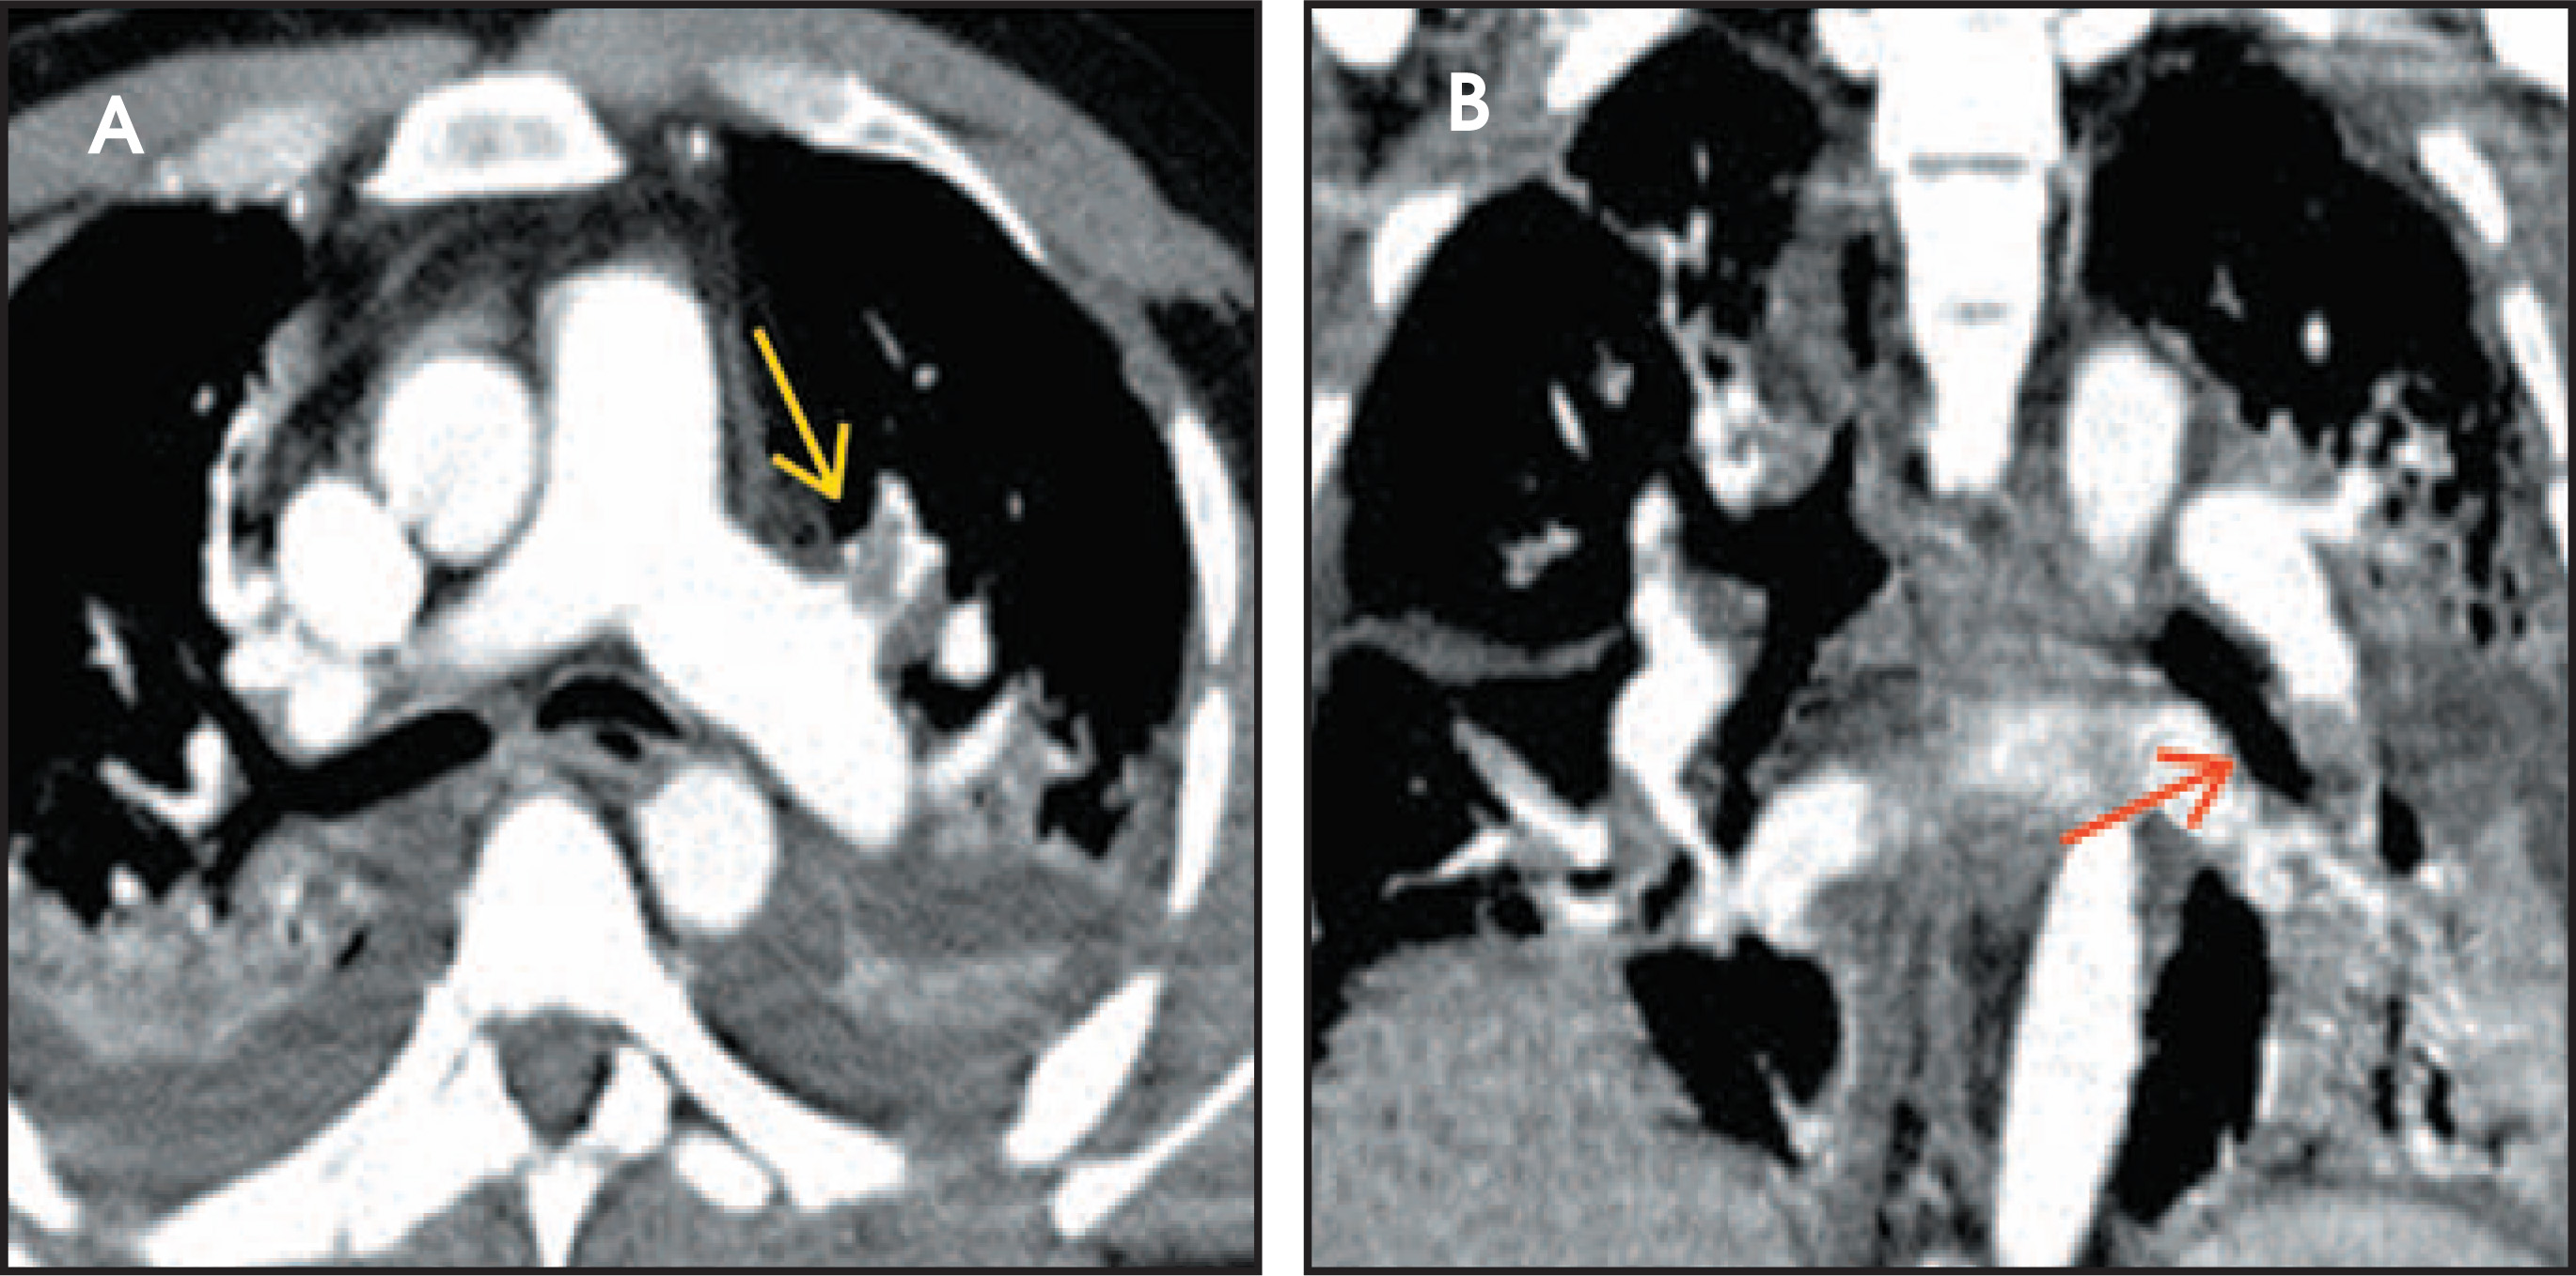
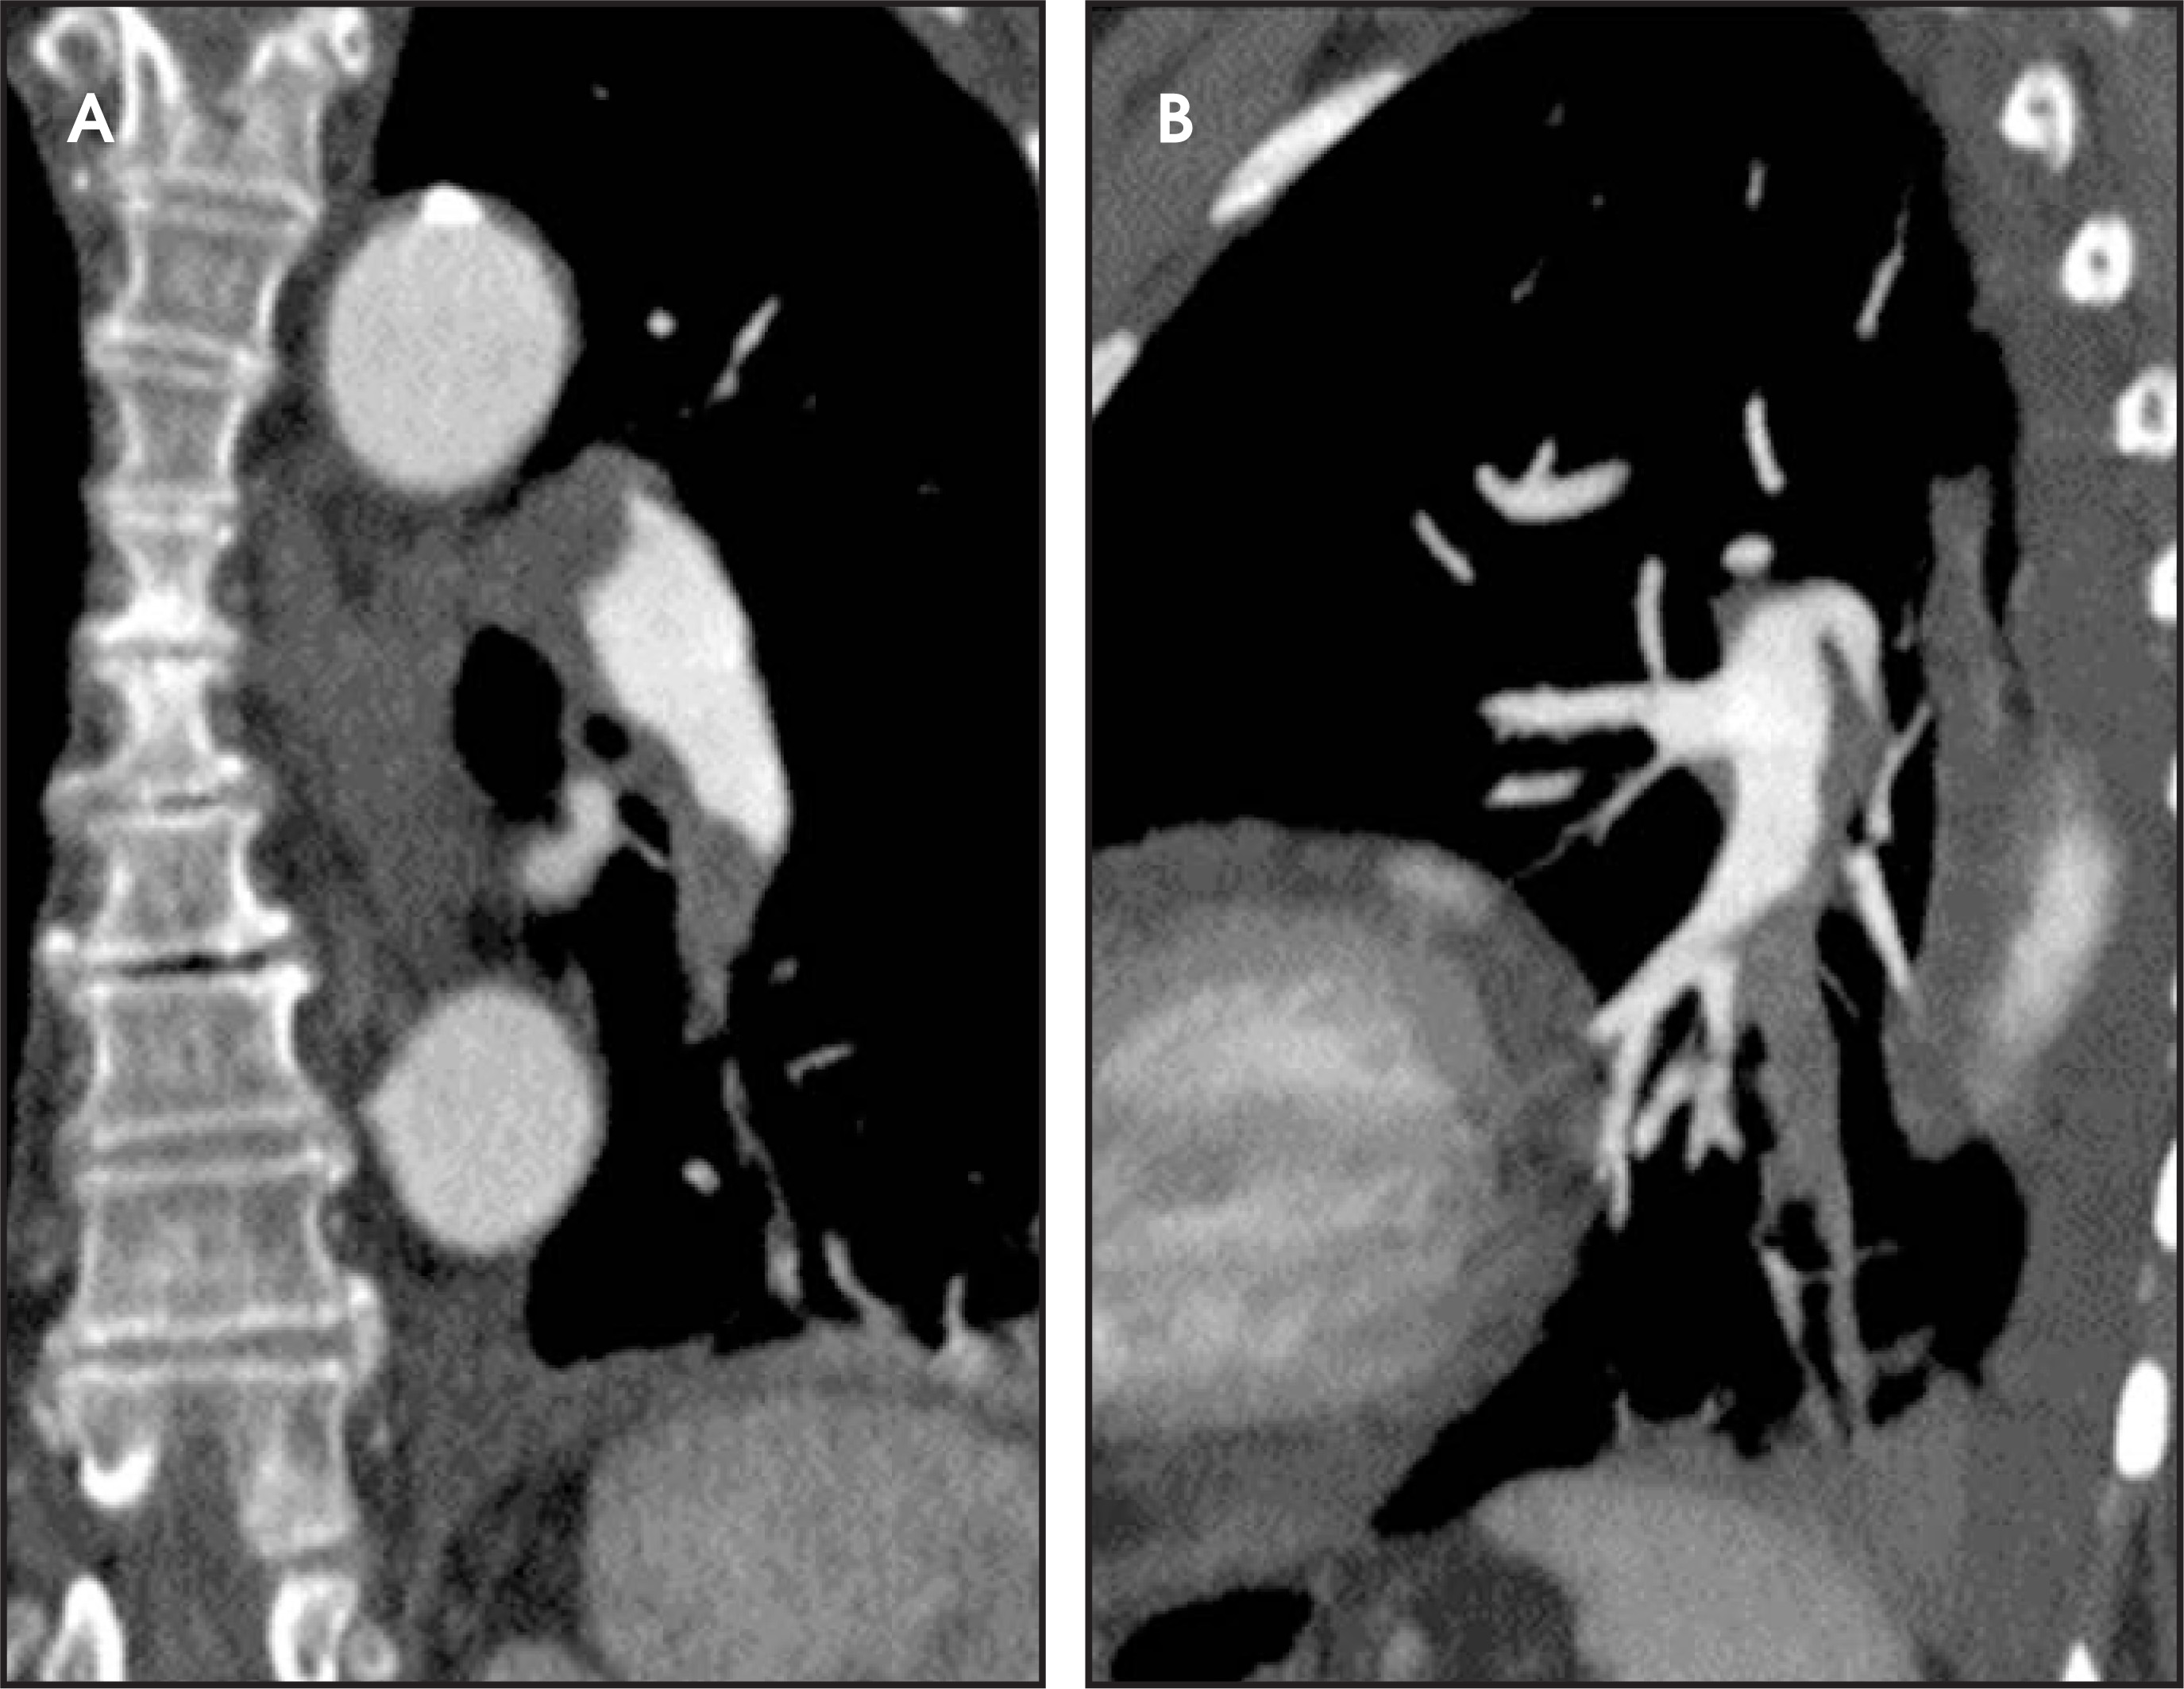
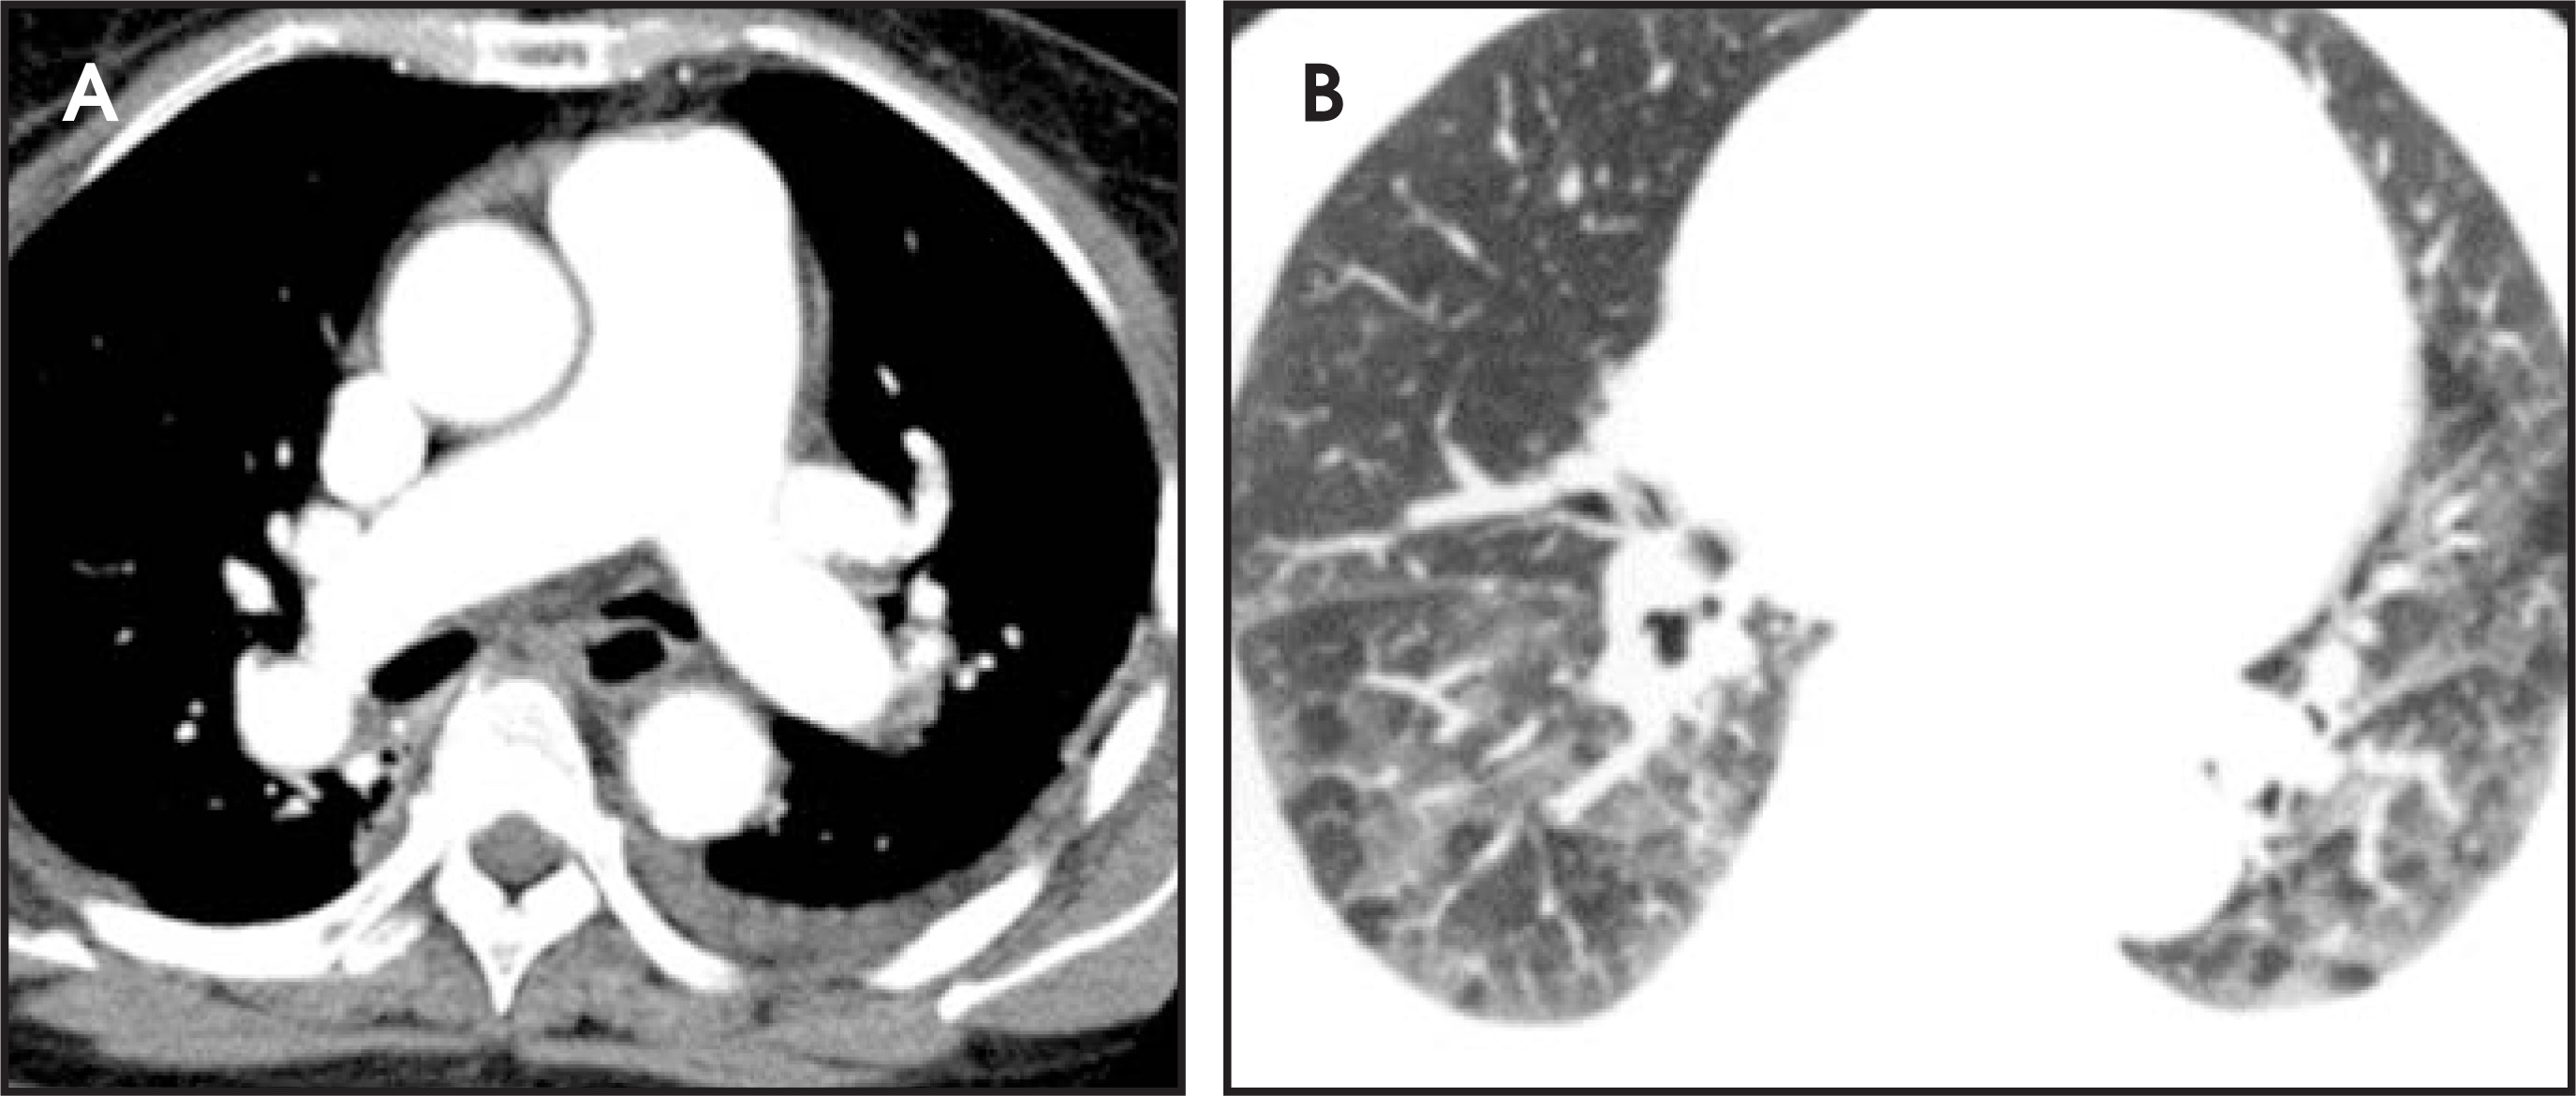
In contrast to acute small PE, there are distinct CT signs that may be seen in cases of chronic PE.15,16,19-23 It may appear as a complete occlusion of a vessel that is smaller than adjacent patent vessels or as the abrupt cutoff of small arteries (Figure 8). Figure 9 presents an illustration of peripheral intraluminal defects that form obtuse angles with the vessel wall. Thickened irregular small arteries may be seen because of recanalization with or without calcification. Dilated collateral vessels, such as the bronchial or internal mammary arteries (Figure 8), may also indicate chronic PE. Indirect signs may be seen, such as an enlarged central pulmonary artery with narrowing of peripheral arteries (Figure 10A), mosaic perfusion (Figure 10B), right heart enlargement with wall thickening, and bronchial dilatation. In our experience, compared with CT findings in larger vessels, webs and flaps are difficult to visualize in subsegmental arteries.
CT limitations
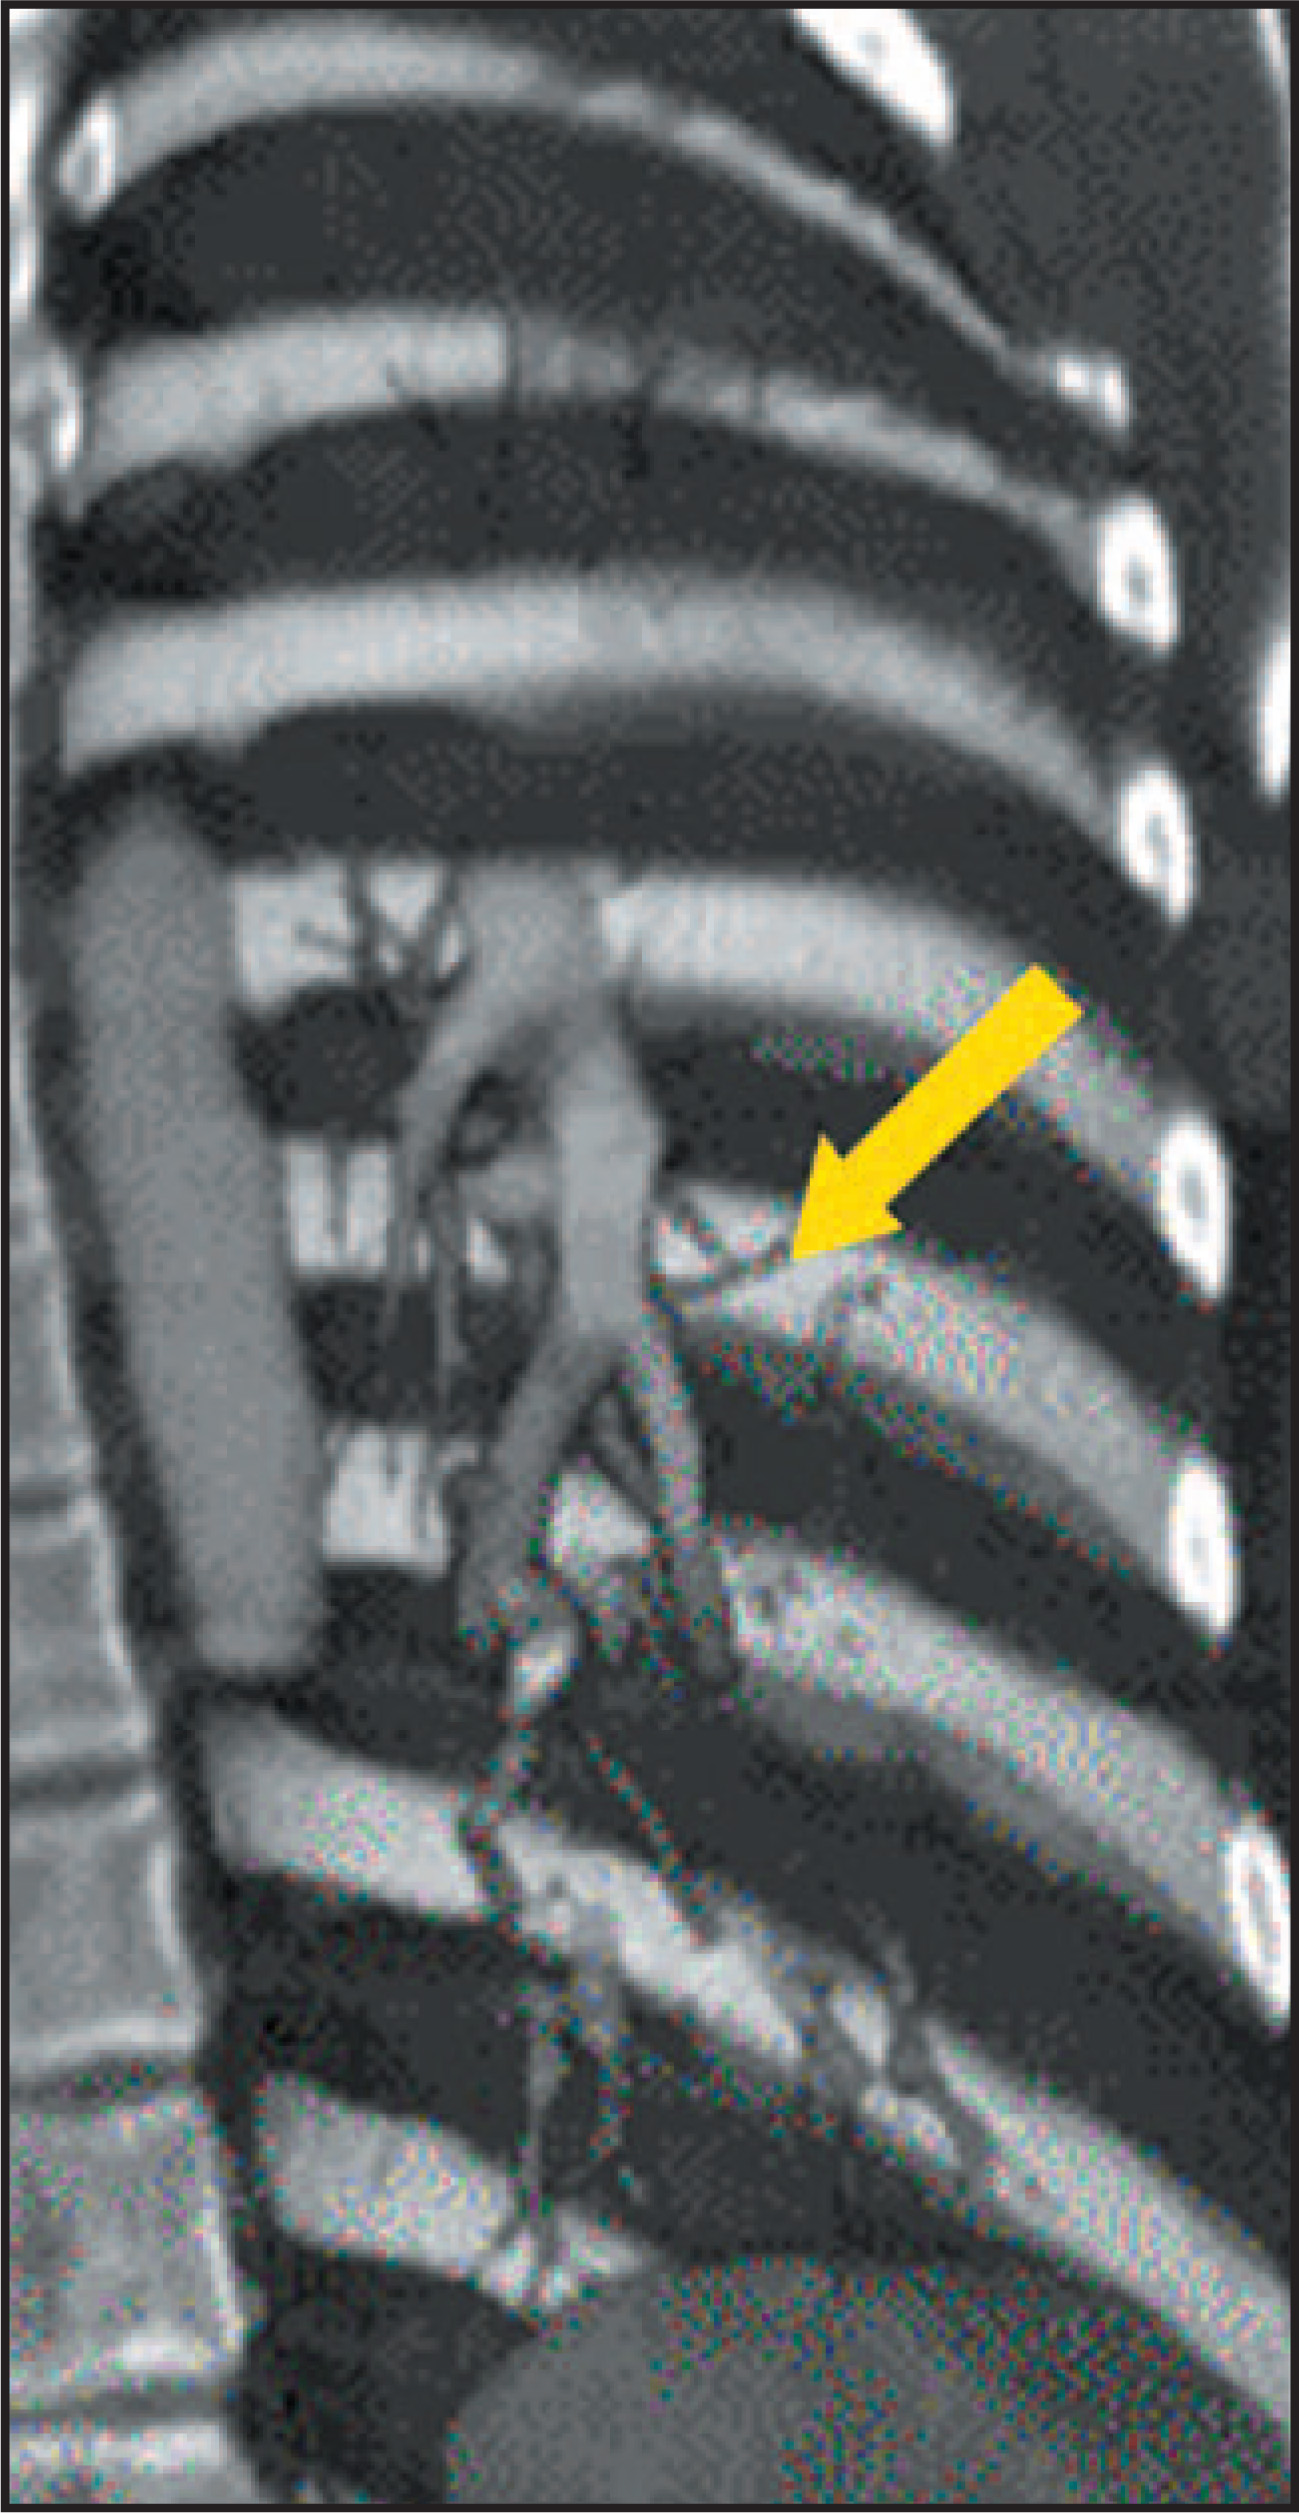
In some patients, an MDCT study may be contraindicated because of the lack of available venous access, renal failure, or contrast allergy. Also, artifacts and mimics should be identified to prevent misdiagnosis (Table 2). Respiratory motion is the most common cause of artifacts in MDCT PE studies. Such artifacts are best recognized on lung window settings as the blurring of vessels and rapid change in the position of vessels on contiguous images (Figure 11). With faster imaging in MDCT, motion artifacts are less problematic.
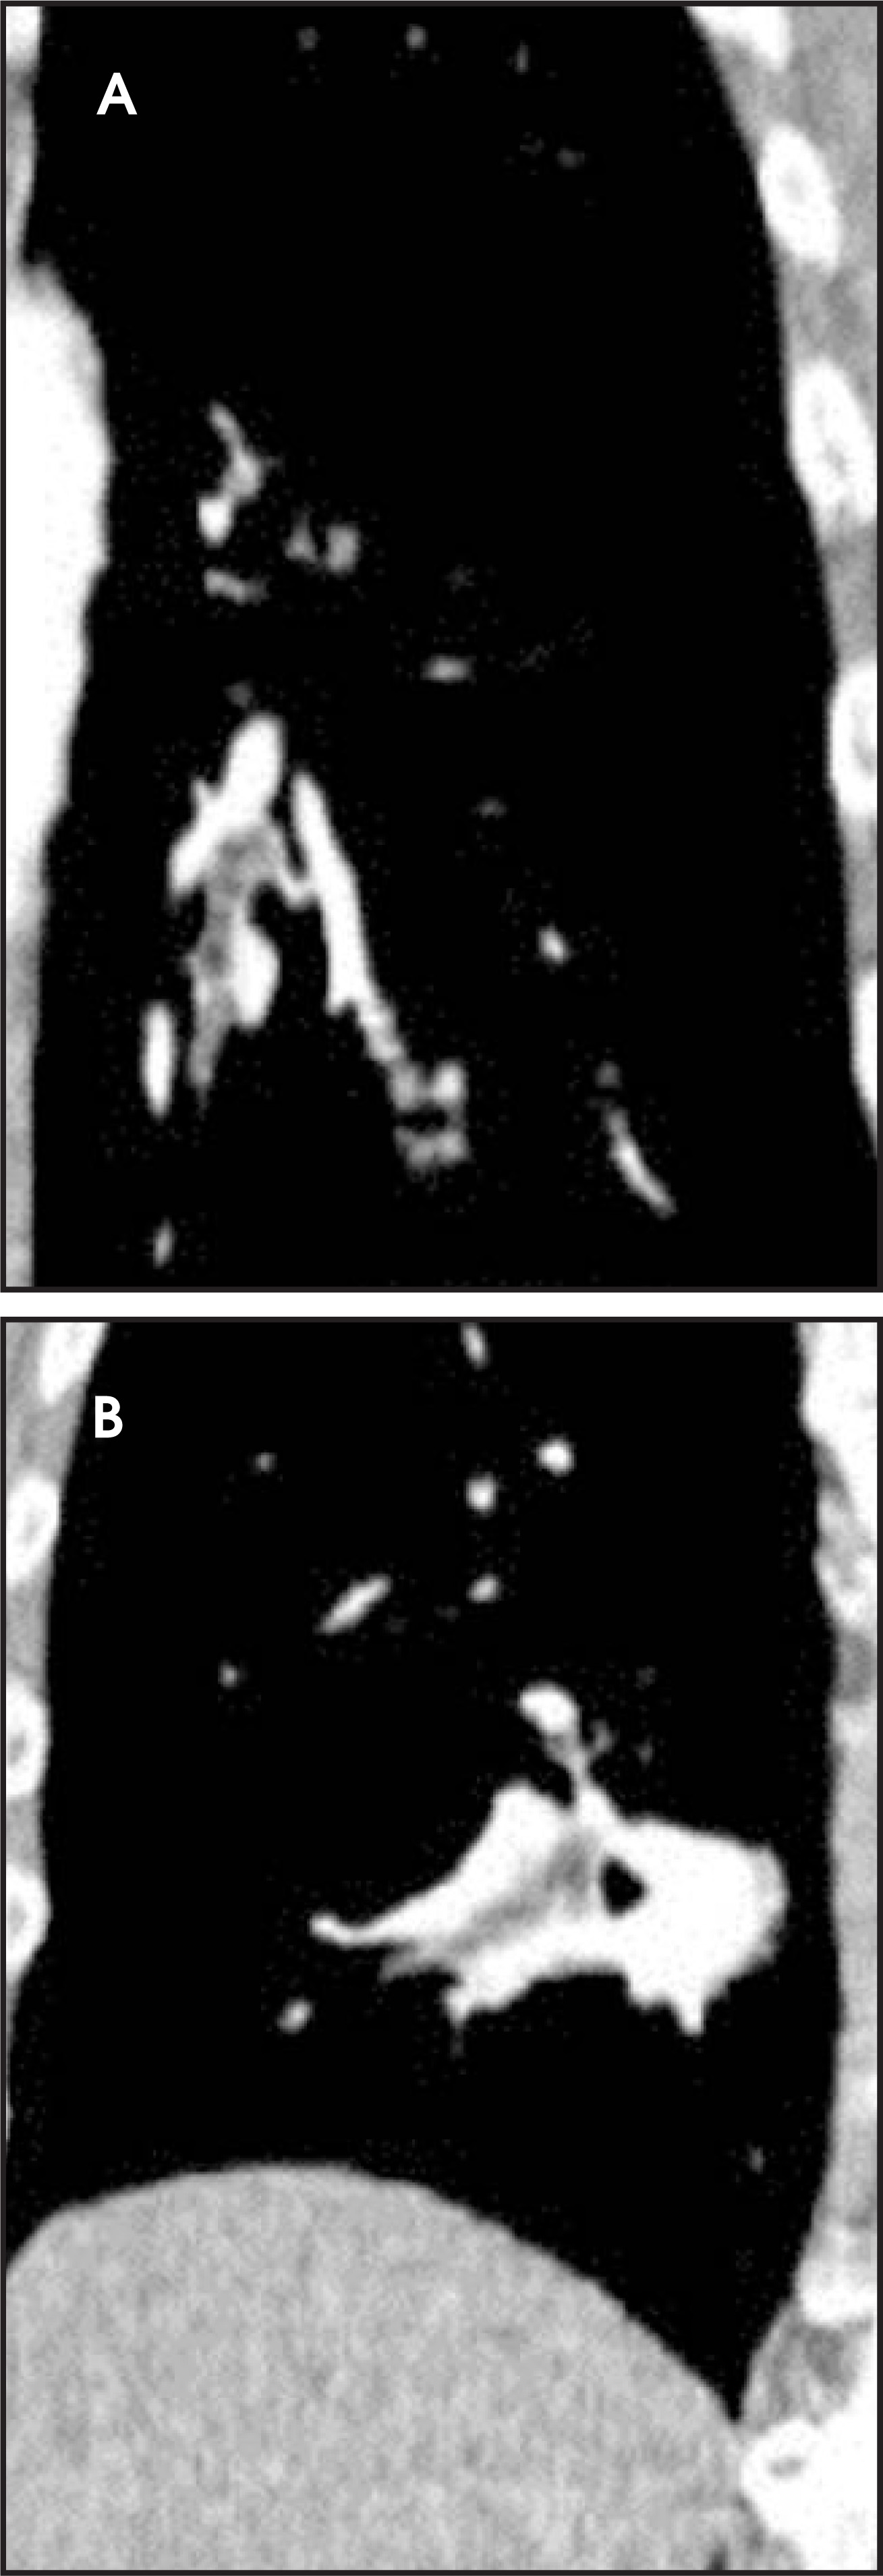
Imaging in large patients is frequently limited by excessive quantum mottle, which leads to image noise (Figure 12). The protocol can be modified by increasing detector width and kVp. However, this increased detector width also decreases sensitivity for the detection of PE caused by decreased spatial resolution. Lower lobe flow-related artifacts caused by admixture of blood and contrast material can result in poor vessel opacification at segmental and subsegmental levels (Figure 13A). A flow-related artifact can be confidently diagnosed by identifying its ill-defined margins.15,16 This may become pronounced in cases of suboptimal timing of contrast bolus or sluggish flow resulting from underlying vascular congestion, such as in cases of congestive cardiac failure.
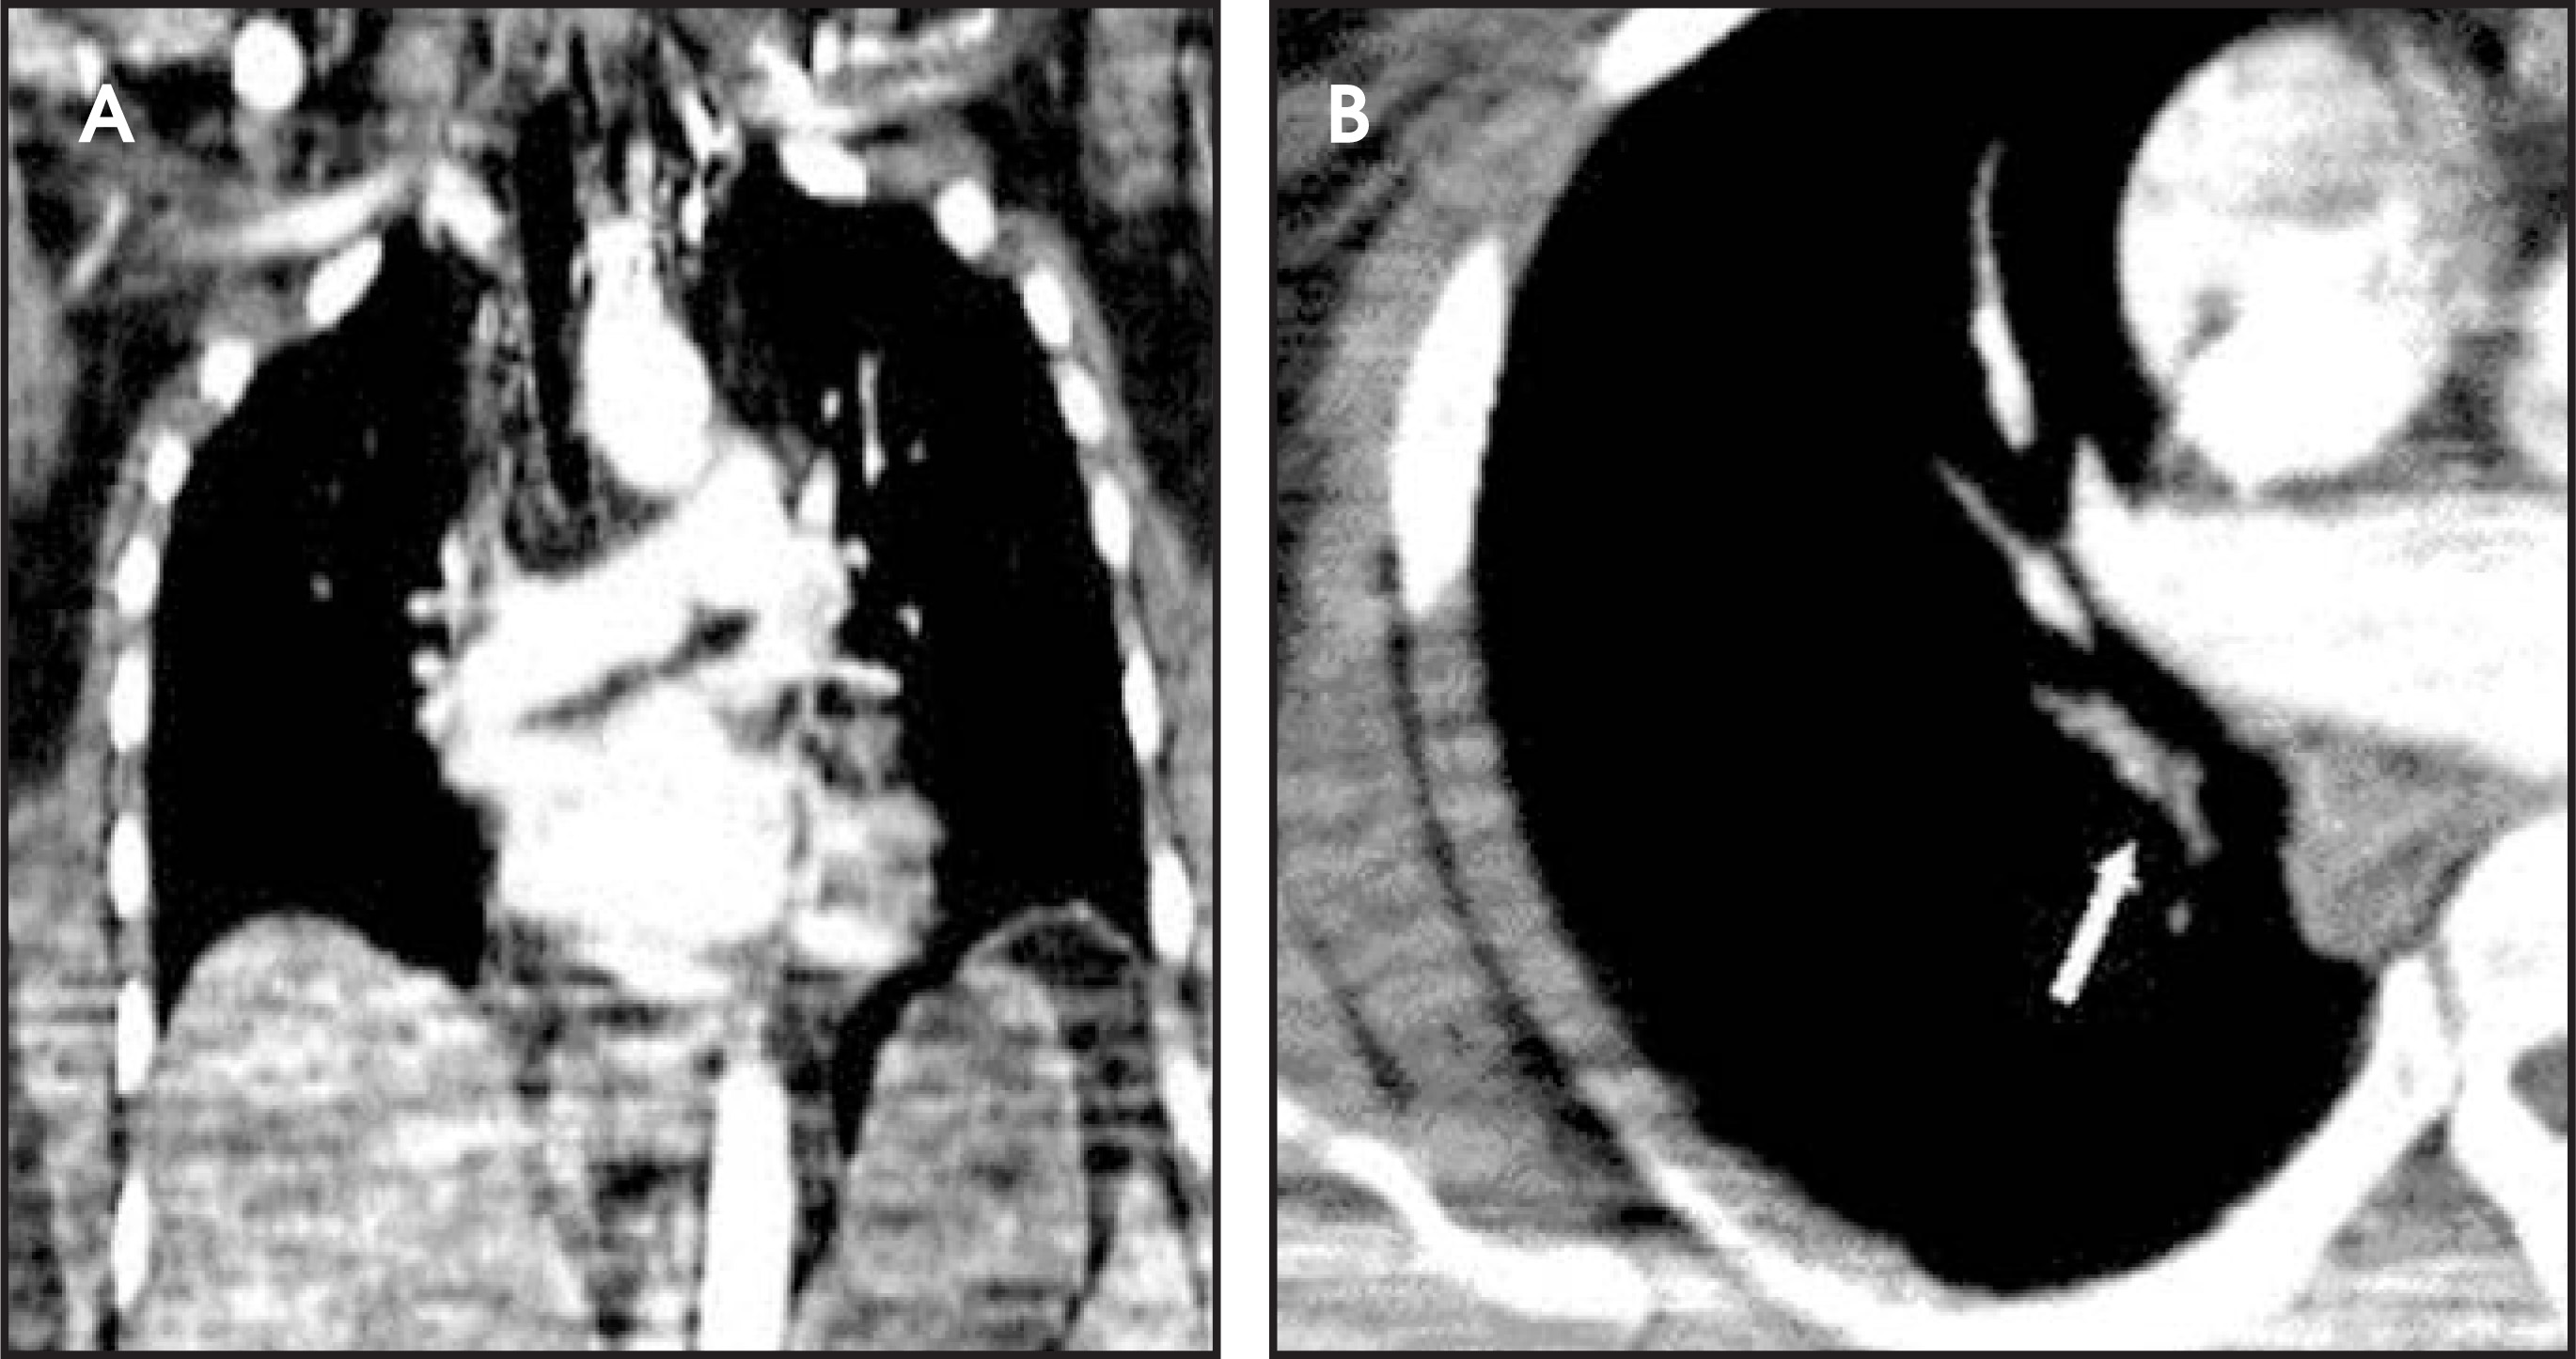
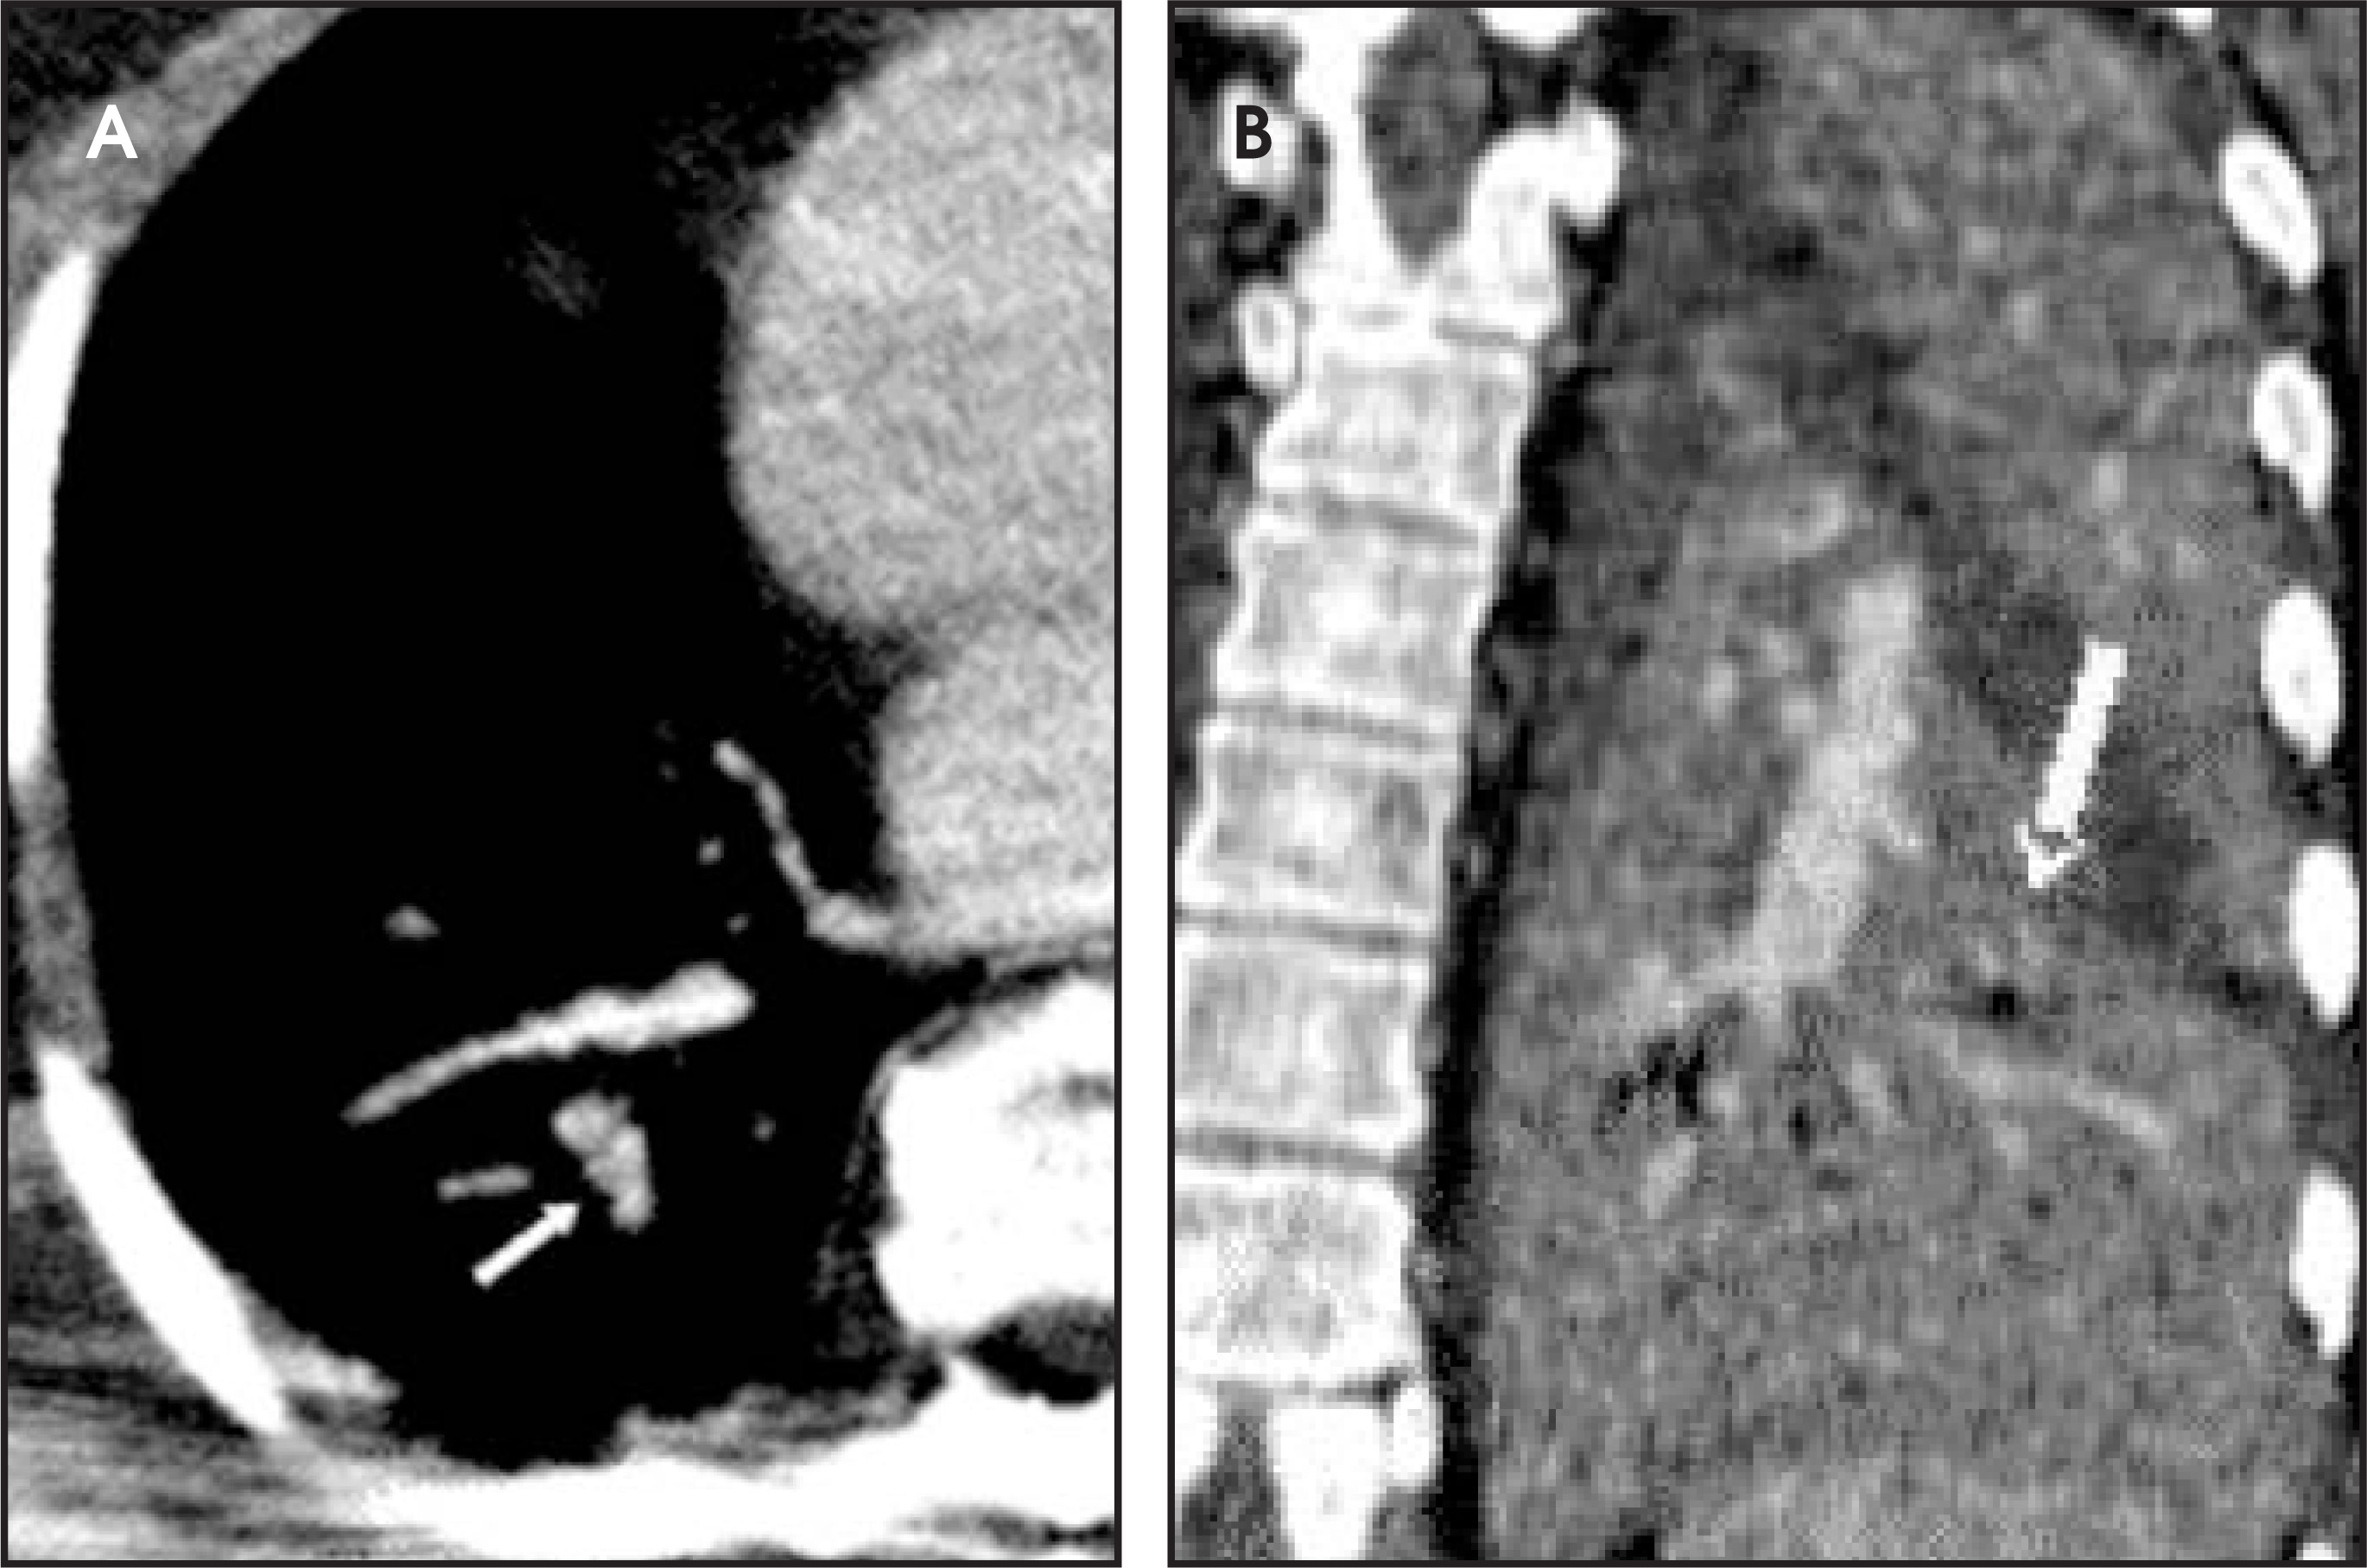
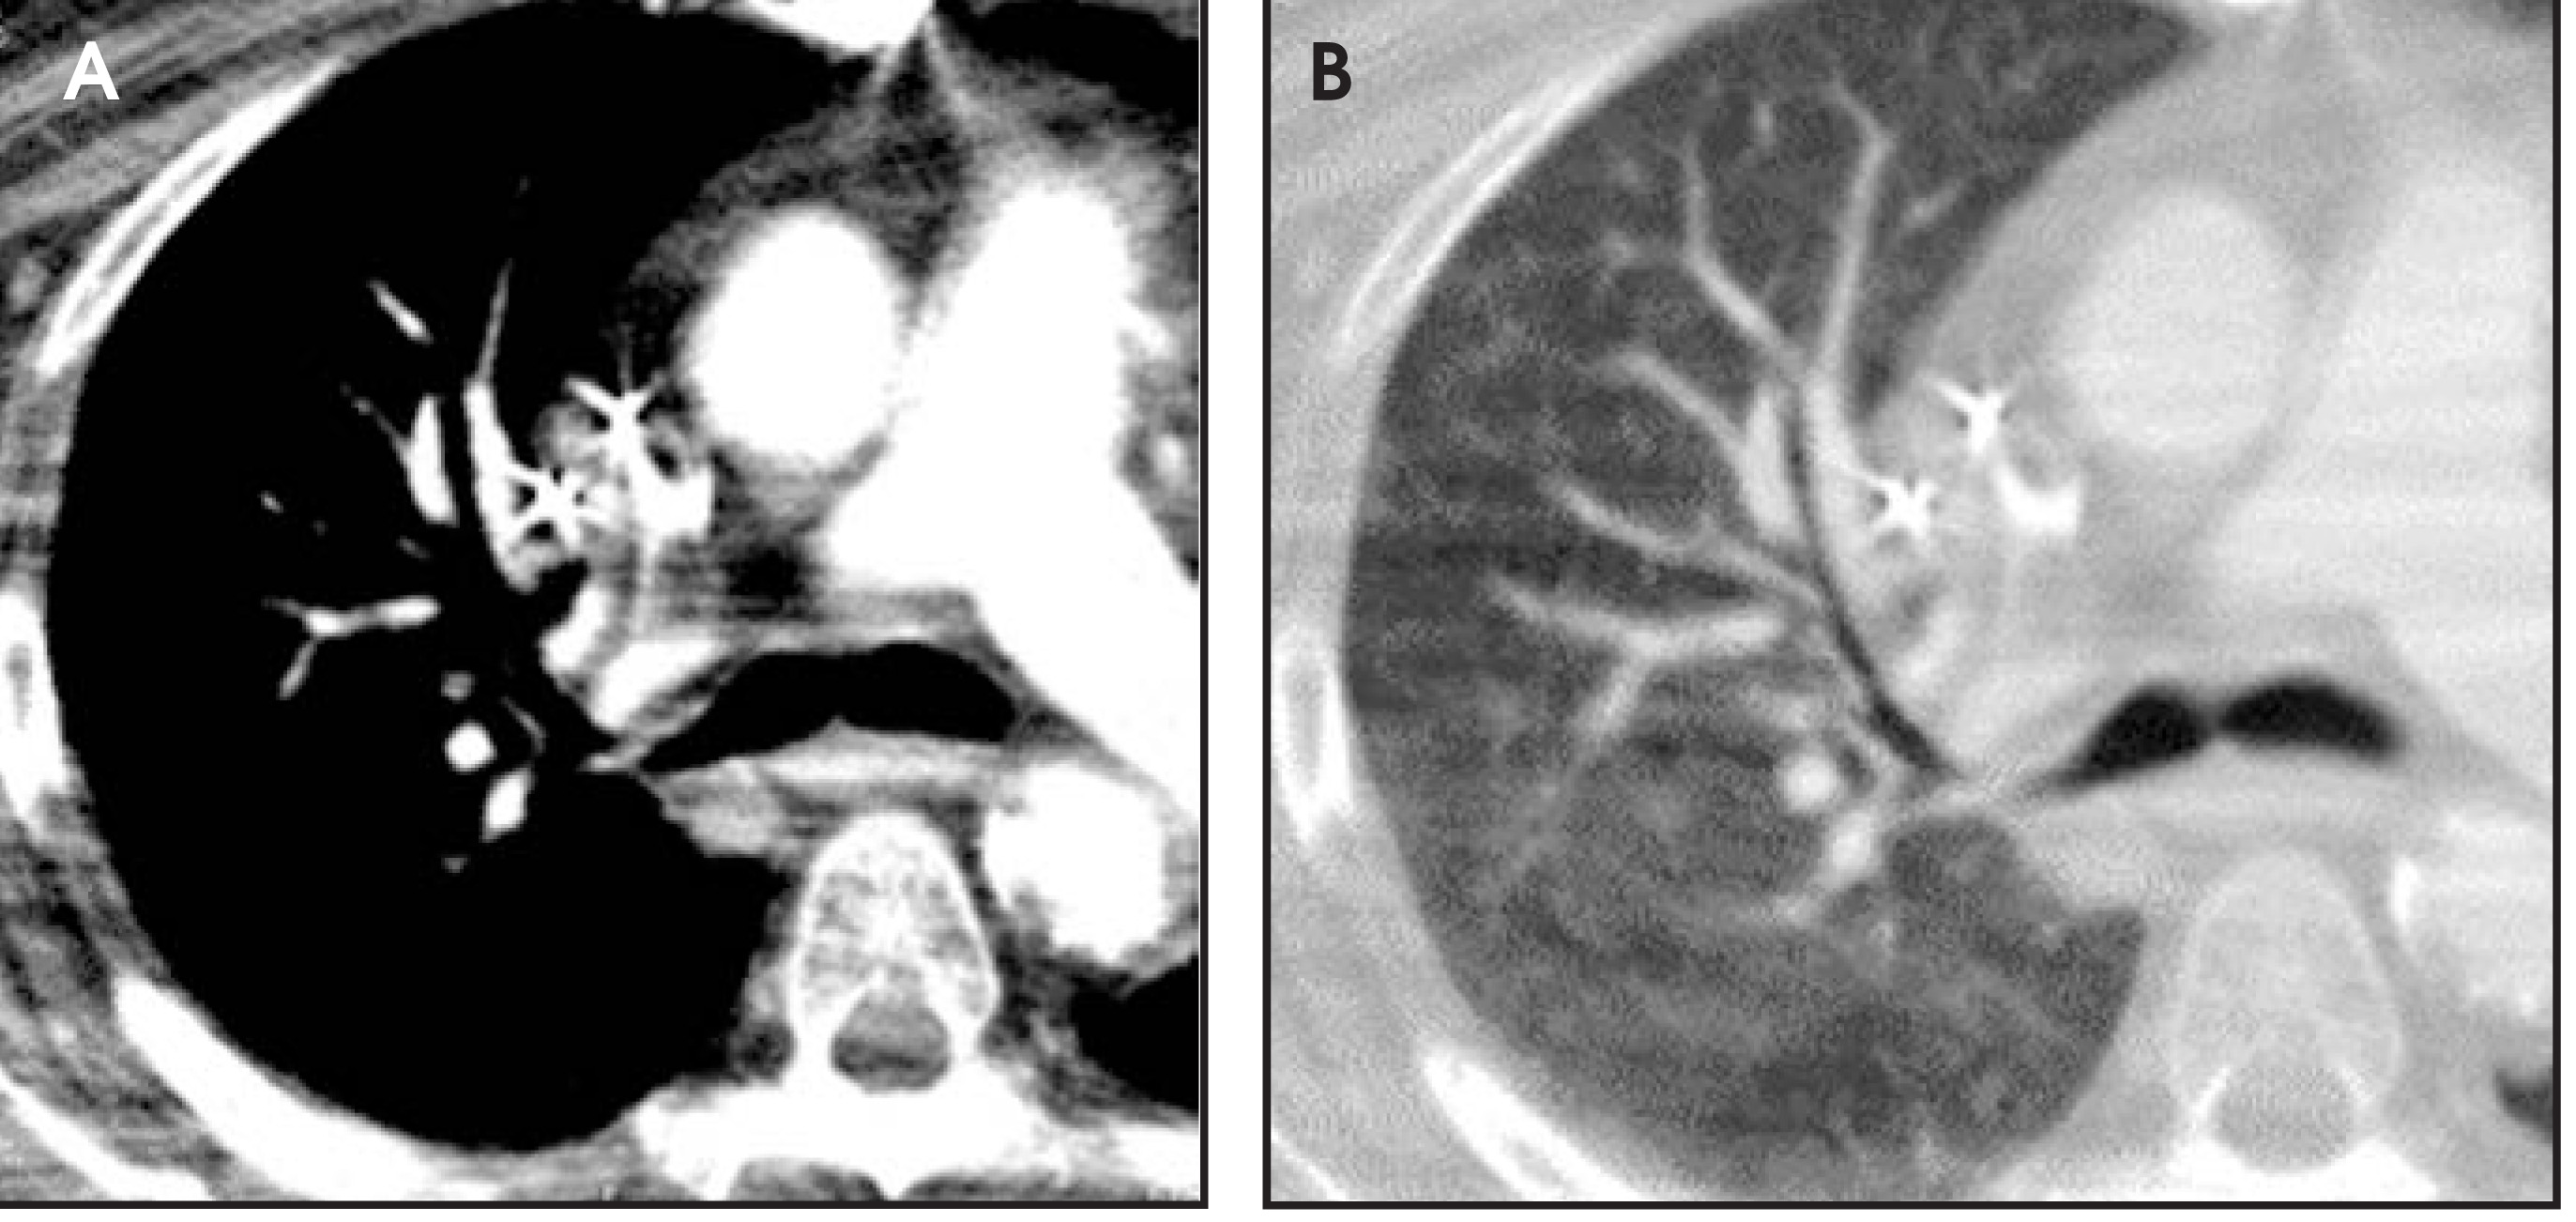
Peripheral increase in vascular resistance can be caused by underlying lung consolidation, atelectasis, or peripheral bronchiolar obstruction.16 The poorly enhanced blood within the affected vessel may mimic PE (Figure 13B). A repeat CT with an increased delay time may be required to clarify the inconclusive findings. Mucus-filled bronchi may show peripheral wall enhancement related to inflammation and can mimic acute PE (Figure 14). The true nature of the artifact may be determined by identifying the normally enhancing accompanying pulmonary artery or viewing the bronchus on contiguous images.24
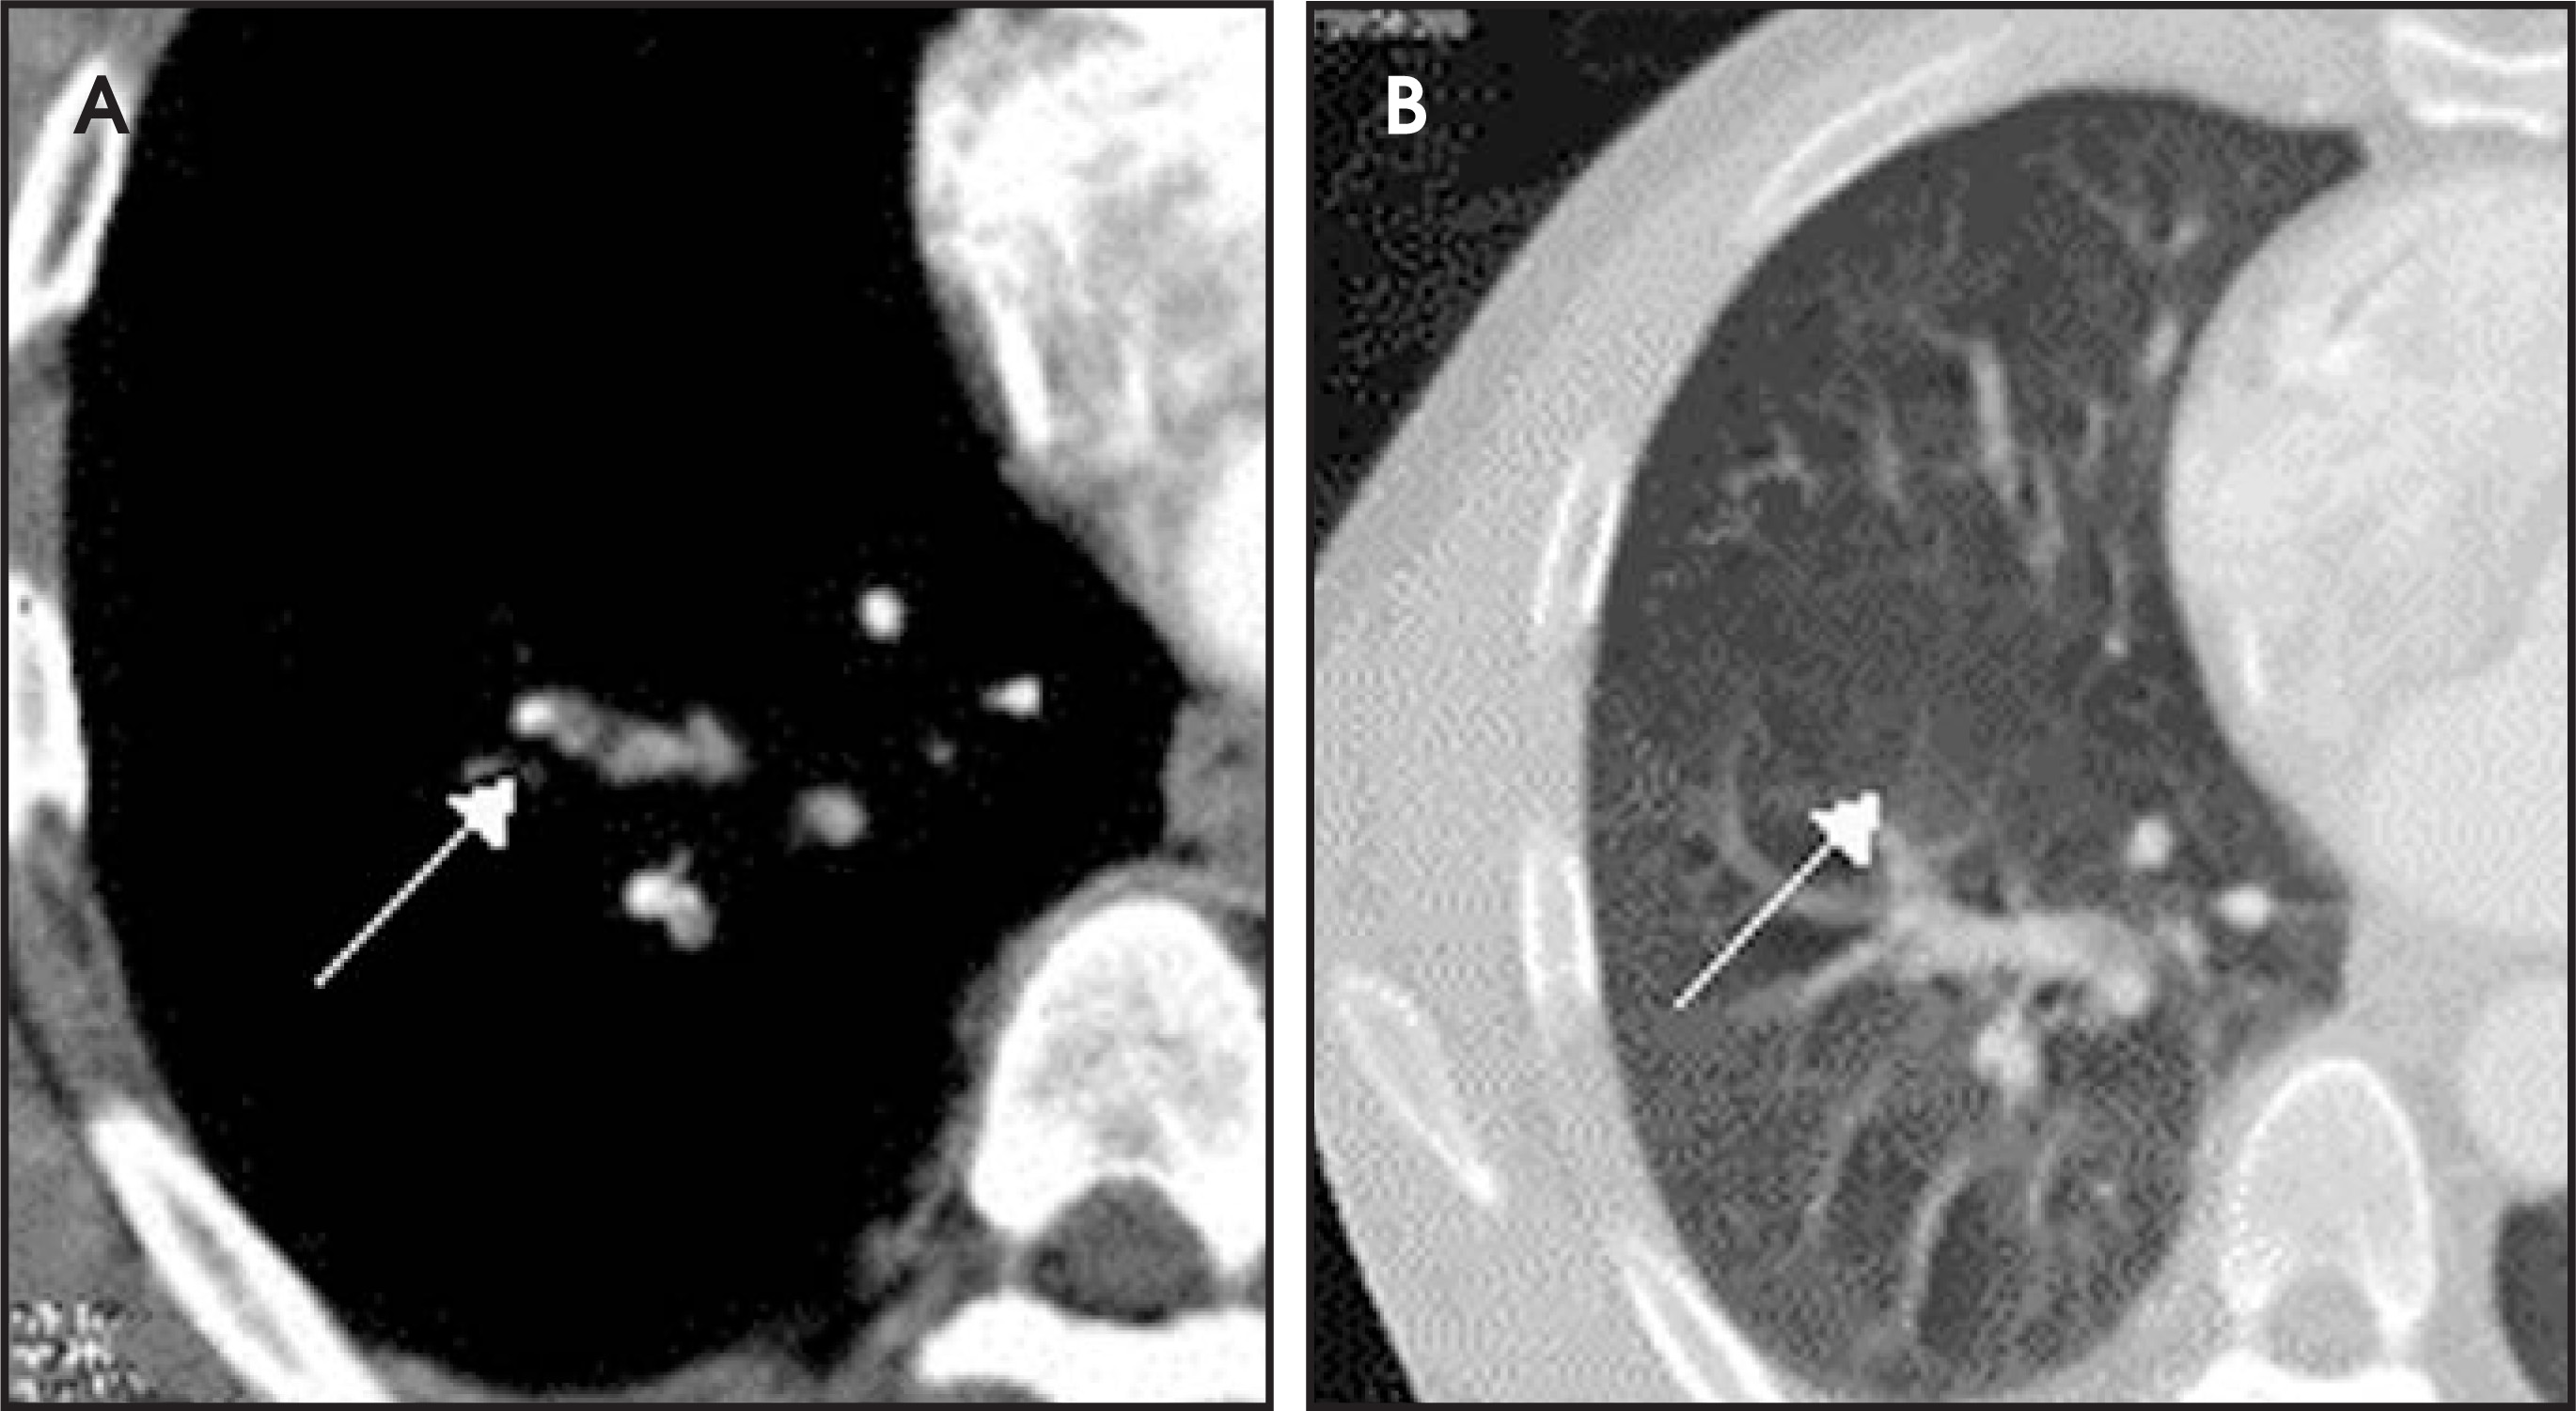
Edema caused by congestive heart failure can produce perivascular interstitial thickening, which mimics chronic pulmonary embolism. Other CT signs of heart failure (including ground-glass attenuation, diffuse interlobular septal thickening, third spacing of fluid, and bilateral pleural effusions) help in diagnosis. With a 1.25-mm detector width, there is a reduction in partial volume averaging of lymphatic tissue and vessel that can simulate PE. Lymph nodes can be easily distinguished from PE by their extramural location and the normal smooth contour of the contrast-enhanced vessel.16,24 Multiplanar reformatted images also help in difficult cases. As the images are obtained in the early arterial phase, spurious filling defects may be seen within the pulmonary veins. Pulmonary arteries are accompanied by bronchi, whereas pulmonary veins run separately within interlobular septa. In addition, pulmonary veins may be followed se-quentially to the left atrium (Figure 15).
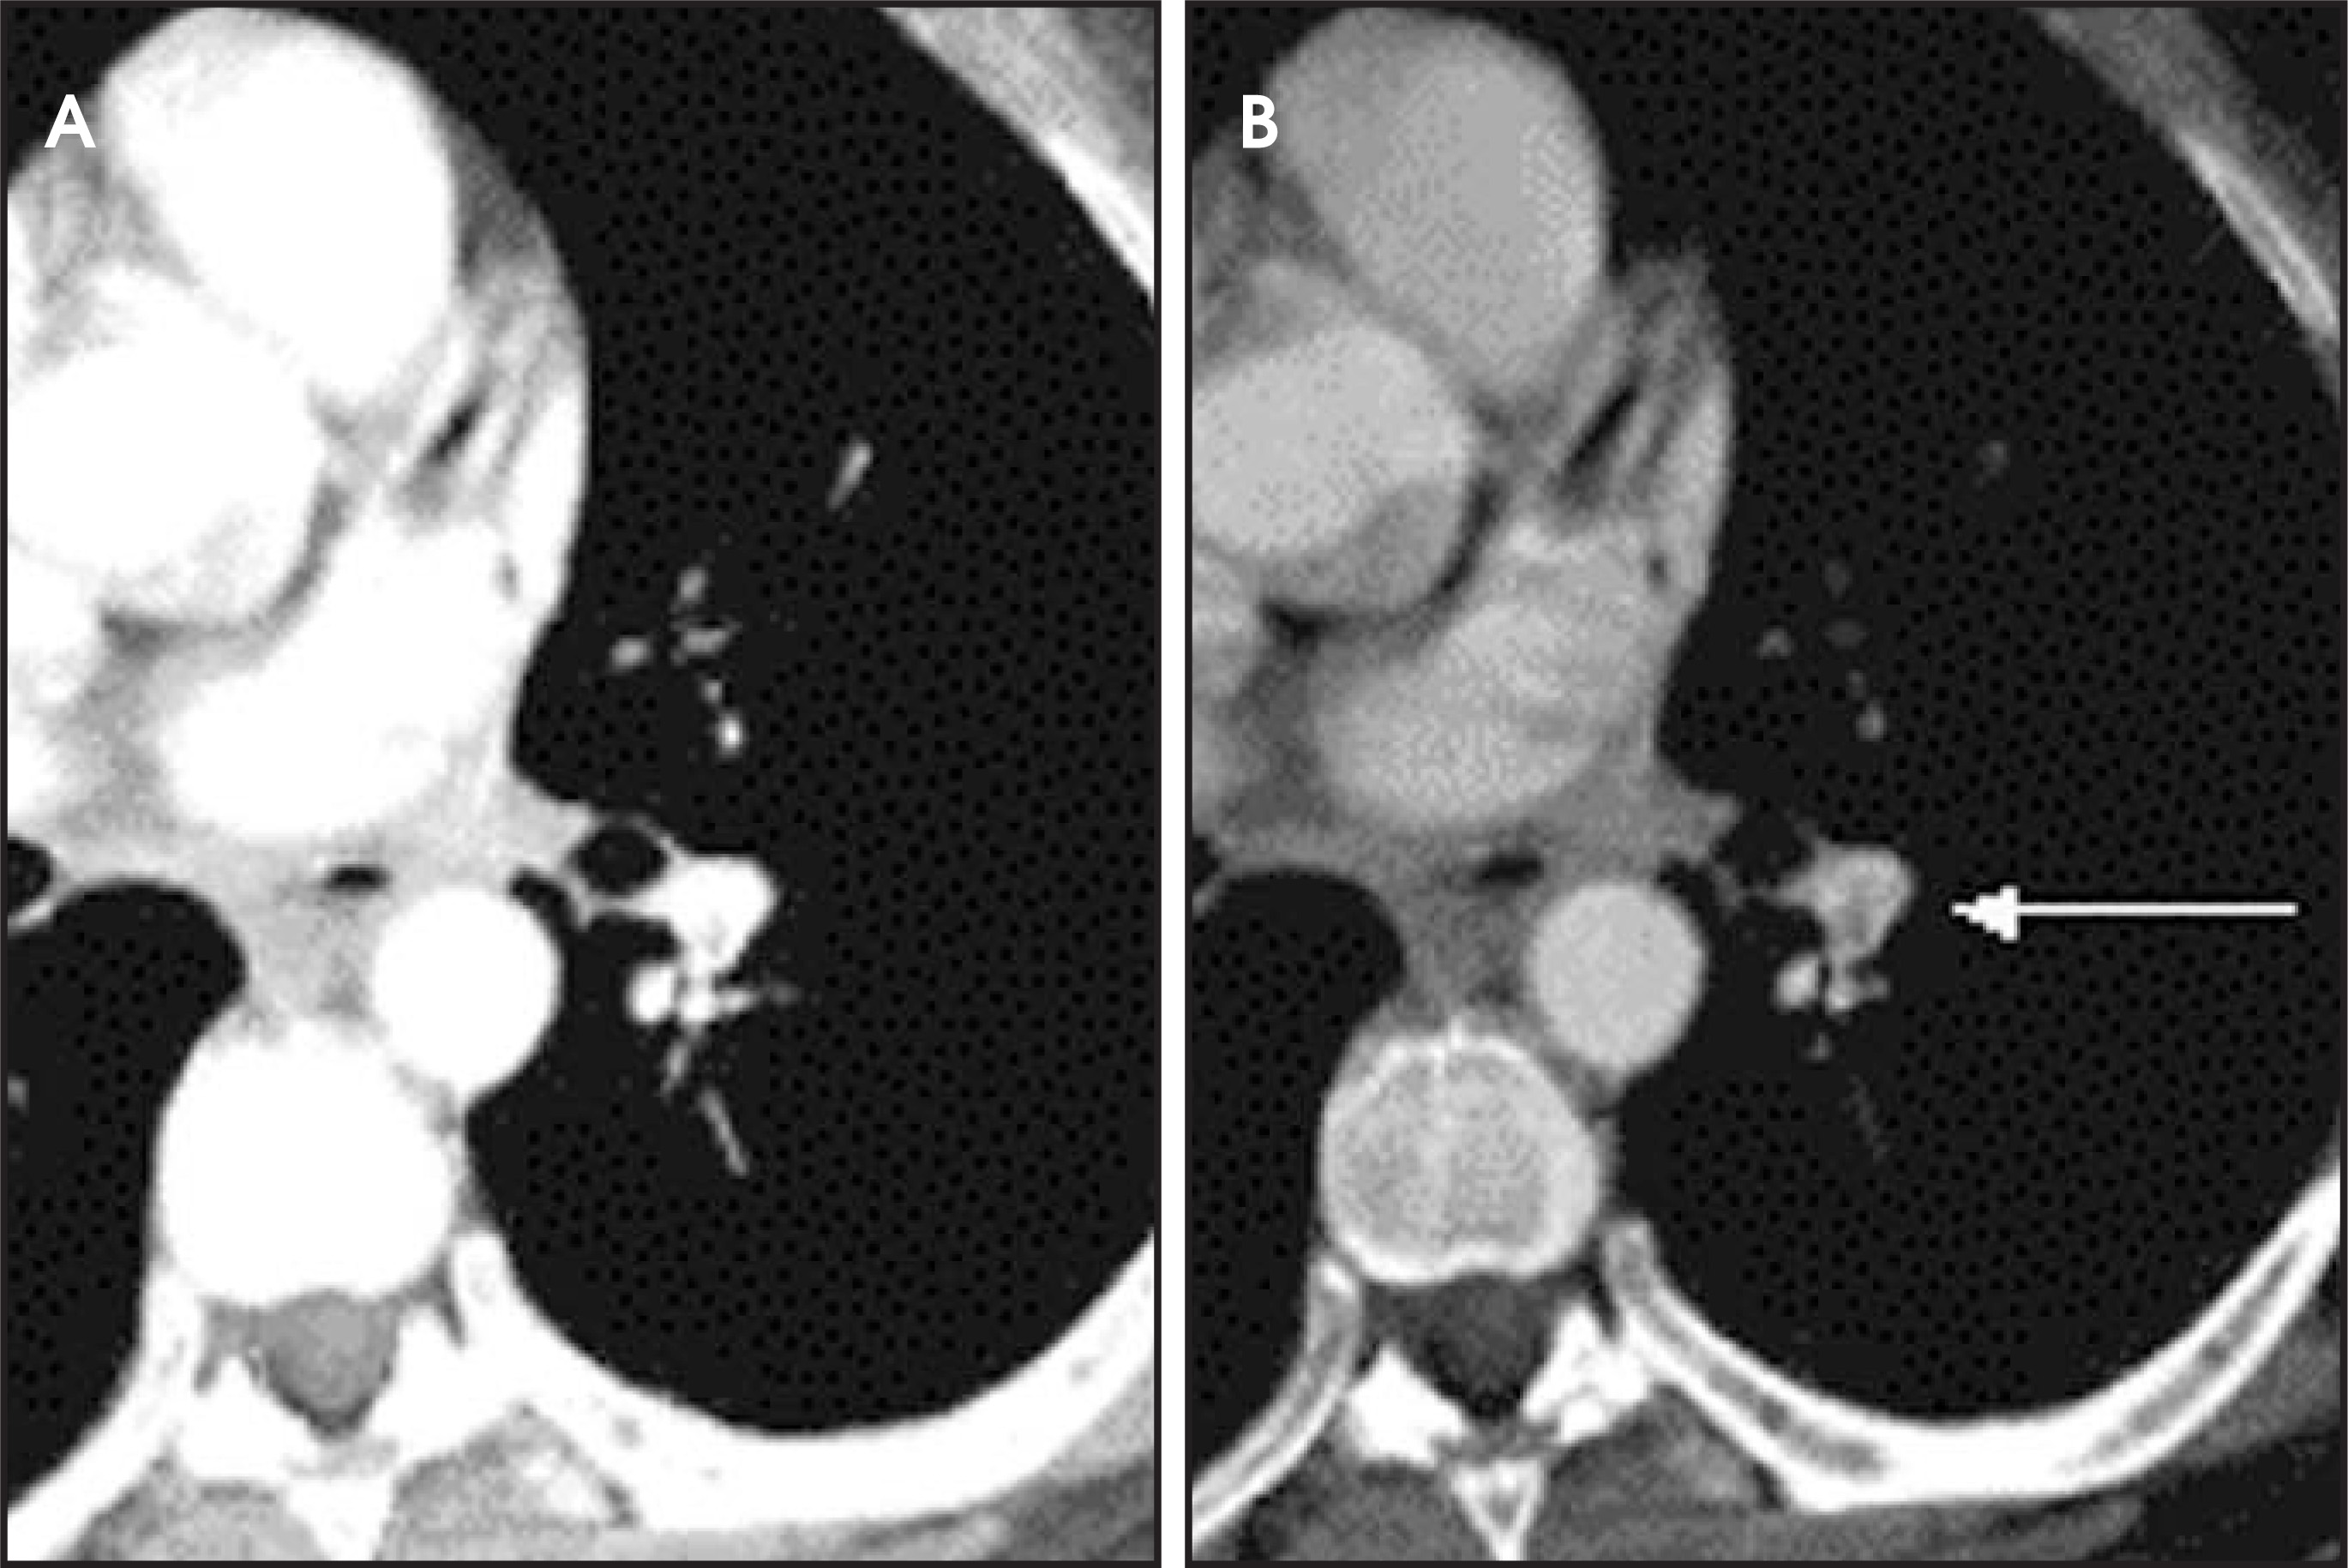
The appropriate window width and level settings are important for identifying small emboli, webs, or flaps. Pulmonary-embolism–specific or bone windows are helpful, especially near the hila, as very bright vessel contrast can obscure small PE (Figure 16). Partial volume artifacts may result in an apparent filling defect that mimics acute PE. A stairstep artifact consists of parallel lines on reformatted images and is accentuated by cardiac and respiratory motion. These artifacts are less apparent with overlapping reconstructions on MDCT.
Conclusion
The advent of multidetector row spiral CT has greatly expanded our diagnostic capabilities in patients who are suspected of having PE. Multidetector CT is an ex-citing modality for the diagnosis of small segmental and subsegmental PE. When evaluating small intravascular filling defects, radiologists must be familiar with relevant CT artifacts and imaging pitfalls to prevent misdiagnosis.
References
- Lette J, Cerino M, Eybalin M, Levasseur A. Prevalence and clinical significance of solitary pulmonary sub-segmental microembolism. Nucl Med Rev Cent East Eur. 2004;7(1):39-42.
- Oser R, Zuckerman D, Gutierrez F, Brink J. Anatomic distribution of pulmonary emboli at pulmonary angiography: Implications for cross-sectional imaging. Radiology Radiology.
- Value of the ventilation/ perfusion scan in acute pulmonary embolism. Results of the prospective investigation of pulmonary embolism diagnosis (PIOPED). JAMA. 1990;263:2753-2759.
- Chartrand-Lefebvre C, Howarth N, Lucidarme O. Contrast enhanced helical CT for pulmonary embolism detection: Inter- and intraobserver agreement among radiologists with variable experience. Am J Roentgenol. 1999;172:107-112.
- van Rossum A, Pattynama P. Pulmonary embolism. Validation of spiral CT angiography in 149 patients. Radiology. 1996;201:467-470.
- Gruden J, Tigges S, Baron M, Pearlman H. MDCT pulmonary angiography: Image processing tools. Semin Roentgenol. 2005;40:48-63.
- Schoepf U, Holzknecht N, Helmberger T. Subsegmental pulmonary emboli: Improved detection with thin-collimation multi-detector row spiral CT. Radiology. 2002;222:483-490.
- Ghaye B, Szapiro D, Mastora I. Peripheral pulmonary arteries: How far in the lung does multi-detector row spiral CT allow analysis?. Radiology. 2001;219:629-636.
- Filipek M, Gosselin M. Multidetector pulmonary CT angiography: Advances in the evaluation of pulmonary arterial diseases. Semin Ultrasound CT MR. 2004;25:83-98.
- Schoellnast H, Deutschmann H, Fritz G. MDCT angiography of the pulmonary arteries: Influence of iodine flow concentration on vessel attenuation and visualization. AJR Am J Roentgenol. 2005;184:1935-1939.
- Cademartiri F, Nieman K, van der Lugt A. Intravenous contrast material administration at 16-detector row helical CT coronary angiography: Test bolus versus bolus-tracking technique. Radiology Radiology.
- Bedard J, Blais C, Patenaude Y, Monga E. Pulmonary embolism: Prospective comparison of iso-osmolar and low-osmolarity nonionic contrast agents for contrast enhancement at CT angiography. Radiology. 2005;234:929-933.
- Remy-Jardin M, Remy J, Cauvain O. Diagnosis of central pulmonary embolism with helical CT: Role of two-dimensional multiplanar reformations. AJR Am J Roentgenol. 1995;165:1131-1138.
- Marten K, Funke M, Obenauer S. The contribution of different postprocessing methods for multislice spiral CT in acute pulmonary embolism [in German]. Rofo. 2003;175(5):635-639.
- Wittram C, Maher M, Yoo A. CT angiography of pulmonary embolism: Diagnostic criteria and causes of misdiagnosis. RadioGraphics. 2004;24:1219-1238.
- Remy-Jardin M, Remy J, Artaud D. Spiral CT of pulmonary embolism: Diagnostic approach, interpretive pitfalls and current indications. Eur Radiol. 1998;8:1376-1390.
- Storto M, Di Credico A, Guido F. Incidental detection of pulmonary emboli on routine MDCT of the chest. AJR Am J Roentgenol. 2005;184:264-267.
- Pech M, Wieners G, Lopez-Hanninen E. The diagnostic value of radial multiplanar reformatting (MPR) in the CT-diagnosis of pulmonary embolism [in German]. Rofo. 2004;176:1576-1581.
- Sukhija R, Aronow W, Yalamanchili K. Association of right ventricular dilatation with bilateral pulmonary embolism, pulmonary embolism in a main pulmonary artery and lobar, segmental and subsegmental pulmonary embolism in 190 patients with acute pulmonary embolism. Cardiology. 2005;103:156-157.
- Washington L, Goodman L, Gonyo M. CT for thromboembolic disease. Radiol Clin North Am. 2002;40:751-771.
- Hasegawa I, Boiselle P, Hatabu H. Bronchial artery dilatation on MDCT scans of patients with acute pulmonary embolism: Comparison with chronic or re-current pulmonary embolism. AJR Am J Roentgenol. 2004;182:67-72.
- Contractor S, Maldjian P, Sharma V, Gor D. Role of helical CT in detecting right ventricular dysfunction secondary to acute pulmonary embolism. J Comput Assist Tomogr. 2002;26:587-591.
- Arakawa H, Stern E, Nakamoto T. Chronic pulmonary thromboembolism. Air trapping on computed tomography and correlation with pulmonary function tests. J Comput Assist Tomogr. 2003;27:735-742.
- Gotway M, Patel R, Webb W. Helical CT for the evaluation of suspected acute pulmonary embolism: Diagnostic pitfalls. J Comput Assist Tomogr. 2000;24:267-273.
Citation
. Pulmonary embolism in segmental and subsegmental arteries: Optimal technique, imaging appearances, and potential pitfalls in multidetector CT. Applied Radiology. 2007;36(2):34-40. doi:10.37549/AR1484.