Radiologic evaluation of the solitary pulmonary nodule
Applied Radiology — Vol. 33 , Issue 3 , pp. 13 -26
DOI: 10.37549/AR1227
Published: March 1, 2004
Categories
The solitary pulmonary nodule (SPN) is a common and often incidental radiologic abnormality. An estimated 130,000 new nodules are identified each year in the United States.1,2 Solitary pulmonary nodules are seen in 0.09% to 0.2% of chest radiographs.2 The presence of a pulmonary nodule raises questions and concerns both to the patient and the physician, as it may represent lung cancer or a solitary metastasis.
Most SPNs are benign; only 30% to 50% are malignant.3,4 Solitary pulmonary nodules can be the initial presentation of lung cancer in 20% to 30% of patients.5 Various series have shown that the 5-year survival rate after resection of a solitary bronchogenic carcinoma is 40% to 80%.6,7 Therefore, the detection of the nodule may be the first and only chance of cure in the patient with lung cancer. It is equally important to identify benign lesions correctly, so as to avoid the morbidity and mortality associated with thoracotomy. The goal of radiologic evaluation of the suspected nodule is to noninvasively and accurately differentiate benign from malignant lesions.
Definition
A solitary pulmonary lesion or a “coin” lesion has been defined as a single spherical intraparenchymal opacity, completely surrounded by lung without any associated atelectasis or adenopathy and ≤3 cm in maximum diameter8,9 (Figure 1). Solitary lesions ≤6 cm in size were previously included, but it is now recognized that lesions >3 cm (now termed masses) are almost always malignant.8 Hence, the current convention is that SPNs are ≤3 cm in diameter. Further, the detection of patterns of calcification in an SPN allows confident diagnosis of benignity only when the nodule is <3 cm in size.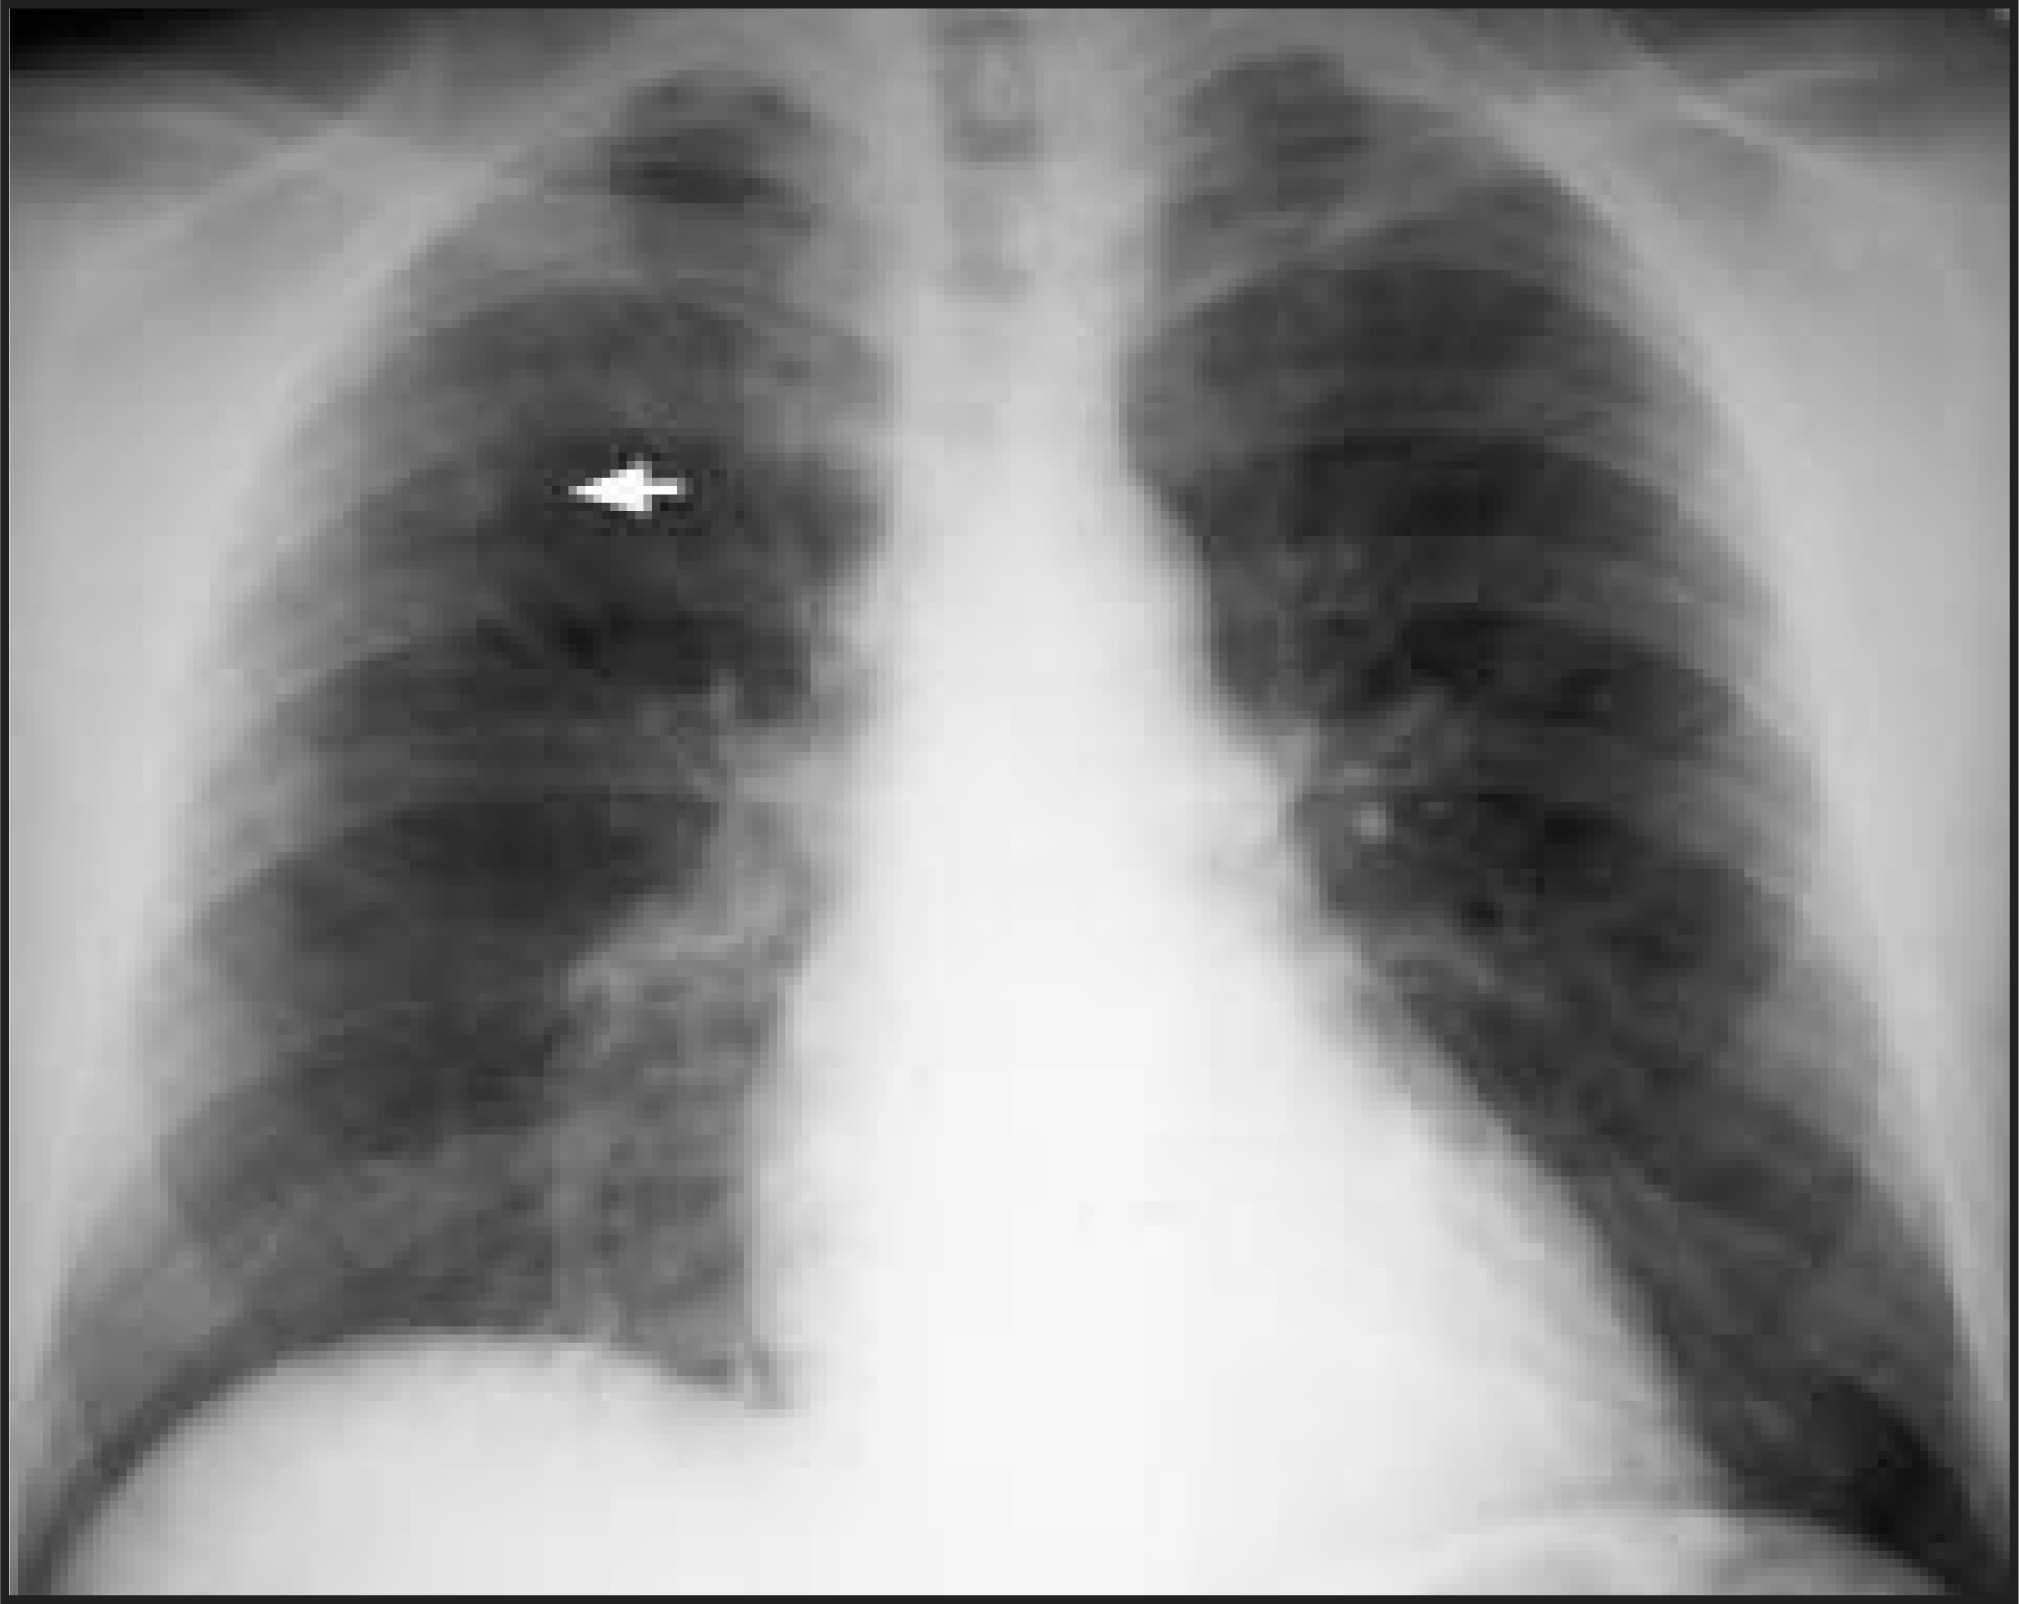
Etiology
The causes of an SPN comprise a variety of benign and malignant processes (Table 1). Of the benign lesions, 80% are caused by infectious granulomas, 10% by hamartomas, and the remaining 10% encompass other rarer disorders, including noninfectious granulomas and benign tumors.10,11
Most malignant SPNs are bronchogenic carcinomas. Metastases from extrapulmonary tumors constitute 10% to 30% of all malignant SPNs.8,11
Bayesian analysis
The Bayesian analysis has been used to determine the probability of malignancy (pCa) in a nodule. This method assigns a likelihood ratio (LR) for various clinical and radiological features associated with the SPN to estimate the pCa. Clinical factors that have been found to be associated with a high probability of malignancy include advanced age at presentation, smoking history, symptoms (especially hemoptysis), presence of previous malignancy, exposure to carcinogens, and coexisting or prior pulmonary diseases (especially emphysema).9,12,13
The most important radiographic characteristics to be considered for assigning an LR are: size, margin, contour, thickness of cavity wall, and pattern of calcification.
The LR for a given characteristic is derived as follows:
LR= No. of malignant nodules with the feature No. of benign nodules with the same feature
An LR of 1.0 indicates a 50% chance of malignancy. Likelihood ratios <1.0 indicate a benign lesion and LRs >1.0 typically indicate a malignant lesion. By combining the LRs for all the variables of a particular nodule, the odds of malignancy (Oddsca) is calculated as follows:
Odds ca = LR pm LR s LR sm LR e LR cal
where LRpm is LR prior malignancy, LRs is LR size, LRsm is LR smoker, LRe is LR edge, and LRcal is LR calcification.
The pCa is calculated as follows:
pCa = Odds ca 1 + Odds ca
The likelihood ratios for several clinical and radiographic variables have been calculated and can be found in standard references.13,14 A probability calculator using the Bayesian analysis to estimate the pCa for any SPN can be found on Dr. J. Gurney’s Web site at www.chestx-ray.com.
The Bayesian analysis has not gained widespread use because of the large number of variables to be considered, as well as the lack of standardization due to differences in local practice. Further, this approach was used before the advent of newer advanced imaging technology, such as contrast-enhanced and thin-section computed tomography (CT) and, recently, positron emission tomography (PET). Recent studies have shown that a PET scan used as a single test alone has the highest reliability in correctly classifying nodules as benign or malignant.12 This was found to be higher than Bayesian analysis using standard criteria.
Chest radiography
Chest radiography (CXR) is the primary initial imaging modality for most SPNs. The first step is to determine if the nodule is actually within the lung. Equally important is to determine if the lesion is new and to demonstrate any change in pre-existing lesions. In the evaluation of an SPN, it is extremely important to review prior CXRs for comparison. Stable appearance for 2 years is more suggestive of a benign lesion, while growth and interval development are more likely with a malignant condition8,13 (Figure 2).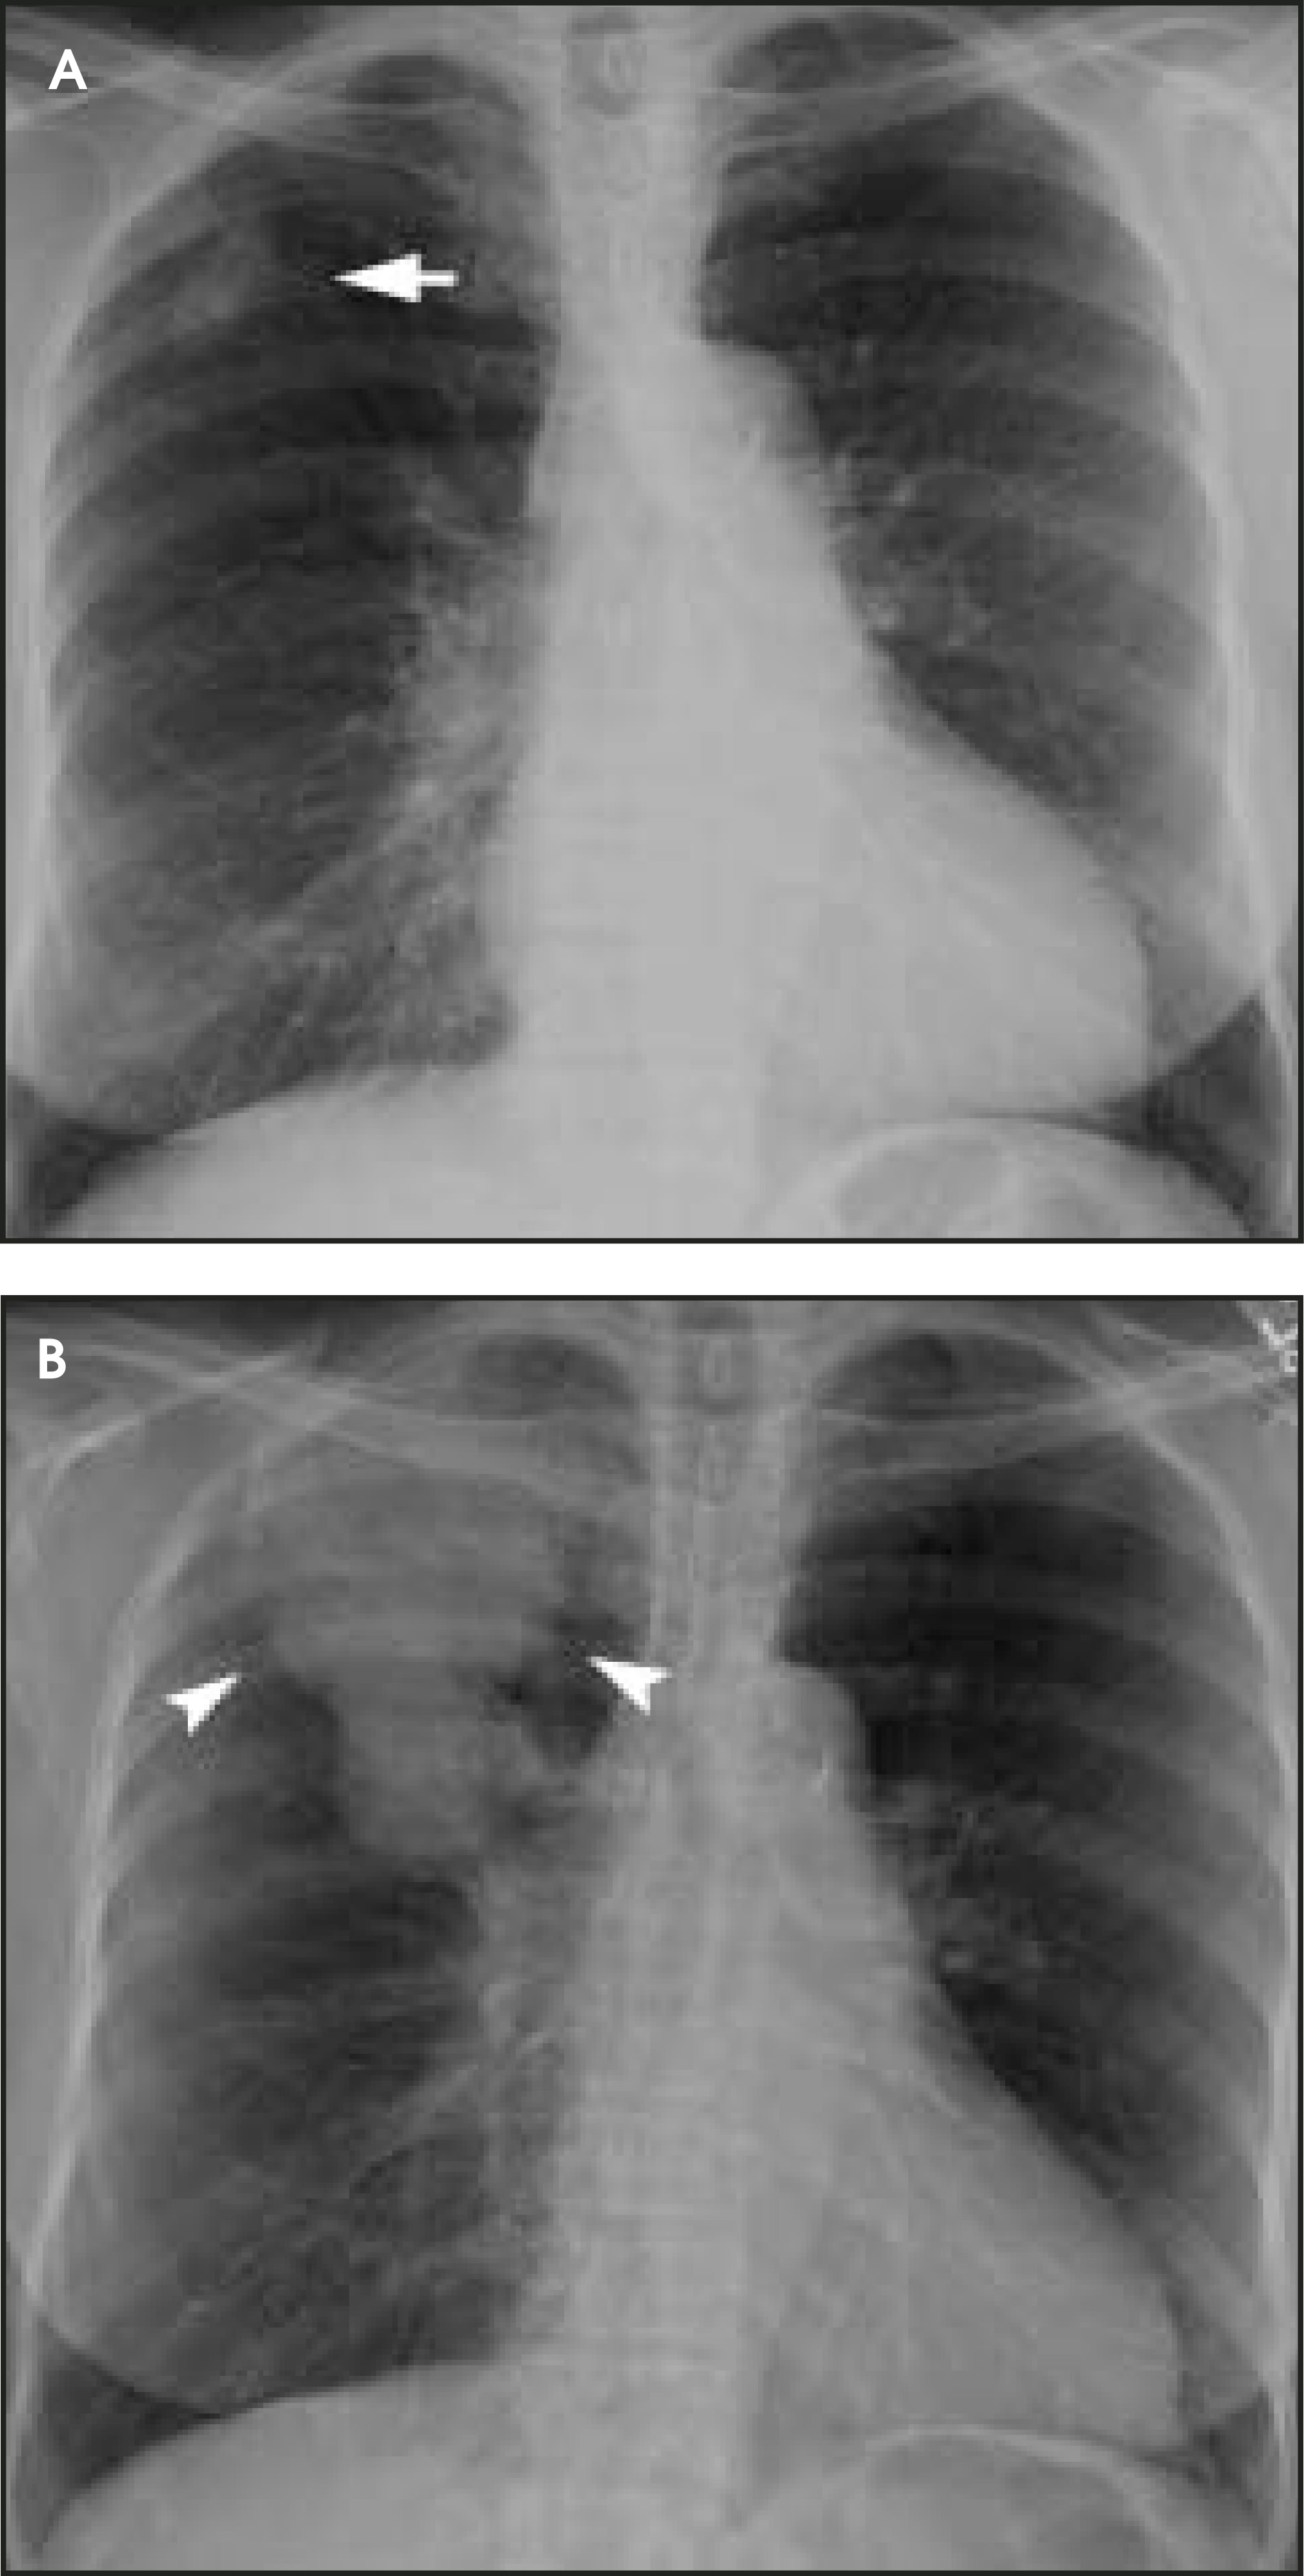
Chest radiographs provide useful information regarding nodule size, contour, margin characteristics, calcification, cavitation, presence of satellite lesions, and growth rate. Size <2 cm, smooth contour, sharp margins, presence of satellite lesions, absence of cavitation, and a slow or very fast doubling time (ie, the time taken for the nodule to double in volume, which results in a 25% increase in diameter for a spherical lesion) are associated with benign lesions.2,13,15 Most benign nodules have been shown to have smooth, well-defined margins, while only 21% of malignant nodules have been shown to have smooth margins.3 The corona radiata sign (fine linear strands extending away from the nodule) is associated with malignancy in 88%2 (Figure 3).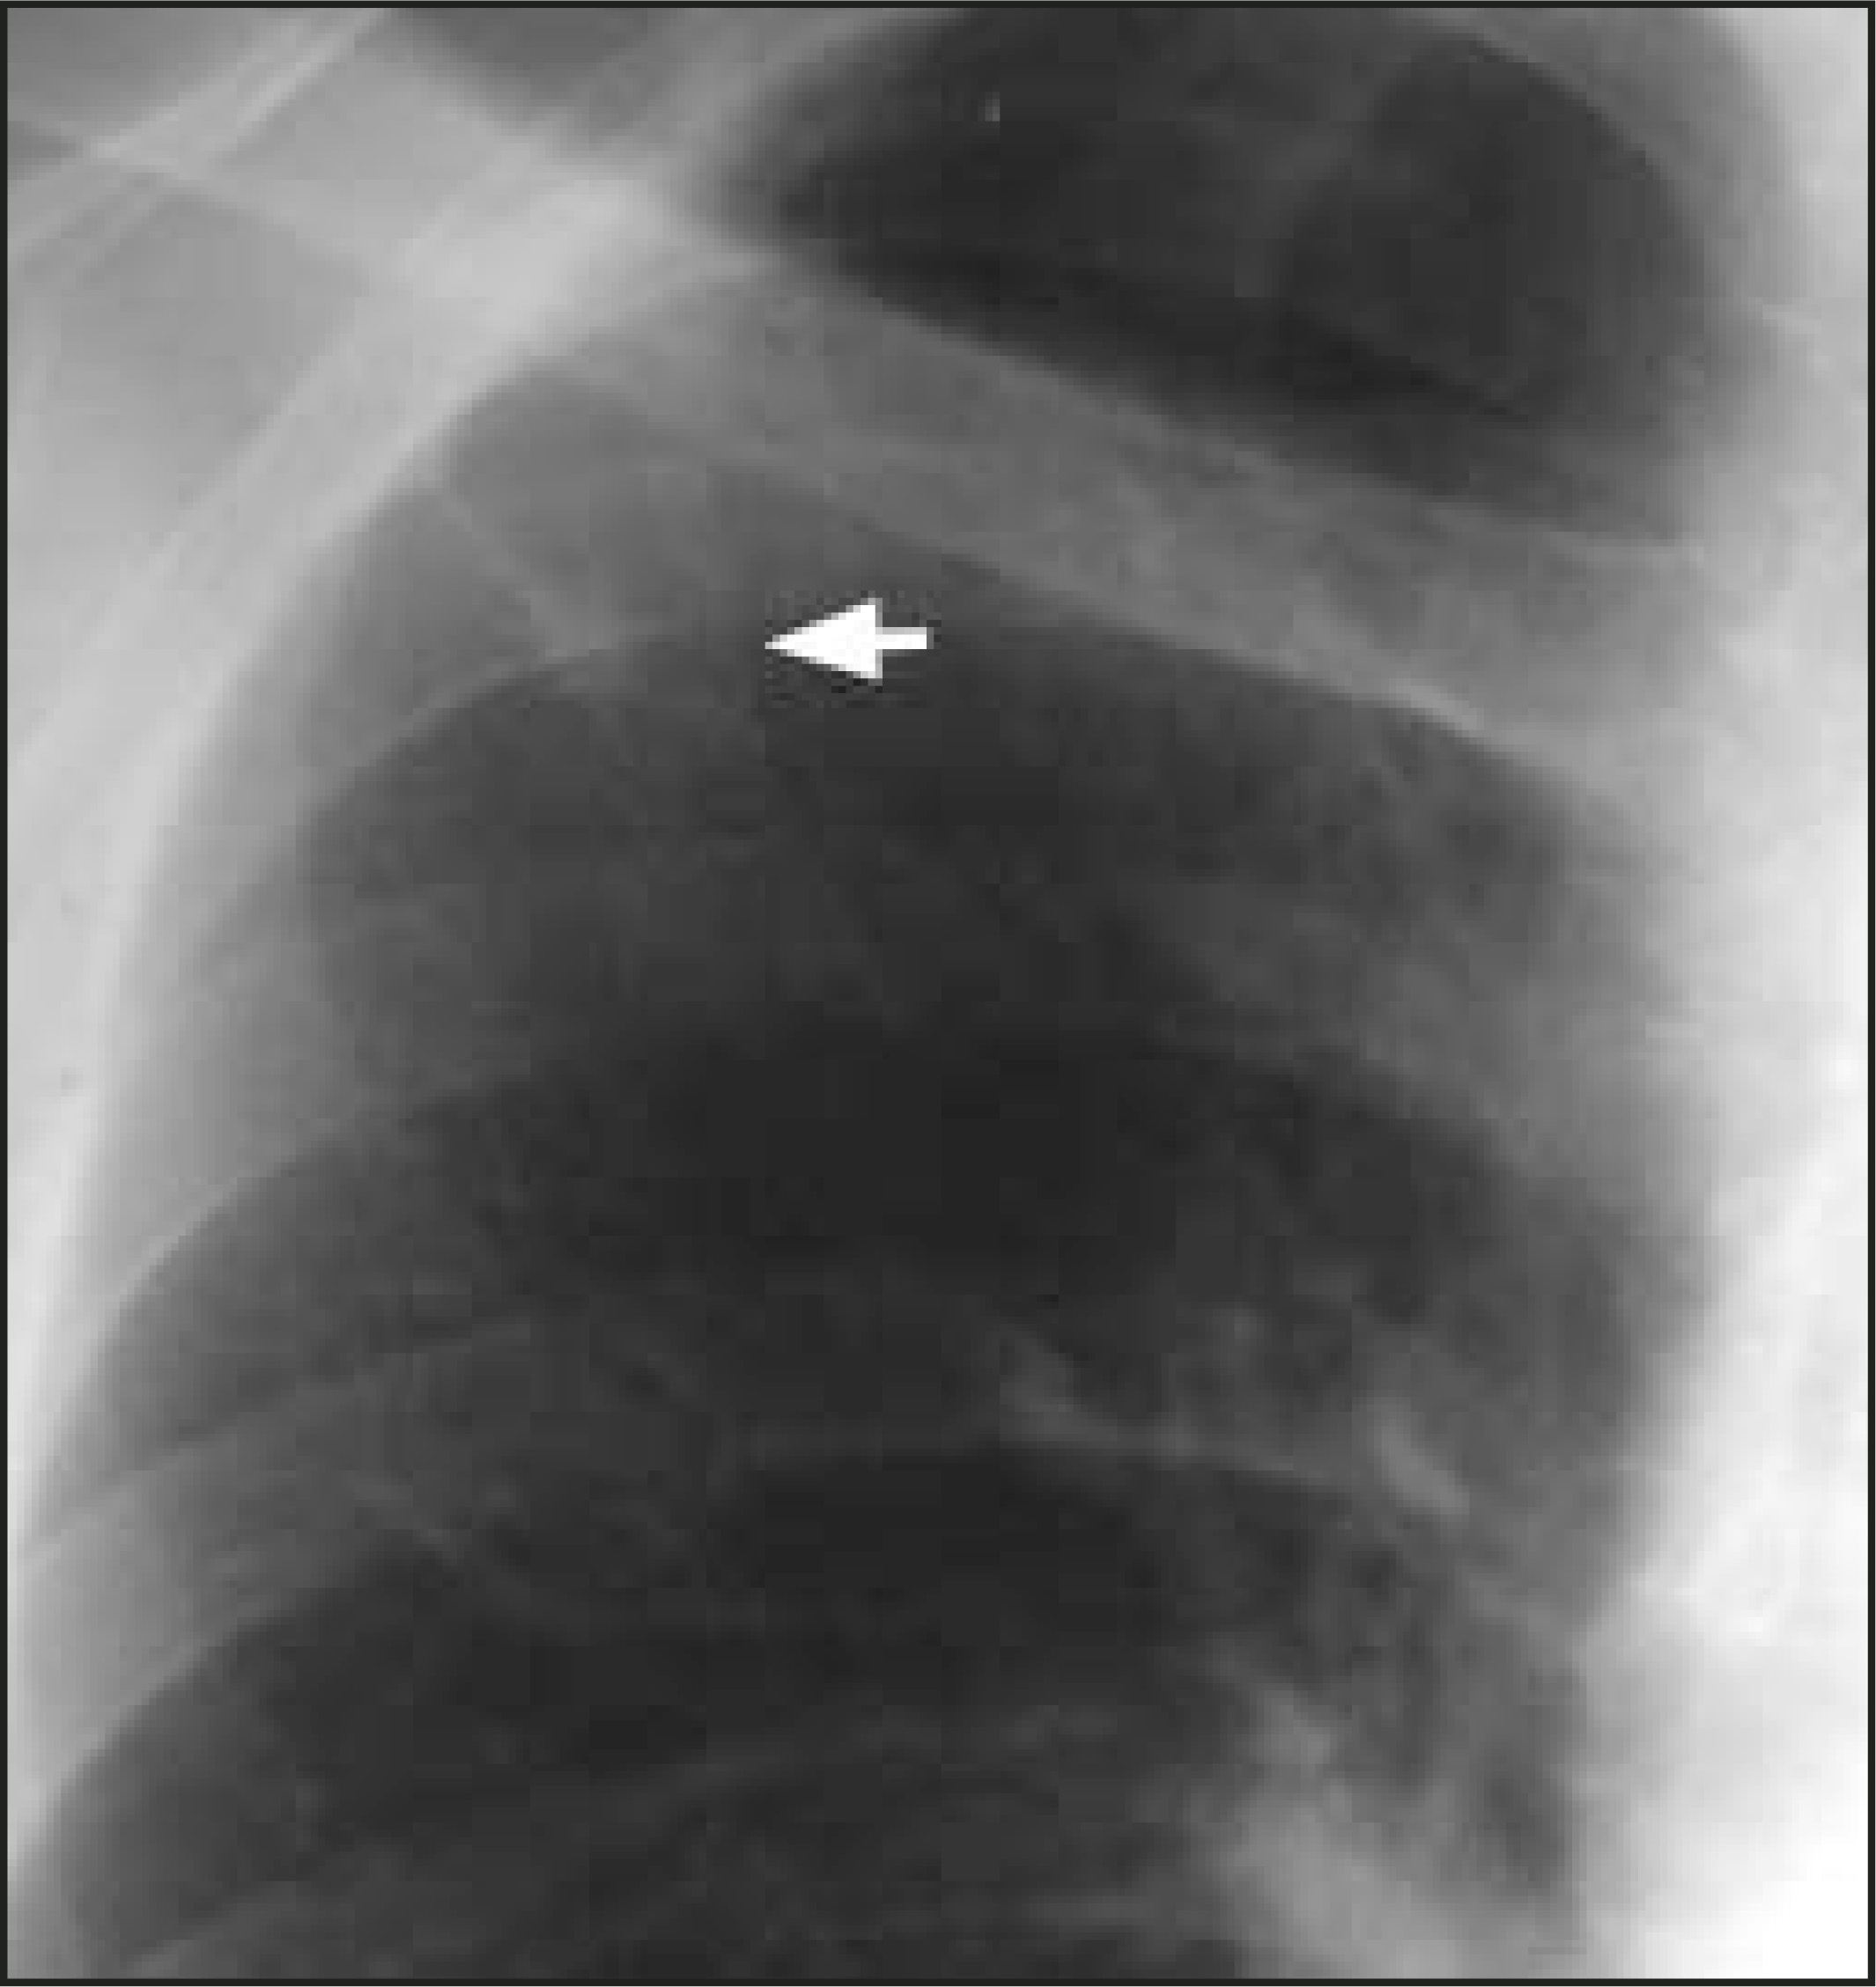
Calcification within a nodule can also be of use in differentiating benign from malignant lesions. Diffuse calcification patterns are often associated with a benign condition. The presence of laminated or central calcification is typical of a granuloma, and popcorn calcification is most often seen in hamartomas (Figure 4). Stippled or eccentric patterns of calcification are more often associated with malignancy. On standard CXRs, the sensitivity and specificity in detecting calcification have been reported to be 50% and 87%, respectively.16 The presence or absence of calcification in an SPN, as well as differentiation of benign from malignant lesions, should not be made with certainty using CXR criteria alone. CT is more sensitive, specific, and accurate in this regard.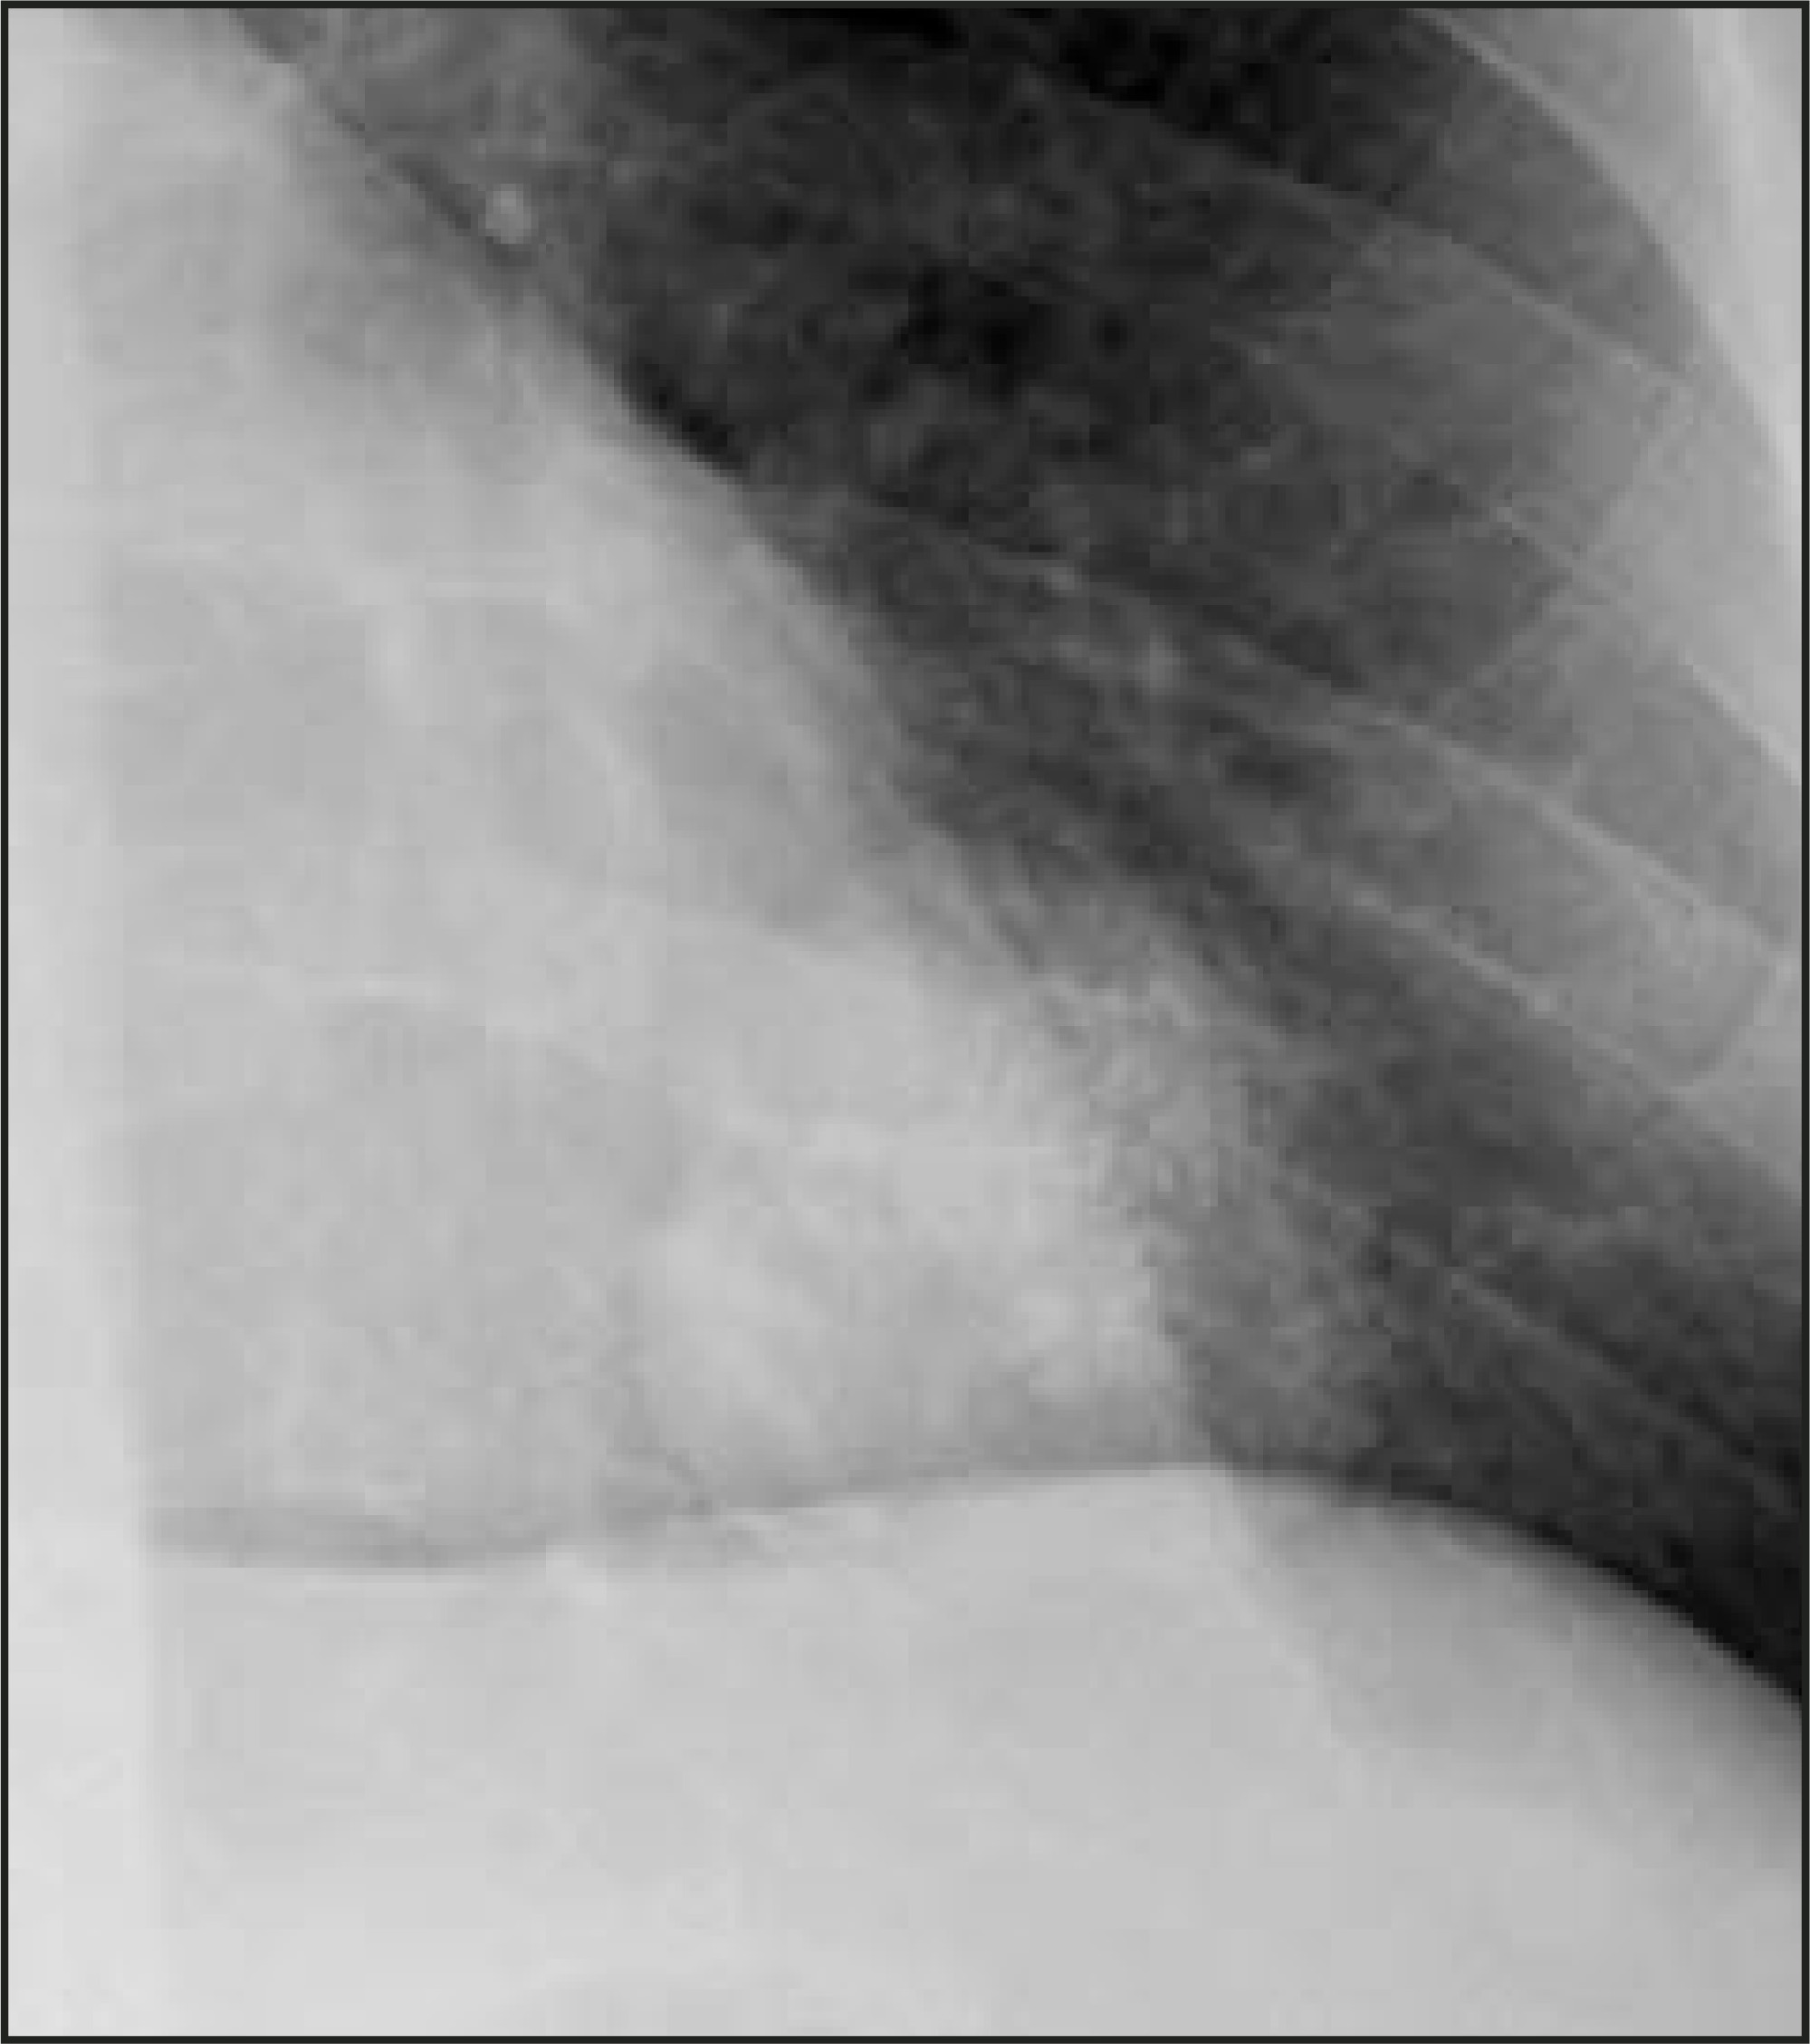
Computed tomography
CT has become almost standard procedure in the investigation of an SPN, to confirm the presence of the nodule and for further morphological evaluation. CT can detect a nodule not identified by CXR or may detect multiple nodules. It also clearly defines whether the nodule is intrapulmonary, rather than within the pleura or chest wall. CT provides an accurate assessment of nodule size, contour, margin, and presence or absence of calcification. In addition to conventional CT, thin-slice CT and high-resolution CT (HRCT) are often used for further evaluation of the nodule.
Size
The size of the SPN influences the probability that it is malignant. Generally, benign lesions are smaller overall than malignant ones. Although 80% of benign nodules are <2 cm in size, the small size does not reliably exclude malignancy, as 15% of malignant nodules are <1 cm in diameter and approximately 42% are <2 cm in diameter.5,17,18 In SPNs >3 cm in diameter, the likelihood of malignancy increases to 17,18 Scanning with thin collimation and particularly HRCT is superior to conventional CT in delineating the size and morphology of the nodule.15
Growth
Observation of nodule growth is important in monitoring and predicting outcome, especially in smaller nodules. This can be done either with serial CXRs or CT scanning. Chest radiographs are two-dimensional depictions, while nodules are generally spheres; therefore, volumetric assessment of the nodule using CT is more reliable and accurate in estimating growth.
The use of helical CT for monitoring SPN growth rates has become an integral part of radiological evaluation of the SPN. Computer programs that allow volumetric assessment of the nodule are now available on CT. These techniques are more accurate and more reproducible than are manual methods; they are also more sensitive to small changes in volume that are not easily detectable on standard two-dimensional imaging.19,20 Computer software programs can segment scans of SPNs and calculate nodule volume to within an accuracy of 3%.9,19 Early repeat CT, obtained 30 days after the initial scan, has been shown to depict growth in most malignant tumors as small as 5 mm.20
Growth rate measurements are generally based on estimating the doubling time. The concept of doubling time is based on the fact that the rate of tumor growth is exponential. Published series have estimated the doubling time for most malignant tumors to range from 30 to 450 days, depending on the histology.9,19,21,22 Thus, nodules that exhibit either a very rapid or a slow growth rate are considered to be benign. Conventionally, stability over a 2-year time period has been accepted as a strong indicator of benignity.9,19
Margins and contour
CT confirms the CXR findings and provides further information regarding the margin and contour of the nodule. Margins of the nodule are often categorized as smooth, lobulated, irregular, or spiculated. Although most nodules with smooth, well-defined margins are benign, 21% of malignant nodules can also have a smooth, well-defined margin.17,18,23 On the other hand, up to 58% of nodules with lobulated margins and 89% of nodules with irregular or spiculated margins are malignant17,18 (Figure 5). However, 10% of nodules with spiculated margins are benign9,24; and 25% of benign nodules, especially hamartomas, can have lobulated margins.25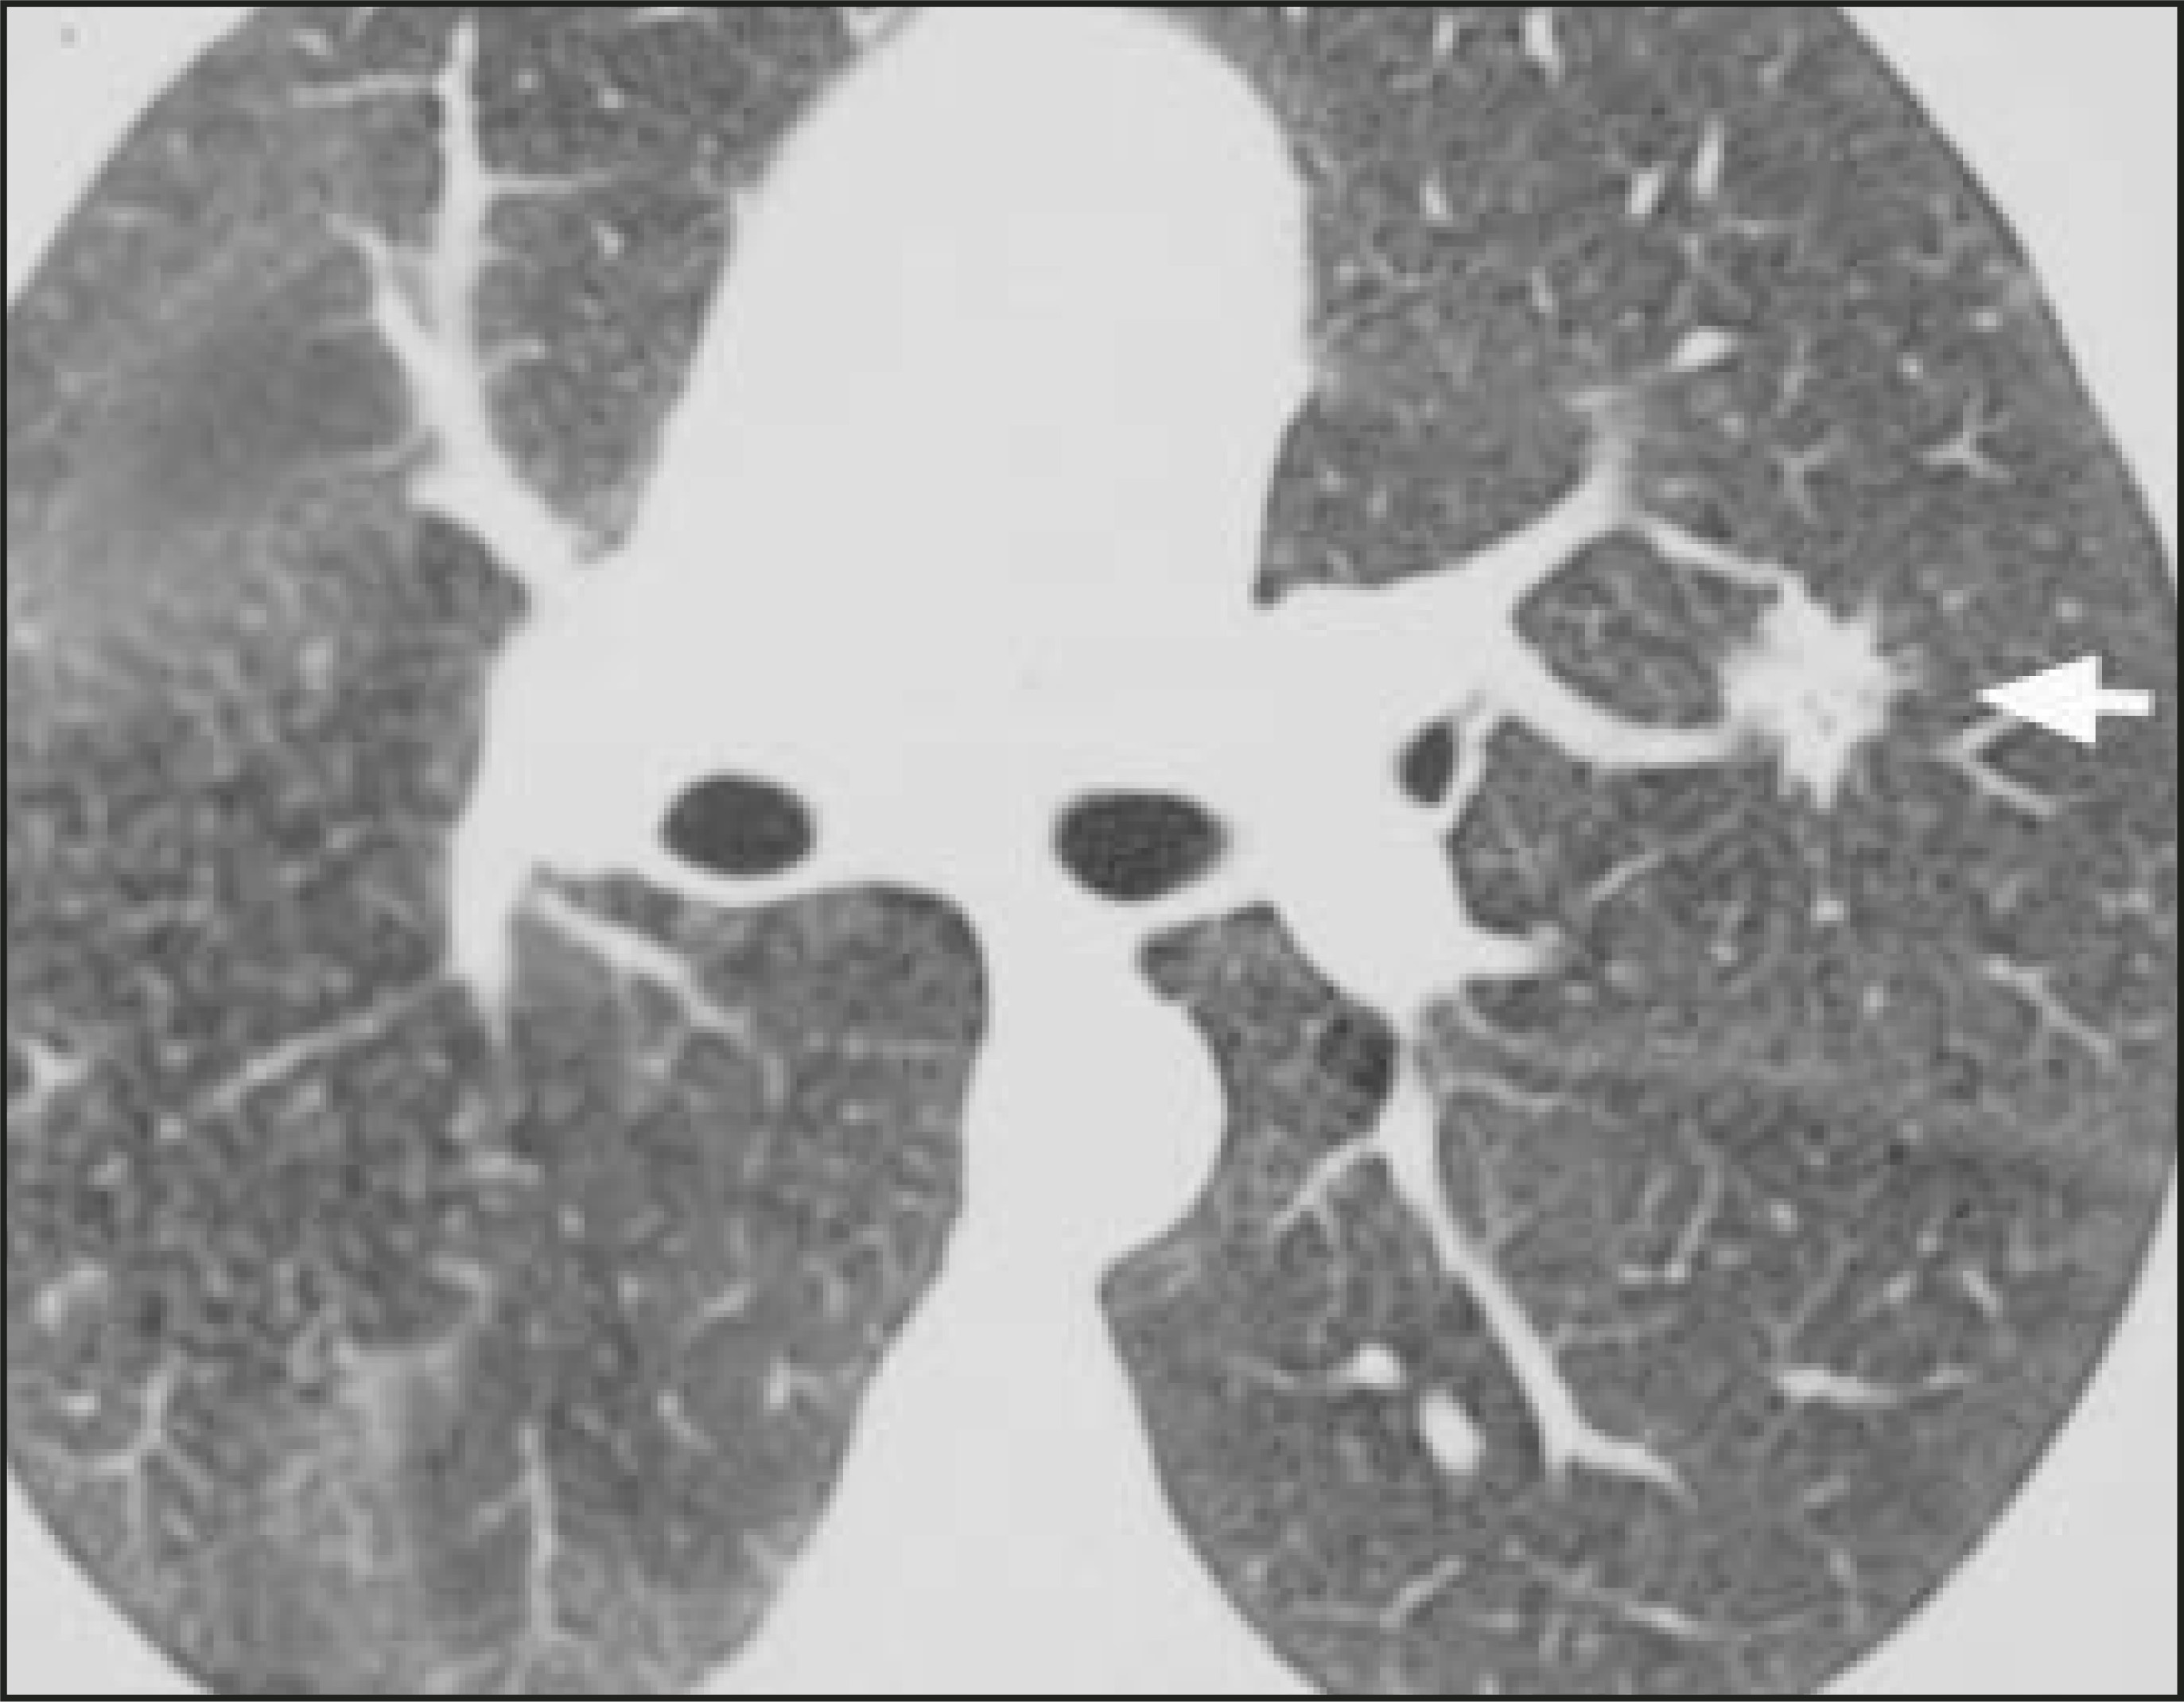
More recently, studies using HRCT reported that all nodules with a halo margin, 97% with densely spiculated, 93% with ragged, 82% with lobulated, 34% with round, and 20% with polygonal margins were malignant.25,26 As there is significant overlap in the margin characteristics of benign and malignant nodules, this feature cannot be used as a sole predictor of malignancy.
Thin-section CT provides other features of the margins that can be of diagnostic value. The presence of satellite nodules at the periphery of a smooth dominant nodule is most suggestive of infectious granuloma.27 The halo sign (presence of ground-glass opacity surrounding the nodule) when present in a neutropenic patient is highly indicative of aspergillosis.28 The presence of feeding and draining vessels entering the hilar aspect of a smooth or lobulated nodule is often associated with arteriovenous malformation.
Internal characteristics
The internal density and the presence of calcification, fat, or cavitation within a nodule provide additional information in evaluating the SPN (Figures 6 and 7). In 1980, Seigelman et al23 described the use of CT in identifying calcium in nodules. They concluded that nodules with representative CT numbers >164 HU were benign. CT scanning has a greater ability to detect calcification than does CXR. Approximately 22% to 36% of nodules considered as noncalcified by conventional CXRs are shown to contain calcium on CT.17,18 Definitive identification of calcification usually requires thin-section CT using 1- to 3-mm collimation, reconstructed with a high spatial frequency algorithm. A multicenter study using CT to evaluate SPN showed that thin-section CT was better than standard CT by 23.7% in the detection of calcification.17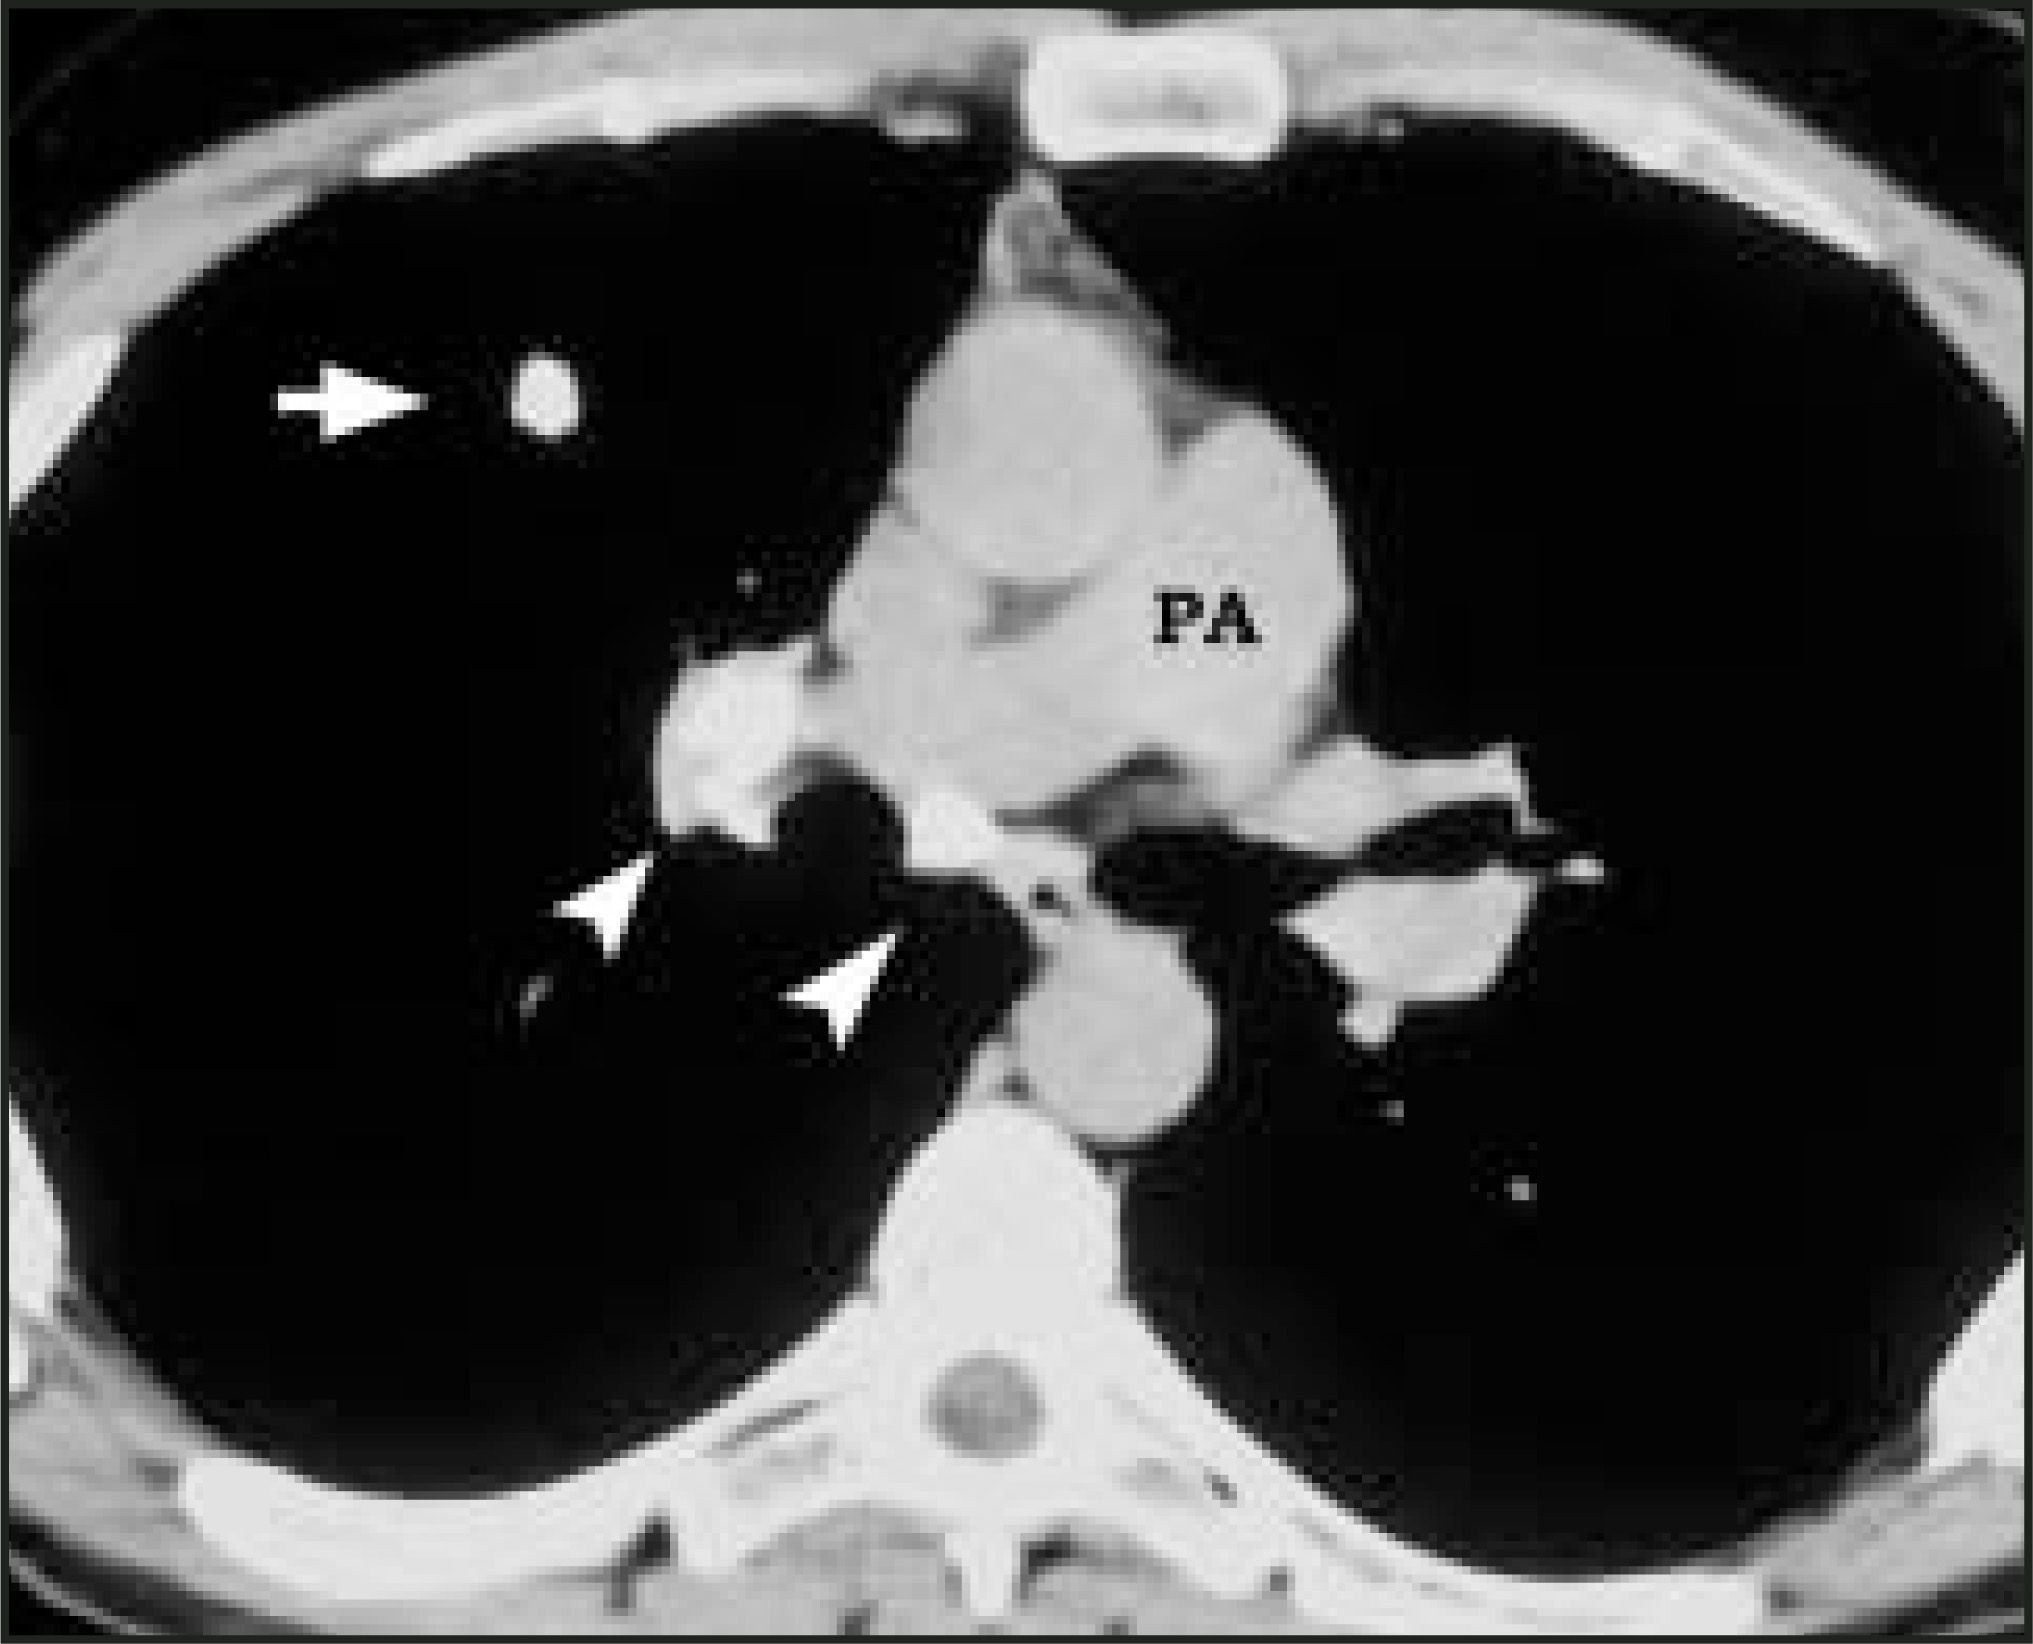
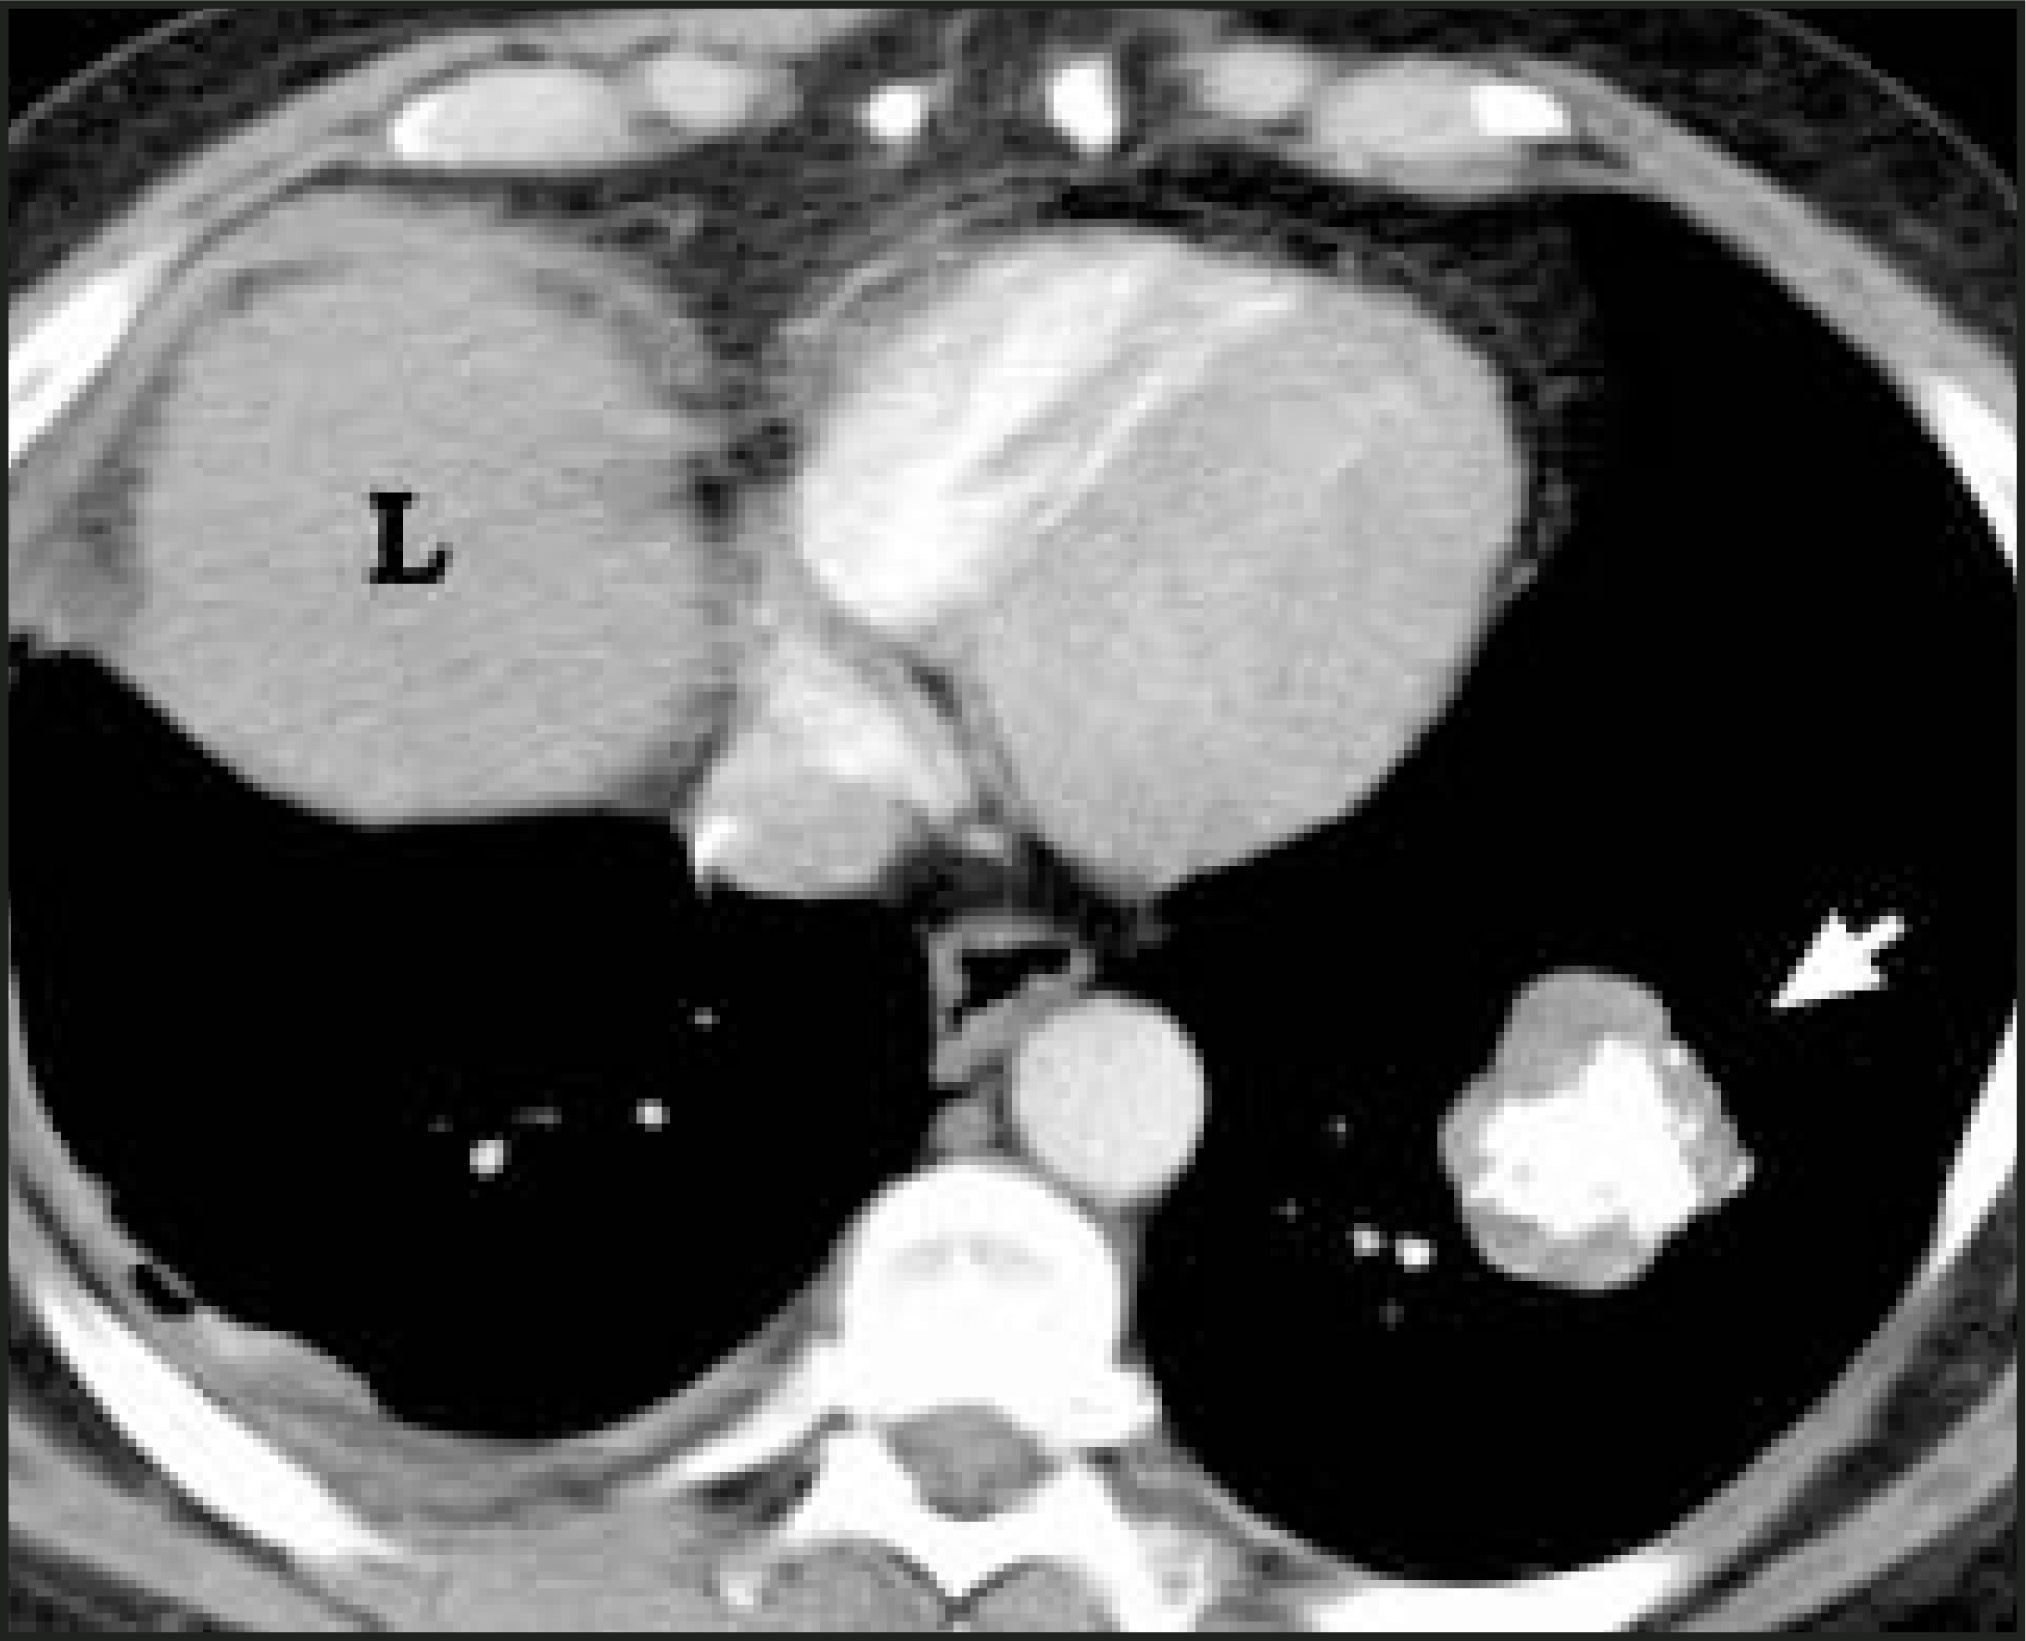
Dual-kilovolt peak CT scanning has also been used to detect nodules with low levels of calcification. A recent prospective study failed to show added clinical utility of using this method for detection of calcification,30 hence, this method has not been widely used in practice.
Other internal characteristics, such as the presence of fat, cavitation, and homogeneous attenuation, are also considered in evaluation of an SPN, but there is considerable overlap in these features among benign and malignant nodules. The presence of intranodular fat in an SPN with a smooth or lobulated margin is a reliable indicator of hamartoma. Fat is seen in up to 50% of hamartomas and is best visualized on thin-section CT.31 Cavitation can occur in benign infiammatory lesions, as well as in necrotic carcinomas (Figure 8). Benign cavities generally have smooth, thin walls, whereas malignant nodules have thick, irregular walls. Cavities with a wall thickness <5 mm are usually benign, while those with a wall thickness >15 mm are generally malignant.9 Homogeneous nodule attenuation is observed on thin-section CT in 55% of benign and 20% of malignant nodules.25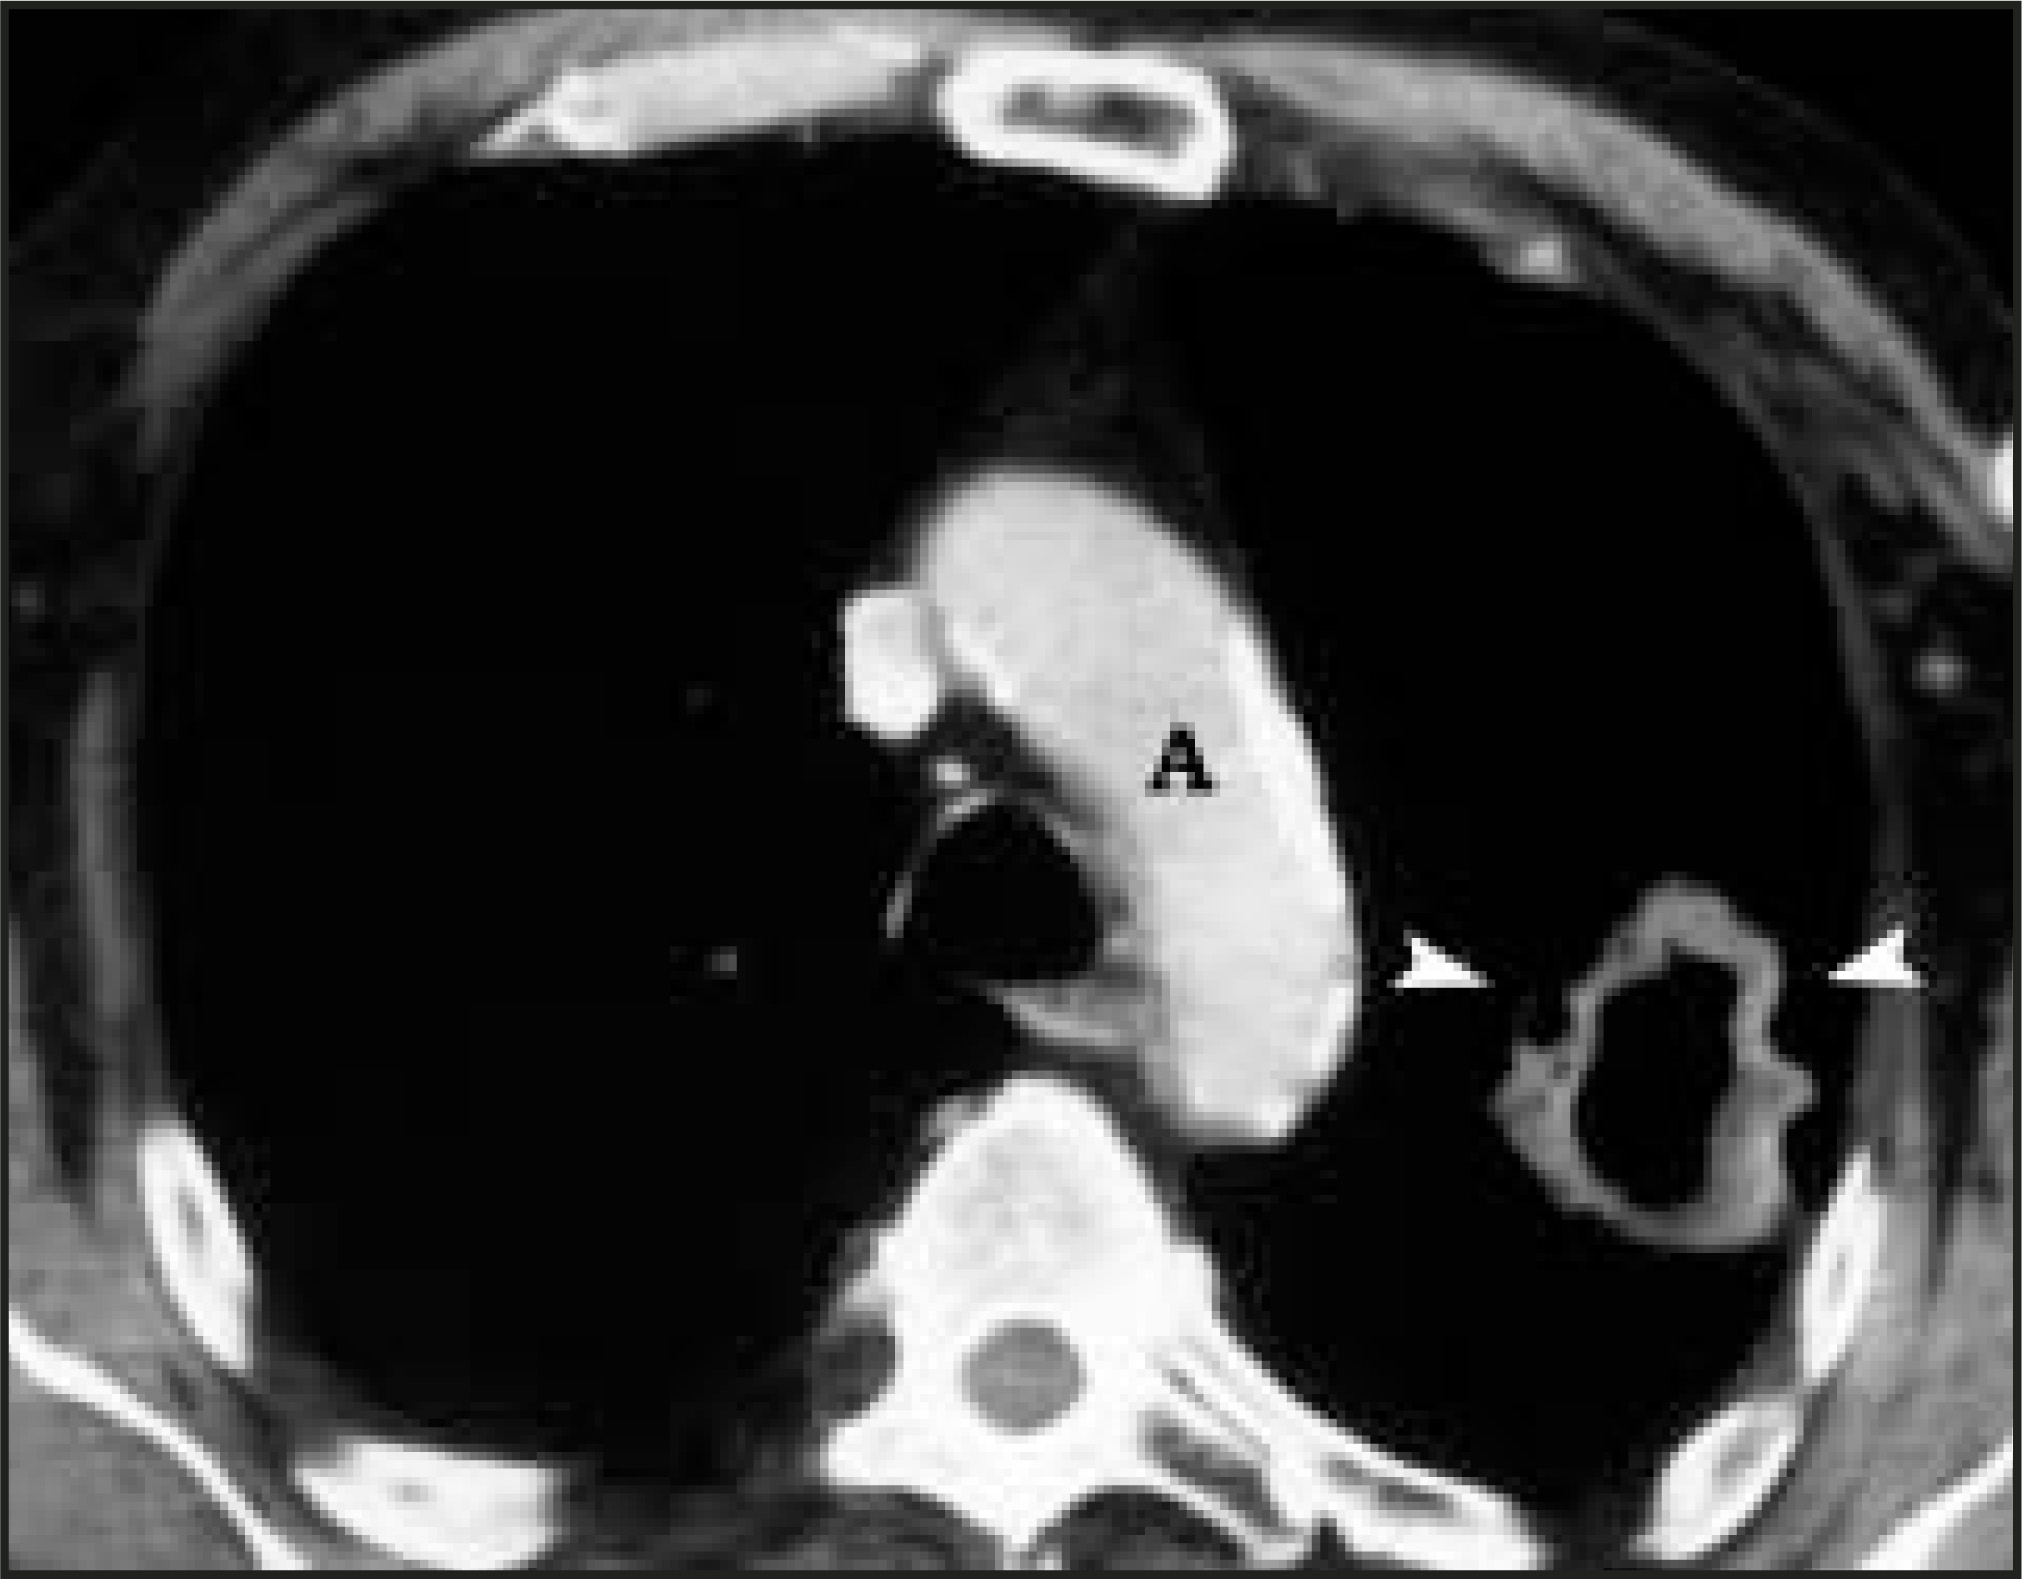
Enhancement pattern
There are distinct differences in the vascularity of benign and malignant nodules. Malignant lesions are relatively hypervascular compared with benign nodules. Theoretically, the level of enhancement of a nodule depends on the amount of contrast material that enters the extravascular space and on the degree of vascularity of the nodule. In a large multicenter prospective trial, Swensen et al32 found that nodule enhancement <15 HU is strongly predictive of benignity. With 15 HU as the threshold, the sensitivity for detecting malignancy was 98%, for detecting specificity was 58%, and for detecting accuracy was 77%. False-negatives can be caused by central necrosis or mucinous neoplasms, such as bronchoalveolar carcinoma, and false-positives can be caused by active infectious granulomas.
Assessment of nodule enhancement after intravenous contrast administration can be accomplished with the use of power injectors and rapid data acquisition with helical CT. With helical CT, it is possible to perform both the lung nodule enhancement assessment and an optimally contrast-enhanced CT examination of the chest and abdomen with the same injection of contrast material.
A suggested protocol is as follows: A spiral series of scans through the chest is obtained after a delay of 20 seconds from the onset of injection. Then, 1 minute after the onset of injection, 3-mm collimation spiral imaging through the nodule with a 1-mm reconstruction interval is performed for 5 seconds. Between 1 and 2 minutes after injection onset, spiral images are obtained through the lower chest and upper abdomen. Finally, spiral sections through the nodule are obtained at 2, 3, and 4 minutes after the onset of injection.32 This combined protocol has been shown not to increase the cost or the time to complete the examination. This technique should be used in SPNs with a diameter <2 cm, as lesions larger than these have a higher false-negative rate. Lesions <8 mm in size, cavitary lesions, and nodules with central necrosis are not amenable to CT enhancement studies.24,32
Positron emission tomography
Positron emission tomographic (PET) scanning using Fluorine-18 (F-18) fiuorodeoxyglucose (FDG) emerged as a powerful modality in the diagnosis and staging of malignancy in the early 1990s. Positron emission tomography provides unique information that is not available from other imaging modalities because of its ability to image in vivo chemistry qualitatively and quantitatively.
On January 1, 1998, the Health Care Financing Administration (HCFA) and various insurance companies in the United States approved PET scanning for the evaluation of SPN.33 The cyclotron-produced F-18 is attached to deoxyglucose to form fiuorodeoxyglucose. Due to the relatively long half-life (110 minutes) of F-18, FDG is available commercially as a unit dose from many sites on a regional basis. The availability of less expensive PET scanners and the convenient access to the positron emitter FDG has resulted in greater use of this technique.
The rationale of imaging with FDG is based on a basic property of tumor cells—namely, increased glucose metabolism. In 1956, Warburg34 described that malignant cells have an increased rate of glycolysis. This is associated with increased activity of glycolytic enzymes, namely hexokinase, 6-phosphofructokinase, and pyruvate dehydrogenase, as well as increased membrane glucose transport capability. FDG is recognized by these glucose transporter proteins and enzymes, but after the initial step of phosphorylation, FDG-6-phosphate is trapped and cannot continue the normal pathway. This leads to increased FDG accumulation in malignant cells, thus producing a detectable signal. As FDG competes with serum glucose for cellular uptake, the blood glucose level should be as low as possible physiologically. In order to achieve this, patients are required to fast for at least 4 hours prior to FDG administration.
FDG emits positrons that travel a few millimeters before annihilating with an electron. This leads to the production of two 511 KeV photons in 180° opposite to each other. Simultaneous detection of these photons produces a signal, which is used to reconstruct the final image. Abnormal FDG uptake can be determined either by simple visual inspection, or can be analyzed semiquantitatively by calculating the standardized uptake value (SUV). In general, an SUV >2.5 has been used as an indicator of malignancy.4,35-37 On visual inspection, an SPN that is hypermetabolic (ie, intensity greater than the mediastinum) is considered malignant (Figure 9).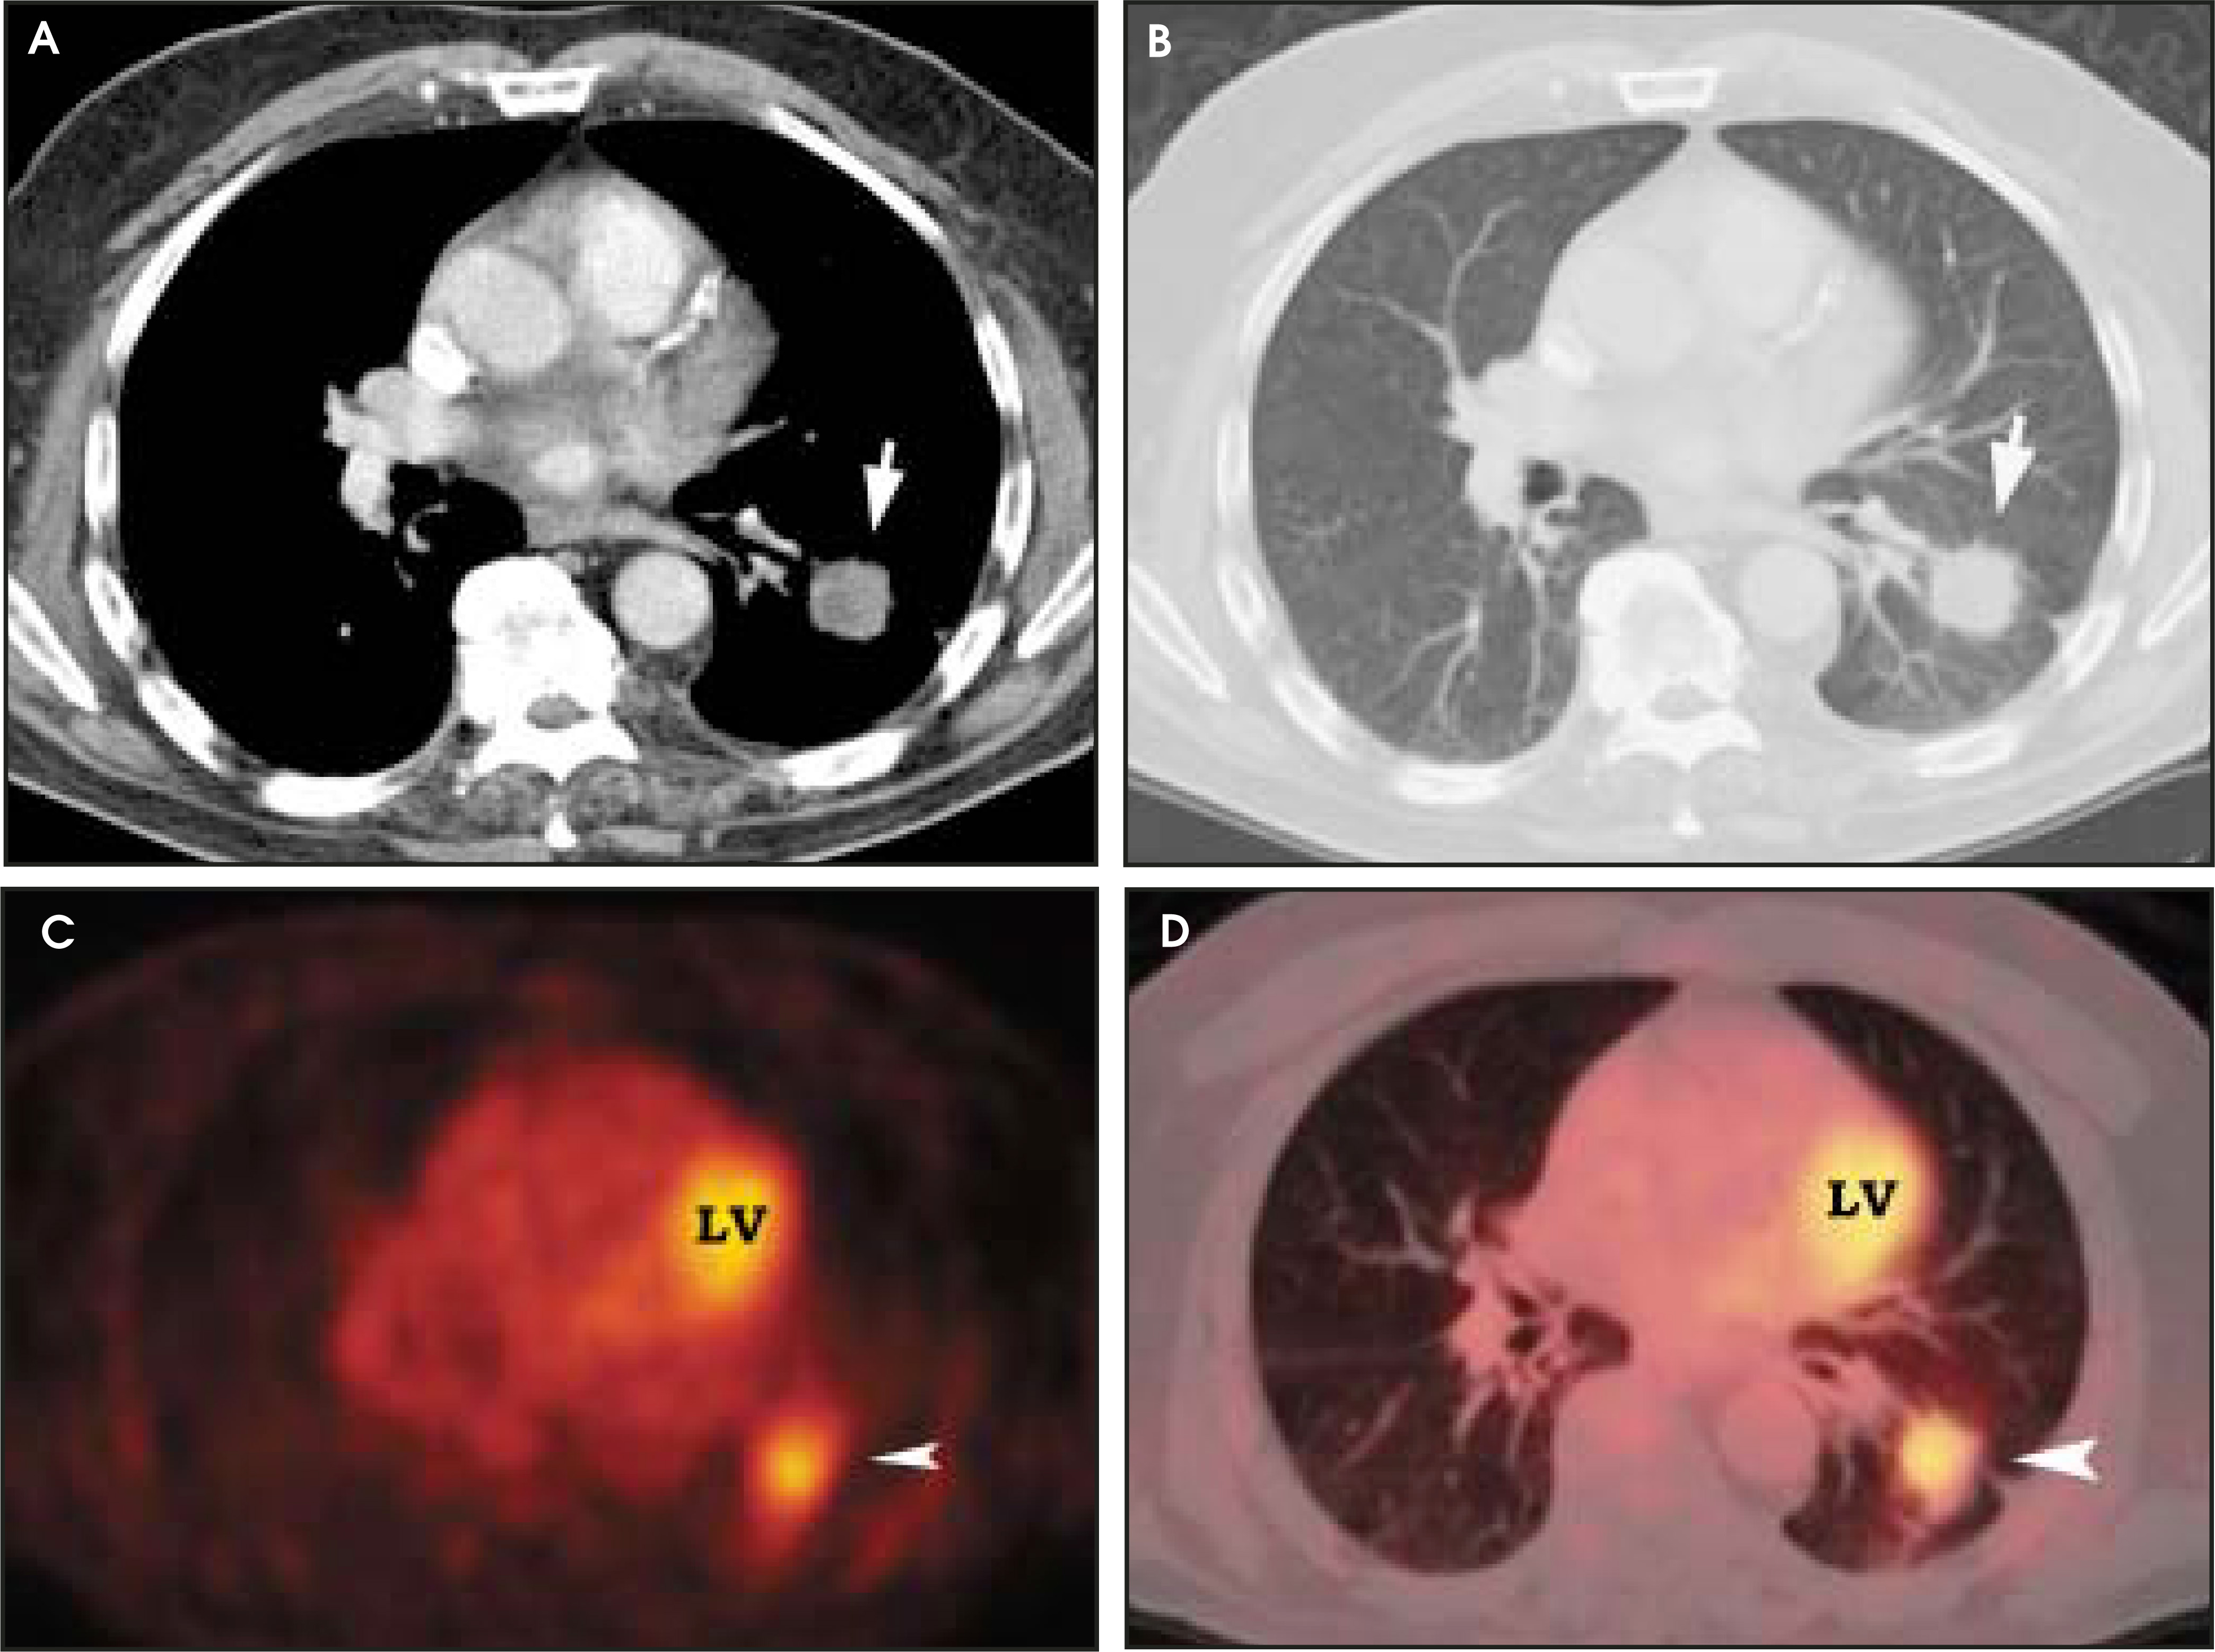
Various series have reported the sensitivity of FDG-PET in determining malignancy in SPNs to range from 83% to 100%; specificity to range from 63% to 90%; accuracy to range from 86% to 98%; and the negative predictive value to be 95%.4,35-38
The size of the lesion is an important determinant of the sensitivity and specificity of FDG-PET imaging. A prospective multicenter study of SPNs reported that the sensitivity and specificity were 80% and 95%, respectively, in nodules ≤1.5 cm and 96% and 80%, respectively, in nodules >1.5 cm.35 The study also found that visual inspection of the nodule was equally accurate, with a sensitivity of 100% and specificity of 74% in nodules ≤1.5 cm, and a sensitivity of 98% and specificity of 80% in nodules >1.5 cm. It is important to note that as the sensitivity of detection improves with a larger nodule, the specificity decreases.
False-positives can occur and are primarily due to increased glycolytic activity within activated macrophages. Common causes of false-positives are active granulomatous diseases, such as tuberculosis, fungal infections (Figure 10), and sarcoidosis. Other causes include silicoanthracosis, lipoid pneumonia, talc granuloma, postobstructive pneumonia, and radiation pneumonitis.4,39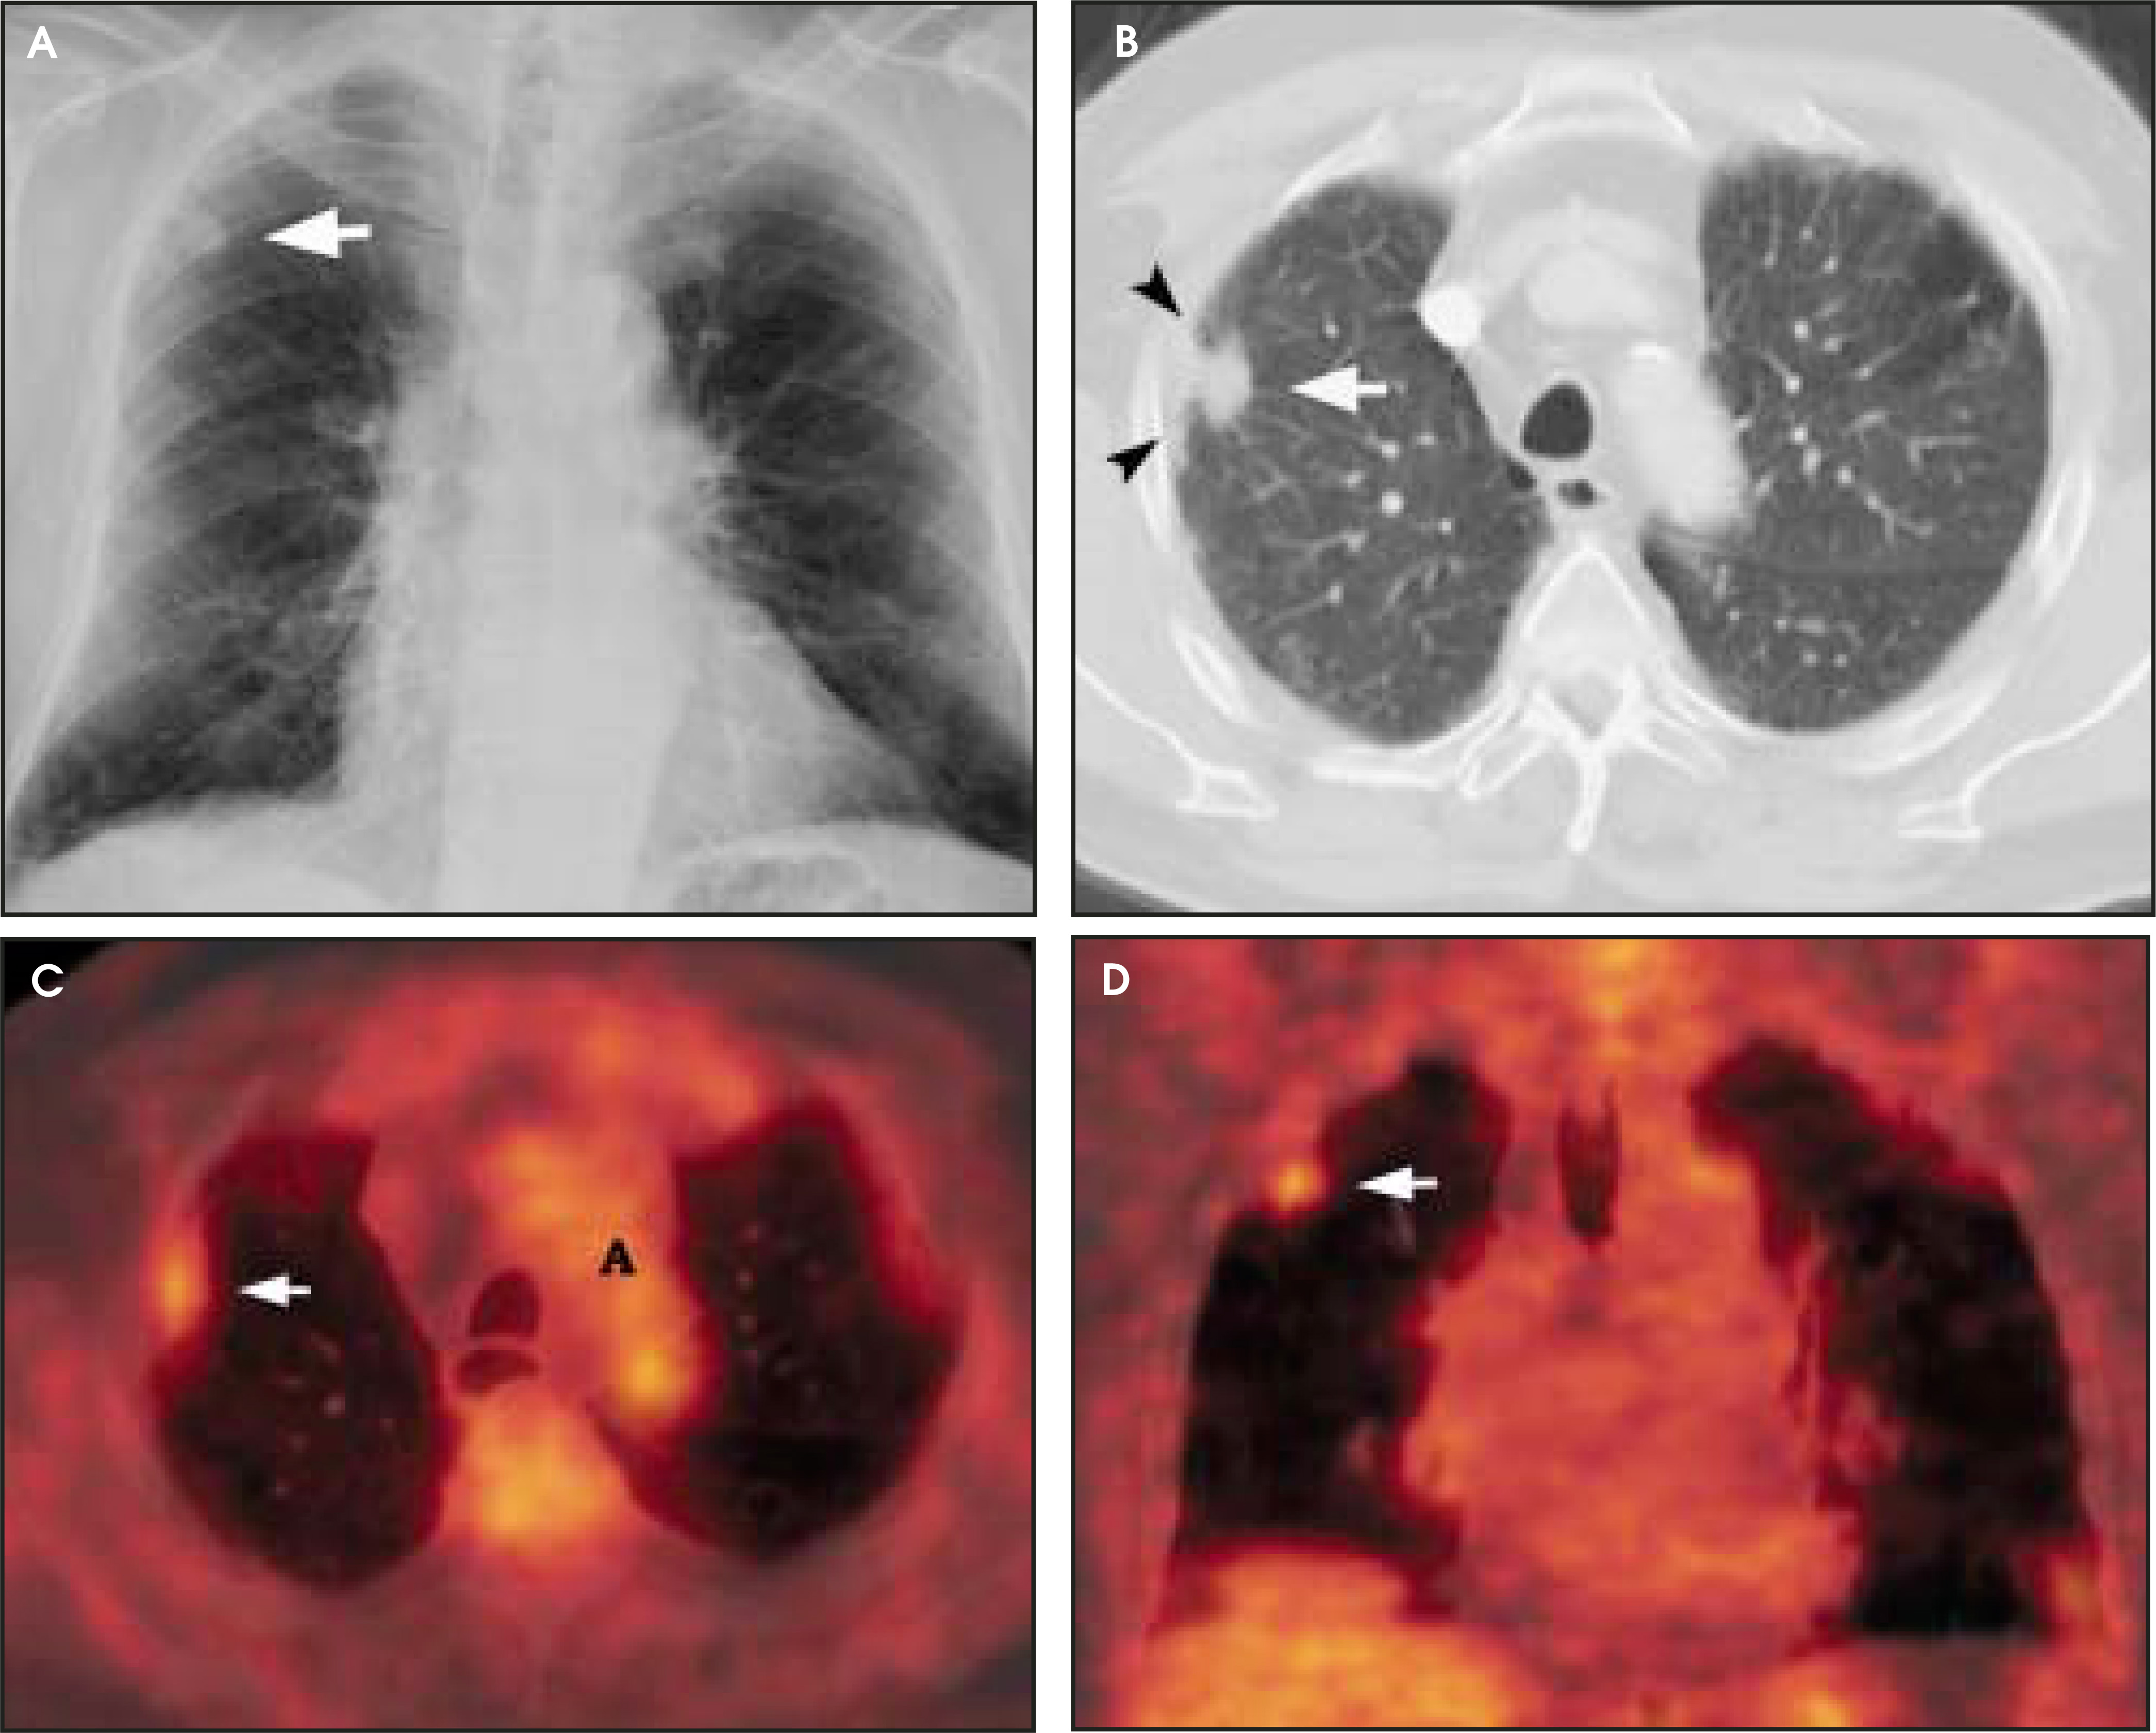
False-negative scans occur with small lesions near the spatial resolution of the scanner (approximately 6 mm), elevated serum glucose levels that cause competitive inhibition of FDG uptake, and inherently low-grade malignancies, such as bronchoalveolar carcinoma. Bronchial carcinoid and mucinous neoplasms are additional causes of false-negative FDG-PET scans (Figure 11).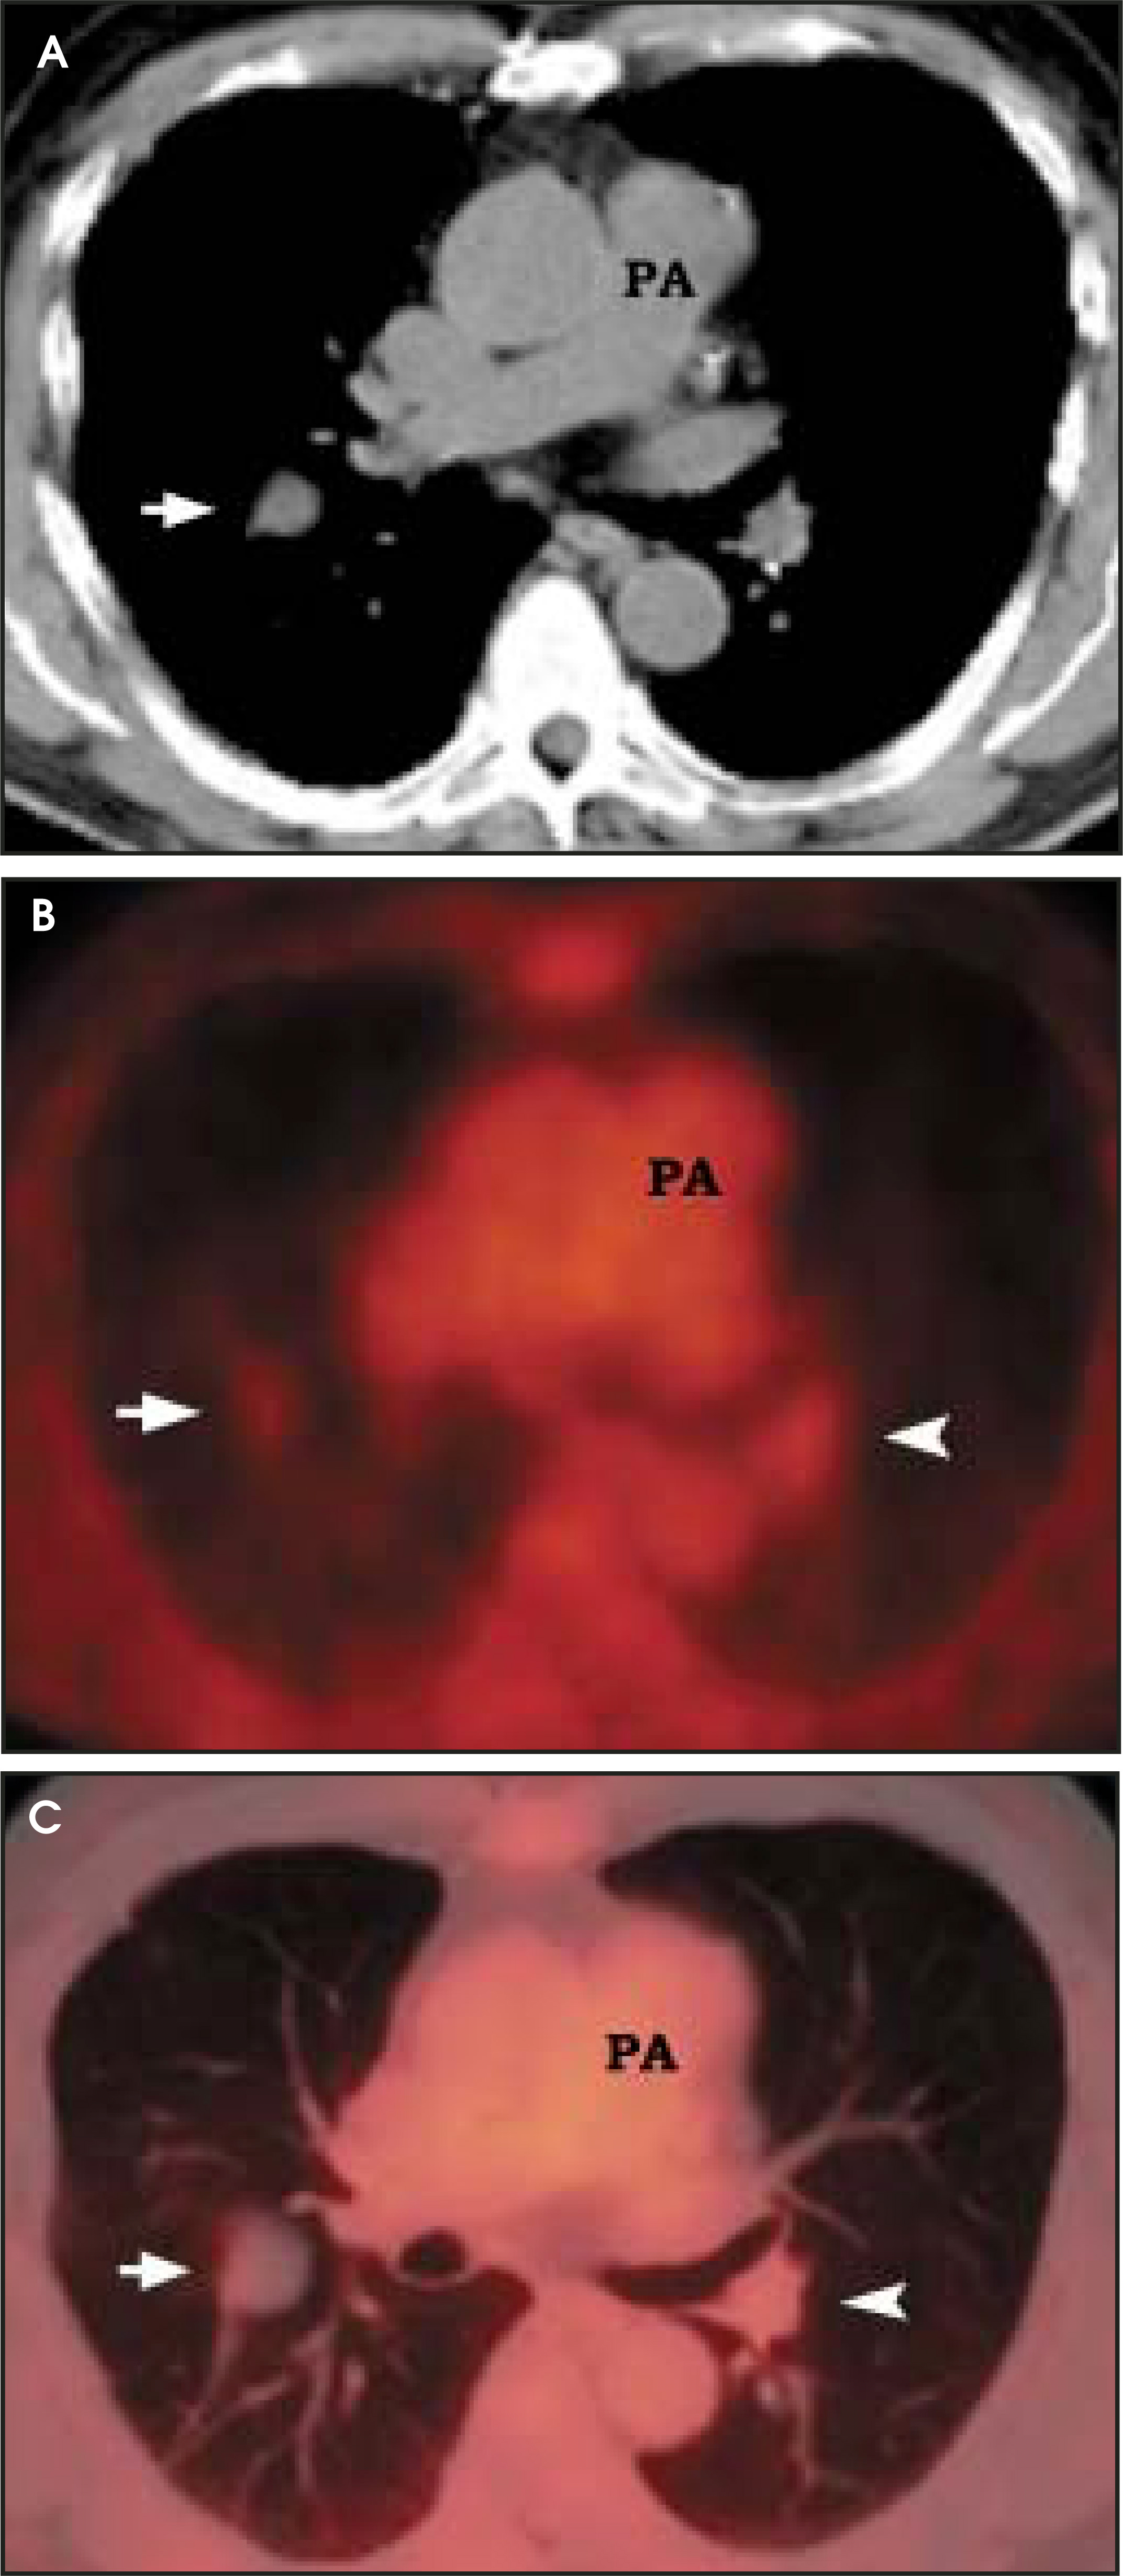
Much work is being directed at observing the FDG uptake in the suspected nodule over time following injection. Delayed scanning is performed through the region of interest, and FDG uptake is estimated either visually or by calculating SUV. As a general rule, malignancies demonstrate a continually increasing uptake of FDG over time.40,41 Infiammatory lesions show gradual washout of FDG after a period of initial increase. This dual-point imaging can increase the specificity of FDG-PET assessment of SPNs by decreasing false-positive scans secondary to infection or infiammation.
A recent meta-analysis of the accuracy of FDG-PET scans in the diagnosis of pulmonary nodules determined that the joint maximum sensitivity and specificity of FDG-PET was 91.2% (95% confidence interval, 89.1% to 92.9%) for lesions of any size.42 In current practice, most FDG-PET scanners are operated at a threshold set to provide a sensitivity and specificity of 96.8% and 77.8%, respectively, in order to decrease false-negative results. The corresponding likelihood ratios for positive and negative test results are 4.36 and 0.04, respectively. The study also showed that semi-quantitative analysis of the nodule did not improve the accuracy of FDG-PET.
Positron emission tomographic scanning is an accurate test for identifying malignancy in SPNs, but little information exists about FDGPET performance in nodules <1 cm in diameter. Because the lesion detectability on most current PET scanners is 7 to 8 mm, the use of FDGPET for smaller nodules should await further technological advances. An SUV of ≥2.5 or an intensity higher than the mediastinum on visual inspection is the accepted criteria for malignancy for nodules >1 cm in diameter (Figure 12). In a nodule <1 cm, any FDG uptake should be considered suspicious for malignancy.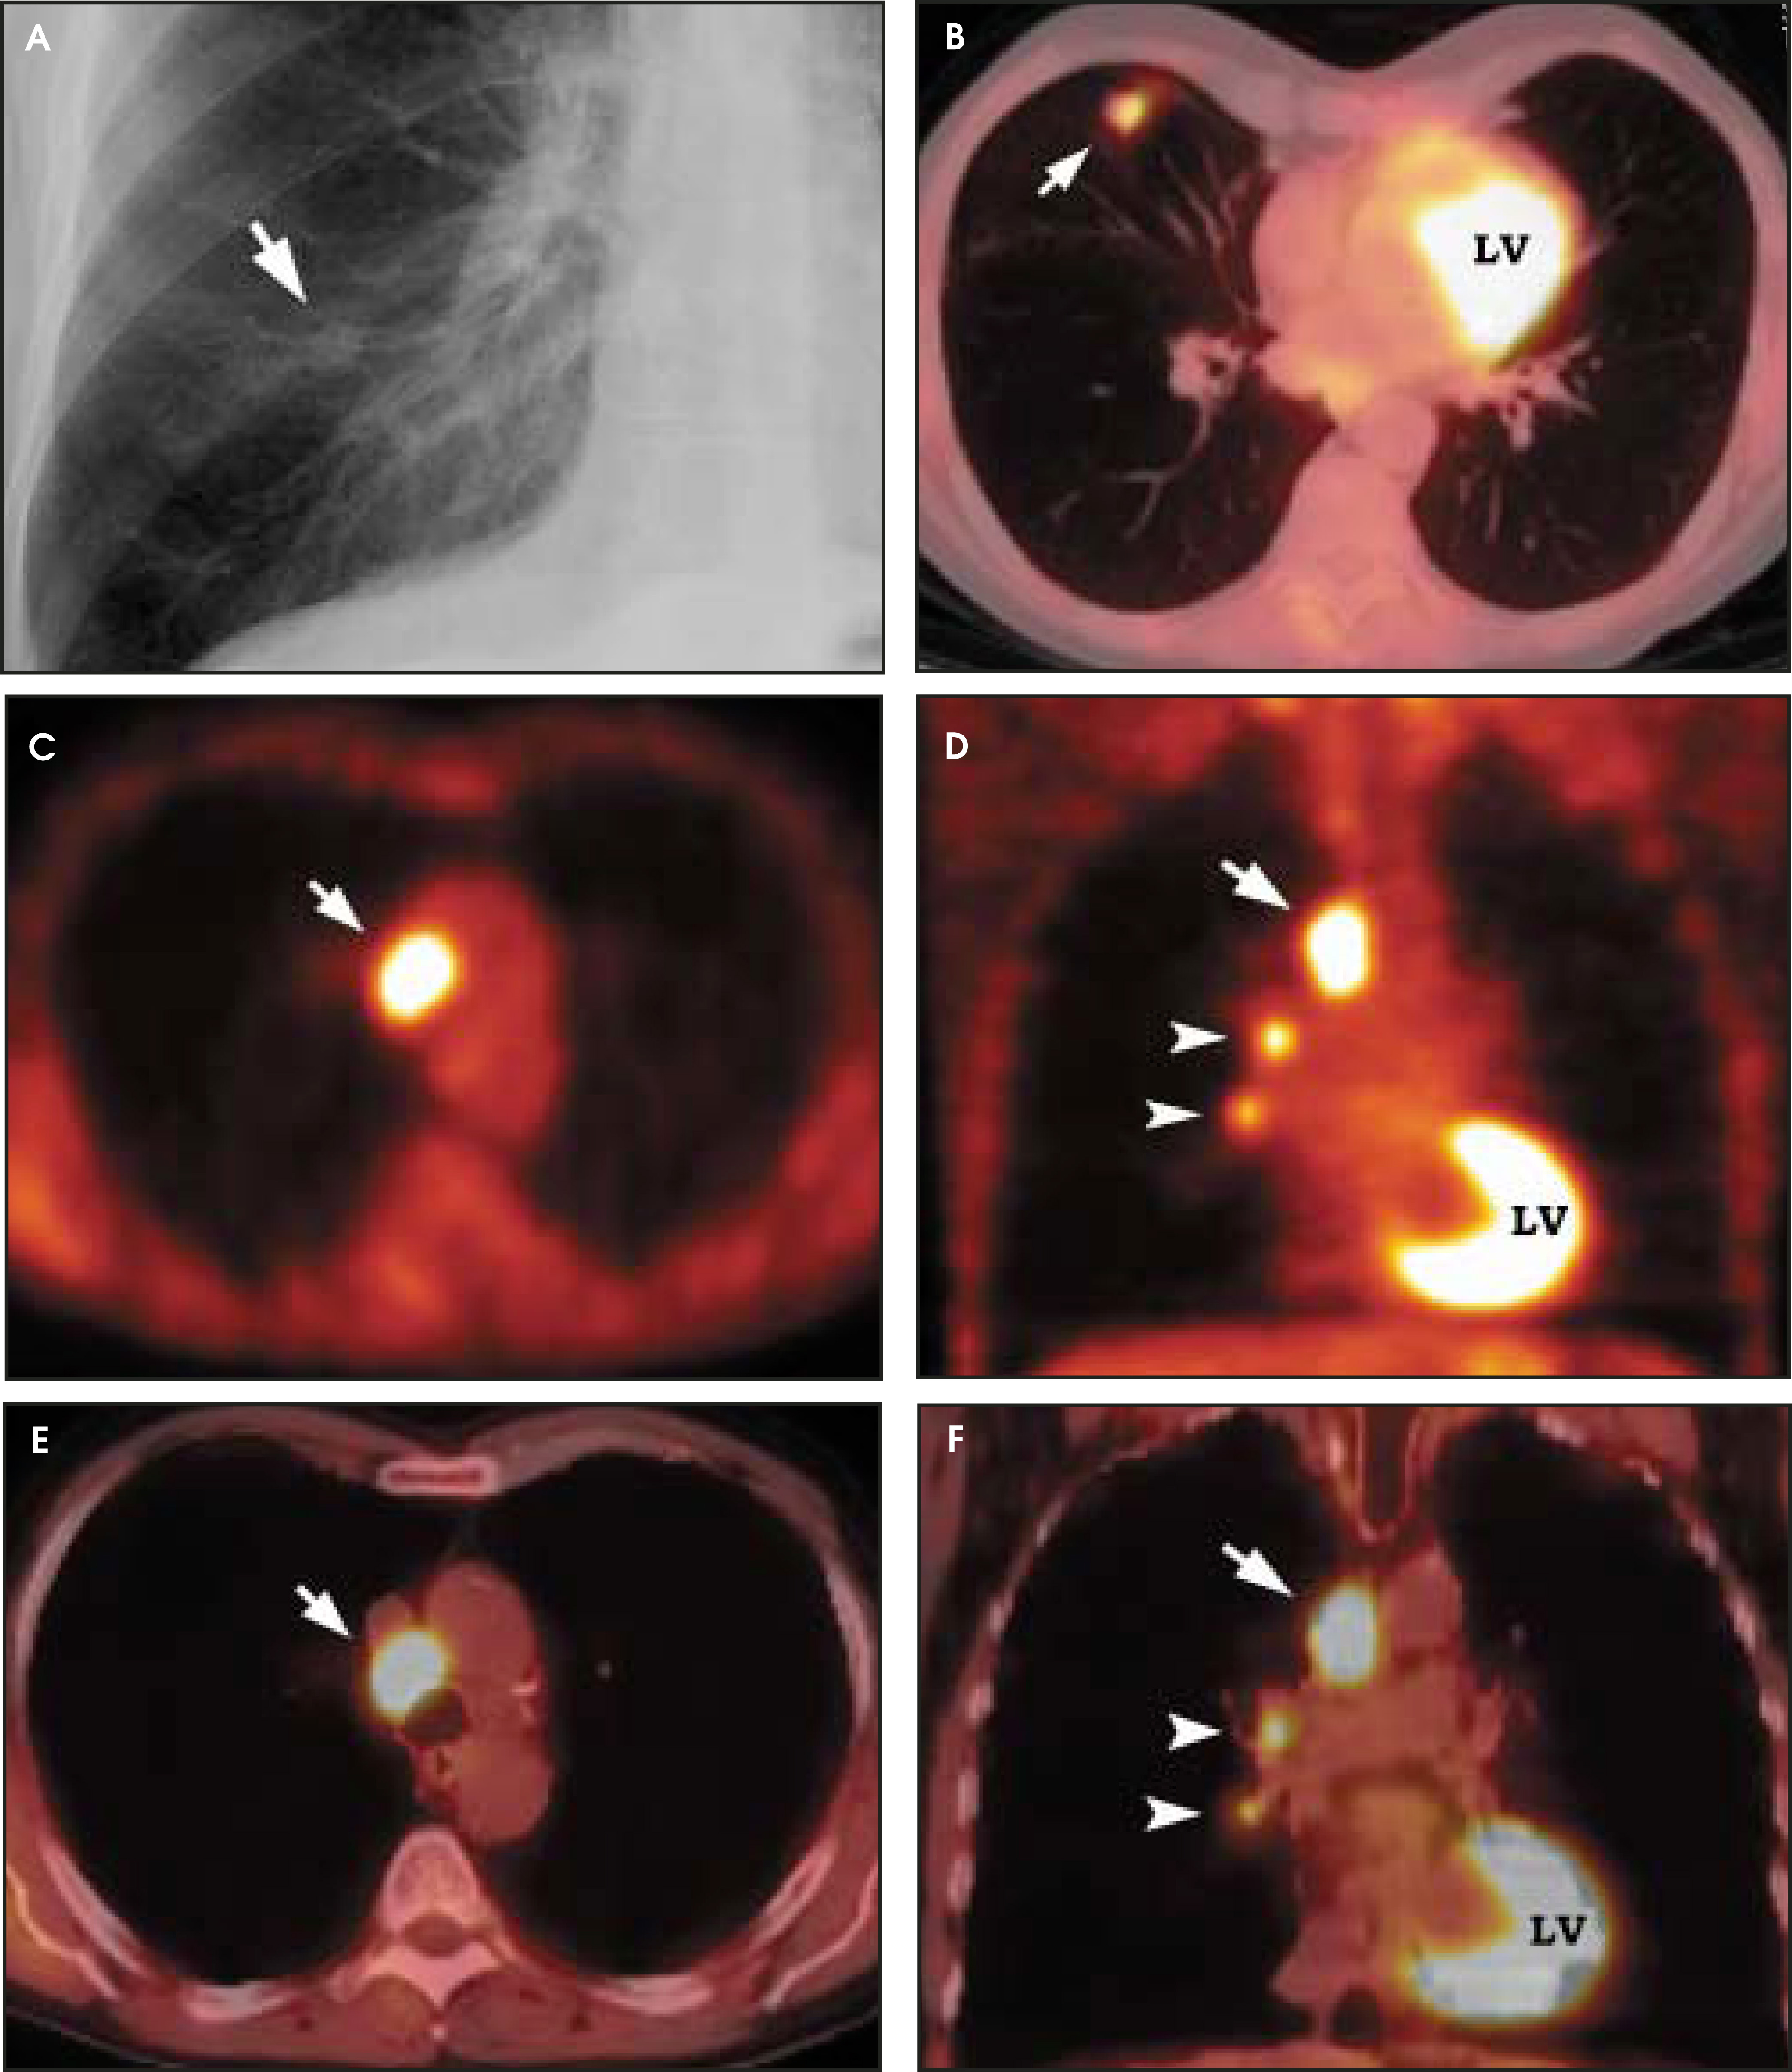
An important issue to be addressed is whether or not the use of FDG-PET helps in clinical decision making. Patients with a positive FDGPET study require further evaluation by biopsy and/or treatment. The negative predictive value of FDG-PET depends on the pretest probability of malignancy. In high-risk patients (pretest probability of malignancy = 80%) with a negative FDG-PET, the post-test probability of malignancy can be as high as 14%,42 and these patients need further evaluation by biopsy. For low-risk patients (pretest probability of malignancy = 20%), a negative FDG-PET has a post-test probability of approximately 1%.
FDG-PET cannot be evaluated correctly without consideration of the anatomic information provided by CT. In the future, the routine use of combined-modality PET/CT scanners will add the anatomic detail necessary. Software programs are available that can fuse the CT and PET images for image overlay and easy interpretation.
In centers in which dedicated PET scanners are not available, multihead conventional gamma cameras, which are readily available in most nuclear medicine departments, can be equipped with ultrahigh-energy collimators to allow single-photon emission computed tomography (SPECT) imaging using FDG. The spatial resolution and sensitivity of the SPECT systems are inferior to the dedicated PET scanners. Published series have reported a sensitivity of 100% and a specificity of 90% for lesions >2 cm, while sensitivity decreased to 50% for lesions <2 cm.43 The main disadvantage is the inability to detect lesions <2 cm in size. Coincidence detection SPECT cameras without collimators have also been used for FDG imaging.44 These techniques provide valuable information when dedicated PET scanners are not available to the institute. Gould et al42 have recently shown that accuracy was similar for studies performed on a dedicated PET scanner to those performed using a modified gamma camera. However, their estimates were based on a few small studies and additional research is needed to clarify this further.
Clinical approach
There is no single correct management approach to the SPN in all patients; the clinical findings and the associated risk factors must be taken into consideration to determine the etiology cost-effectively. Whenever possible, comparison with previous CXR should be performed.
Benign SPNs are those that demonstrate stability over 2 years and/or characteristic benign features on CT. In low-risk groups (ie, patients <35 years of age without additional risk factors), follow-up with serial CXR or CT is recommended to decrease the number of benign nodules resected.
Malignant SPNs are those with definite features of malignancy on CXR or CT. In high-risk groups (ie, older patients with additional risk factors), tissue sampling and/or resection is warranted.
In clinical practice, most SPNs are classified as radiologically indeterminate. The management of the indeterminate pulmonary nodule remains controversial and depends largely on the individual physician’s approach, as well as patient preferences and co-morbidities. It is important to consider the surgical risk and whether it is acceptable for the given probability of malignancy in each individual patient. In a patient with minimal surgical risk, surgery or tissue sampling may be performed even with a lower probability of malignancy. However, in older patients with concurrent medical illnesses and a high surgical risk, avoiding unnecessary surgery becomes more important (Figure 13). The location of the SPN (peripheral versus central) also plays an important role in management. For a central nodule, a lobectomy may be needed for excision and is much more extensive than a wedge resection of a peripheral lesion. Equally important is to determine whether additional diagnostic testing will alter the treatment plan. Additional tests are most useful if a negative test result would be sufficient for the clinician to defer surgery and elect a strategy of careful observation. If there would be no change in the treatment plan irrespective of the diagnostic result, then proceeding to surgery is the accepted choice.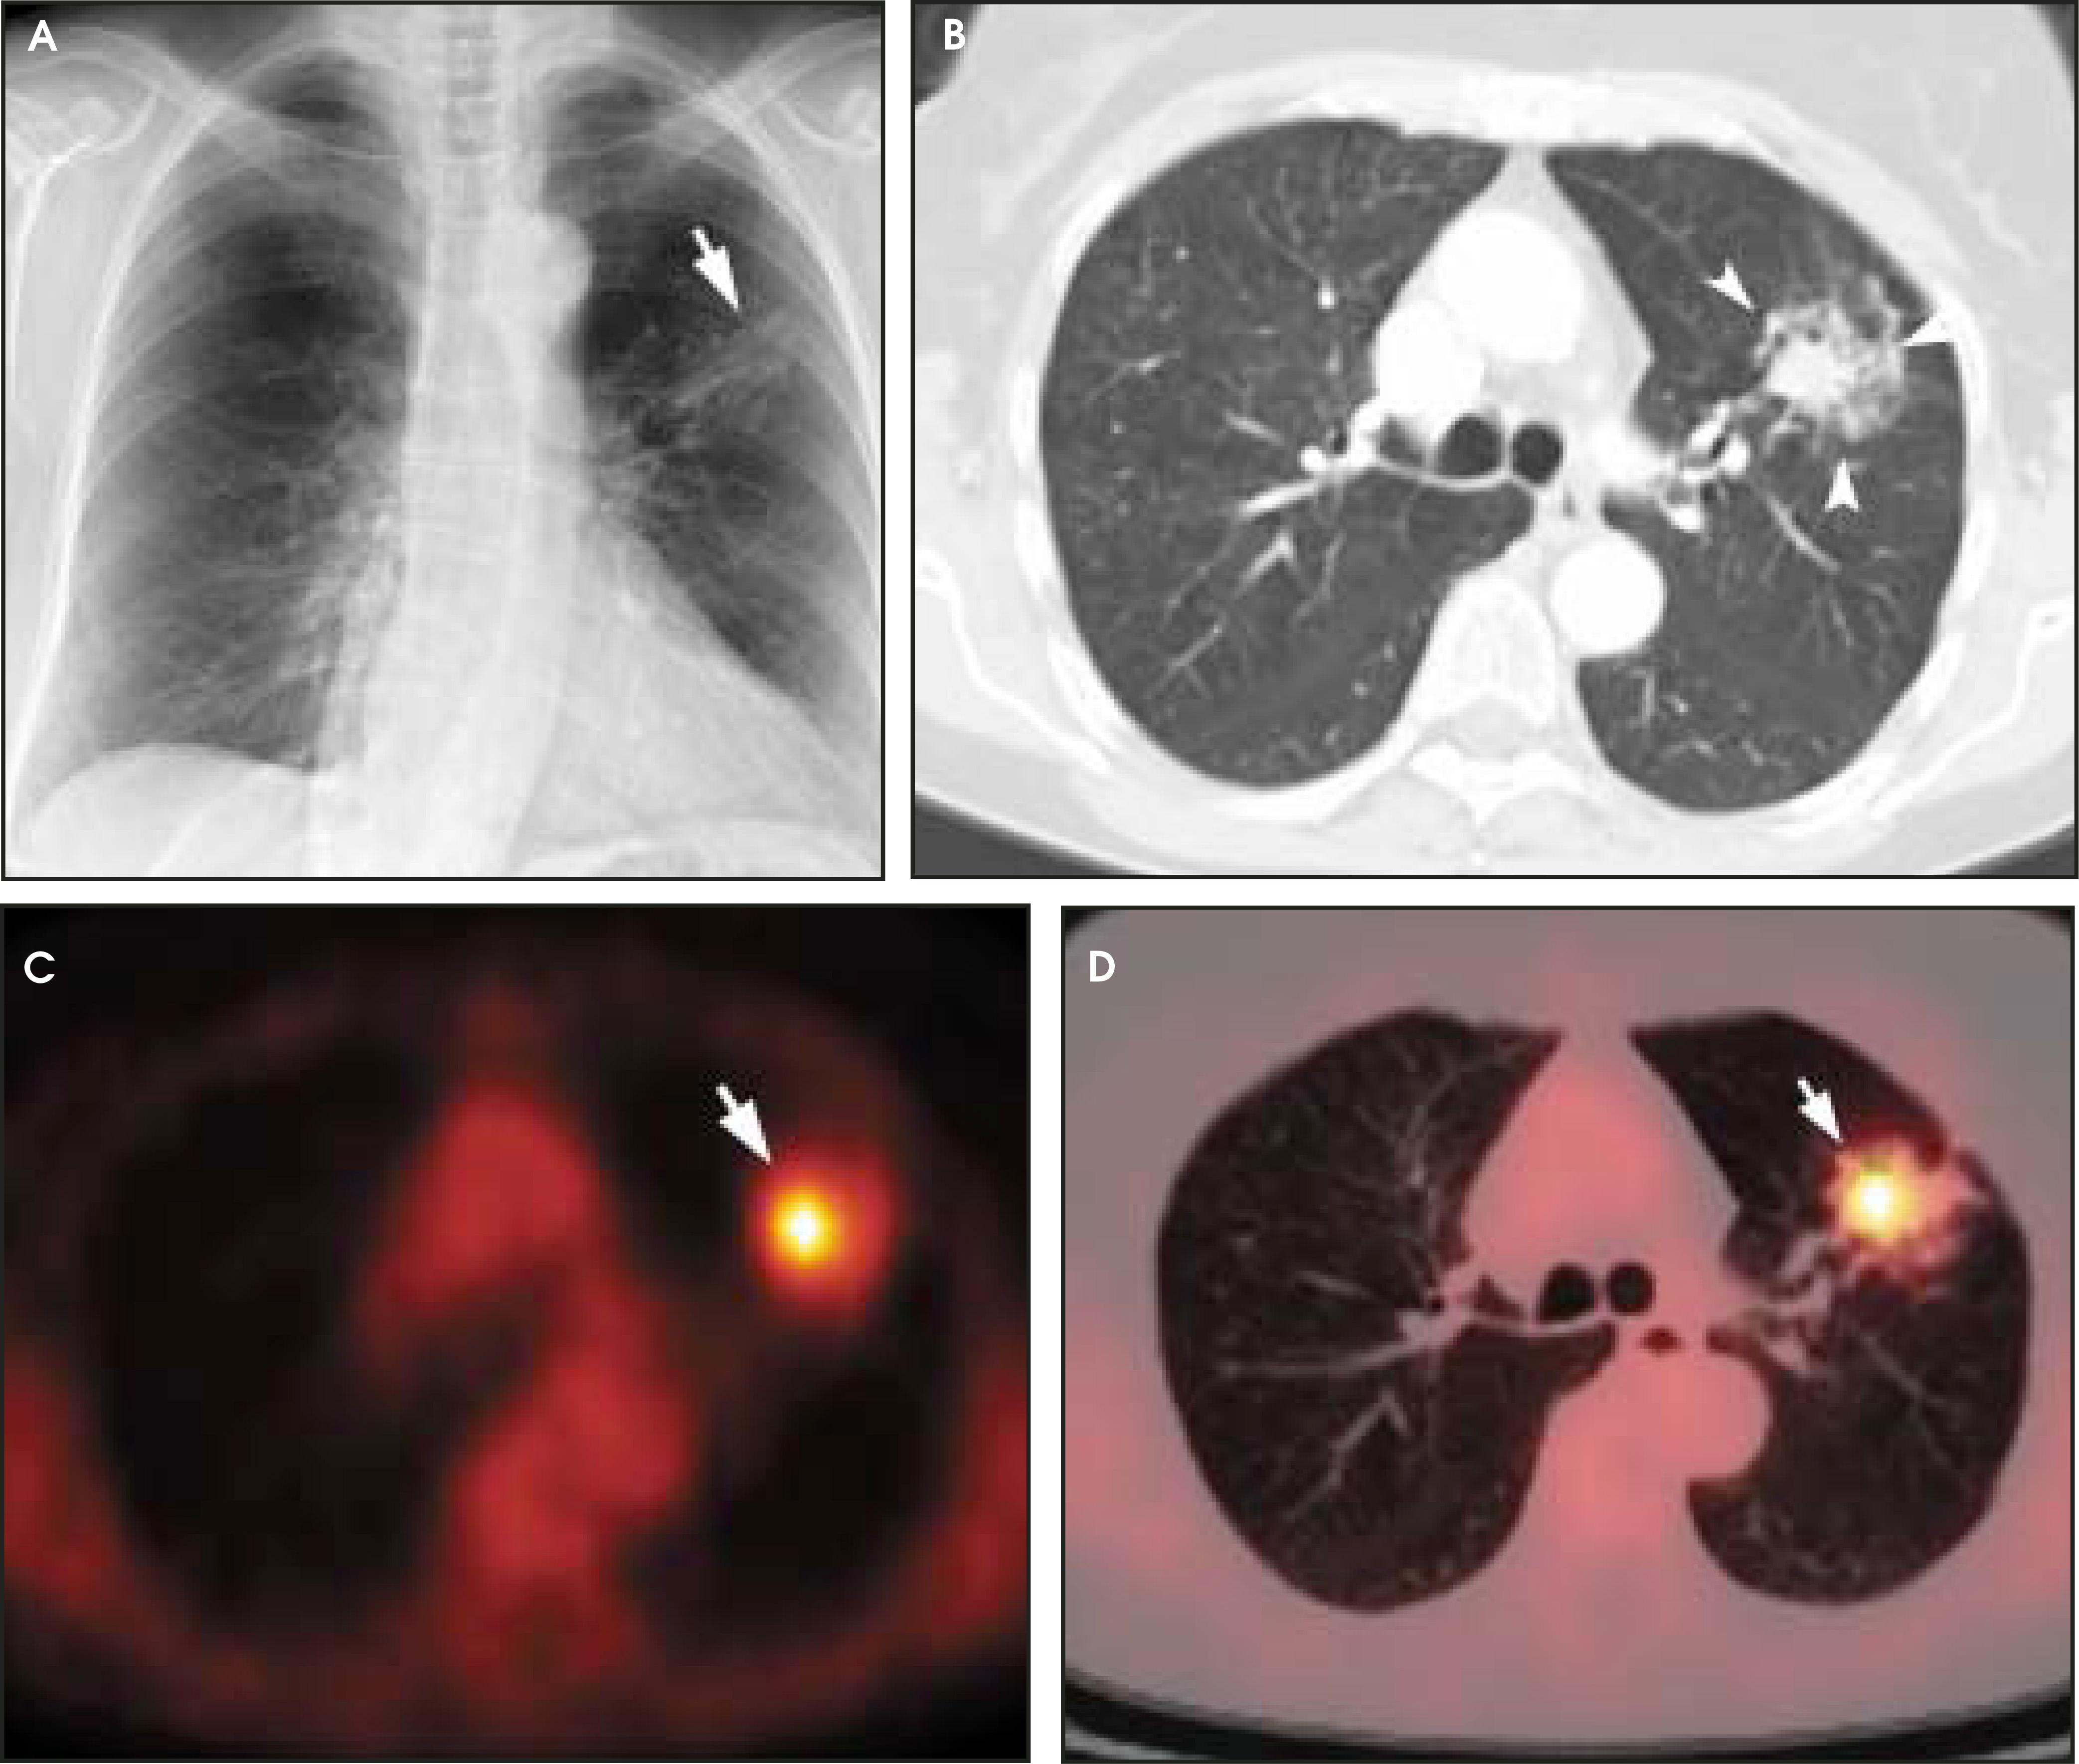
In current practice, the preferred approach to an indeterminate nodule on CT is FDG-PET scanning. Positron emission tomographic scanning allows more precise risk stratification for patients with indeterminate nodules. If the PET scan is negative, follow-up with serial CT scans at 6-month intervals for 2 years is recommended. A positive PET scan requires further investigation either by biopsy or surgery.
Gambhir et al45 compared “watch and wait,” surgery, serial CT, and CT plus PET for the evaluation of SPNs and estimated that the potential cost savings using CT plus PET ranged from $91 to $2200 per patient. Depending on the pretest probability, FDG-PET has decreased surgical procedures by an estimated 15%.2 This translates to a yearly national savings of $62.7 million by decreasing the need for thoracotomies and transthoracic needle aspirations.46
Conclusion
The SPN is a common radiologic finding. There is no single correct management approach, and the workup can often involve extensive and expensive evaluation. Comparison with prior examinations, if available, should always be the first step in evaluation. Additional imaging with contrast-enhanced CT and PET can provide valuable additional information. However, further imaging techniques should be used with the understanding of the true impact of the tests in clinical practice for each patient.
Acknowledgement
The authors would like to thank Dr. Marija Ivanovic, PhD, for her assistance in acquiring the multiple PET images, without which this article would not have been possible.
References
- Lillington G. Management of solitary pulmonary nodules. Dis Mon. 1991;37:271-318.
- Ost D, Fein A. Evaluation and management of the solitary pulmonary nodule. Am J Respir Crit Care Med. 2000;162:782-787.
- Erasmus J, Connolly J, McAdams H. Solitary pulmonary nodules: Part I. Morphological evaluation for differentiation of benign and malignant lesions. RadioGraphics. 2000;20:43-58.
- Kuzucu M, Martin M, Delbeke D, et al. Practical FDG Imaging: A Teaching File. 2001:150-154.
- Viggiano R, Swensen S, Rosenow E. Evaluation and management of solitary and multiple pulmonary nodules. Clin Chest Med. 1992;13:83-95.
- Mountain C. Revisions in the international system for staging lung cancer. Chest. 1997;111:1710-1717.
- Suzuki K, Nagai K, Yoshida J. Prognostic factors in clinical stage I non-small cell cancer. Ann Thorac Surg. 1999;67:927-932.
- Midthun D, Swensen S, Jett J. Approach to the solitary pulmonary nodule. Mayo Clin Proc. 1993;68:378-385.
- Leef J, Klein J. The solitary pulmonary nodule. Radiol Clin N Am. 2002;40:123-143.
- Murthy S, Rice T. The solitary pulmonary nodule: A primer on differential diagnosis. Semin Thorac Cardiovasc Surg. 2002;14:239-249.
- Higgins G, Shields A, Keehm R. The solitary pulmonary nodule: Ten year follow up of Veterans Administration Armed Forces Cooperative Study. Arch Surg. 1975;110:570-575.
- Dewan N, Shehan C, Reeb S. Likelihood of malignancy in a solitary pulmonary nodule. Comparison of Bayesian analysis and results of FDG-PET scan. Chest. 1997;112:416-422.
- Erasmus J, McAdams H, Connolly J. Solitary pulmonary nodules: Part II. Evaluation of the indeterminate nodule. RadioGraphics. 2000;20:59-66.
- Gurney J. Determining the likelihood of malignancy in solitary pulmonary nodules with Bayesian analysis I. Theory. Radiology. 1993;186:405-413.
- Webb W. Radiological evaluation of the solitary pulmonary nodule. AJR Am J Roentgenol. 1990;154:701-708.
- Berger W, Erly W, Krupinski E. The solitary pulmonary nodule on chest radiography: Can we really tell if the nodule is calcified?. AJR Am J Roentgenol. 2001;176:201-204.
- Zerhouni E, Stitik F, Siegelman S. CT of the pulmonary nodule: A cooperative study. Radiology. 1986;160:319-327.
- Seigelman S, Khouri N, Leo F. Solitary pulmonary nodules: CT assessment. Radiology. 1986;160:307-312.
- Yankelevitz D, Reeves A, Kostis W. Small pulmonary nodules: Volumetrically determined growth rates based on CT findings. Radiology. 2000;217:251-256.
- Yankelevitz D, Gupta R, Zhao B. Small pulmonary nodules: Evaluation with repeat CT—preliminary experience. Radiology. 1999;212:561-566.
- Lillington G, Caskey C. Evaluation and management of solitary pulmonary nodules. Clin Chest Med. 1993;14:111-119.
- Geddes D. The natural history of lung cancer: A review based on rates of tumor growth. Br J Dis Chest. 1979;73:1-16.
- Seigelman S, Zerhouni E, Leo F. CT of the solitary pulmonary nodule. AJR Am J Roentgenol. 1980;135:1-13.
- Hartman T. Radiological evaluation of the solitary pulmonary nodule. Semin Thorac Cardiovasc Surg. 2002;14:261-267.
- Zwirewich C, Vedal S, Miller R. Solitary pulmonary nodule: High resolution CT and radiologic-pathologic correlation. Radiology. 1991;179:469-476.
- Furuya K, Murayama S, Soeda H. New classification of small pulmonary nodules by margin characteristics on high resolution CT. Acta Radiol. 1999;40:496-504.
- Carucci L, Maki D, Miller W. Clustered pulmonary nodules: Highly suggestive of benign disease. J Thorac Imaging. 2001;16:103-105.
- Blum U, Windfuhr M, Buitrago-Tellez C. Invasive pulmonary aspergillosis: MRI, CT and plain radiographic findings and their contribution for early diagnosis. Chest. 1994;106:1156-1161.
- Khan A, Herman P, Vorweck P. Solitary pulmonary nodules: Comparison of classification with standard, thin section, and reference phantom CT. Radiology. 1991;179:477-481.
- Swensen S, Yamashita K, McCollough C. Lung Nodules: Dual-kilovolt peak analysis with CT- Multicenter study. Radiology. 2000;214:81-85.
- Seigelman S, Khouri N, Scott W. Pulmonary hamartoma: CT findings. Radiology. 1986;160:313-317.
- Swensen S, Viggiano R, Midthun D. Lung nodule enhancement at CT: Multicenter study. Radiology. 2000;214:73-80.
- Phelps M, Debelke D, Martin W, Patton J, Sandler M. Practical FDG Imaging. A Teaching File. 2001:13-14.
- Warburg O. On the origin of cancer cells. Science. 1956;123:309-314.
- Lowe V, Fletcher J, Gobar L. Prospective investigation of positron emission tomography in lung nodules. J Clin Oncol. 1998;16:1075-1084.
- Goldsmith S, Kostakoglu L. Role of nuclear medicine in the evaluation of solitary pulmonary nodule. Semin Ultrasound. 2000;21:129-138.
- Lowe V, Hoffman J, DeLong D. Semiquantitative and visual analysis of FDG-PET images in pulmonary abnormalities. J Nucl Med. 1994;35:1771-1776.
- Gupta N, Frank A, Dewan N. Solitary pulmonary nodules: Detection of malignancy with PET with 2-(F-18)-Fluro-2-deoxy-D-glucose. Radiology. 1992;184:441-444.
- Hagge R, Coleman R. Positron emission tomography: Lung cancer. Semin Roentgenol. 2002;37:110-117.
- Gupta N, Gill H, Graeber G. Dynamic positron emission tomography with F-18 flurodeoxyglucose imaging in differentiation of benign from malignant lung/mediastinal lesions. Chest. 1998;114:1105-1111.
- Zhuang H, Pourdehnad M, Lambright E. Dual time point 18F-FDG PET imaging for differentiating malignant from inflammatory processes. J Nucl Med. 2001;42:1412-1417.
- Gould M, Maclean C, Kuschner W. Accuracy of positron emission tomography for diagnosis of pulmonary nodules and mass lesions: A meta analysis. JAMA. 2001;285:914-924.
- Mastin S, Drane W, Harman E. FDG SPECT in patients with lung masses. Chest. 1999;115:1012-1017.
- Muehlehner G, Geagan M, Countryman P. SPECT scanner with PET coincidence capability(abstr). J Nucl Med. 1995;36:70.
- Gambhir S, Shepherd J, Shah B. Analytical decision model for the cost-effective management of solitary pulmonary nodules. J Clin Oncol. 1998;16:2113-2125.
- Gambhir S, Hoh C, Phelps M. Decision tree sensitivity analysis for cost-effectiveness of FDGPET in the staging and management of non-small-cell lung carcinoma. J Nucl Med. 1996;37:1428-1436.
Citation
. Radiologic evaluation of the solitary pulmonary nodule. Applied Radiology. 2004;33(3):13-26. doi:10.37549/AR1227.