Radiological Detection of Cardiac Amyloid: MRI with Pathological Correlation
Applied Radiology — Vol. 52 , Issue 6 , pp. 8 -17
DOI: 10.37549/AR2935
Published: November 1, 2023
Keywords
Cardiac amyloid, CMR, Late gadolinium enhancement
Categories
Approximately 50% of patients with light chain (AL) amyloidosis have cardiac amyloidosis (CA) and 30% of patients over 75 years with heart failure with preserved ejection fraction have transthyretin (ATTR) amyloidosis.1 Cardiac MRI (cMRI) is the primary imaging modality for CA, with a high sensitivity and specificity for evaluating AL and ATTR. However, the diagnostic accuracy and clinical relevance of the MRI findings depend on the pretest probability of these conditions.2 Although over 50 proteins cause amyloidosis, AL and ATTR are most commonly responsible for cardiac amyloidosis.3
The AL type includes multiple myeloma, monoclonal gammopathy of undetermined significance (MGUS), and Waldenstrom macroglobulinemia, while the ATTR type is typically age-related or results from a mutation in transthyretin. Various laboratory, imaging, and histopathological investigations (Table) are undertaken to detect and monitor systemic amyloidosis according to the type of protein involved.
Cardiac amyloidosis can cause a low-voltage electrocardiogram. Deposition of amyloid protein can increase myocardial and valve thickness and left ventricle (LV) mass, cause bi-atrial enlargement and pericardial/pleural effusions. The disease disproportionately affects the basal segments of the heart and often spares the apical segments. Pathognomonic findings of CA are rarely present. Mostly, findings of CA are nonspecific and can mimic those of other diseases. Cardiac findings often must be contextualized with extracardiac signs. For example, in the absence of a monoclonal protein in serum or urine, increased myocardial pyrophosphate (PYP) uptake has >99% specificity and positive predictive value for cardiac ATTR amyloidosis.4
Cardiac MRI
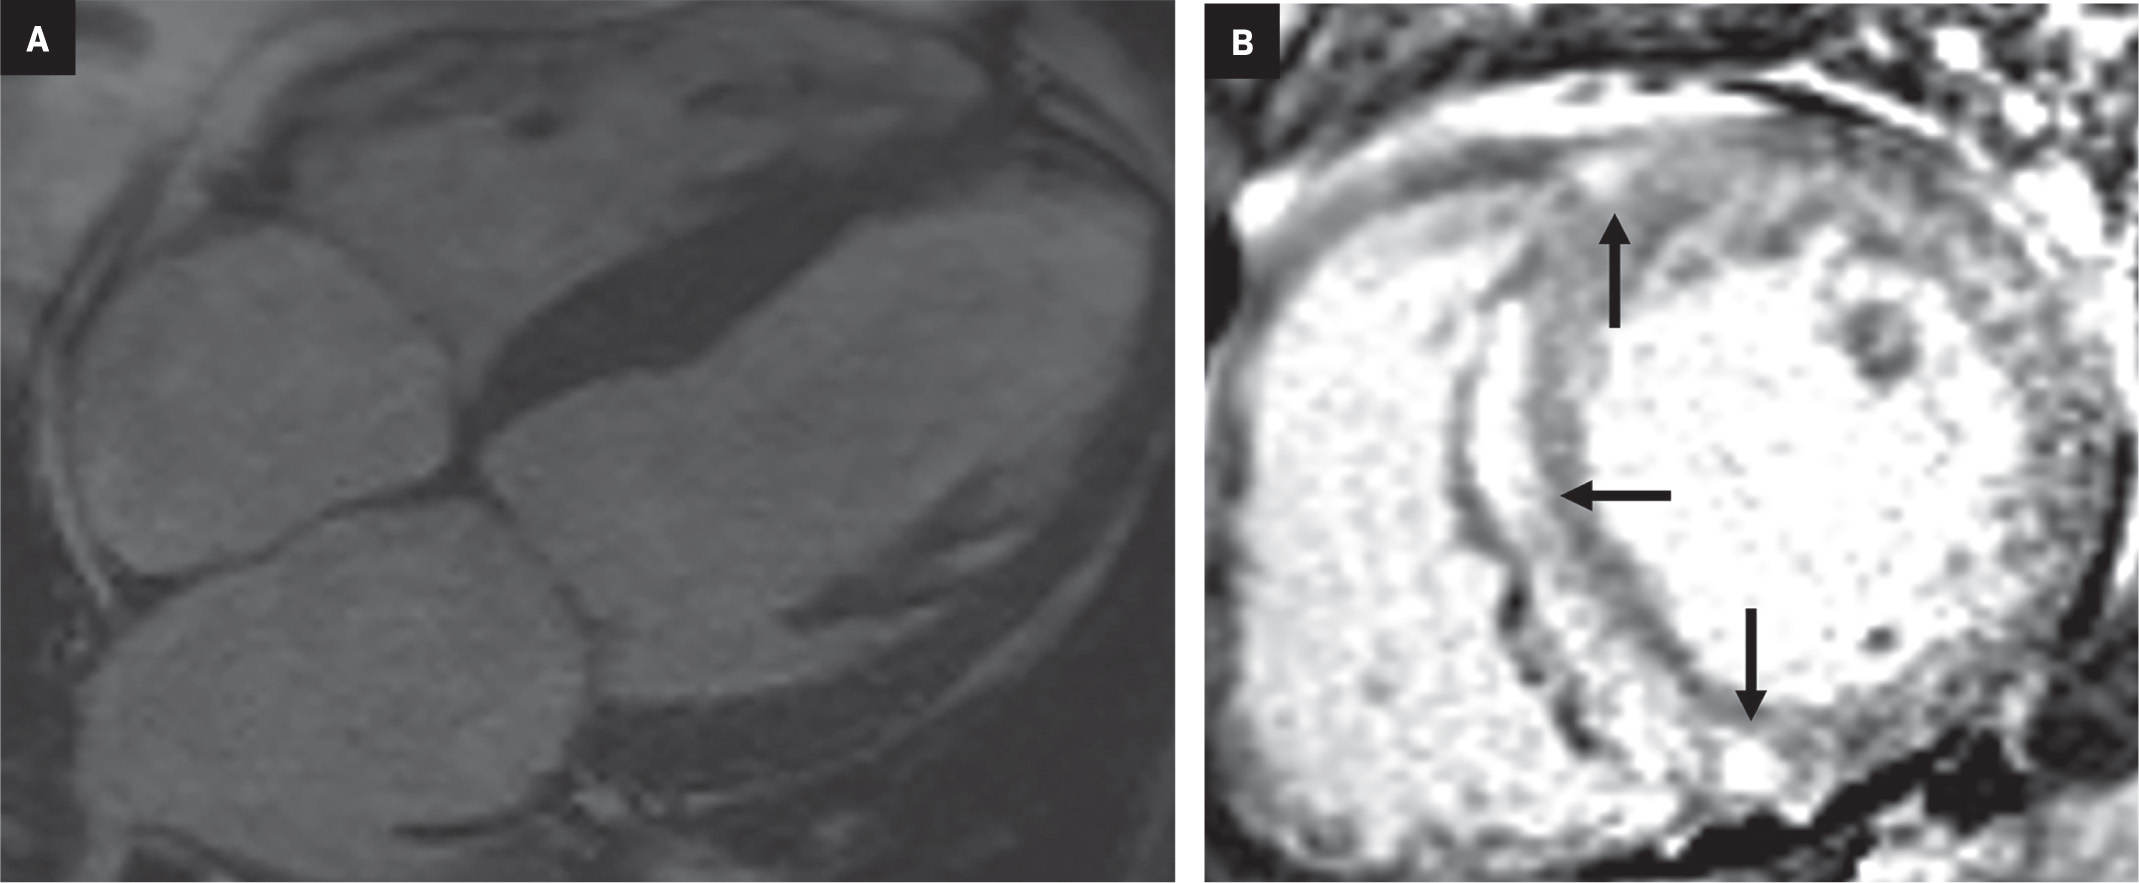
On cMRI, cardiac amyloidosis typically leads to diffuse subendocardial or transmural late gadolinium enhancement (LGE) and elevated native T1 and extracellular volume (ECV), dark blood pool on LGE images, inversion of time to myocardial and blood pool nulling, and difficulty nulling the myocardium on T1 scout.5 LGE predominates in the basal segments of the myocardium (Figure 1) due to heterogeneous mechanical dysfunction, defined as a myocardial longitudinal strain impairment pattern. Progression from subendocardial (Figure 2) to diffuse transmural LGE (Figure 3) correlates with disease progression.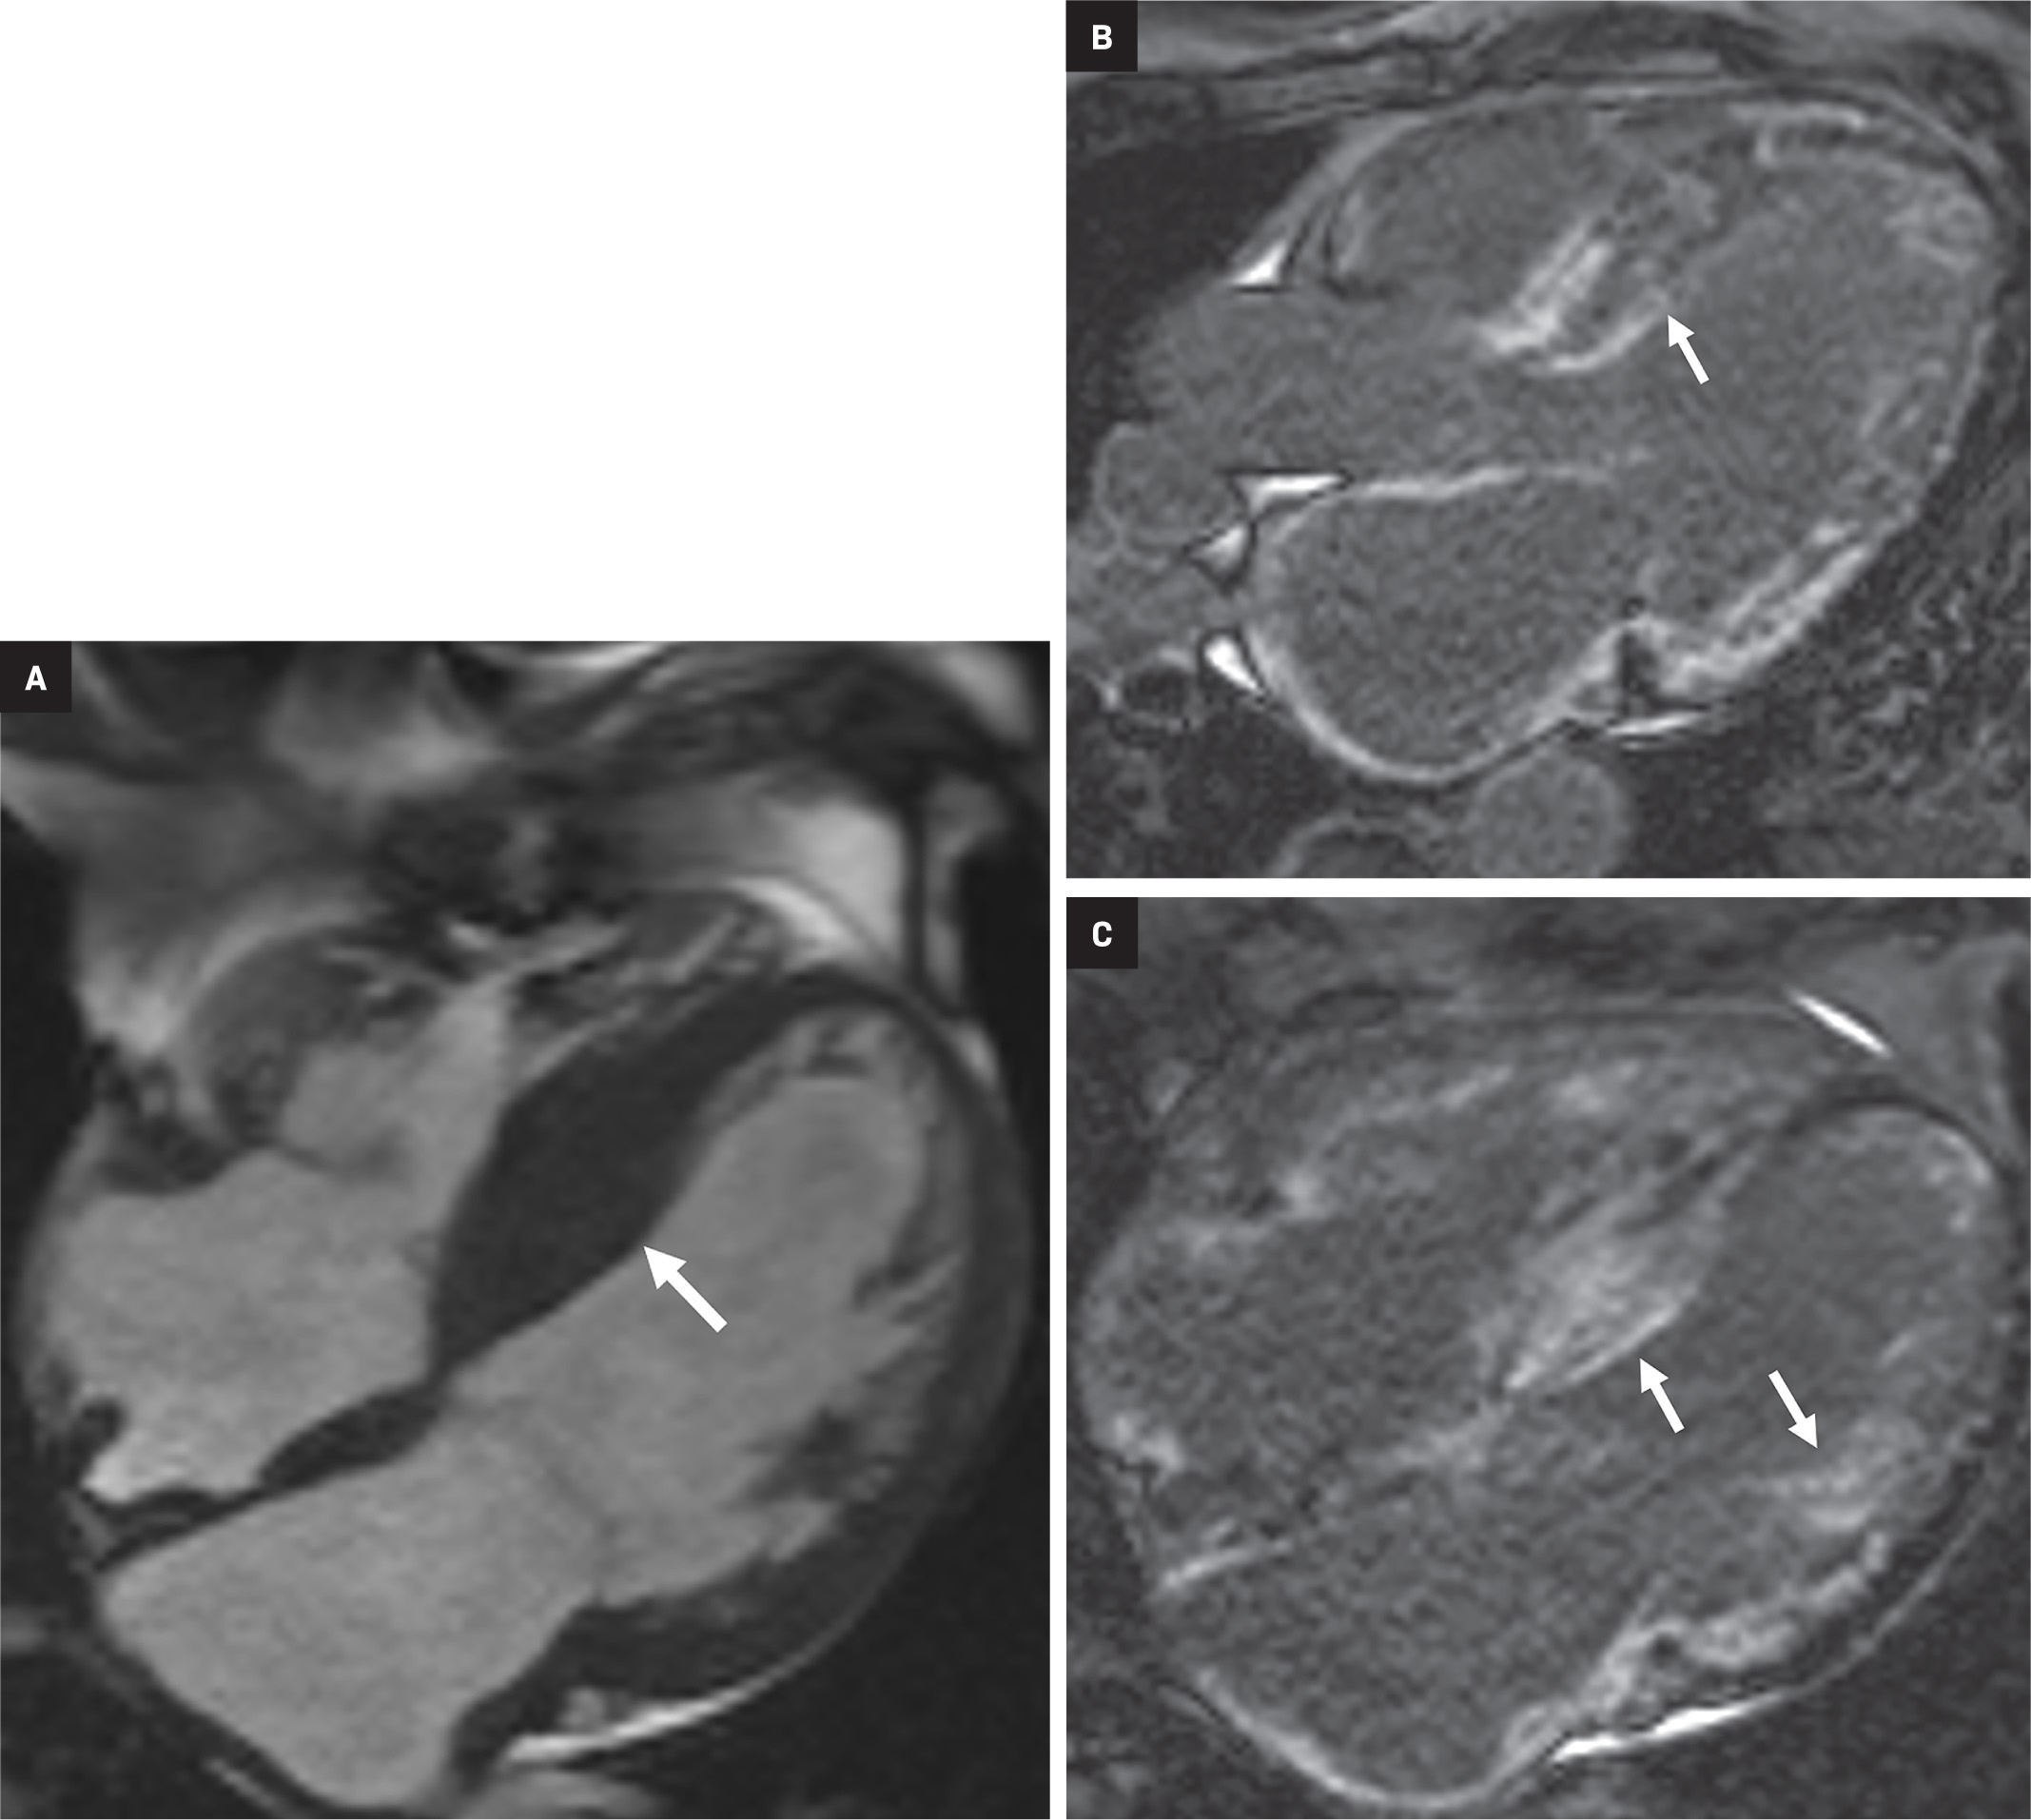
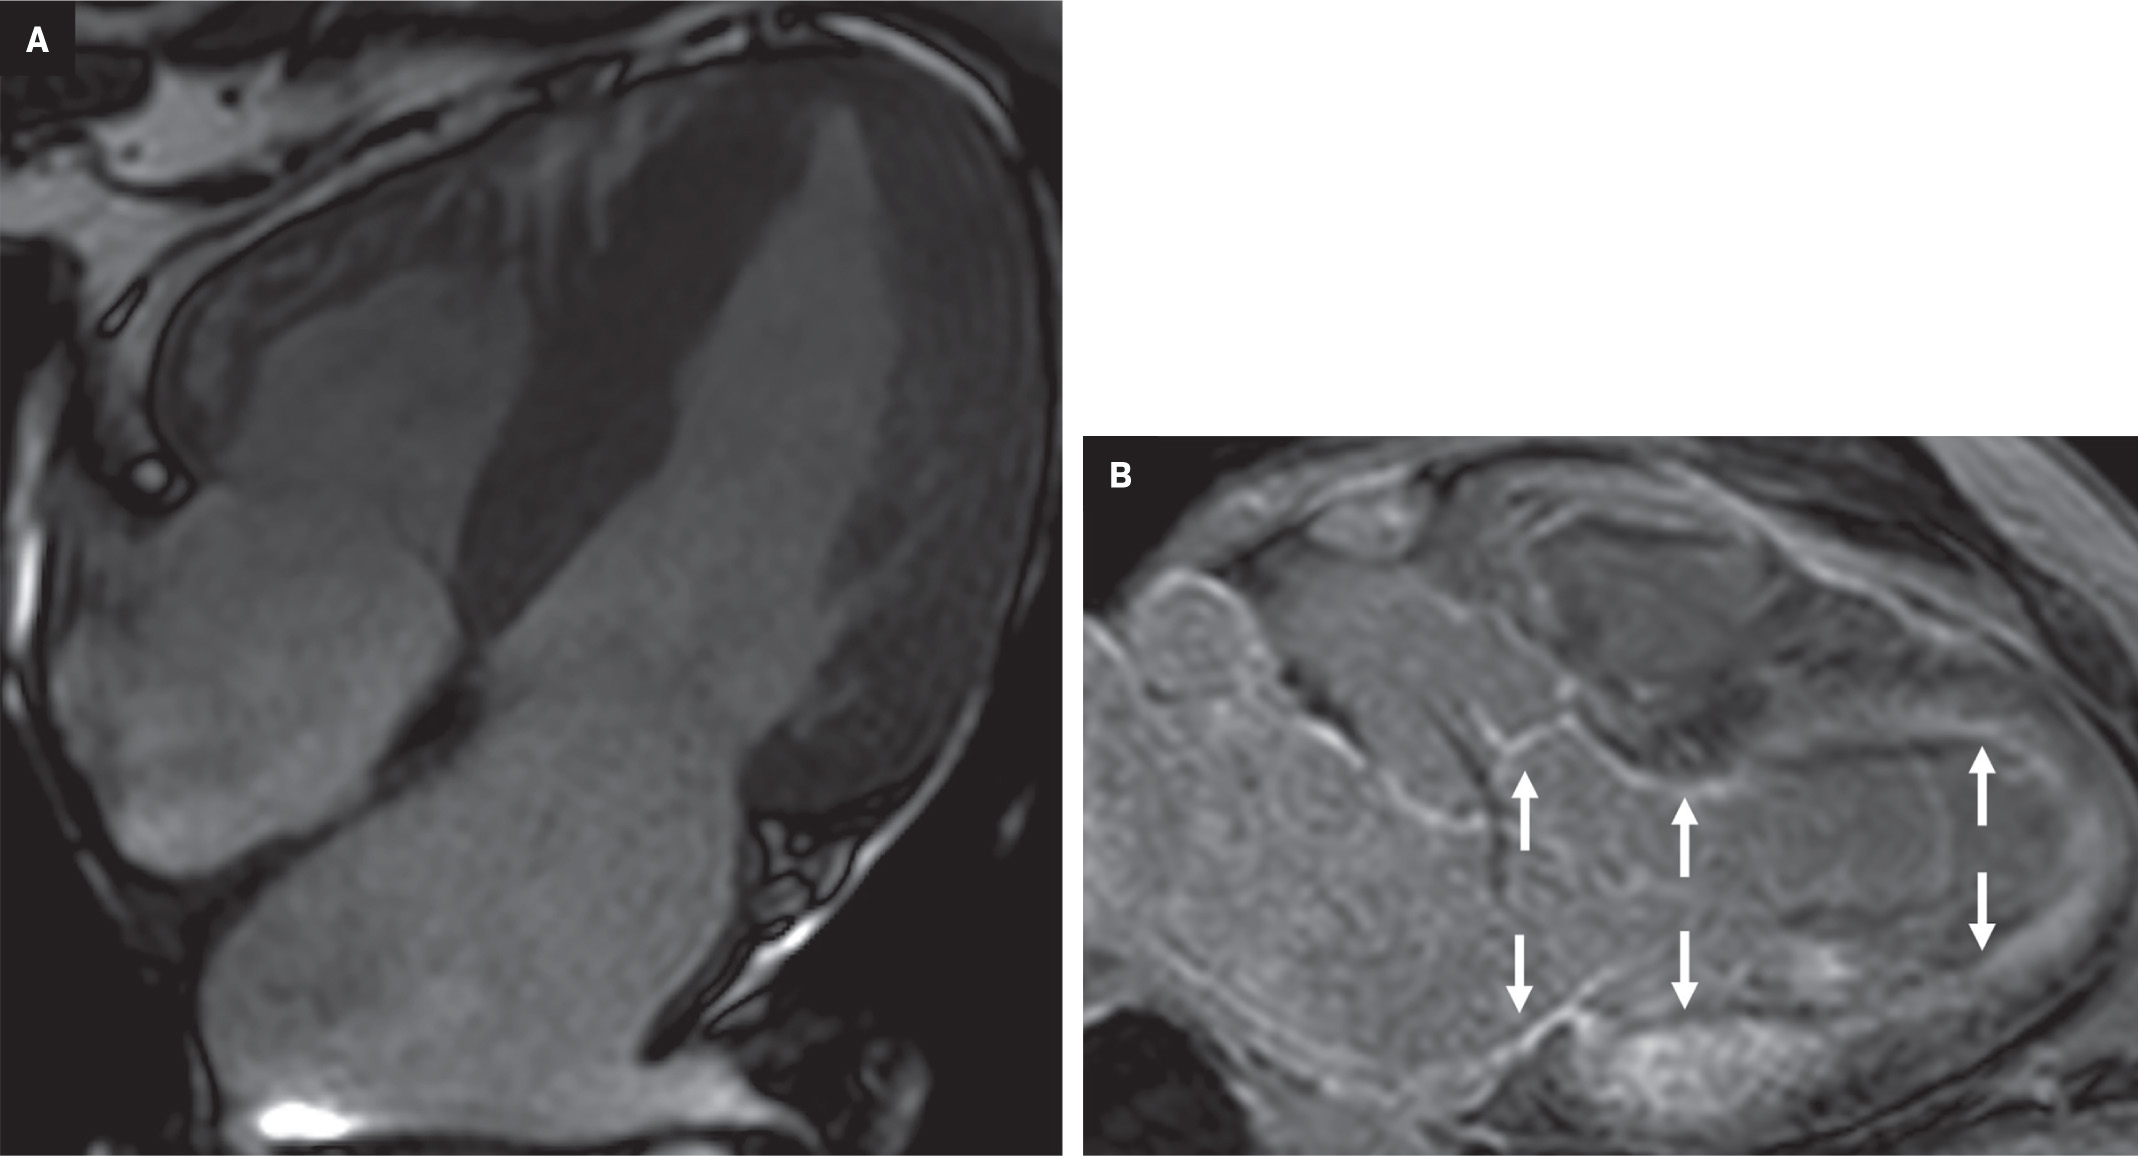
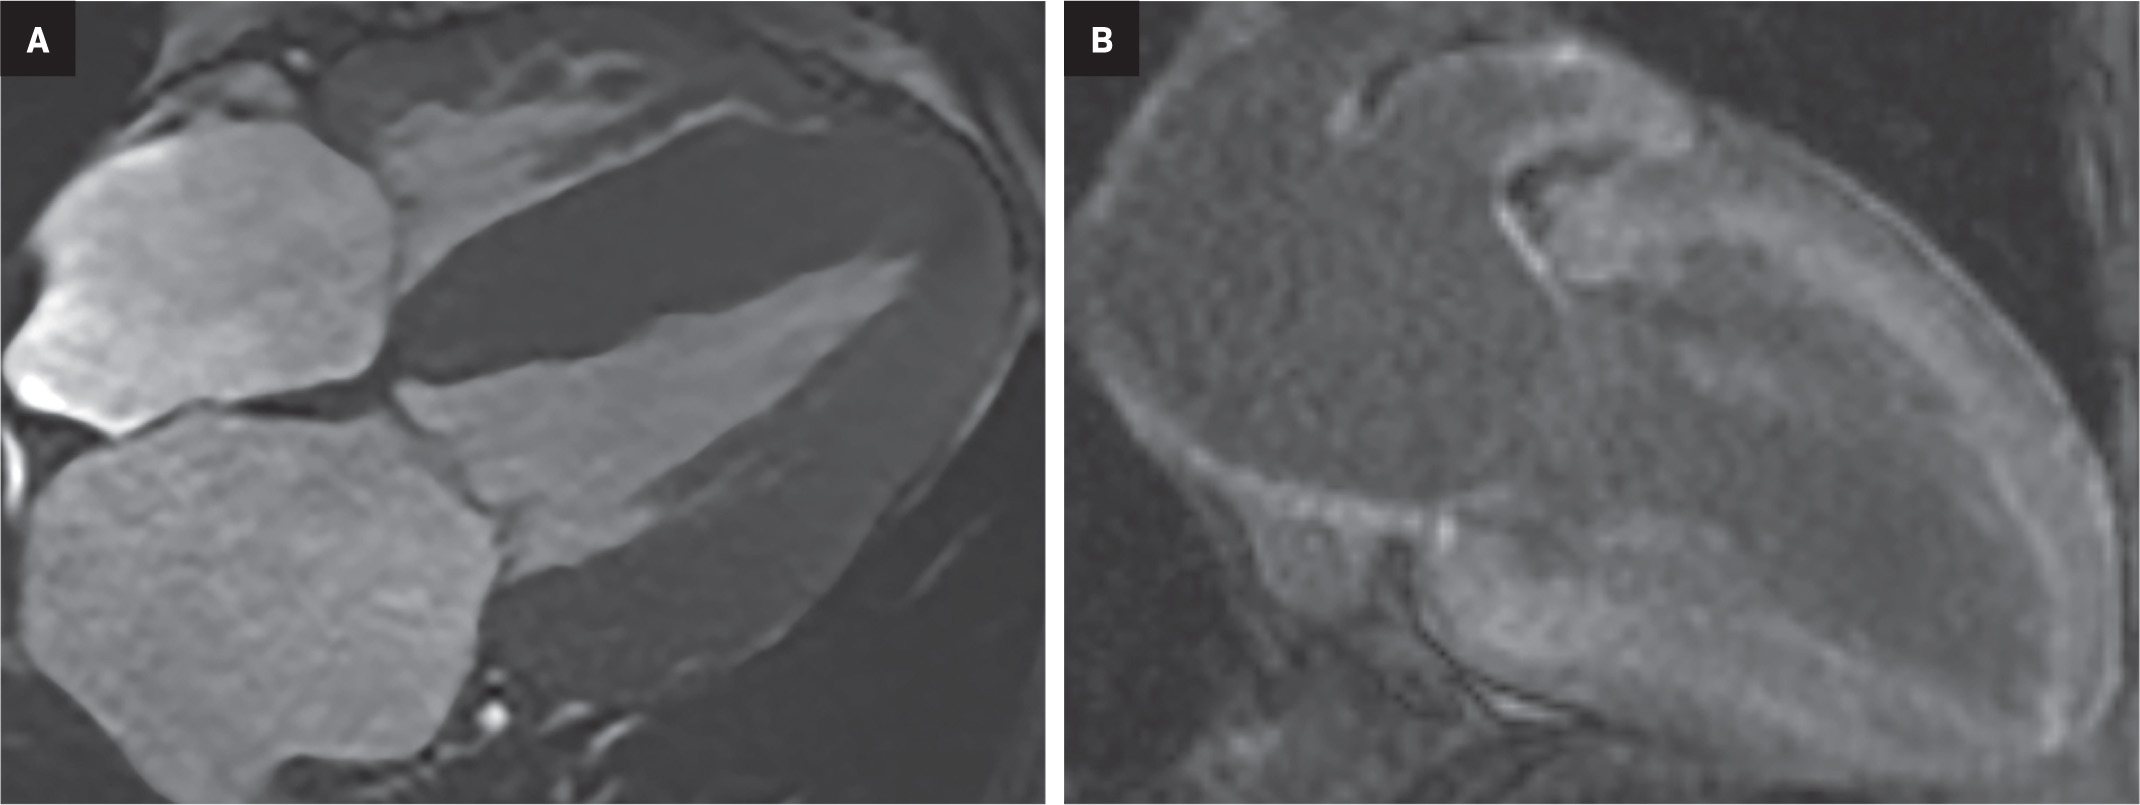
Atypical patterns of LGE (Figure 4) include focal patchy LGE, subepicardial LGE, and diffuse patchy LGE.3 Extensive and transmural LGE and asymmetric septal thickening are more commonly associated with ATTR amyloidosis.6 According to a recent meta-analysis, the sensitivity and specificity of CMR against endomyocardial biopsy reference was found to be 85.7% and 92.0%, respectively.7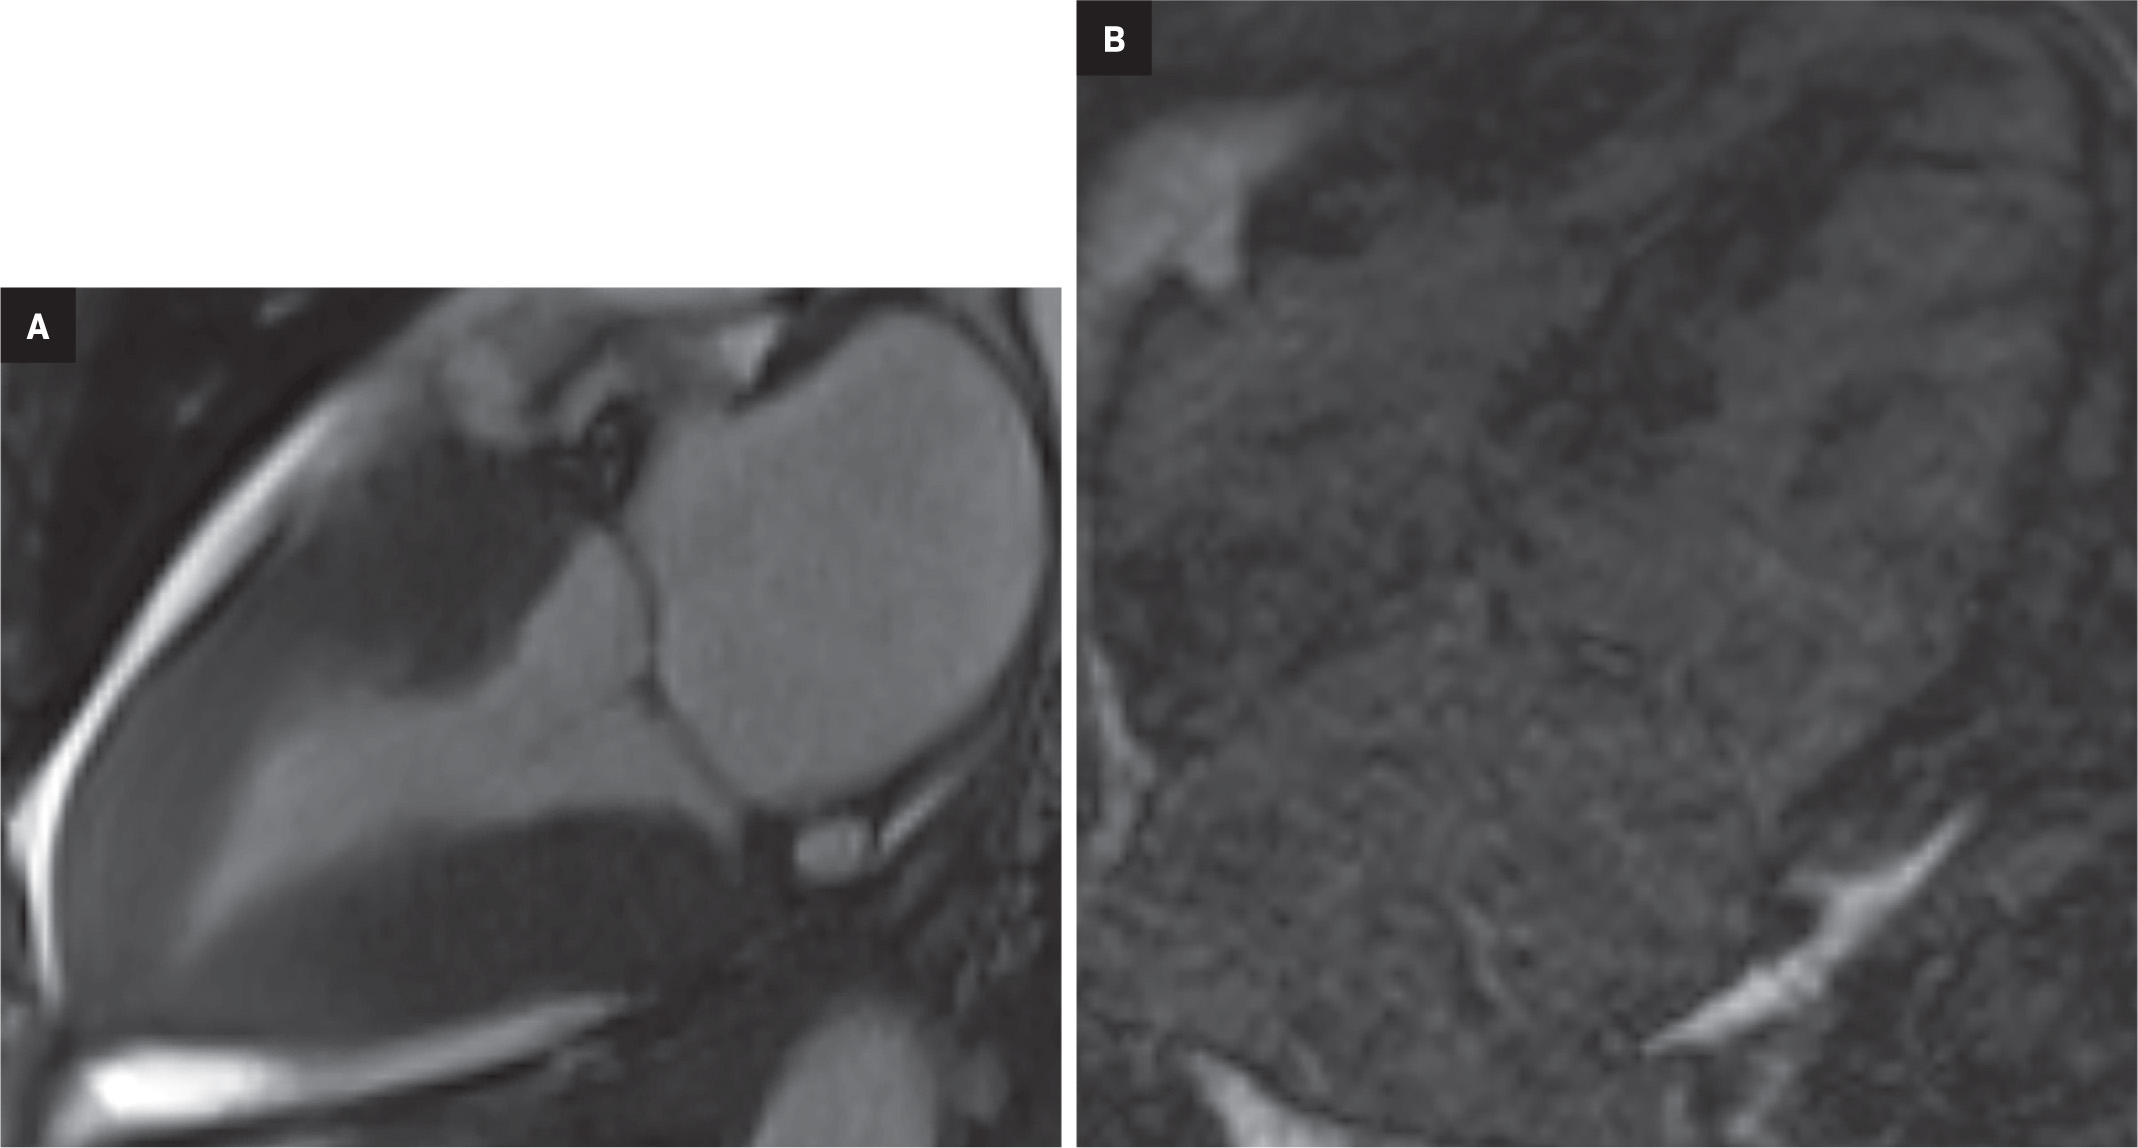
Recent advancements in cardiac imaging techniques rely on quantitative myocardial assessment to detect cardiomyopathies. Native T1 mapping illustrates the absolute T1 relaxation times on a pixel-by-pixel basis. Unlike LGE, which is influenced by windowing and nulling, T1 mapping enables direct quantification of T1 values. This characteristic allows T1 mapping to potentially identify diffuse structural changes in the myocardium that may not be detectable through other noninvasive methods like LGE.
The primary factors contributing to increased native T1 values are edema (increased tissue water content seen in conditions like acute infarction or inflammation) and an expansion of the interstitial space (such as fibrosis in infarction, cardiomyopathy, and amyloid deposition). On the other hand, low native T1 values are associated with lipid overload (eg, Anderson-Fabry disease, lipomatous metaplasia in chronic myocardial infarction) and iron overload. Native T1 values represent a combined signal from myocytes and ECV, which can sometimes lead to pseudonormalization of abnormal values. Notably, native T1 mapping can be performed even in patients with severe renal impairment, for whom the use of gadolinium-based contrast agents is not suitable.
Contrast-enhanced T1 mapping is primarily used in combination with native T1 mapping to determine the ECV fraction. Standard gadolinium-based contrast agents are distributed in the extracellular space, leading to a decrease in myocardial T1 relaxation times proportional to the local gadolinium concentration. Consequently, areas with fibrosis and scar tissue exhibit shorter T1 relaxation times, particularly after contrast administration. The hematocrit level reflects the cellular component of blood. Measuring the ECV, which encompasses the interstitium and extracellular matrix, involves obtaining T1 values of myocardial tissue and blood before and after administering contrast agents, along with the patient’s hematocrit value. ECV serves as an indicator of myocardial tissue remodeling and provides a measurement unit that aligns with physiological understanding.
Normal ECV values of around 25.3% (at 1.5 T) have been observed in healthy individuals. Apart from amyloid deposition, an increased ECV is commonly associated with excessive collagen deposition, making it a more reliable measure of myocardial fibrosis. Conversely, low ECV values are found in cases of thrombus formation and fat/lipomatous metaplasia. ECV can be calculated for specific myocardial regions or visualized using ECV maps. Elevated native T1 is 89% sensitive and 80% specific, and increased ECV is 93% sensitive and 87% specific for CA.8
Mimics and Mimicry
Detecting cardiac amyloidosis on cMRI is challenging despite advancements in imaging techniques. Additionally, the histopathological evidence required to validate CMR interpretations remains limited. Nonischemic and ischemic cardiomyopathies may mimic cardiac amyloid on imaging.
False-Positive Interpretations
The imaging features of CA may overlap with ischemic heart disease, hypertrophic cardiomyopathy (HCM), hypertensive heart disease, acute myocarditis, and other infiltrative disorders like Anderson-Fabry disease and iron overload. In this section, we discuss specific examples of false-positive interpretations and challenges in accurate identification of CA.
Coronary artery disease (CAD) leads to fibrosis of cardiac tissue causing ischemic cardiomyopathy. In ischemic cardiomyopathy, there is subendocardial and transmural LGE, though the distribution is territorial rather than diffuse. In such instances, quantitative assessment becomes critical. Although native T1 may be increased, ECV is usually normal (Figure 5).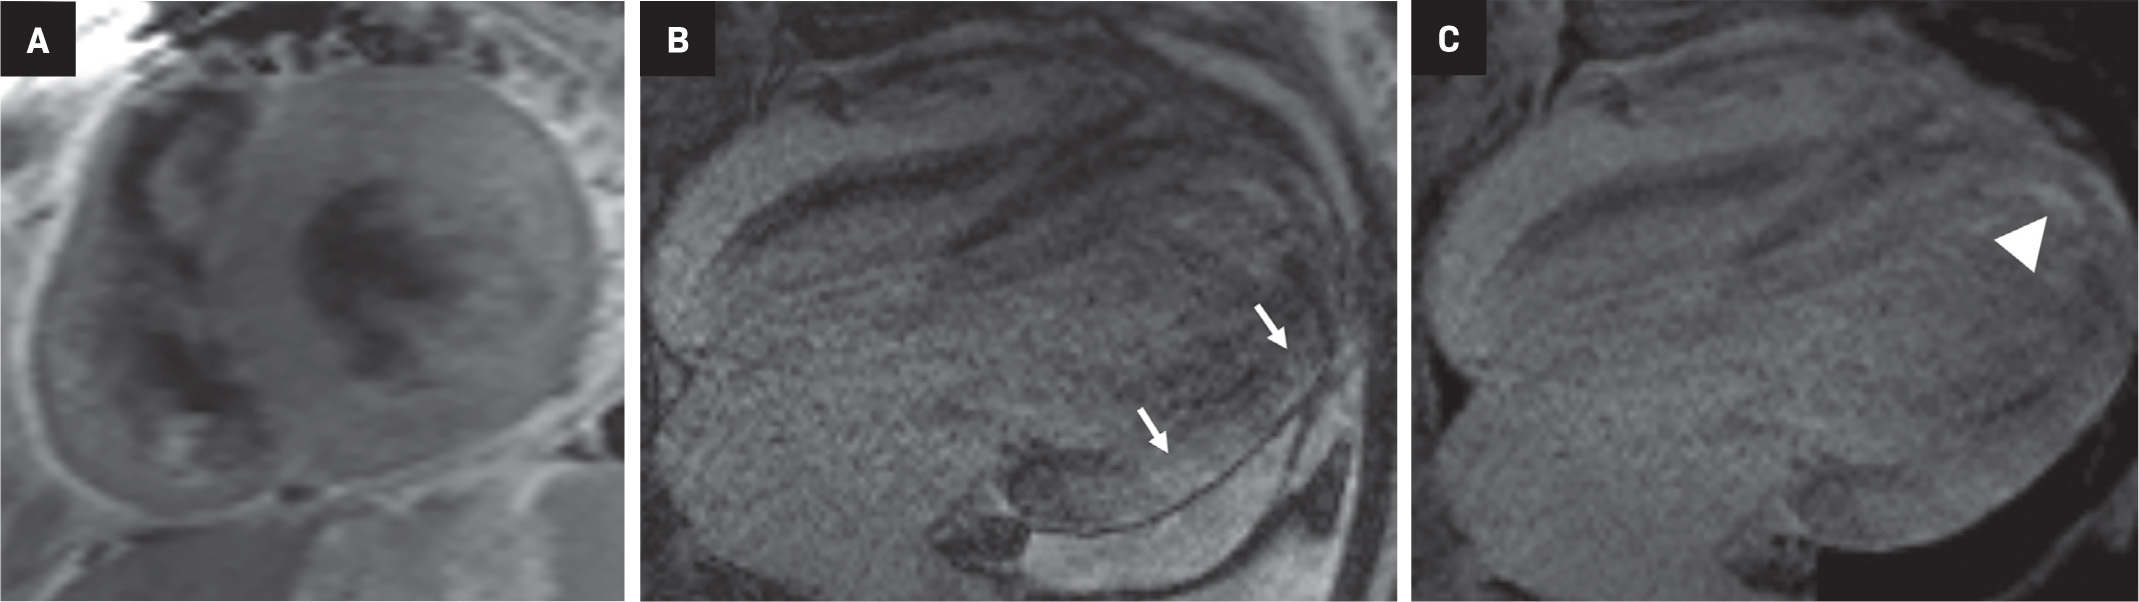
In HCM, asymmetric septal thickening is characteristically seen along with systolic anterior mitral valve movement, causing LV outflow tract (LVOT) obstruction and leading to a high-velocity jet in the LVOT tract. Variations in HCM presentation include apical thickening, symmetric hypertrophy, and absence of LVOT obstruction. The typical LGE pattern seen in HCM is intramyocardial confluent areas representing areas of fibrosis, myocardial disarray, necrosis, and scarring. LGE and T1 mapping play a role in prognostic evaluation.
Poor contrast between blood pool and myocardium, characteristically seen in CA, is nonspecific and can also be seen in HCM. Patients with HCM exhibit high native T1 values as compared to those with healthy hearts or hypertensive heart disease, although the elevation is significantly higher in patients with CA.9,10,11 In HCM, native T1 and ECV are known to be elevated even in the absence of LGE.12 If there is diffuse LGE, the ejection fraction will likely be depressed in a patient with HCM (Figure 6).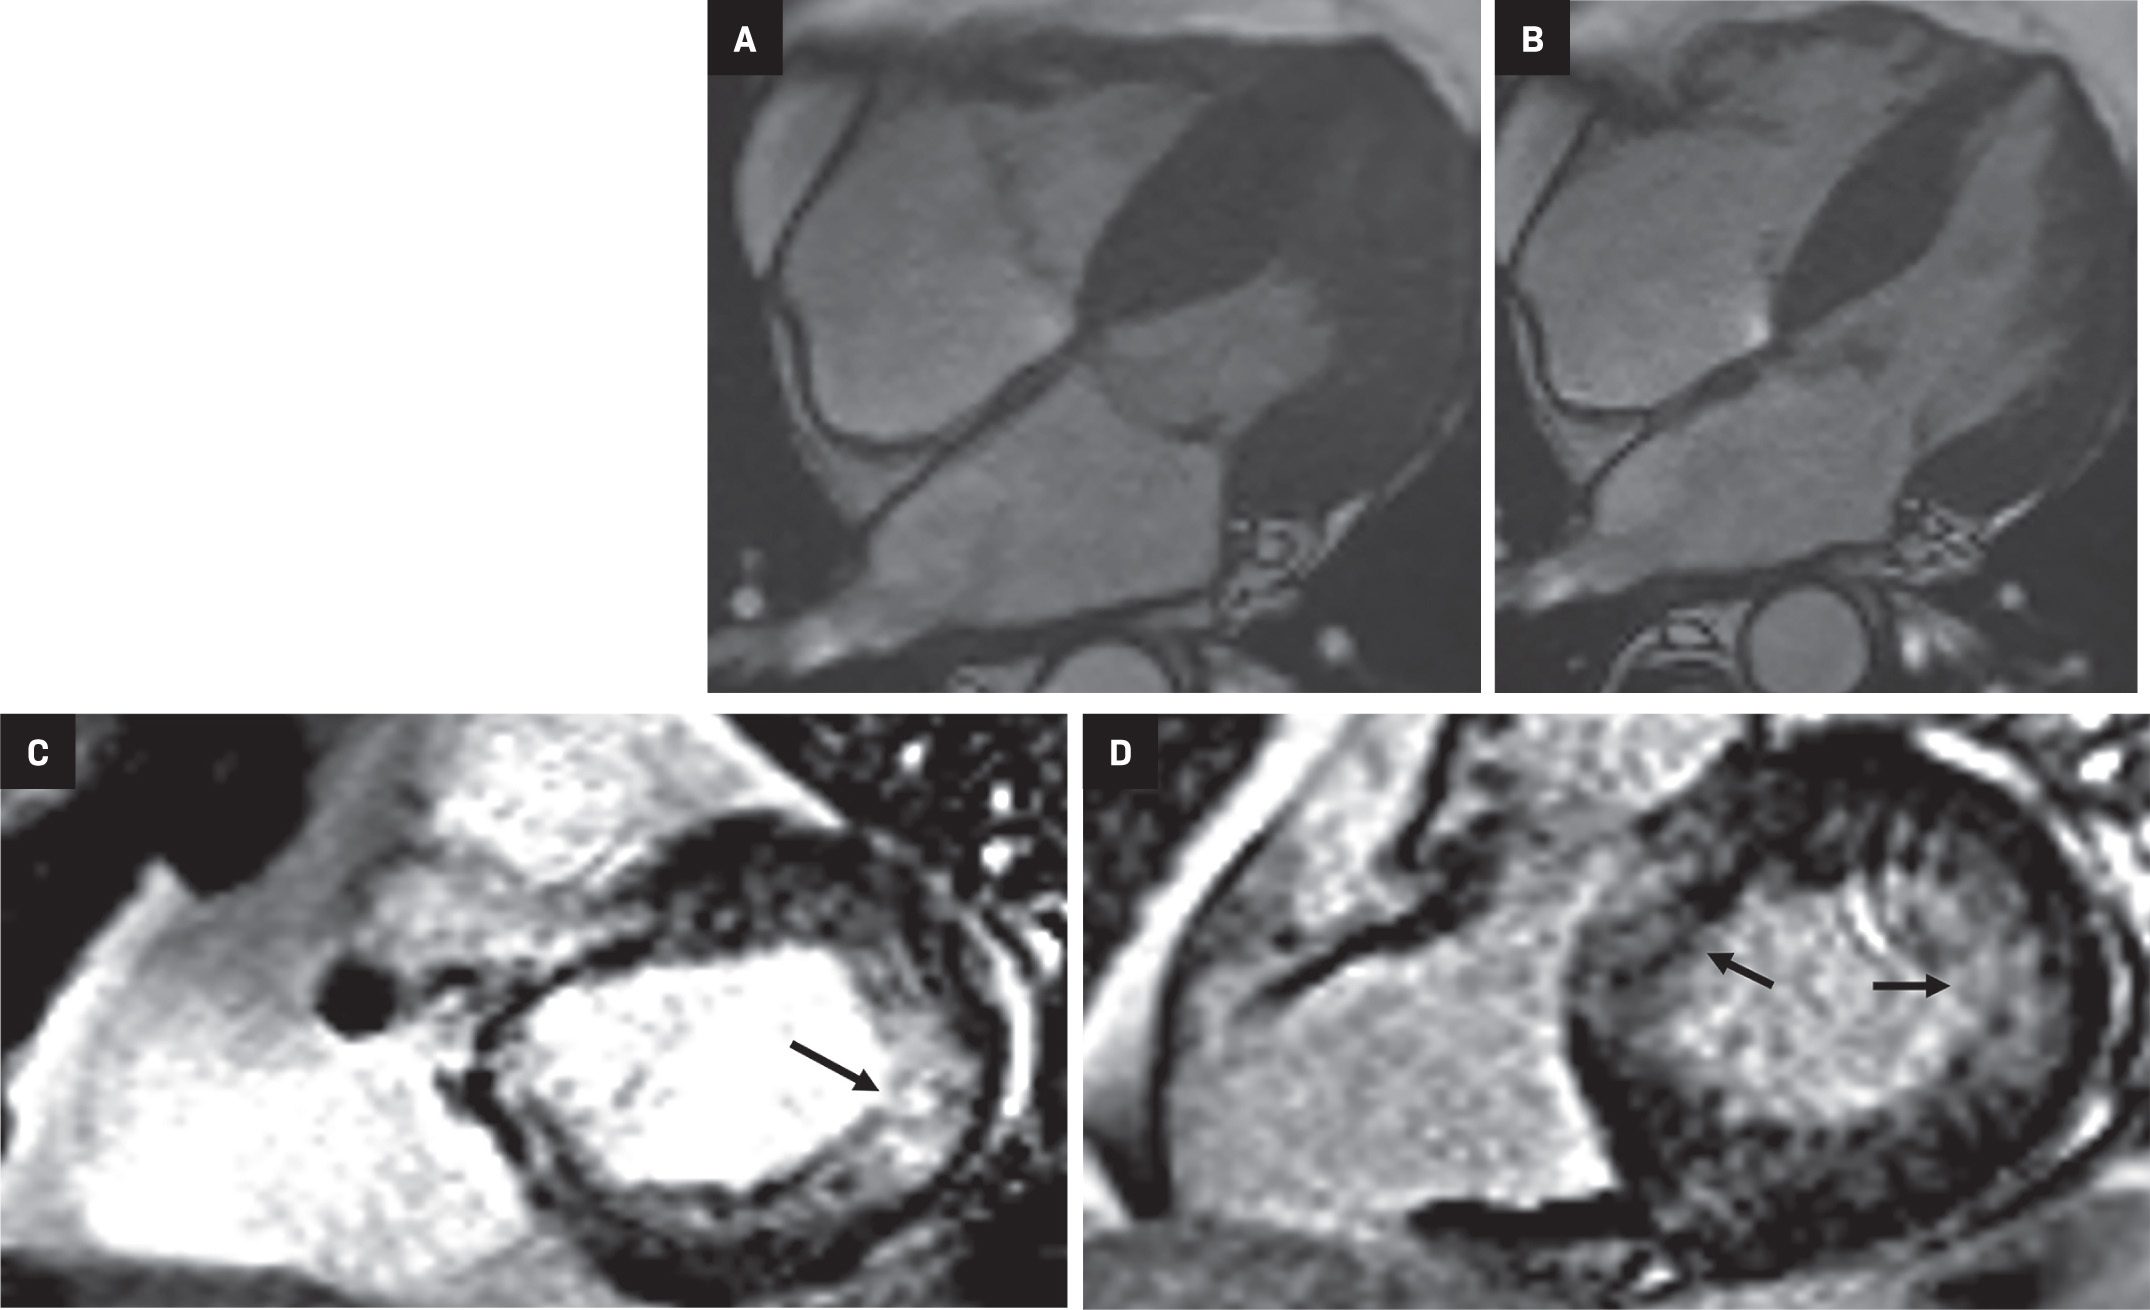
Hypertensive heart disease can resemble CA because it leads to wall thickening, elevated native T1, and LGE which can be variable in extent and distribution. Specifically, when there is left-ventricular wall thickening that cannot be accounted for by arterial hypertension (HTN), it is important to consider the possibility of ATTR amyloidosis, especially in older men.13 Dilated cardiac chambers and reduced ejection fraction that often accompany severe hypertensive cardiomyopathy, as well as a normal myocardial nulling pattern, can provide essential clues to distinguish between the two (Figure 7).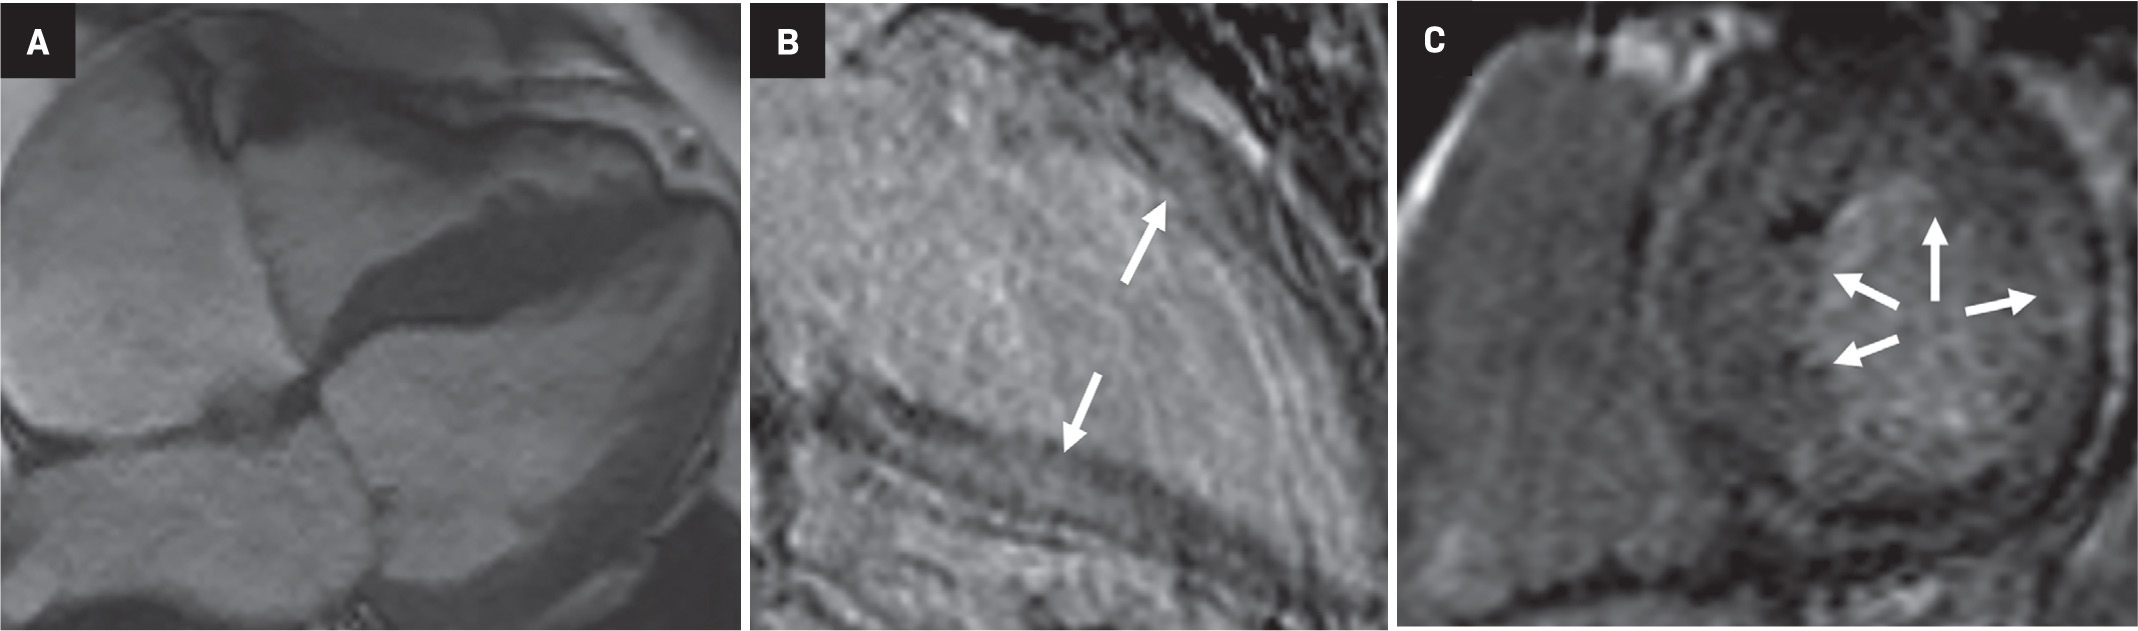
Myocarditis can also mimic CA, although it typically presents acutely and in young persons. Endomyocardial biopsy remains the gold standard for the diagnosis of myocarditis, but the patchy nature of inflammation causes a low rate of detection of ~35%.14 CMR typically shows dilated cardiac chambers and a patchy, nonischemic LGE distribution from epicardium to mid-myocardium.13
Storage disorders like Anderson-Fabry disease and iron overload can also mimic CA. Fabry disease leads to a typical inferolateral midwall LGE pattern. Native T1 values are characteristically decreased and are shown to precede the development of left ventricular hypertrophy (LVH).15
False-Negative Interpretations
False-negative interpretations can result from the presence of concomitant cardiac pathologies and comorbidities, causing atypical imaging findings. The prevalence of calcific aortic stenosis (AS) and CA tends to rise with advancing age, and it is not uncommon for these conditions to coexist in elderly individuals. Identifying CA in patients with AS poses specific challenges owing to similar pathophysiological, clinical, and imaging features between the two conditions. Among individuals with calcifying AS, studies have reported the occurrence of ATTR amyloidosis in approximately 32% of men over age 74.16 However, more recent research indicates a prevalence ranging from 12 to 16%.17,18 Furthermore, patients with both calcifying AS and ATTR amyloidosis have notably poorer survival rates following valve replacement interventions or surgeries when compared to those without amyloidosis.19
Therefore, confirming the diagnosis of CA is crucial as it can guide the therapeutic management of AS and potentially involve the utilization of recently developed pharmacological treatments targeting ATTR amyloidosis. Certain features that point toward concomitant CA in patients with AS include a low-voltage ECG despite LVH, severe biventricular hypertrophy, severe LV longitudinal strain with apical sparing, myocardial granular speckling on echocardiography; and extensive LV LGE with elevated ECV on CMR.20 (Figure 8)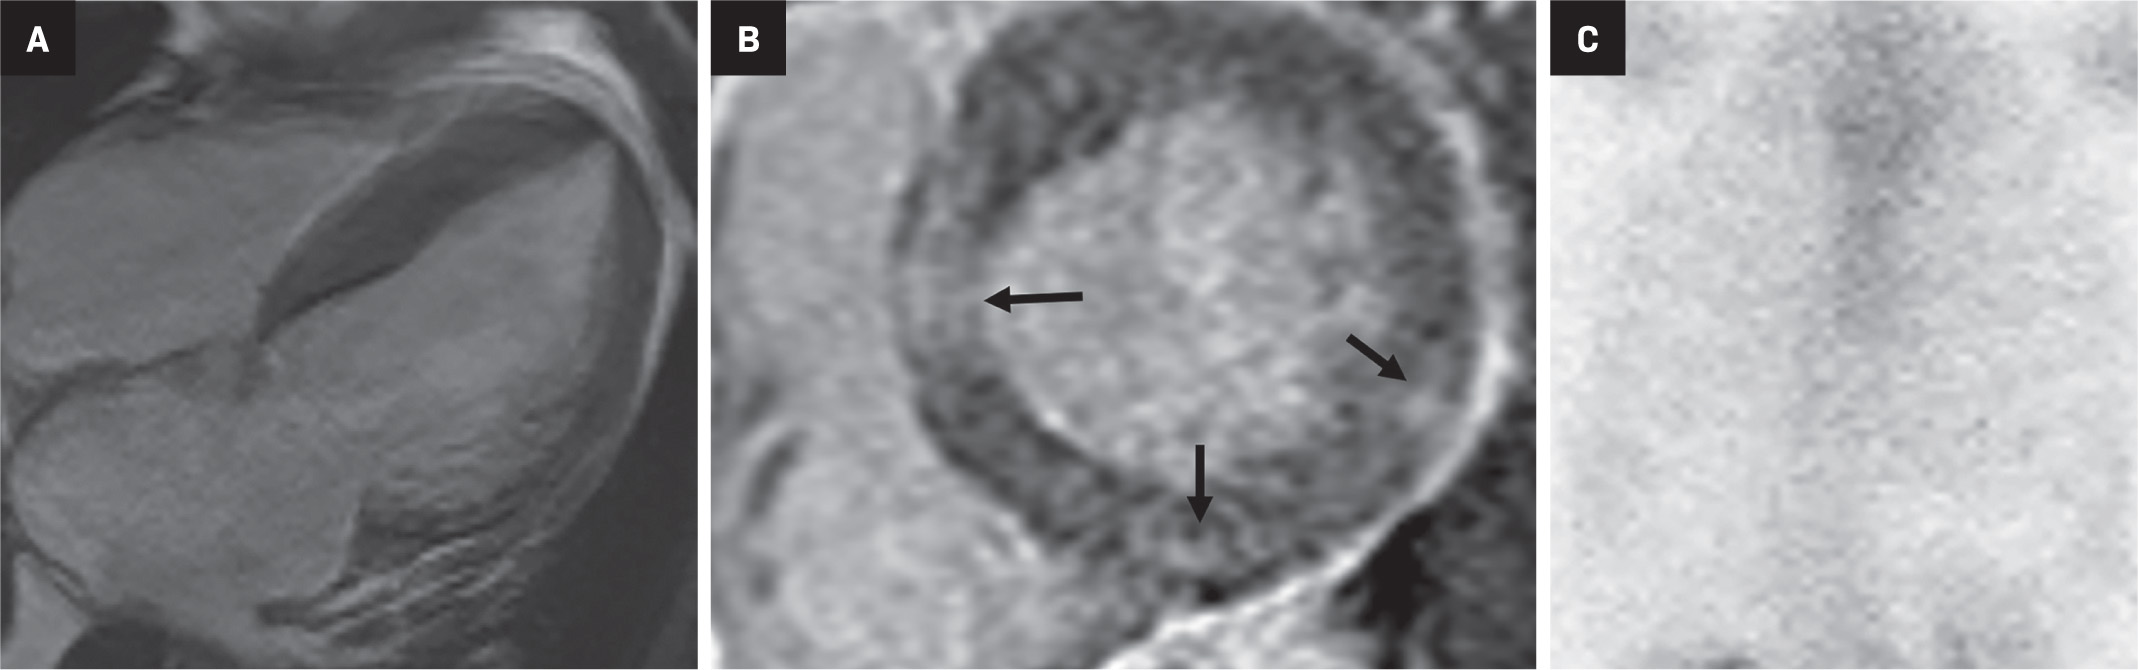
Idiosyncratic myocardial nulling and poor contrast between blood pool and myocardium on inversion recovery sequences are characteristically seen in CA. To an extent, the time chosen to perform LGE sequences is arbitrary, and this can lead to false negative interpretations. Furthermore, poor contrast between the blood pool and myocardium depends on contrast kinetics, making the procedure nonspecific (Figure 9). Phase-sensitive inversion-recovery (PSIR) sequences reduce the need for optimal null point determination. Cardiac sarcoidosis can resemble CA, as the former has a variety of appearances on CMR and can be transmural and multifocal (Figure 10). Cardiac involvement, associated with a significantly worse prognosis, is found in about 25% of patients with sarcoidosis at autopsy. Clinically, however, it is only diagnosed in 5% of patients with sarcoidosis.21 Like CA, sarcoidosis leads to elevated native T1 and ECV.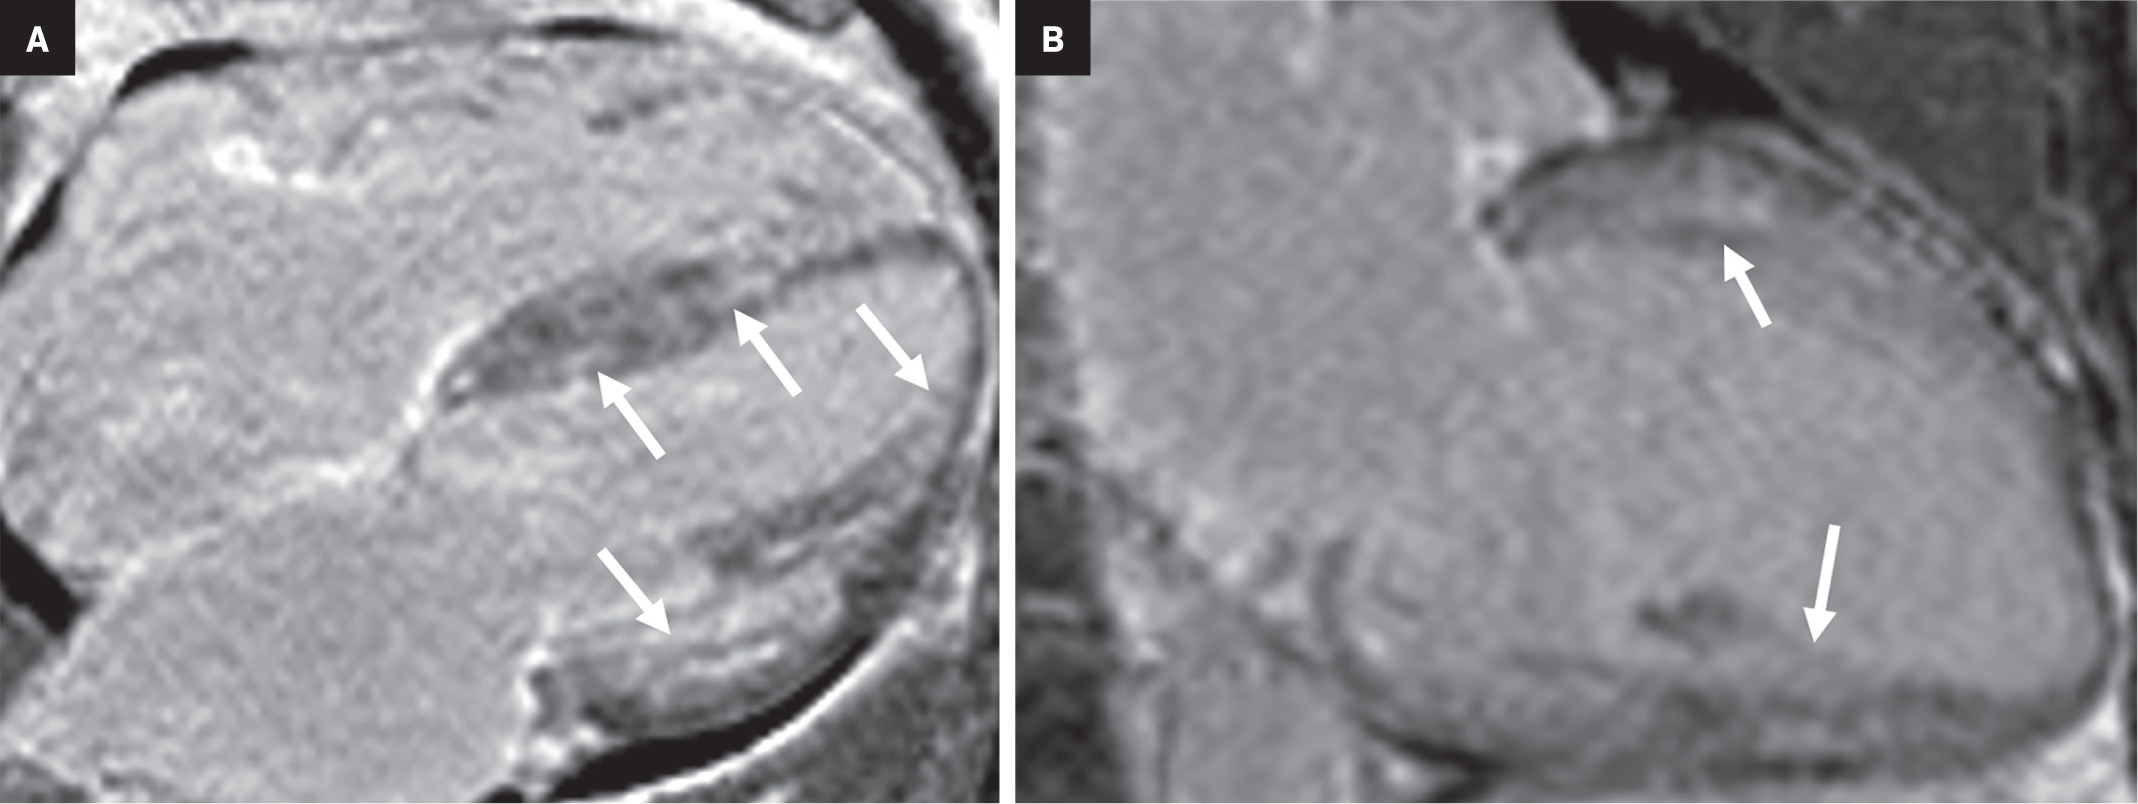
Assessment of pretest probability of CA is essential to limit false-negative interpretations. The presence of known TTR gene mutations, together with nonspecific LGE characteristics, must raise suspicion for ATTR (Figure 11). The TTR gene has over 100 single nucleotide polymorphisms, with 80 confirmed pathogenic mutations. These variations result in variant TTR amyloidosis, which exhibits diverse clinical phenotypes and patterns of inheritance.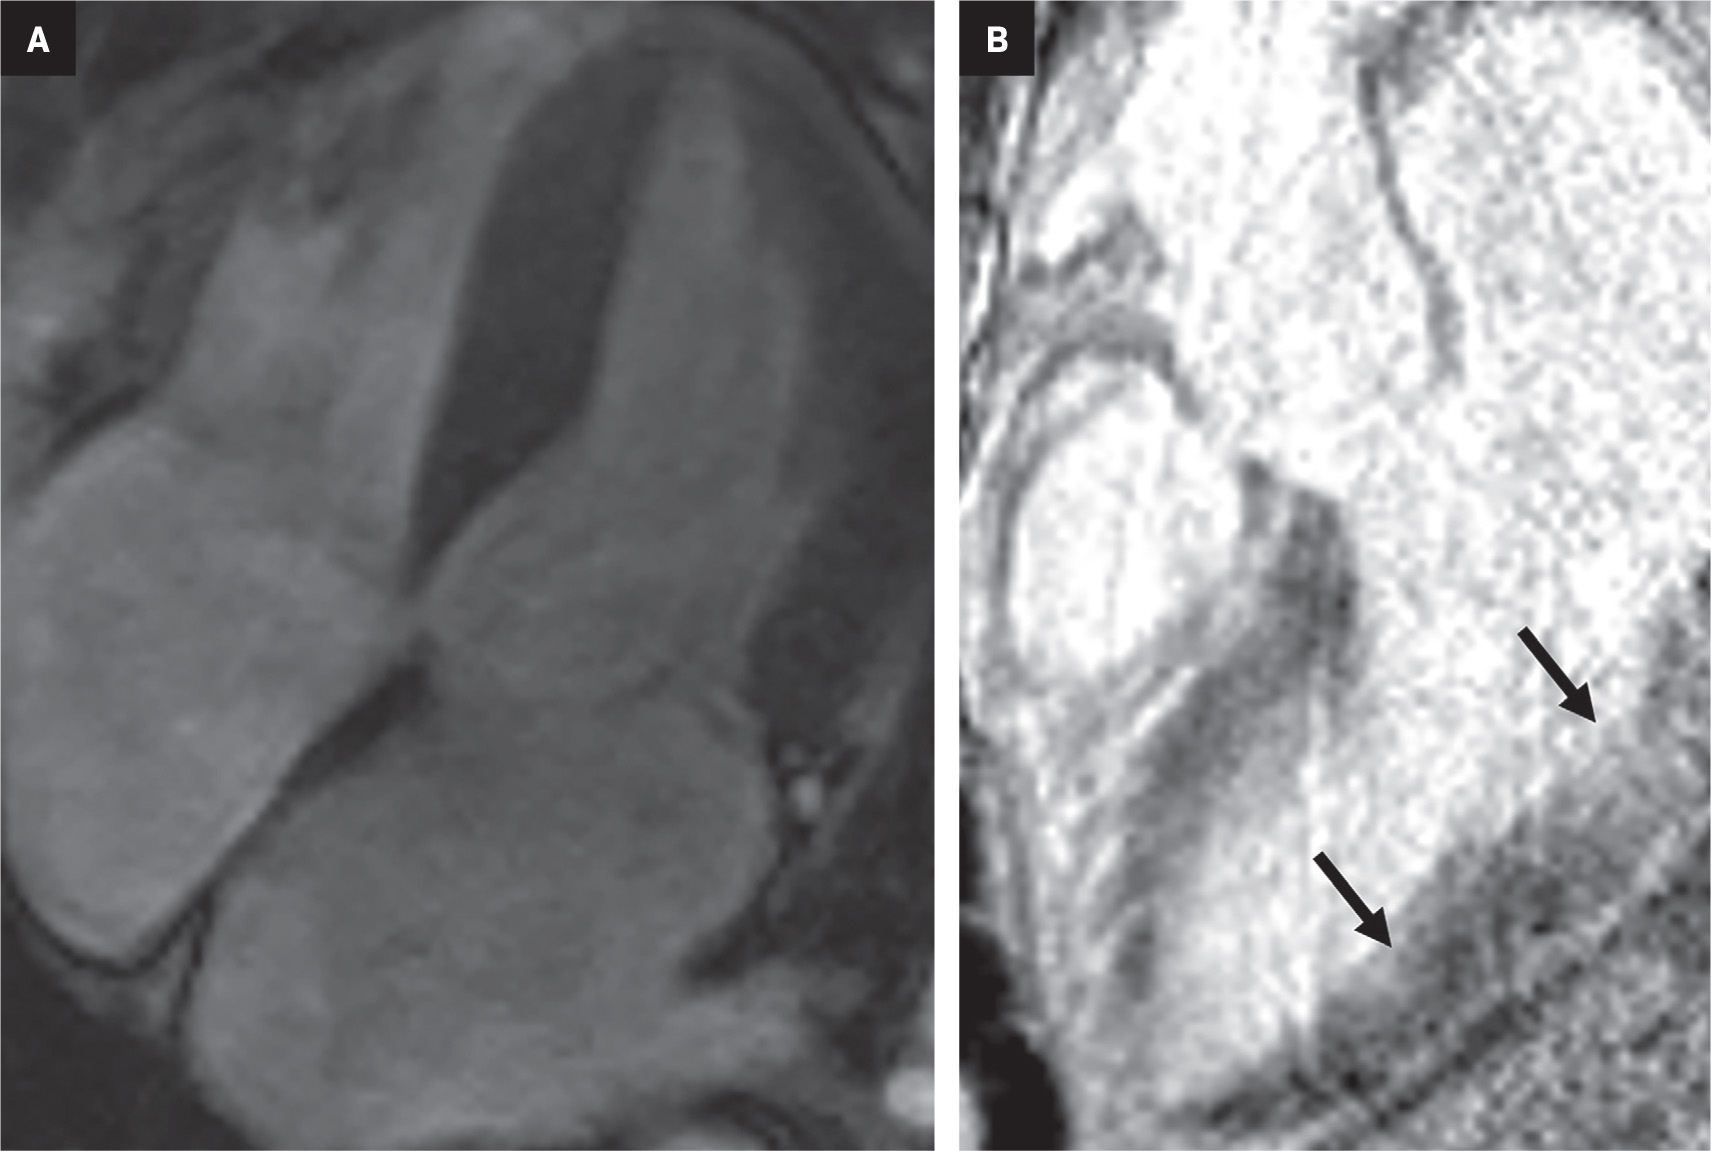
Certain mutations, such as V30M and V122I, are associated with cardiac involvement, with V122I being prevalent, and potentially contributing to the development of heart failure, in the US African American population.22 As more treatments and preventive strategies emerge, the TTR genotype of patients can assist in guiding family screening. A streamlined approach to assessing pretest genetic risk could provide patients and clinicians with valuable guidance when considering genetic testing.
Early CA may cause territorial LGE distribution that mimics ischemic cardiac disease (Figure 12). Quantitative T1 assessment and bone scintigraphy are useful in such situations to screen patients with nonspecific CMR findings.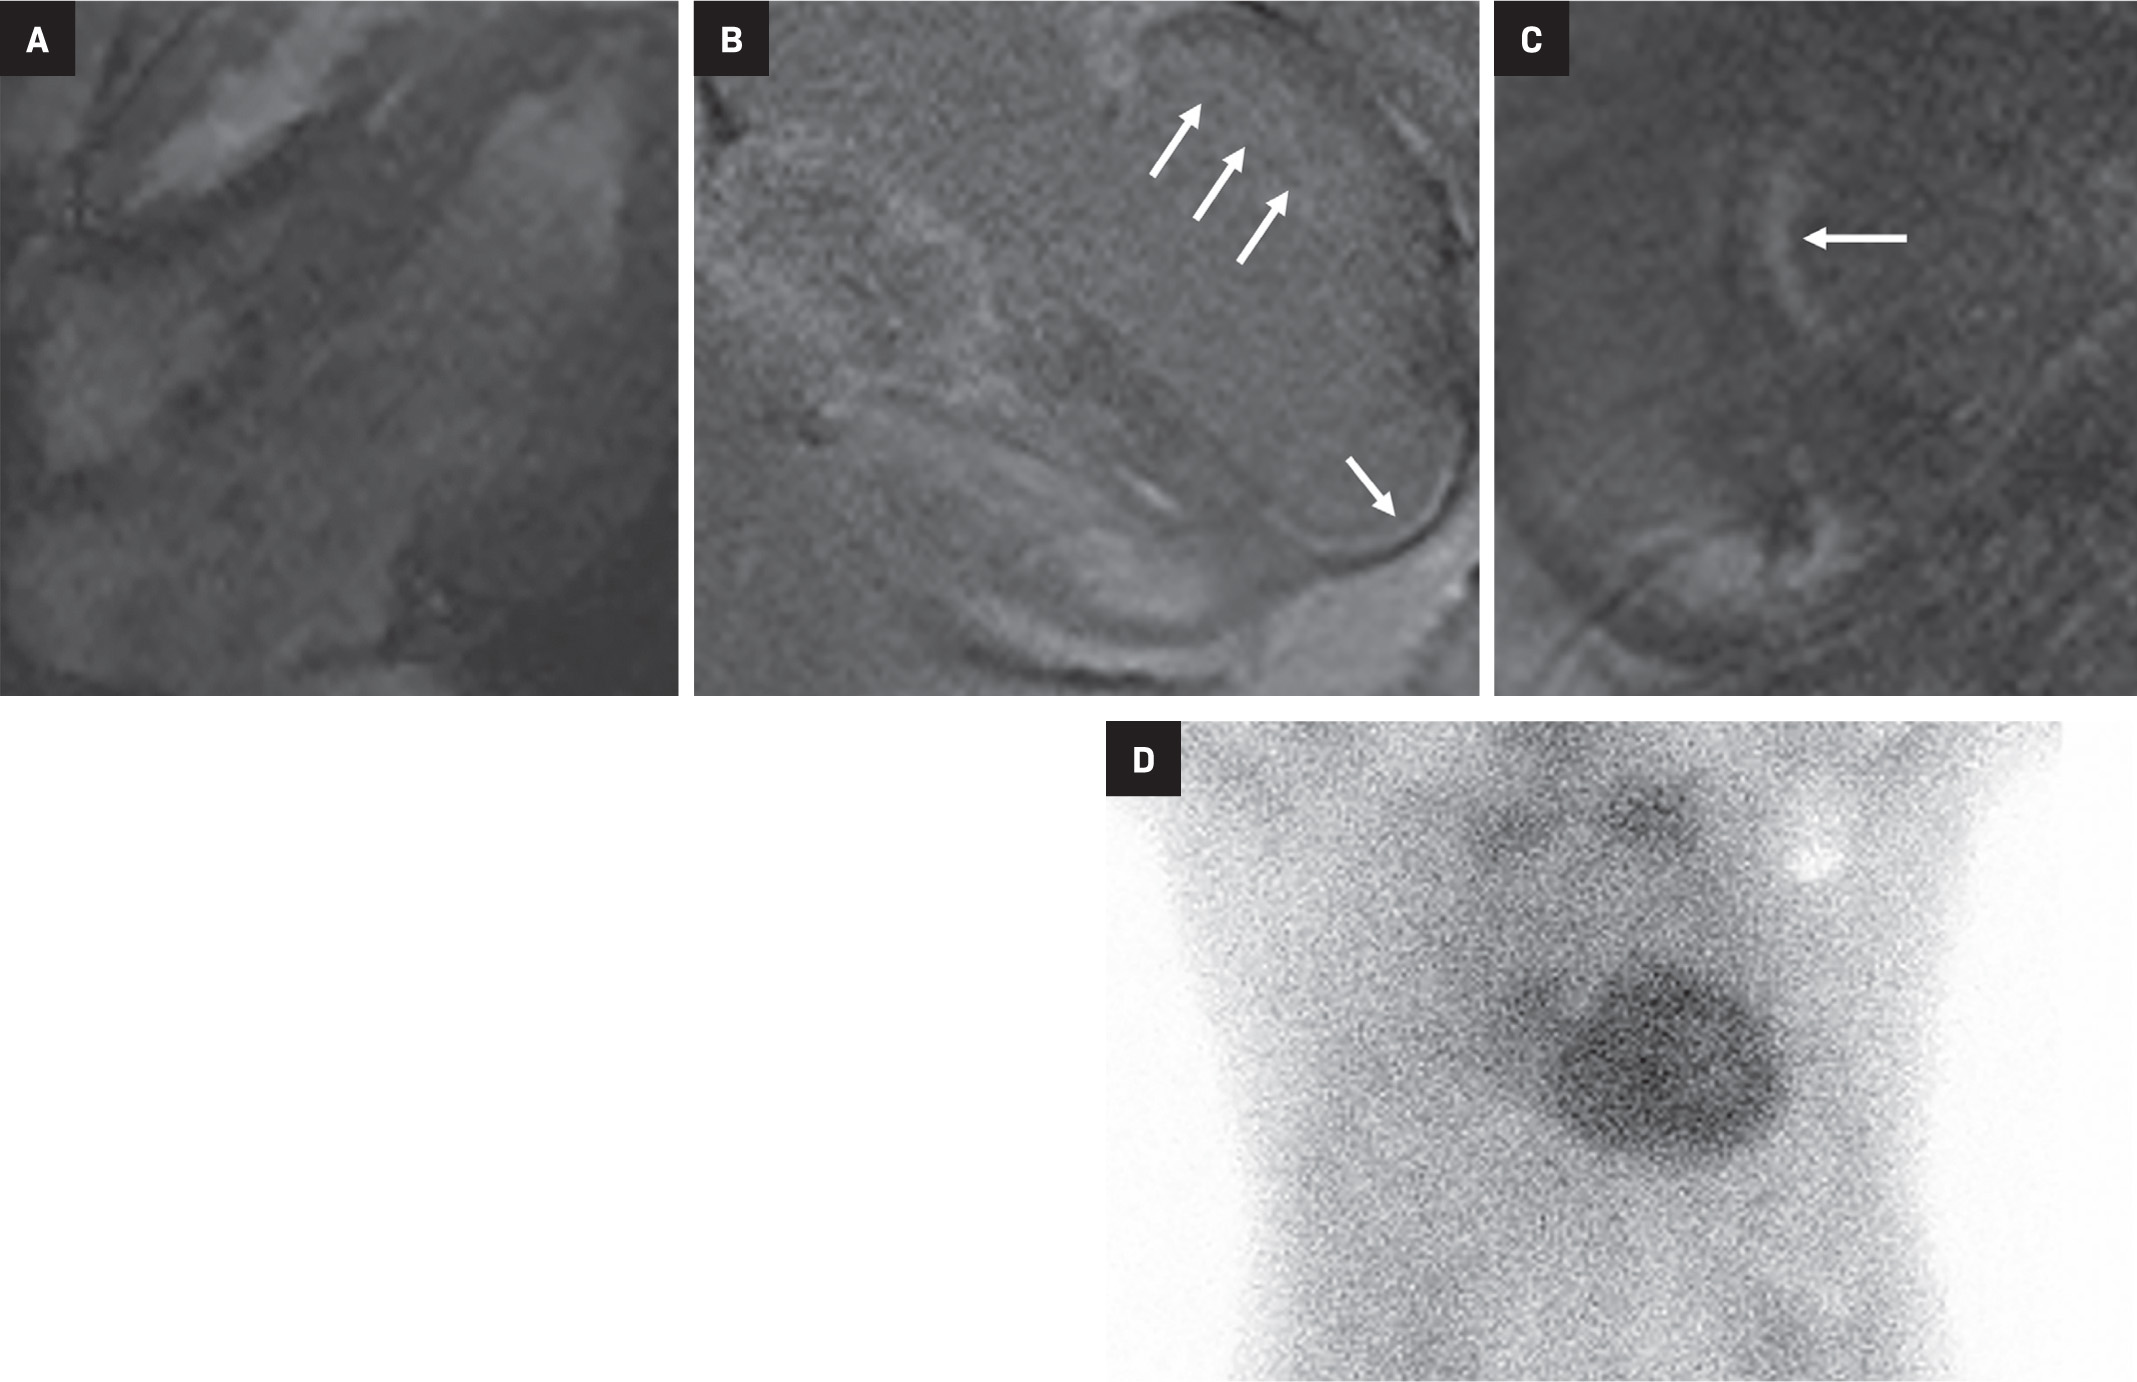
Role of Nuclear Imaging
Nuclear imaging plays a significant role in detecting ATTR amyloidosis. The modality offers high specificity (88.6-97.1%) and sensitivity (90.9 - 91.5%)4 for distinguishing between ATTR and AL types. In the absence of monoclonal proteins in serum or urine, increased myocardial PYP uptake has >99% specificity and positive predictive value for cardiac TTR amyloidosis.4 Technetium (Tc)-99m PYP, Tc-99mhydroxymethylene diphosphonate (HMDP), and Tc-99 mdicarboxypropane diphosphonate (DPD) bone scans have been used for ATTR CA.23 Visual grading system (grades 0–3) can be used to quantify Tc-99m uptake for ATTR CA (Figure 13). Uptake of grade 2/3 is considered positive for ATTR cardiac amyloidosis.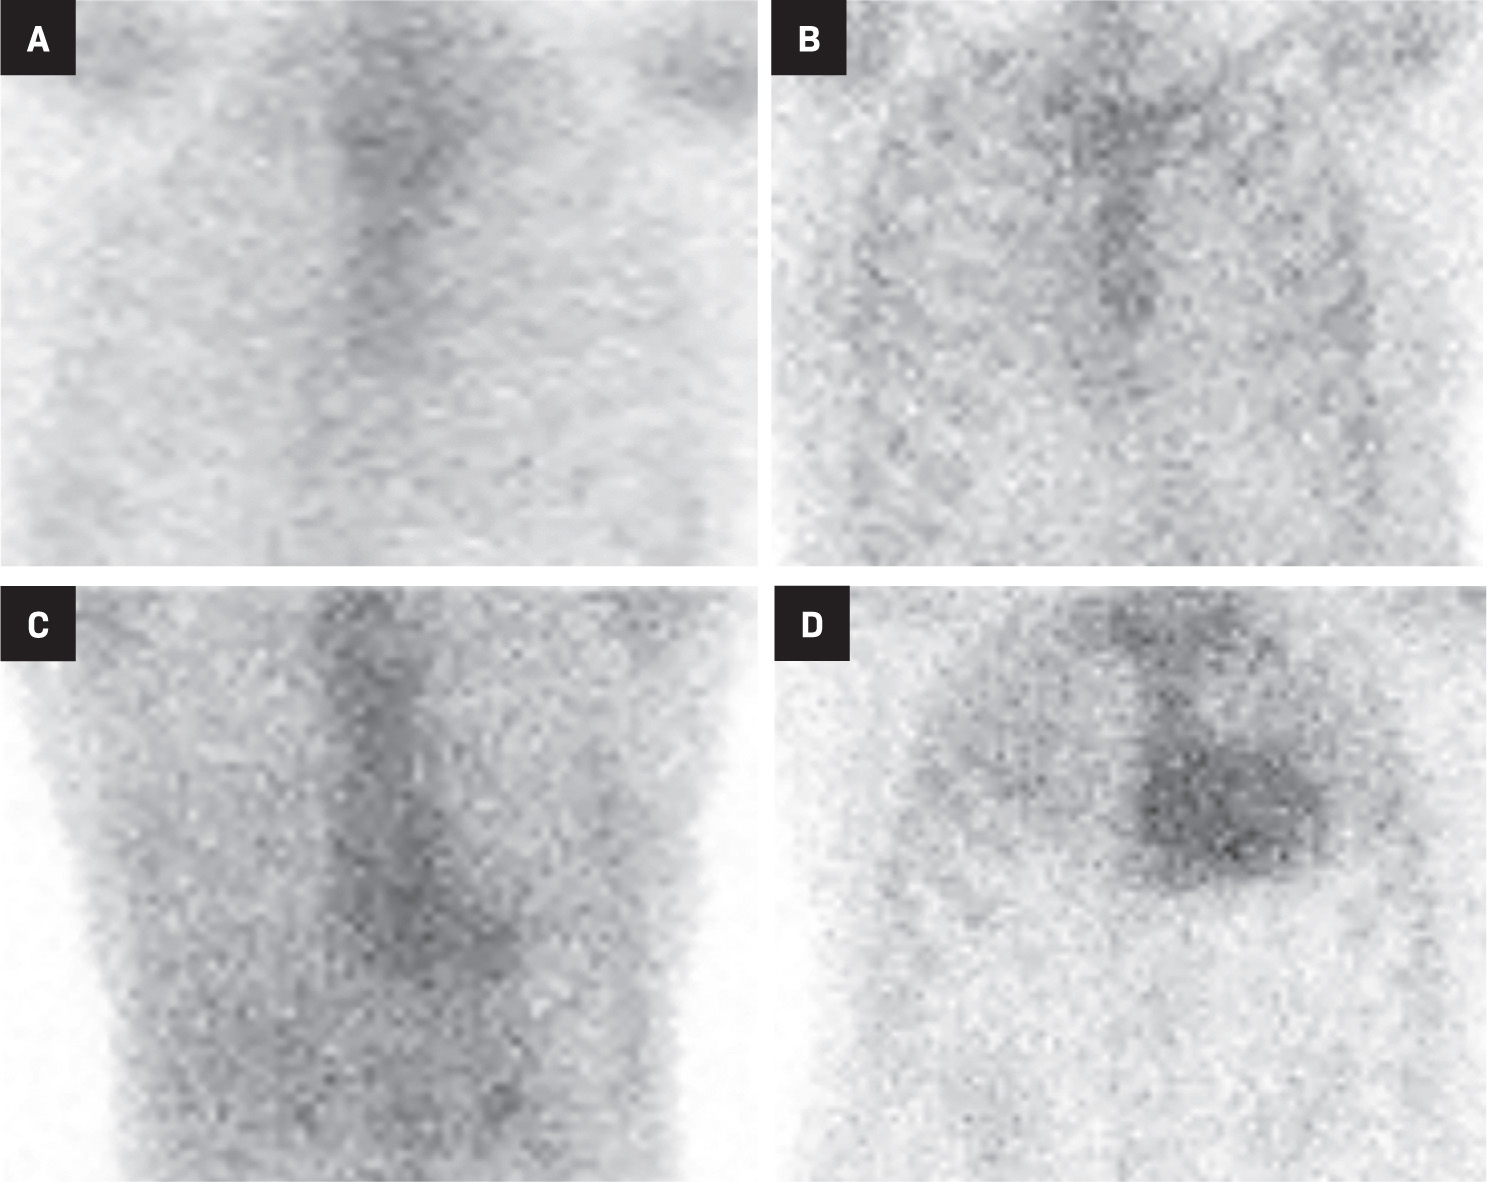
False positives may result from blood pool activity in LV and increased adjacent rib uptake. Single photon emission CT (SPECT) enables accurate discrimination of myocardial uptake from cardiac blood pool (Figure 14). Semi-quantitative analysis of myocardial uptake can also be performed using heart-to-whole body (H/WB) ratio or heart-to-contralateral lung (H/CL) ratio. Mean H/WB ratio of ATTR CA is reported to be 10%, while H/CL ratio with a cut-off value of 1.5 can differentiate ATTR from AL. Amyloid-targeting PET tracers 11c PIB, 18f florbetapir, 18f florbetaben, and 18f flutemetamol are currently being developed.24 Early results with 18f florbetapir PET demonstrate higher myocardial uptake for AL than for ATTR.25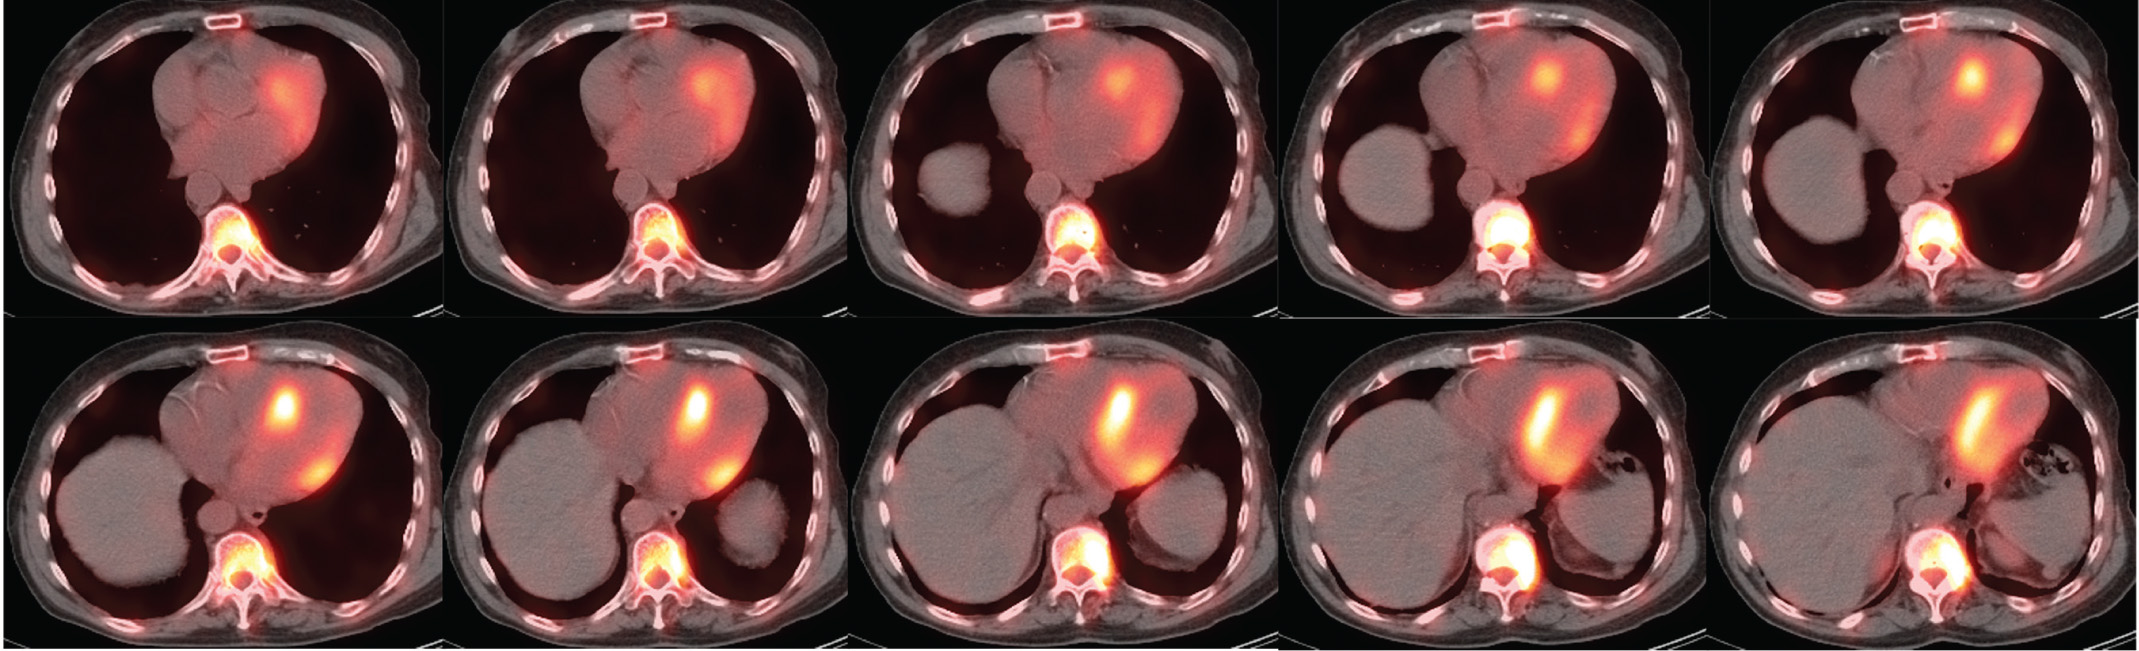
Conclusion
No diagnostic test is perfect; false-positives and false-negatives occur throughout diagnostic medicine. Nevertheless, awareness of how similar the conditions we seek to distinguish from CA can look like CA is important. Where the diagnosis can lead to substantial change in management, such as with CA, we advise more liberal pathological correlation.
References
- Gilstrap L, Dominici F, Wang Y. Epidemiology of cardiac amyloidosis–associated heart failure hospitalizations among fee-for-service medicare beneficiaries in the United States. Circ Hear Fail. 2019;12(6). doi:10.1161/CIRCHEARTFAILURE.118.005407.
- Fontana M, Chung R, Hawkins P, Moon J. Cardiovascular magnetic resonance for amyloidosis. Heart Fail Rev. 2015;20(2):133-144. doi:10.1007/s10741-014-9470-7.
- Oda S, Kidoh M, Nagayama Y. Trends in diagnostic imaging of cardiac amyloidosis: emerging knowledge and concepts. RadioGraphics. 2020;40(4):961-981. doi:10.1148/rg.2020190069.
- Brownrigg J, Lorenzini M, Lumley M, Elliott P. Diagnostic performance of imaging investigations in detecting and differentiating cardiac amyloidosis: a systematic review and meta-analysis. ESC Hear Fail. 2019;6(5):1041-1051. doi:10.1002/ehf2.12511.
- Maceira A, Joshi J, Prasad S. Cardiovascular magnetic resonance in cardiac amyloidosis. Circulation. 2005;111(2):186-193. doi:10.1161/01.CIR.0000152819.97857.9D.
- Ana M, A. T, Amna A. Magnetic resonance in transthyretin cardiac amyloidosis. J Am Coll Cardiol. 2017;70(4):466-477. doi:10.1016/j.jacc.2017.05.053.
- Kyriakou P, Mouselimis D, Tsarouchas A. Diagnosis of cardiac amyloidosis: a systematic review on the role of imaging and biomarkers. BMC Cardiovasc Disord. 2018;18(1):221. doi:10.1186/s12872-018-0952-8.
- Pan J, Kerwin M, Salerno M. Native T1 mapping, extracellular volume mapping, and late gadolinium enhancement in cardiac amyloidosis: a meta-analysis. JACC Cardiovasc Imaging. 2020;13(6):1299-1310. doi:10.1016/j.jcmg.2020.03.010.
- Fontana M, Banypersad S, Treibel T. Native T1 mapping in transthyretin amyloidosis. JACC Cardiovasc Imaging. 2014;7(2):157-165.
- Hinojar R, Varma N, Child N. T1 mapping in discrimination of hypertrophic phenotypes: hypertensive heart disease and hypertrophic cardiomyopathy. Circ Cardiovasc Imaging. 2015;8(12). doi:10.1161/CIRCIMAGING.115.003285.
- Karamitsos T, Piechnik S, Banypersad S. Noncontrast T1 mapping for the diagnosis of cardiac amyloidosis. JACC Cardiovasc Imaging. 2013;6(4):488-497. doi:10.1016/j.jcmg.2012.11.013.
- Haaf P, Garg P, Messroghli D, Broadbent D, Greenwood J, Plein S. Cardiac T1 mapping and extracellular volume (ECV) in clinical practice: a comprehensive review. J Cardiovasc Magn Reson. 2016;18(1):89. doi:10.1186/s12968-016-0308-4.
- Rapezzi C, Lorenzini M, Longhi S. Cardiac amyloidosis: the great pretender. Heart Fail Rev. 2015;20(2):117-124. doi:10.1007/s10741-015-9480-0.
- Georgiopoulos G, Figliozzi S, Sanguineti F. Prognostic impact of late gadolinium enhancement by cardiovascular magnetic resonance in myocarditis. Circ Cardiovasc Imaging. 2021;14(1). doi:10.1161/CIRCIMAGING.120.011492.
- Pica S, Sado D, Maestrini V. Reproducibility of native myocardial T1 mapping in the assessment of Fabry disease and its role in early detection of cardiac involvement by cardiovascular magnetic resonance. J Cardiovasc Magn Reson. 2014;16(1):99. doi:10.1186/s12968-014-0099-4.
- Cavalcante J, Rijal S, Abdelkarim I. Cardiac amyloidosis is prevalent in older patients with aortic stenosis and carries worse prognosis. J Cardiovasc Magn Reson. 2017;19(1):98. doi:10.1186/s12968-017-0415-x.
- Christian N, R. S, P. P. Prevalence and outcomes of concomitant aortic stenosis and cardiac amyloidosis. J Am Coll Cardiol. 2021;77(2):128-139. doi:10.1016/j.jacc.2020.11.006.
- Castaño A, Narotsky D, Hamid N. Unveiling transthyretin cardiac amyloidosis and its predictors among elderly patients with severe aortic stenosis undergoing transcatheter aortic valve replacement. Eur Heart J. 2017;38(38):2879-2887. doi:10.1093/eurheartj/ehx350.
- Treibel T, Fontana M, Gilbertson J. Occult transthyretin cardiac amyloid in severe calcific aortic stenosis. Circ Cardiovasc Imaging. 2016;9(8). doi:10.1161/CIRCIMAGING.116.005066.
- Ternacle J, Krapf L, Mohty D. Aortic stenosis and cardiac amyloidosis: JACC review topic of the week. J Am Coll Cardiol. 2019;74(21):2638-265. doi:10.1016/j.jacc.2019.09.056.
- Hotta M, Minamimoto R, Awaya T, Hiroe M, Okazaki O, Hiroi Y. Radionuclide imaging of cardiac amyloidosis and sarcoidosis: roles and characteristics of various tracers. RadioGraphics. 2020;40(7):2029-204. doi:10.1148/rg.2020200068.
- Ruberg F, Berk J. Transthyretin (TTR) cardiac amyloidosis. Circulation. 2012;126(10):1286-1300. doi:10.1161/CIRCULATIONAHA.111.078915.
- Perugini E, Guidalotti P, Salvi F. Noninvasive etiologic diagnosis of cardiac amyloidosis using 99mTc-3,3-diphosphono-1,2-propanodicarboxylic acid scintigraphy. J Am Coll Cardiol. 2005;46(6):1076-1084. doi:10.1016/j.jacc.2005.05.073.
- Gallegos C, Miller E. Advances in PET-based cardiac amyloid radiotracers. Curr Cardiol Rep. 2020;22(6):40. doi:10.1007/s11886-020-01284-3.
- Dorbala S, Vangala D, Semer J. Imaging cardiac amyloidosis: a pilot study using 18F-florbetapir positron emission tomography. Eur J Nucl Med Mol Imaging. 2014;41(9):1652-1662. doi:10.1007/s00259-014-2787-6.
Citation
. Radiological Detection of Cardiac Amyloid: MRI with Pathological Correlation. Applied Radiology. 2023;52(6):8-17. doi:10.37549/AR2935.