Stroke differential diagnosis and mimics: Part 1
Applied Radiology — Vol. 44 , Issue 11 , pp. 26 -39
DOI: 10.37549/AR2227
Published: November 1, 2015
Categories
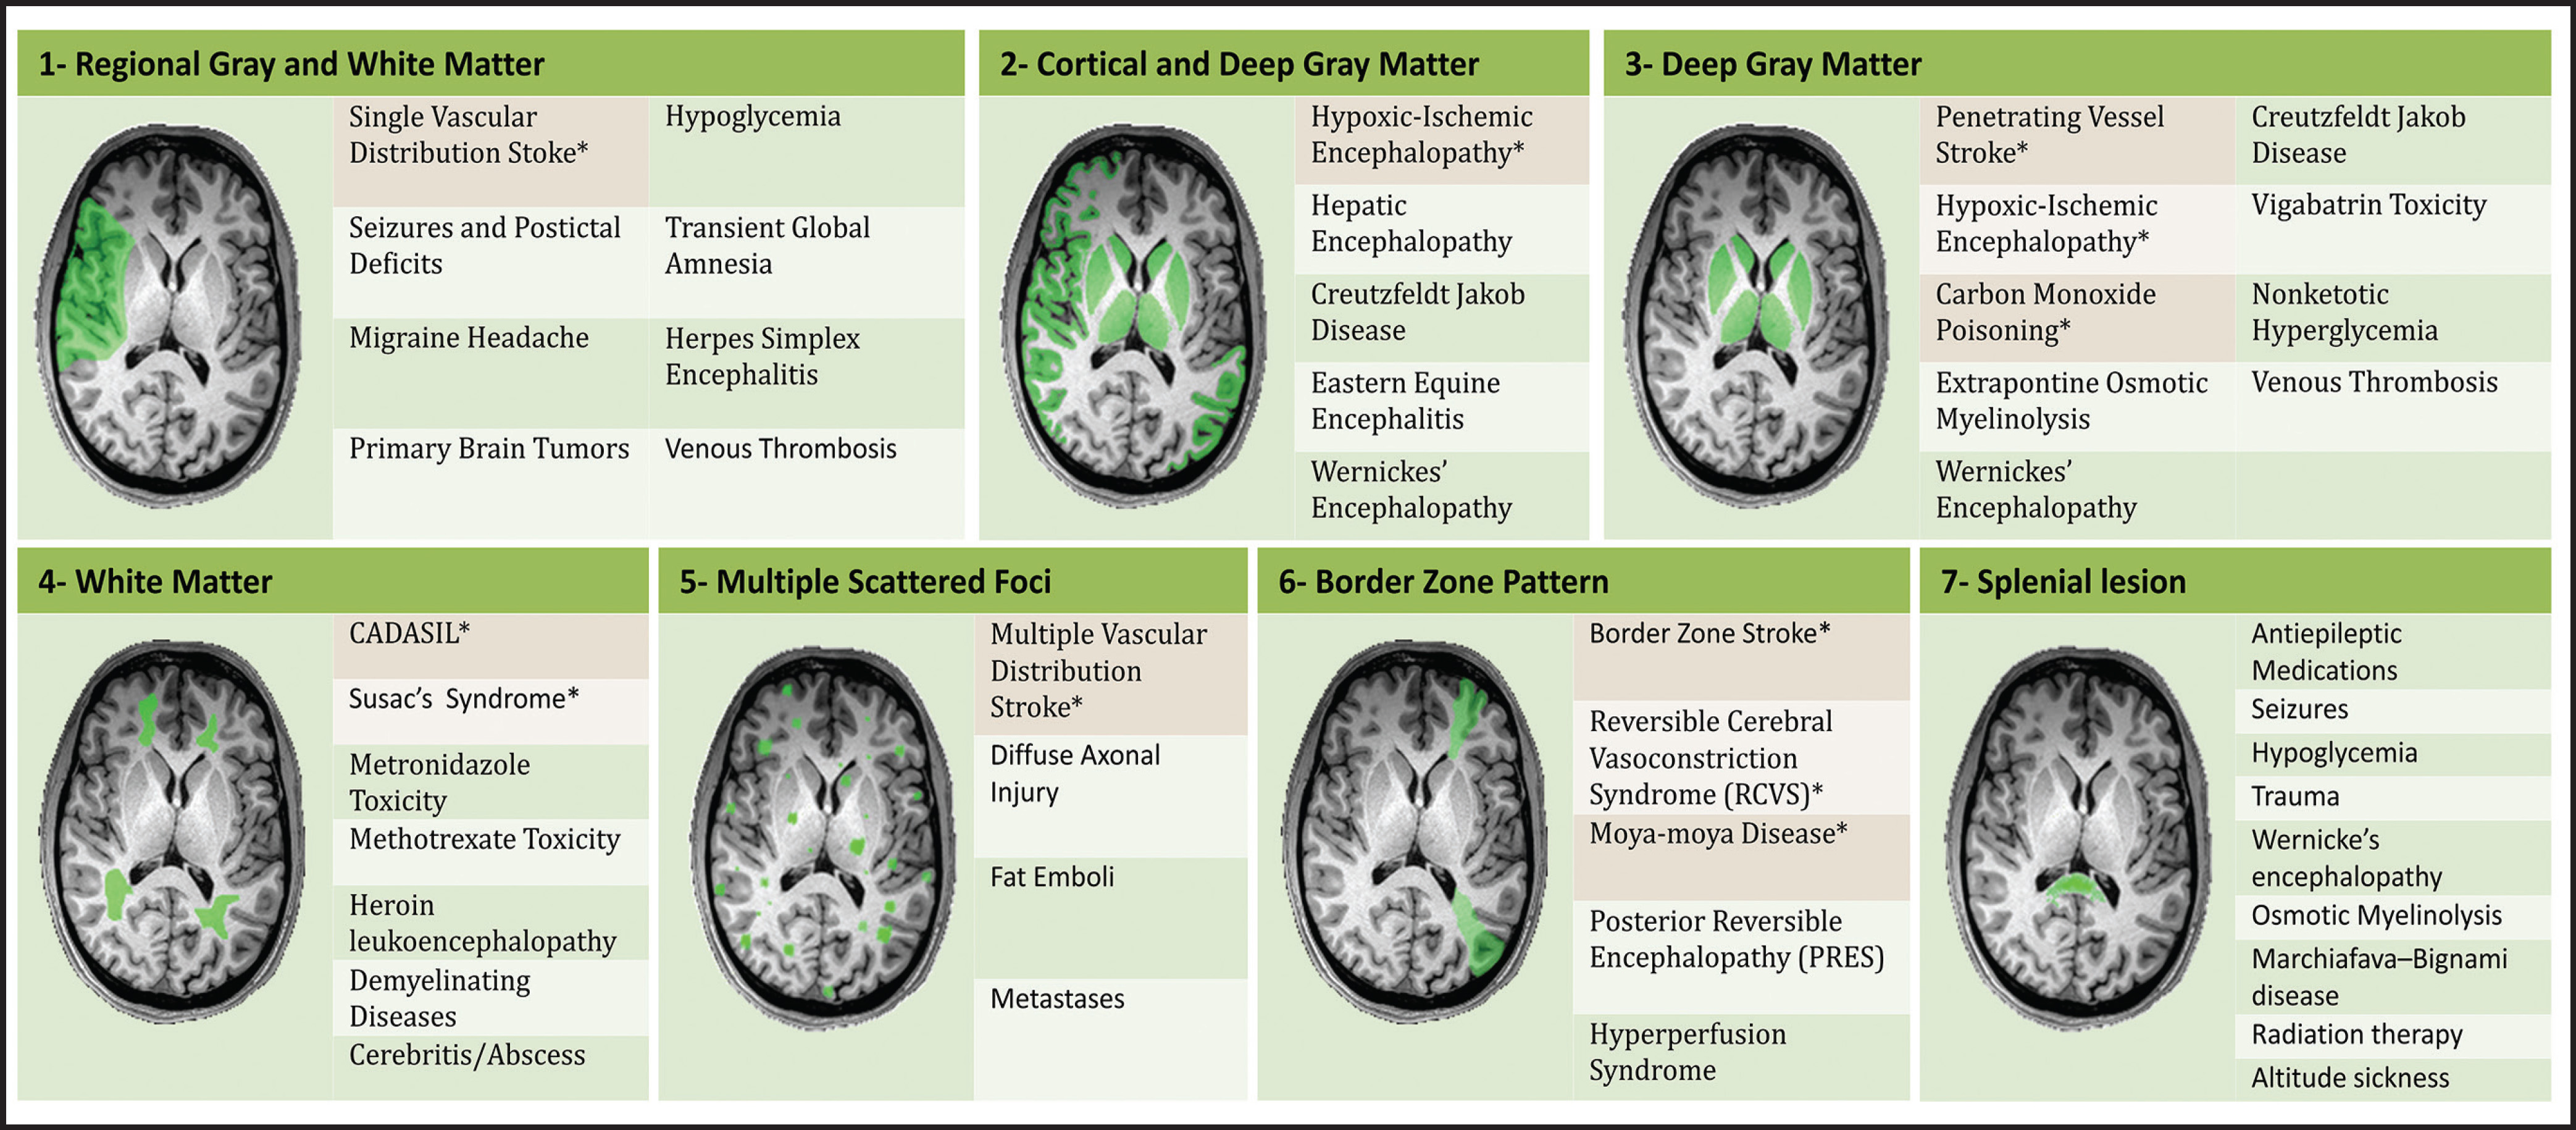
An estimated 9% to 30% of patients with suspected stroke and 2.8% to 17% of patients treated with IV-tPA have stroke mimics.1-7 The majority of stroke mimics are due to seizures, migraines, tumors and toxic-metabolic disturbances.3,8 Imaging usually facilitates diagnosis, as stroke has typical imaging features at different stages and follows typical topographic patterns. However, most of these features, even restricted diffusion (Table 1), are not unique to stroke.9-17 In this article we present stroke and its mimics based on 7 main patterns of topographic distribution (Figure 1). Although overlap exists, these patterns are helpful in narrowing the differential diagnosis.
Imaging features of ischemic stroke at different stages
Acute (less than 24 hours)
Computed tomography findings are initially subtle and include a hyperdense vessel, decreased gray-white matter differentiation, and sulcal effacement.18-20 Diffusion weighted imaging is highly accurate and can detect stroke as early as 15 minutes after onset.21 The T2/FLAIR hyperintensity takes hours to become apparent.22
Subacute (24 hours to 2 months)
The CT hypodensity becomes more apparent and ADC values gradually increase and pseudo-normalize at 4 to 10 days.23 Gyriform enhancement appears at 6 days and persists for as long as 2-3 months. Edema peaks in 3-4 days and decreases after 7 days. Hemorrhagic transformation usually occurs 2 to 7 days after ictus.
Chronic (more than 2 months)
This phase is characterized by volume loss, cavitation and gliosis. The gliosis surrounding the cavitation is hypodense on CT and hyperintense on T2WI and FLAIR. DWI shows variable signal, typically with increased ADC values.
Distribution patterns of ischemic stroke and its mimics
Regional gray and white matter
Single vascular distribution stroke
Ischemic infarctions in a single vascular distribution are most often a consequence of emboli arising from atherosclerotic plaques or dissection of the large craniocervical arteries, most commonly the carotid bifurcation. These emboli most frequently occlude the middle cerebral arteries or internal carotid terminus, followed by posterior cerebral arteries, vertebrobasilar system and the anterior cerebral arteries and results in regional cortical and subcortical pattern of involvement.24
Seizures
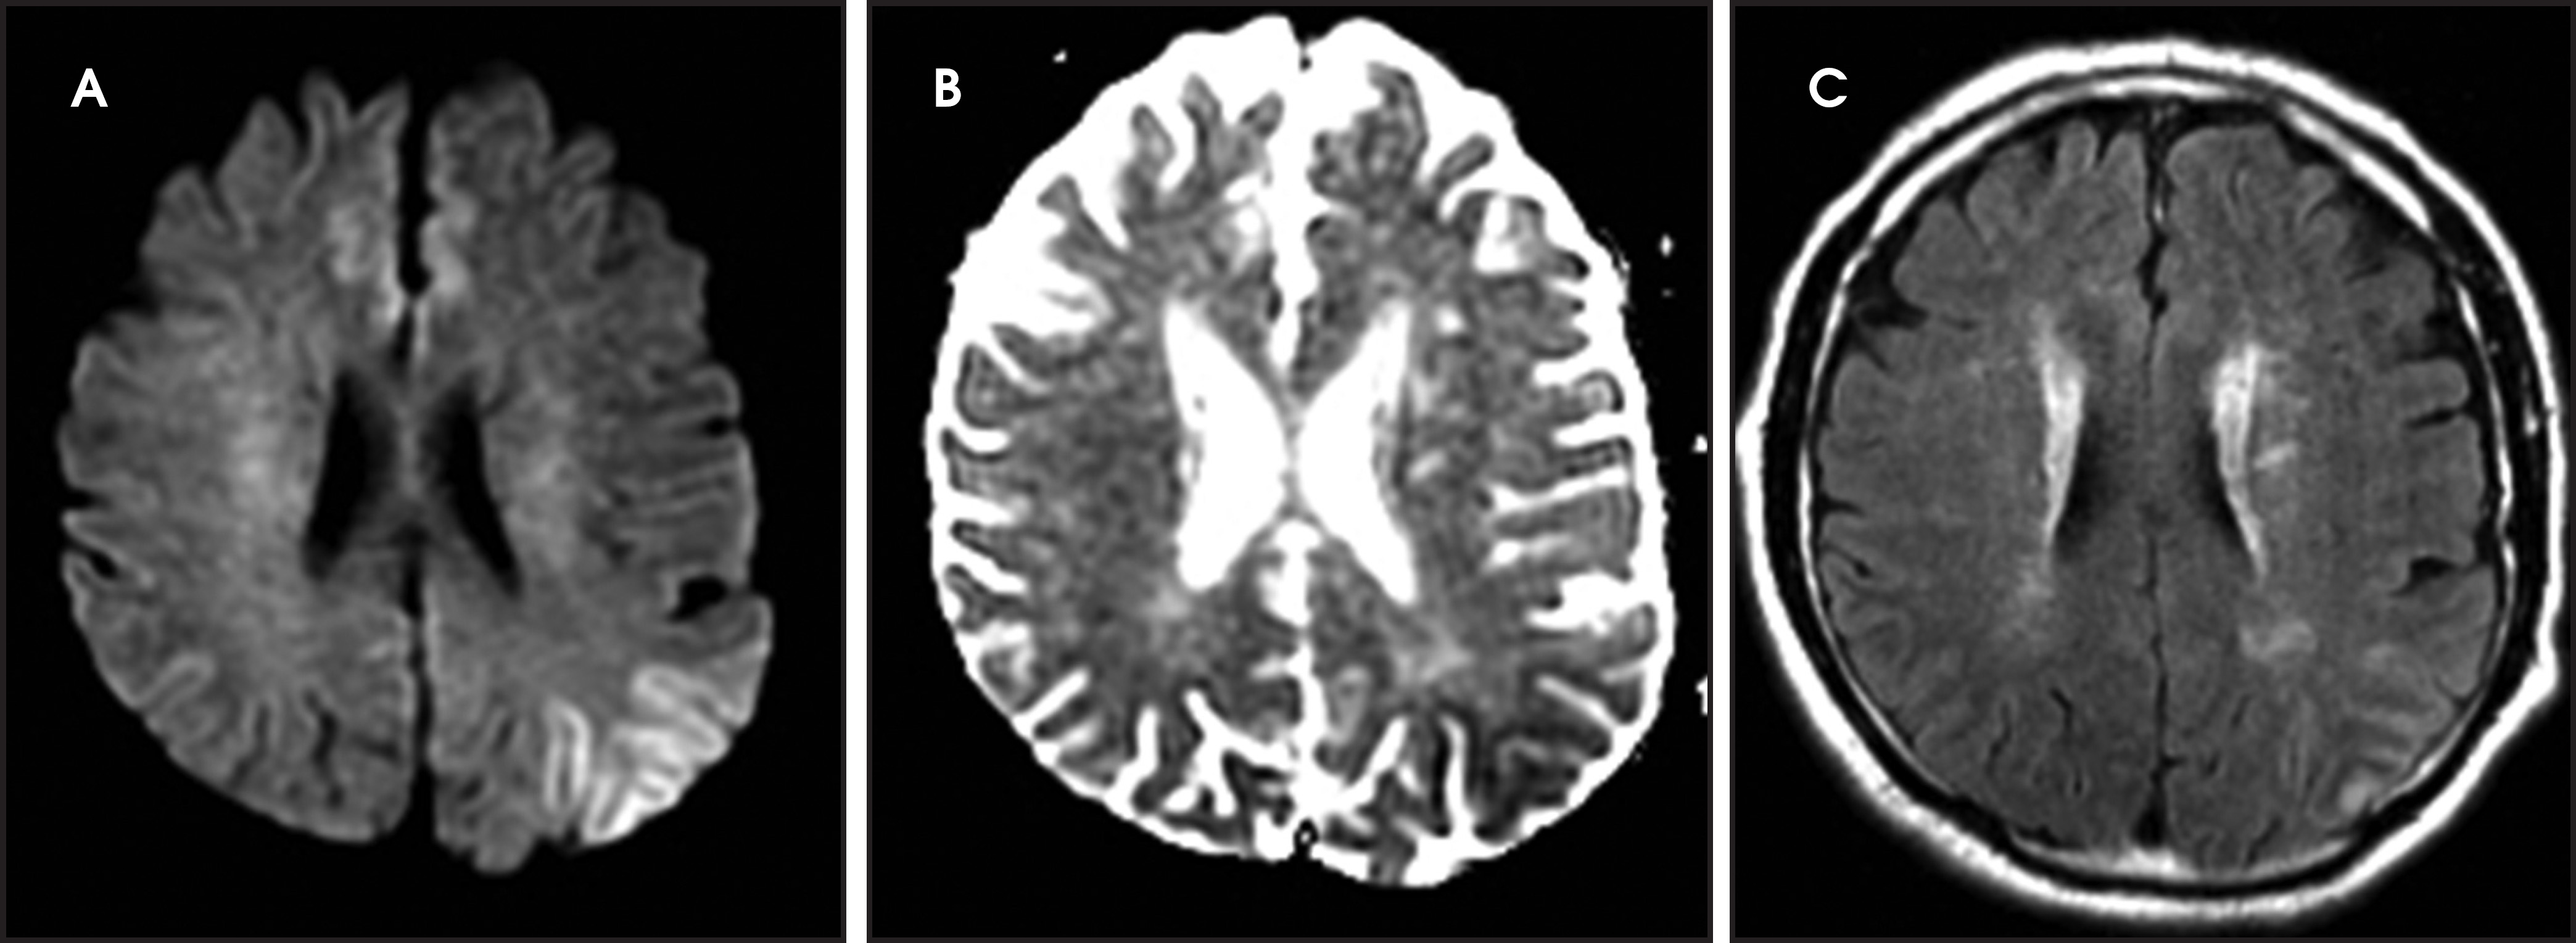
One-third of stroke mimics are due to seizures or postictal deficits.25,26 Sometimes, seizure may cause restricted diffusion (Figure 2).27 The distinguishing features are nonvascular distribution, earlier edema and gyral enhancement, normal or elevated perfusion, absence of vascular occlusion, and sometimes simultaneous restricted cortical and elevated subcortical diffusion.28-38
Migraine
Migrainous aura and hemiplegic migraine are the cause of 5-10% of stroke mimics and may show restricted diffusion.25,26,39-41 The distinguishing factors are a long history of migraines, involvement of multiple arterial territories and absence of vascular occlusion.40,42,43 Perfusion decreases in acute-onset aura and is normal or elevated in prolonged episodes.40,42,43 The lesions are usually reversible,40,42,43 but 15% of strokes in patients younger than 45 years of age are due to migraine.44
Brain tumors
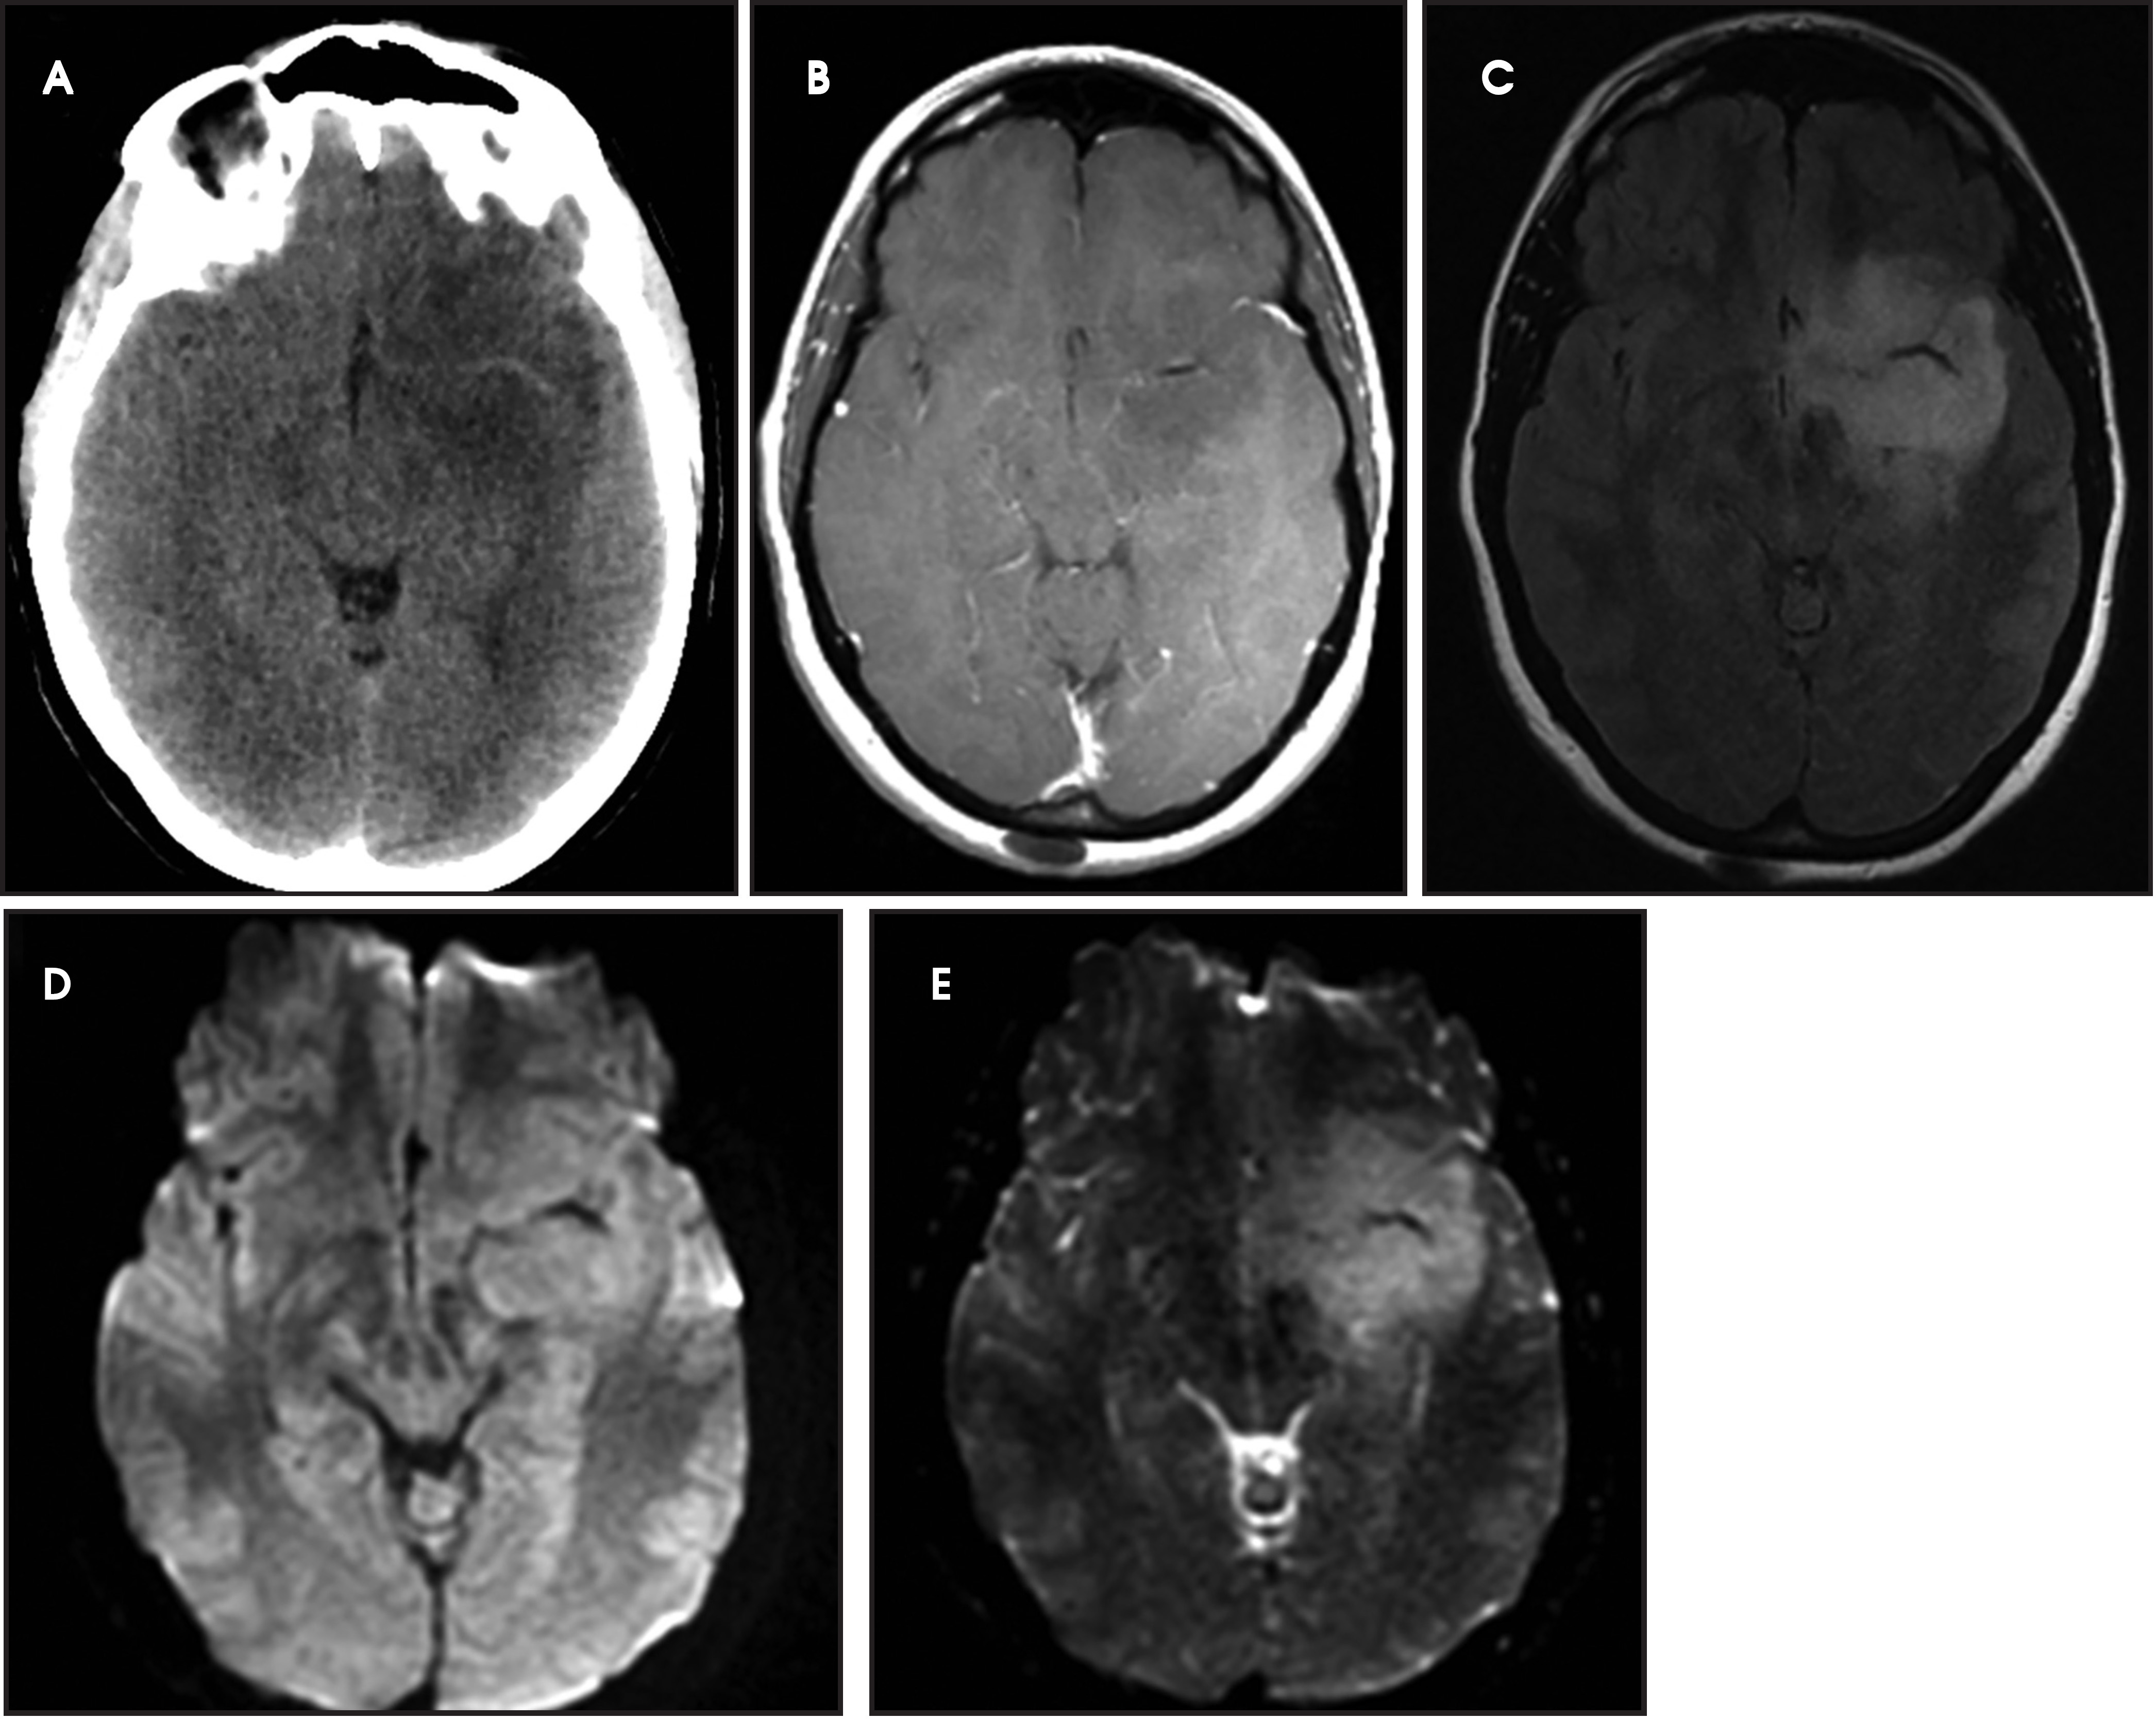
A primary brain neoplasm may present with acute neurologic deficits. Occasionally a low-grade glial tumor with mild mass effect and cortical involvement may be confused with a subacute infarction (Figure 3).45 It can, however, be easily differentiated based on nonvascular distribution and lack of significant restricted diffusion or gyral enhancement. Nevertheless, both subacute infarcts with hemorrhage and high-grade hemorrhagic gliomas can show areas of restricted diffusion, heterogeneous enhancement and mass effect that can be indistinguishable.
Herpes simplex encephalitis
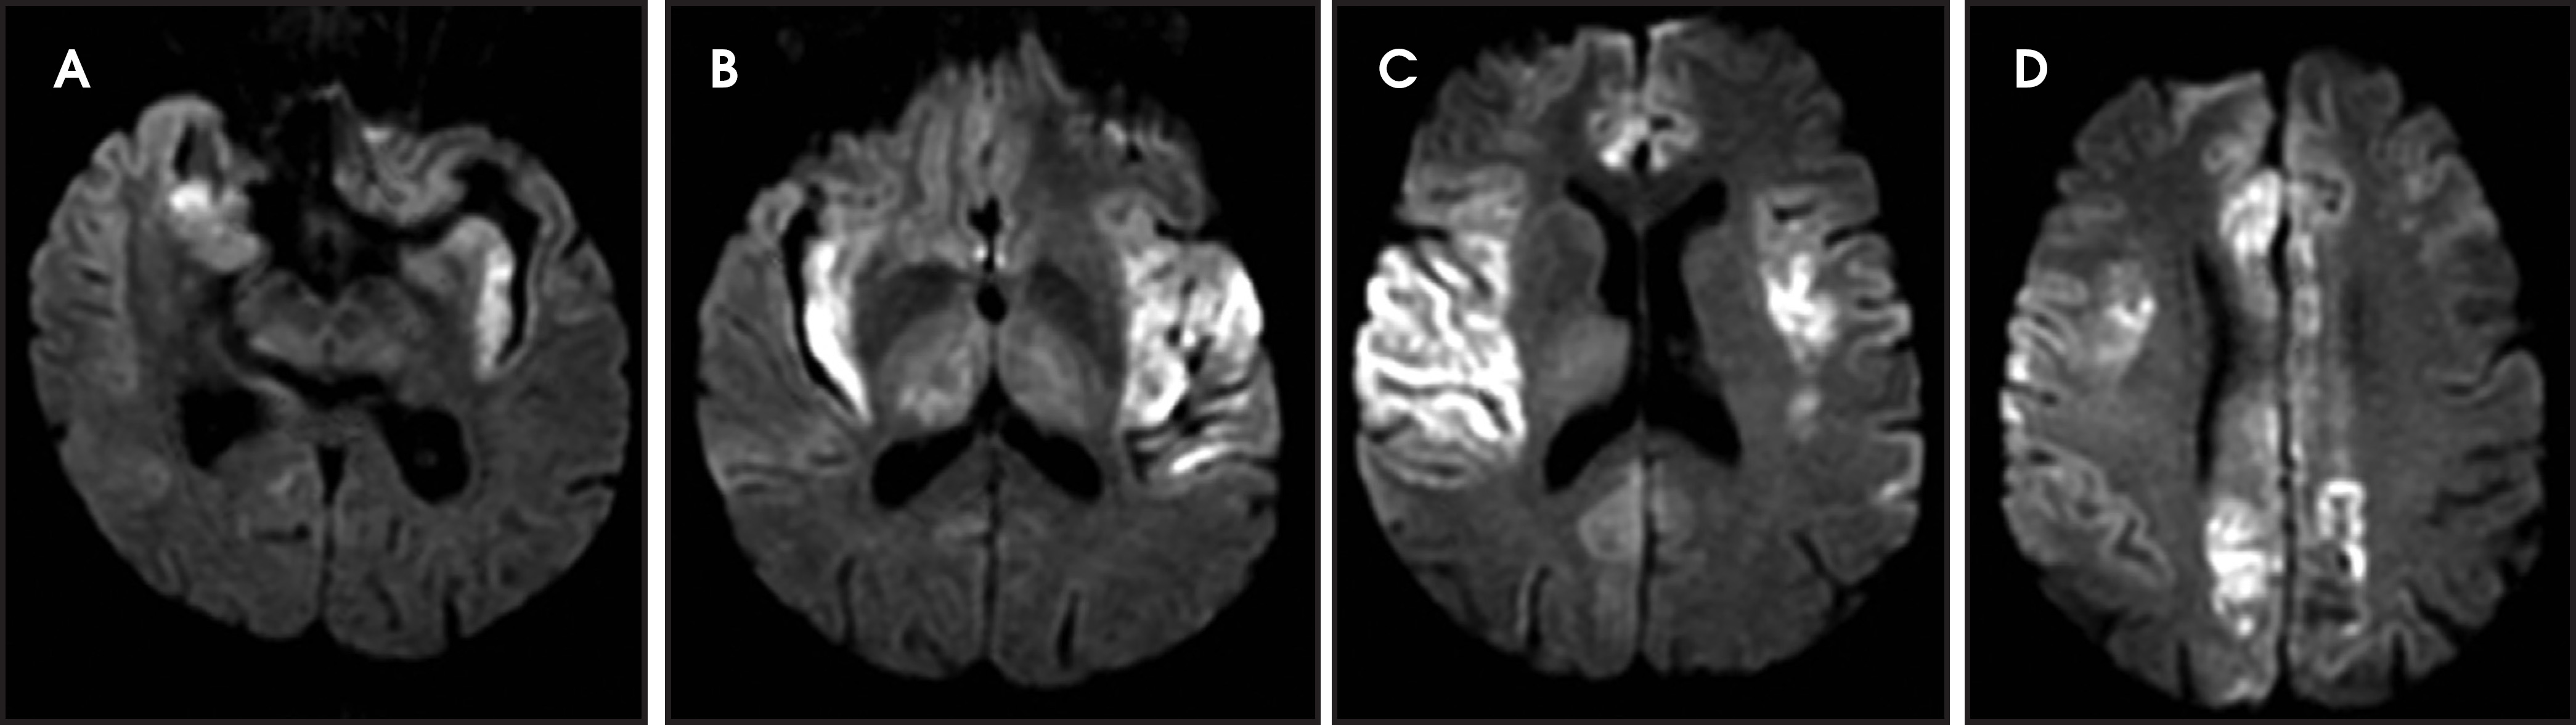
Herpes simplex is the most common cause of viral encephalitis and presents with a combination of fever, headache, confusion, seizures and neurologic deficits.46-48 It has a predilection for the limbic system (medial temporal and inferior frontal lobes, insula and cingulate gyri) (Figure 4).49,50 DWI is superior to other sequences for detection and usually shows concurrent areas with decreased and increased diffusivity.51,52 Restricted diffusion is observed in early stages and leads to irreversible neuronal damage.51,53 The glutamate excitotoxic pathway is believed to be the cause of restricted diffusion. Lesions are typically also hyperintense on FLAIR images and frequently undergo hemorrhagic transformation.10
Hypoglycemia
Hypoglycemia can present with focal neurologic deficits.54-59 Restricted diffusion may be seen in the cerebral cortex (particularly the occipital lobes), corona radiata and centrum semiovale.11,60-63 Involvement of the basal ganglia, hippocampi, internal capsules and splenium has also been reported.64-66 The cerebellum, brain stem and hypothalamus are usually spared due to more active glucose transport mechanisms.67,68 The cause of diffusion restriction is thought to be energy failure due to lack of glucose, excitotoxic edema, and/or asymmetric cerebral blood flow.
Transient global amnesia (TGA)
TGA is diagnosed by sudden onset of transient antegrade memory loss.69,70 The pathogenesis is unclear, but ischemia, seizures, and migraine have been considered.71-73 It typically appears as punctate foci of restricted diffusion in the hippocampus (Figure 5).15,74,75 In one report, the frequency of positive DWI findings increased from 5% to 85% when ictus-to-imaging time increased from 8 hours to 48 hours.74
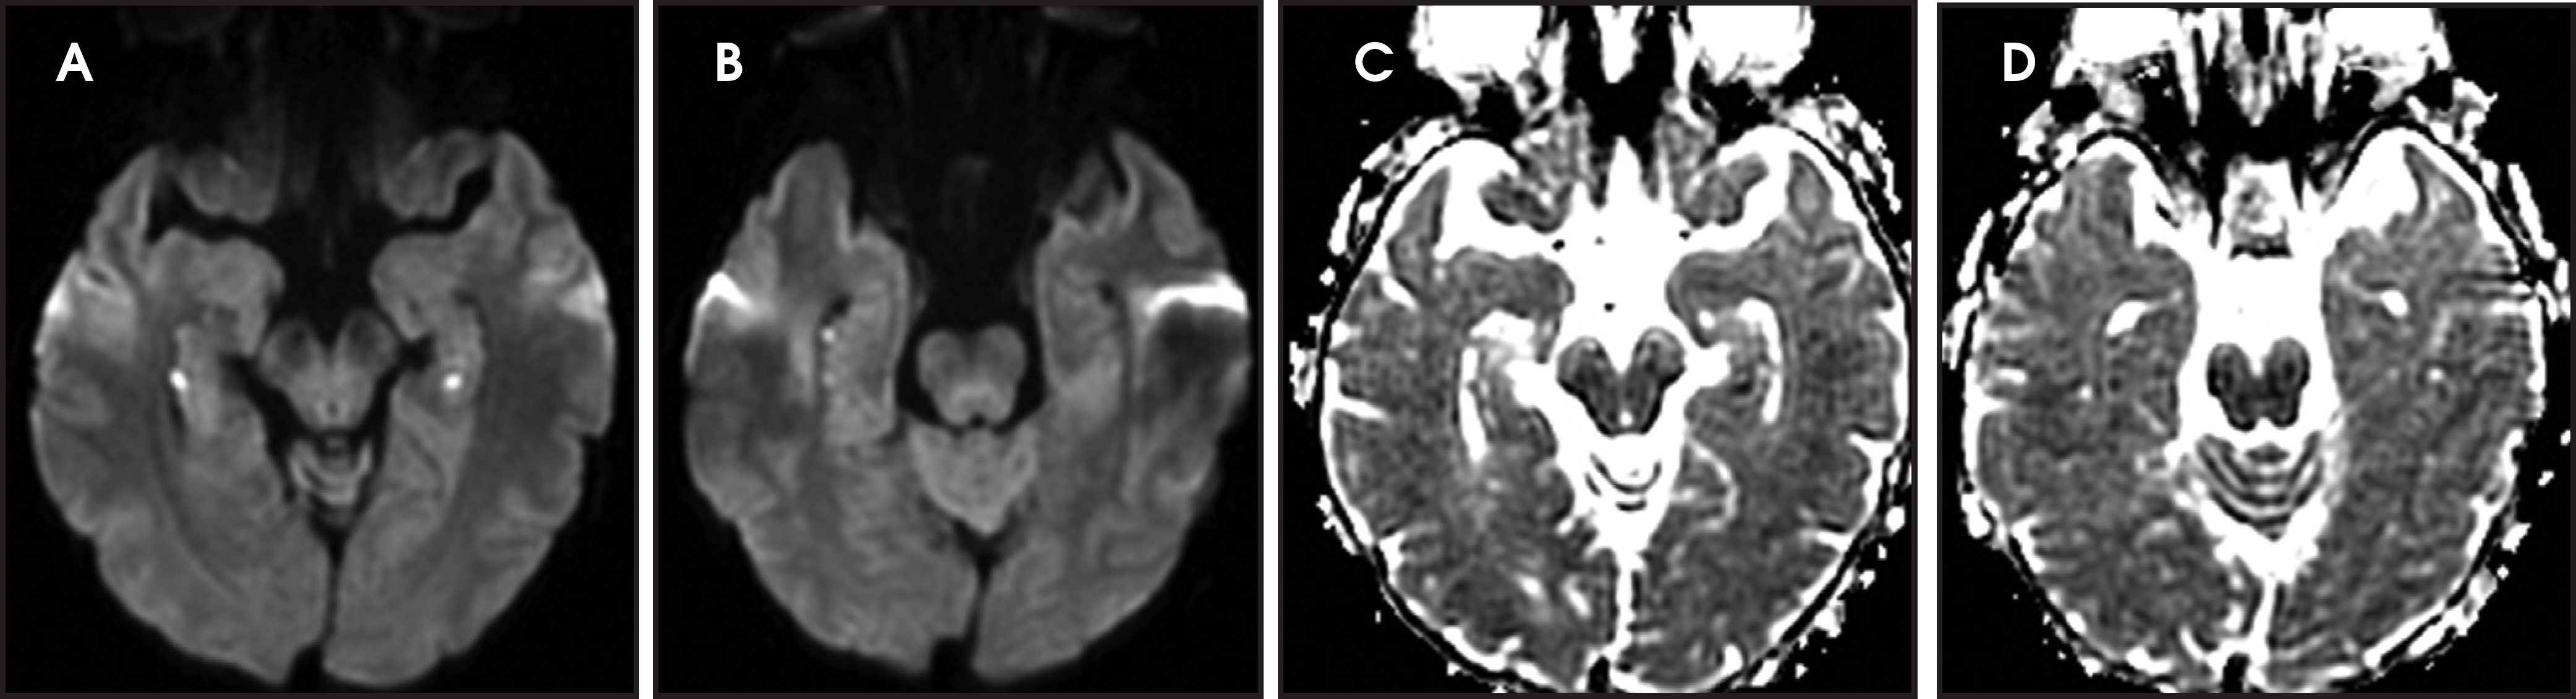
MELAS (Mitochondrial encephalopathy, lactic acidosis, and stroke-like events)
MELAS presents with nausea, vomiting, seizures, muscle weakness and abrupt neurological deficits, usually by age 40.76 MRI shows T2 hyperintensity, swelling and restricted diffusion in the cortex and subcortical white matter.45 The distinguishing factors are multifocal lesions in various stages of evolution, simultaneous areas of restricted and elevated diffusion in acute lesions, nonvascular distribution and a predilection for the posterior parietal and occipital lobes (Figure 6).77,78
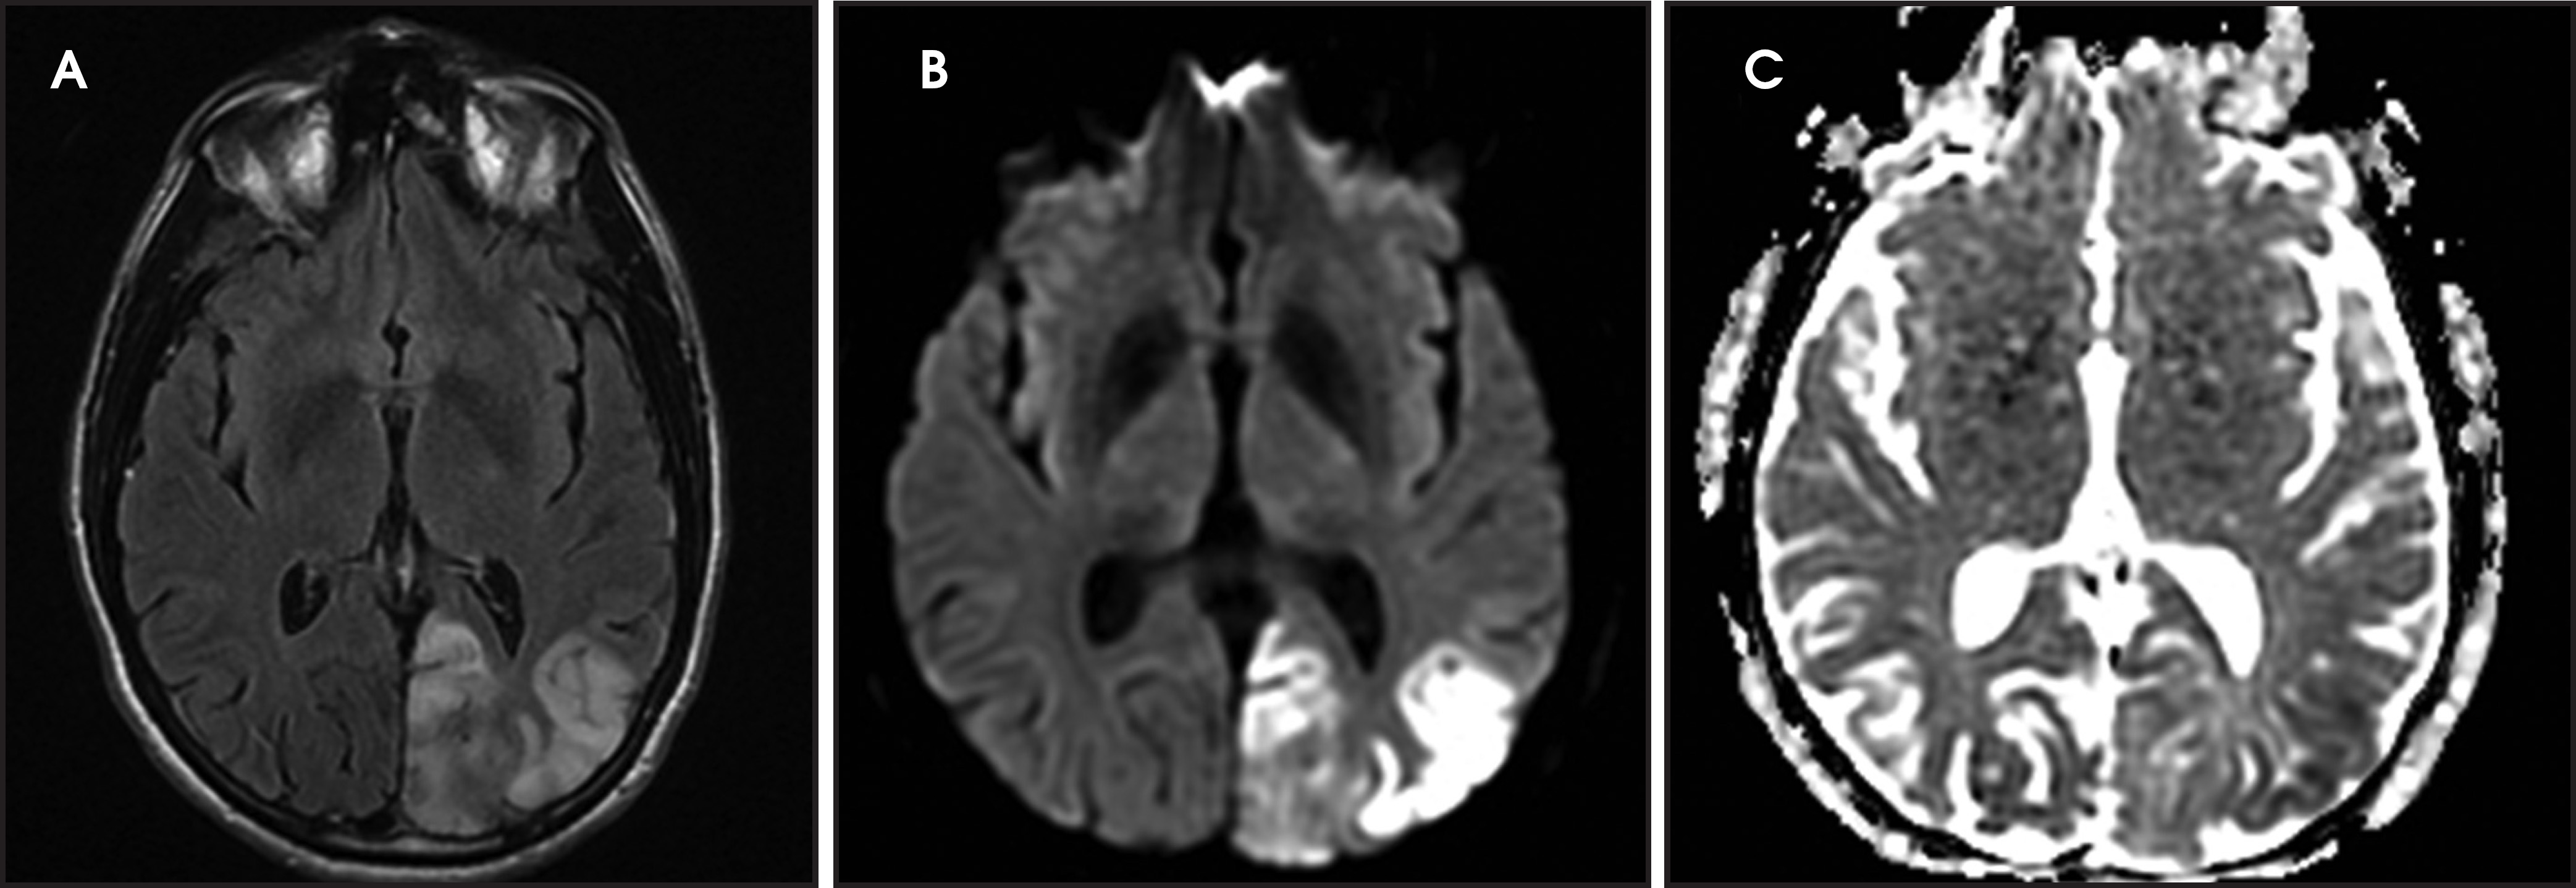
Venous infarctions
Venous thrombosis is uncommon and accounts for 1% of all strokes.79 It may show normal parenchyma, lesions characterized by vasogenic edema with elevated diffusion, lesions characterized by cytotoxic edema with restricted diffusion and/or hemorrhagic lesions, all in a non-arterial distribution.80 Restricted diffusion may be reversible, particularly when it is associated with seizures.81,82 Dural venous sinus thrombosis has a cortical and subcortical pattern and thrombosis of the internal veins and straight sinus causes bilateral thalamic involvement.
Cortical and deep gray matter
Hypoxic-ischemic encephalopathy
HIE is the result of global hypoxia.83 The most common causes are cardiac arrest, respiratory failure and shock. In severe cases, the cortex and deep gray nuclei are affected (Figure 7).84,85 In mild cases, a border zone infarction pattern may be seen.86 Rarely, a pure white matter pattern may be seen as global ischemia may induce demyelination.85,86 The cerebellum is usually spared.85,86
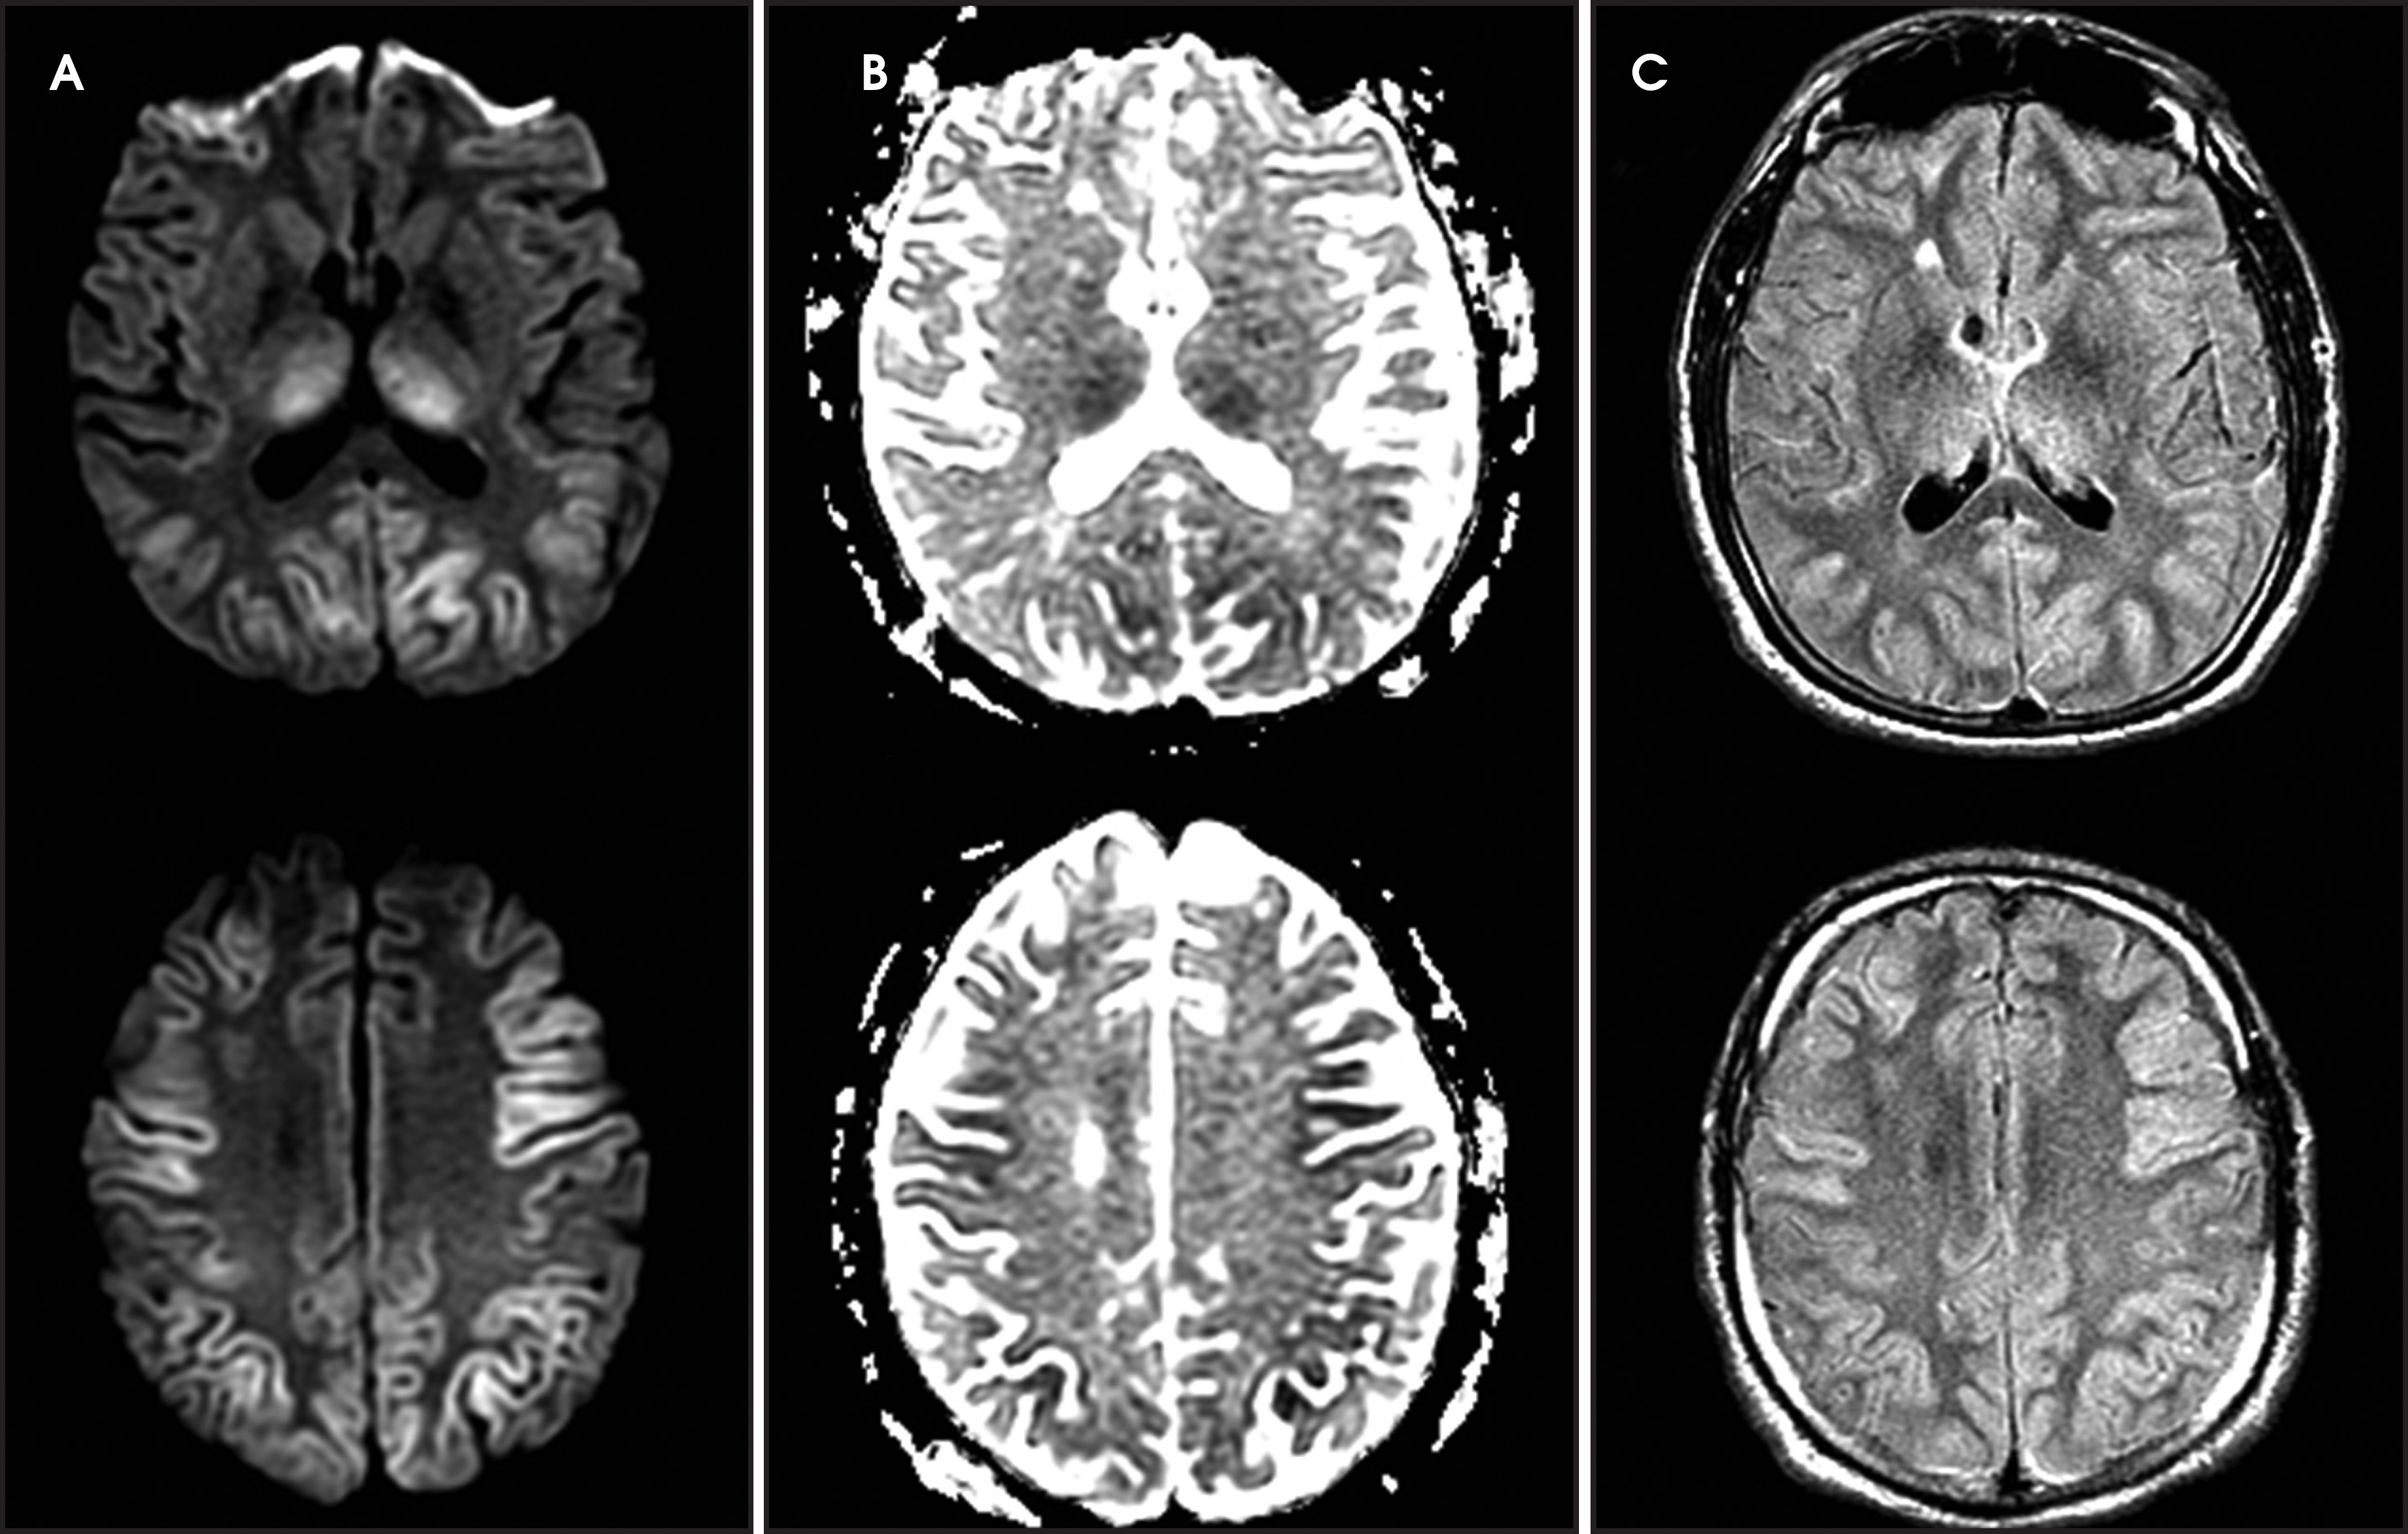
Wernicke’s encephalopathy
Wernicke’s encephalopathy occurs in alcoholics and other malnourished patients with thiamine deficiency. Patients present with altered mental status, memory impairment, ophthalmoplegia or ataxia. Typically, MRI shows symmetric T2/FLAIR hyperintensity in the mammillary bodies, hypothalami, medial thalami, tectal plate and periaqueductal area, but the cerebral cortex may also be involved.87-91 In early stages, restricted diffusion can be seen due to cytotoxic edema (Figure 8).
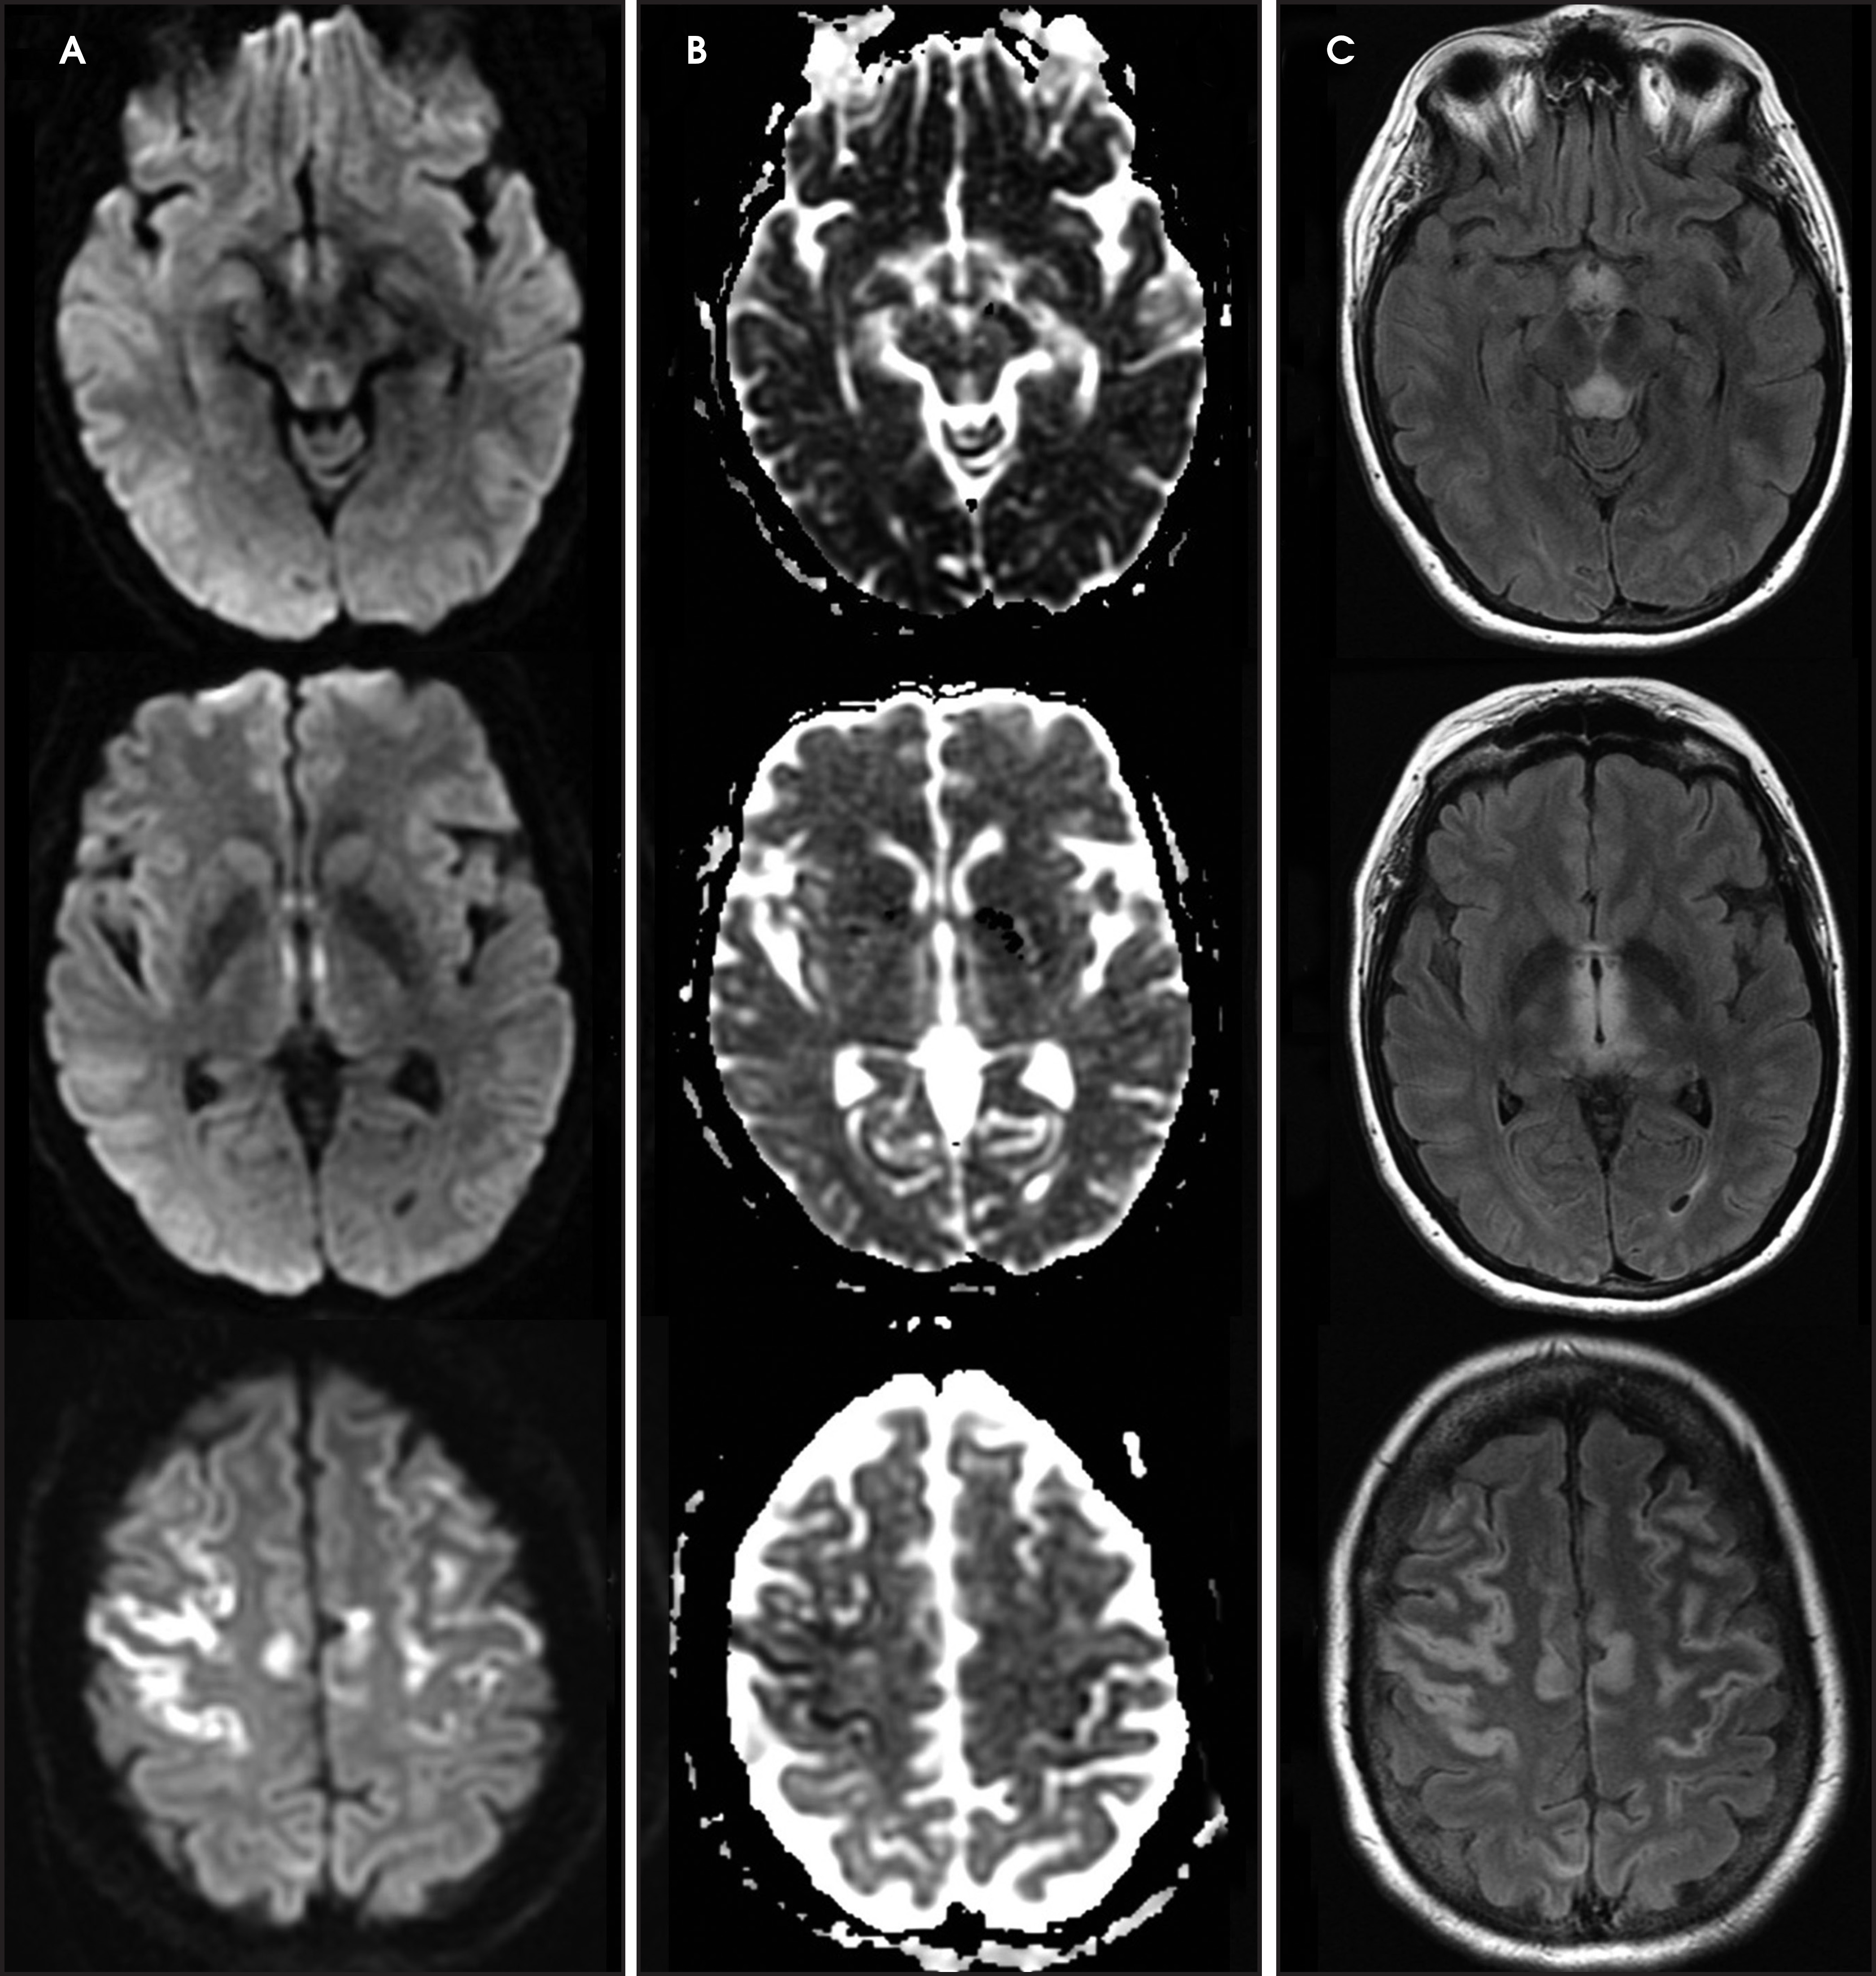
Hepatic encephalopathy
The typical imaging finding in milder cases is symmetric T1 hyperintensity in globus pallidus.92,93 In more severe cases, MRI may show T2 hyperintensity and restricted diffusion in the cortex (especially the cingulate gyri and insula), and basal ganglia (Figure 9).45,92,94,95 The thalami, periventricular white matter and brainstem may also be involved.96 Diffuse cortical involvement can be reversible, but is associated with an increased risk of permanent neurologic sequela.96 The decrease in ADC values is attributed to the excitotoxic injury and osmotic disturbance in astrocytes due to ammonia.97,98
Creutzfeldt-Jakob disease
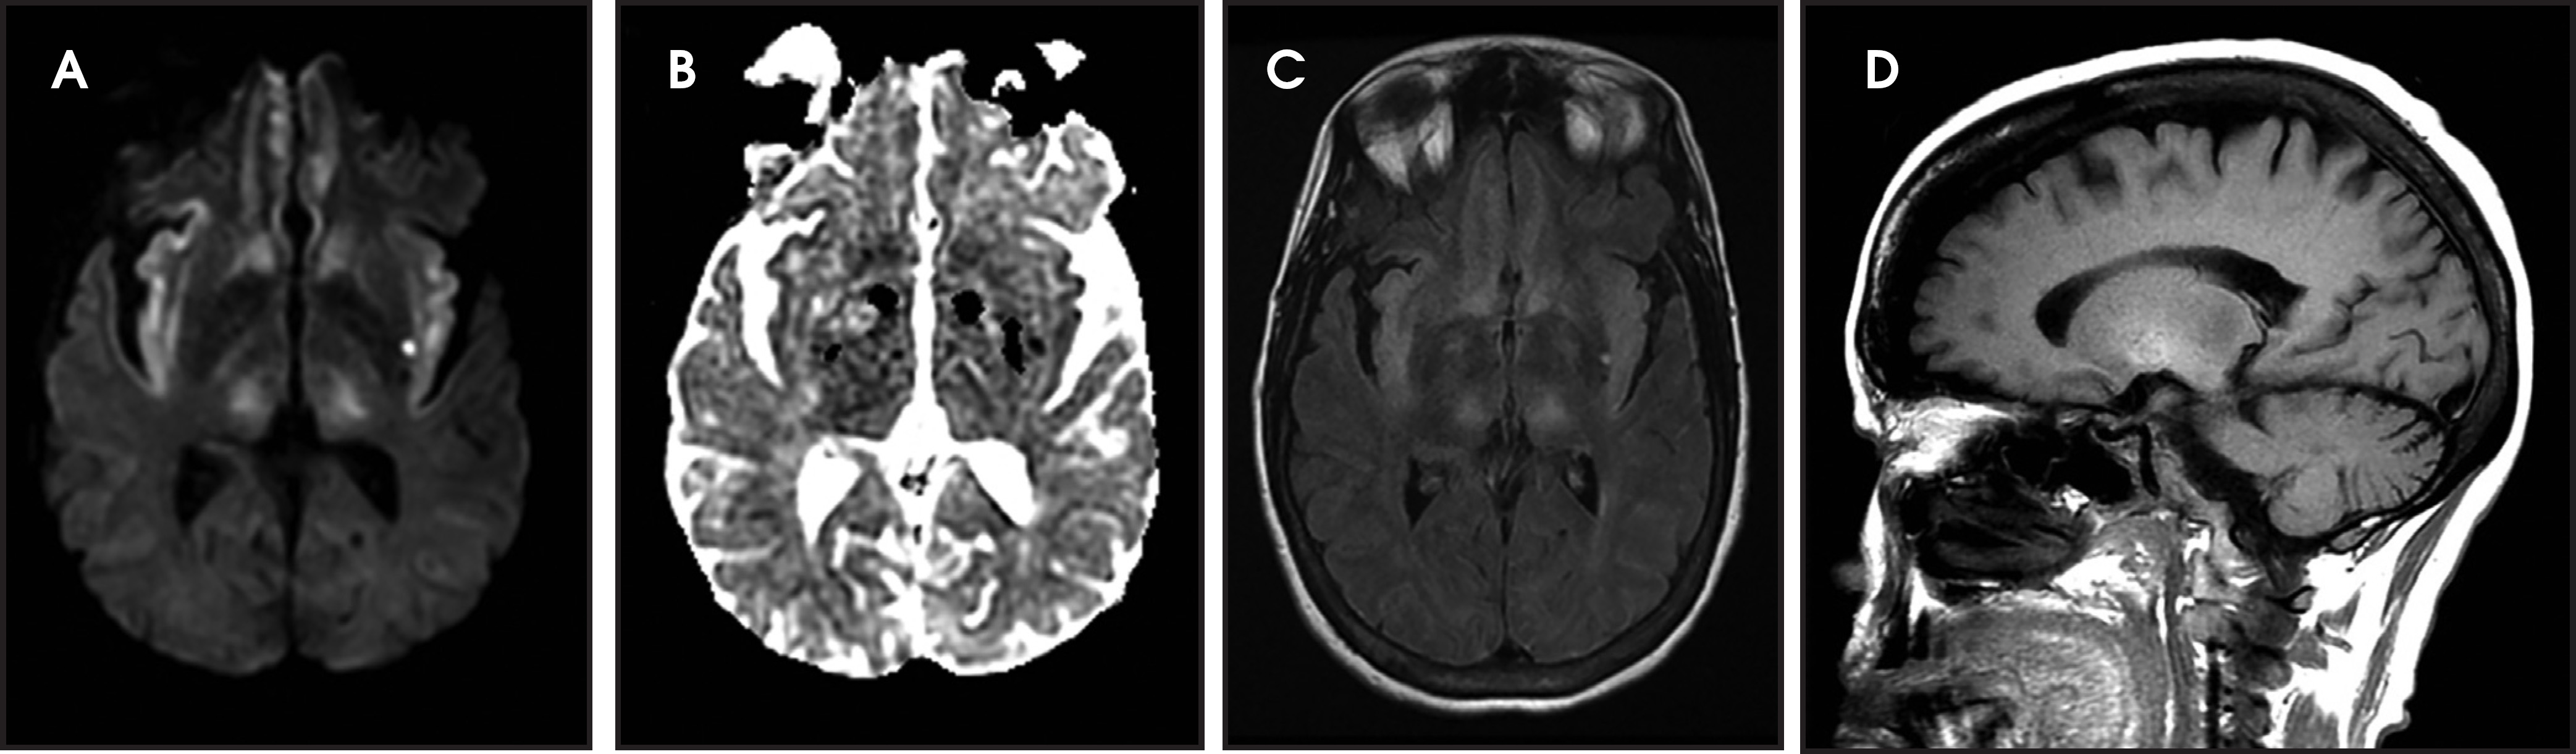
Patients present with a rapidly progressive, transmissible and fatal neurodegenerative disease caused by a misfolded prion protein.99,100 DWI is more sensitive than FLAIR or T2WI and is associated with decreased ADC.101,102 In CJD there is symmetric involvement of the basal ganglia and either symmetrical or asymmetrical involved of the cortex (Figure 10).103-107
Eastern equine encephalitis
The agent is a mosquito-borne arbovirus, and presentation ranges from flu-like symptoms, confusion and somnolence to neurological deficits, seizures and coma. Approximately 5% of infections lead to encephalitis, 1/3 of patients die, and the survivors are left with significant morbidity. The lesions typically appear as T2-FLAIR hyperintense lesions in the basal ganglia, thalami and brainstem (Figure 11).108,09 Less commonly cortex and the periventricular white matter are involved.108,109
Deep gray matter diffusion abnormality
Small vessel stroke/penetrating vessel stroke
Small vessel strokes comprise 20-25% of all strokes110 and are located in the distribution of small penetrating arteries, including the lenticulostriate, anterior choroidal, thalamoperforator, and paramedian basilar artery branches. These strokes are usually caused by arteriolosclerosis due to hypertension and are typically less than 15 mm, but a subset are caused by thrombi at the site of arterial occlusion or embolism111,112 and cause infarction in multiple adjacent deep penetrating artery territories.
Carbon monoxide poisoning
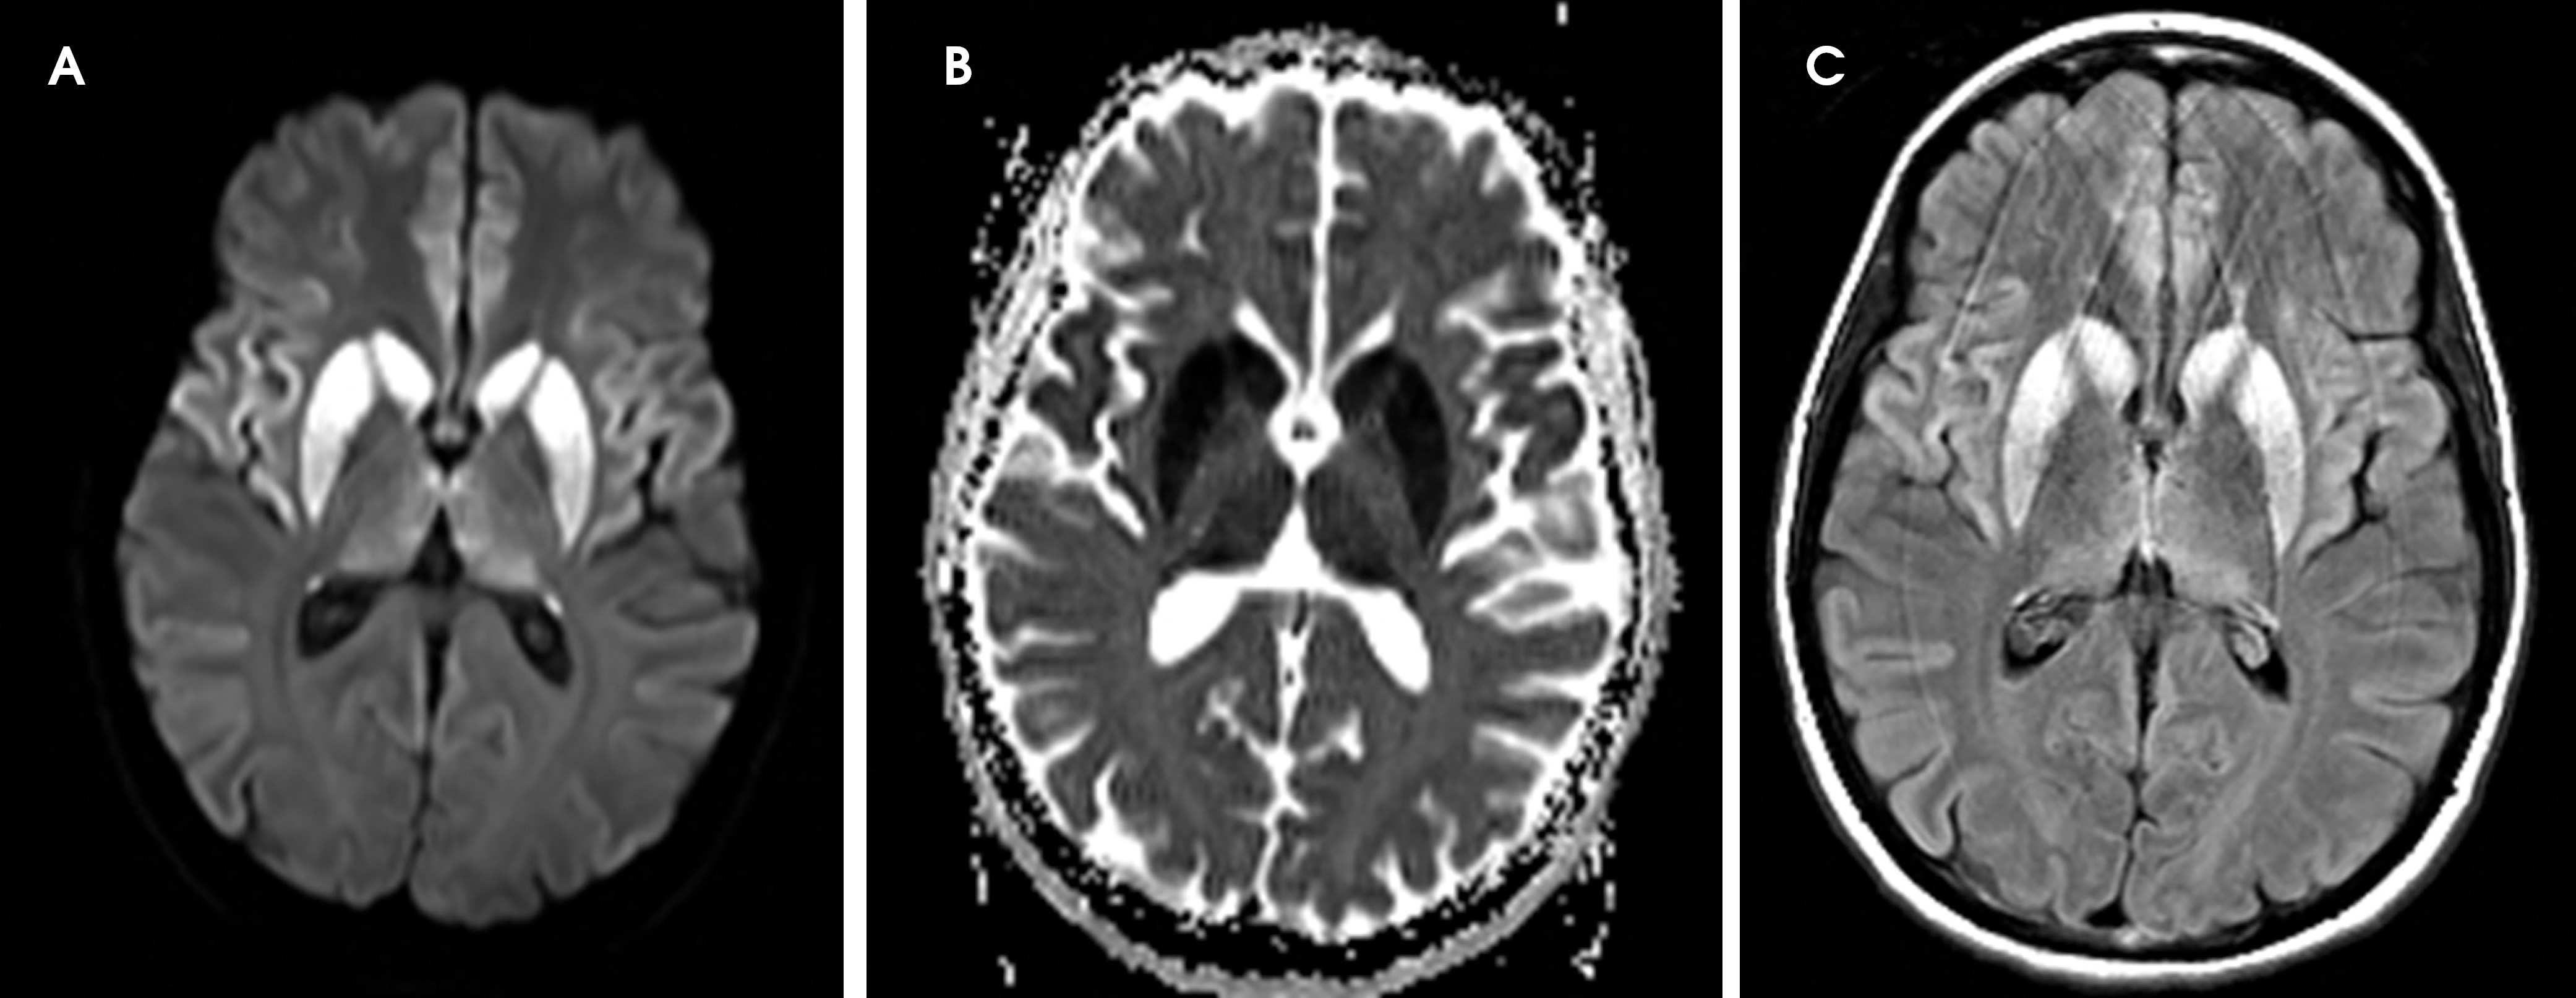
In mild cases, there is a predilection for symmetric restriction diffusion and T2 hyperintensity in the bilateral globus pallidi (Figure 12).113,114 In more severe cases the remainder of the basal ganglia, thalami, hippocampi, supratentorial white matter, corpus callosum, and less often the cerebral cortex may be involved.115 Following a period of transient clinical improvement, a delayed encephalopathy may occur with bilateral confluent periventricular white matter T2 hyperintensity and areas of restricted diffusion.116 Restricted diffusion in the acute phase is likely secondary to cytotoxic edema. In the delayed phase, it may be related to demyelination.116
Osmotic myelinolysis
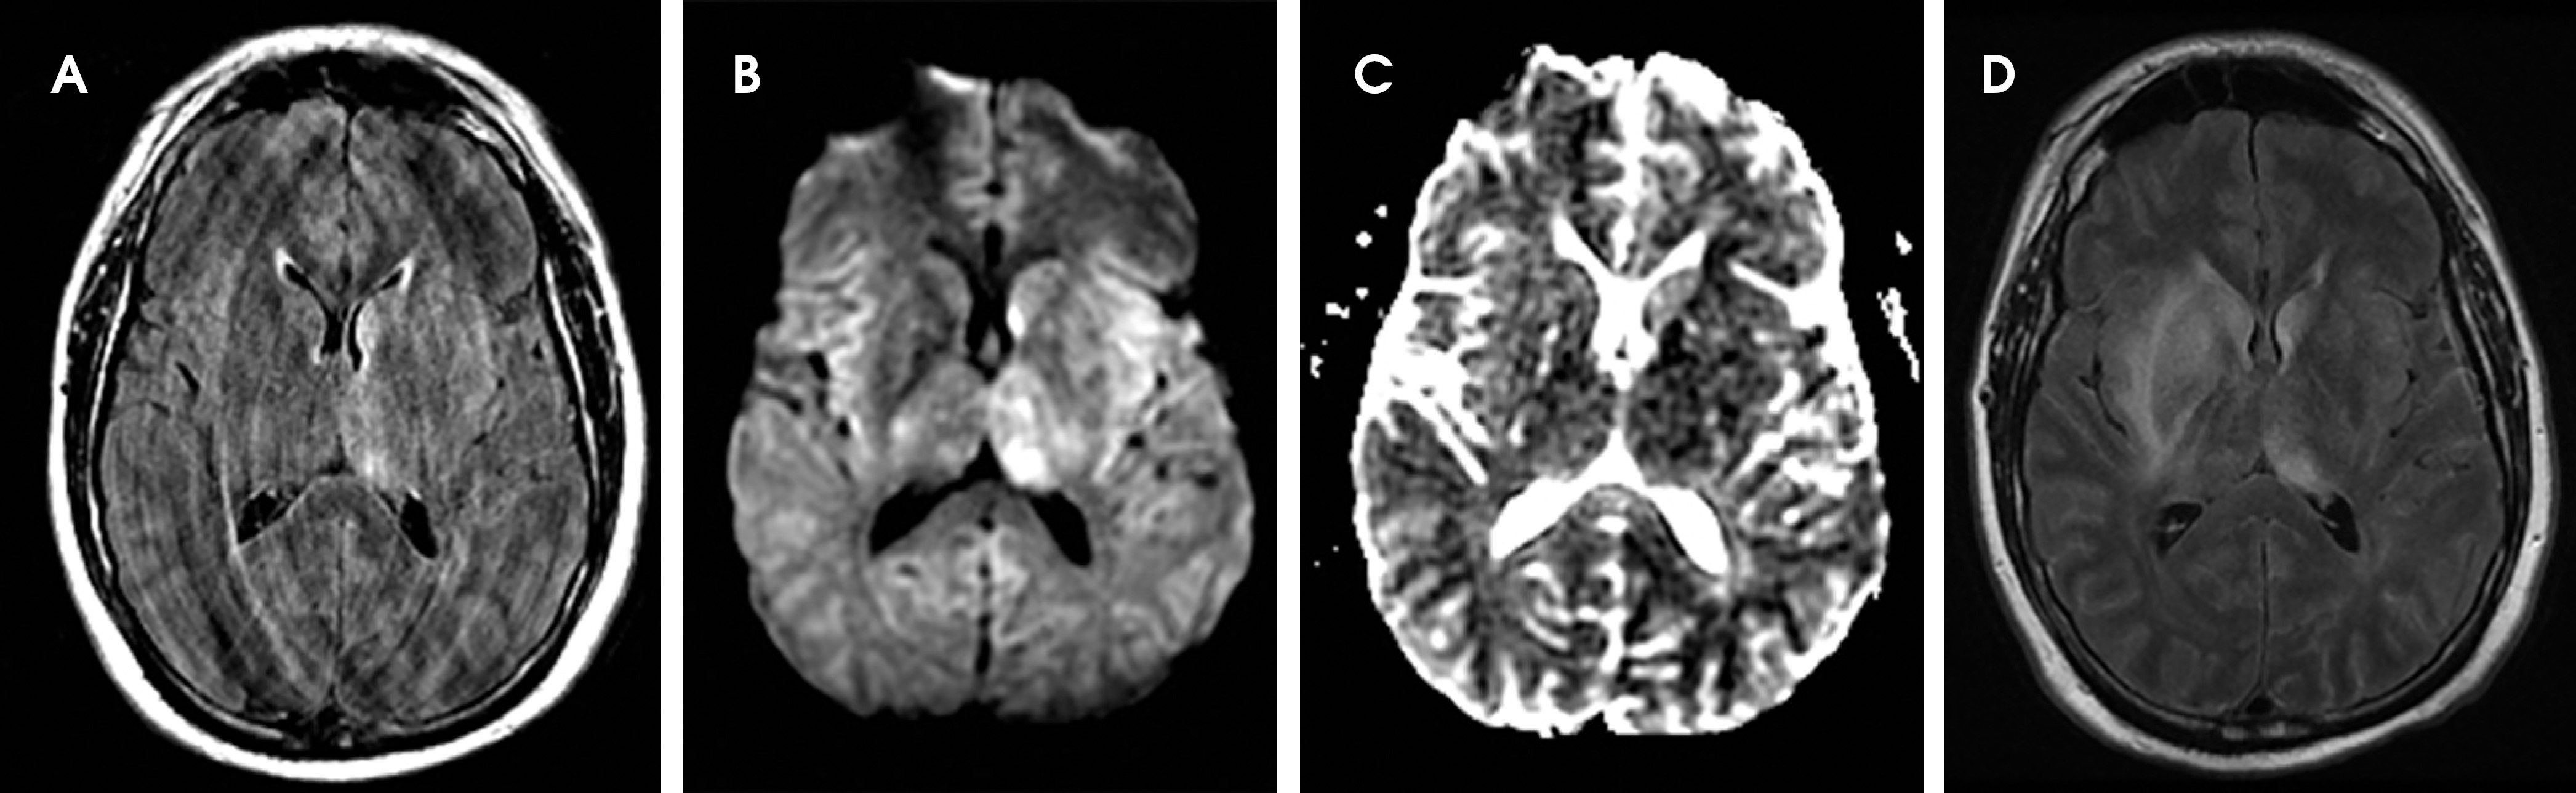
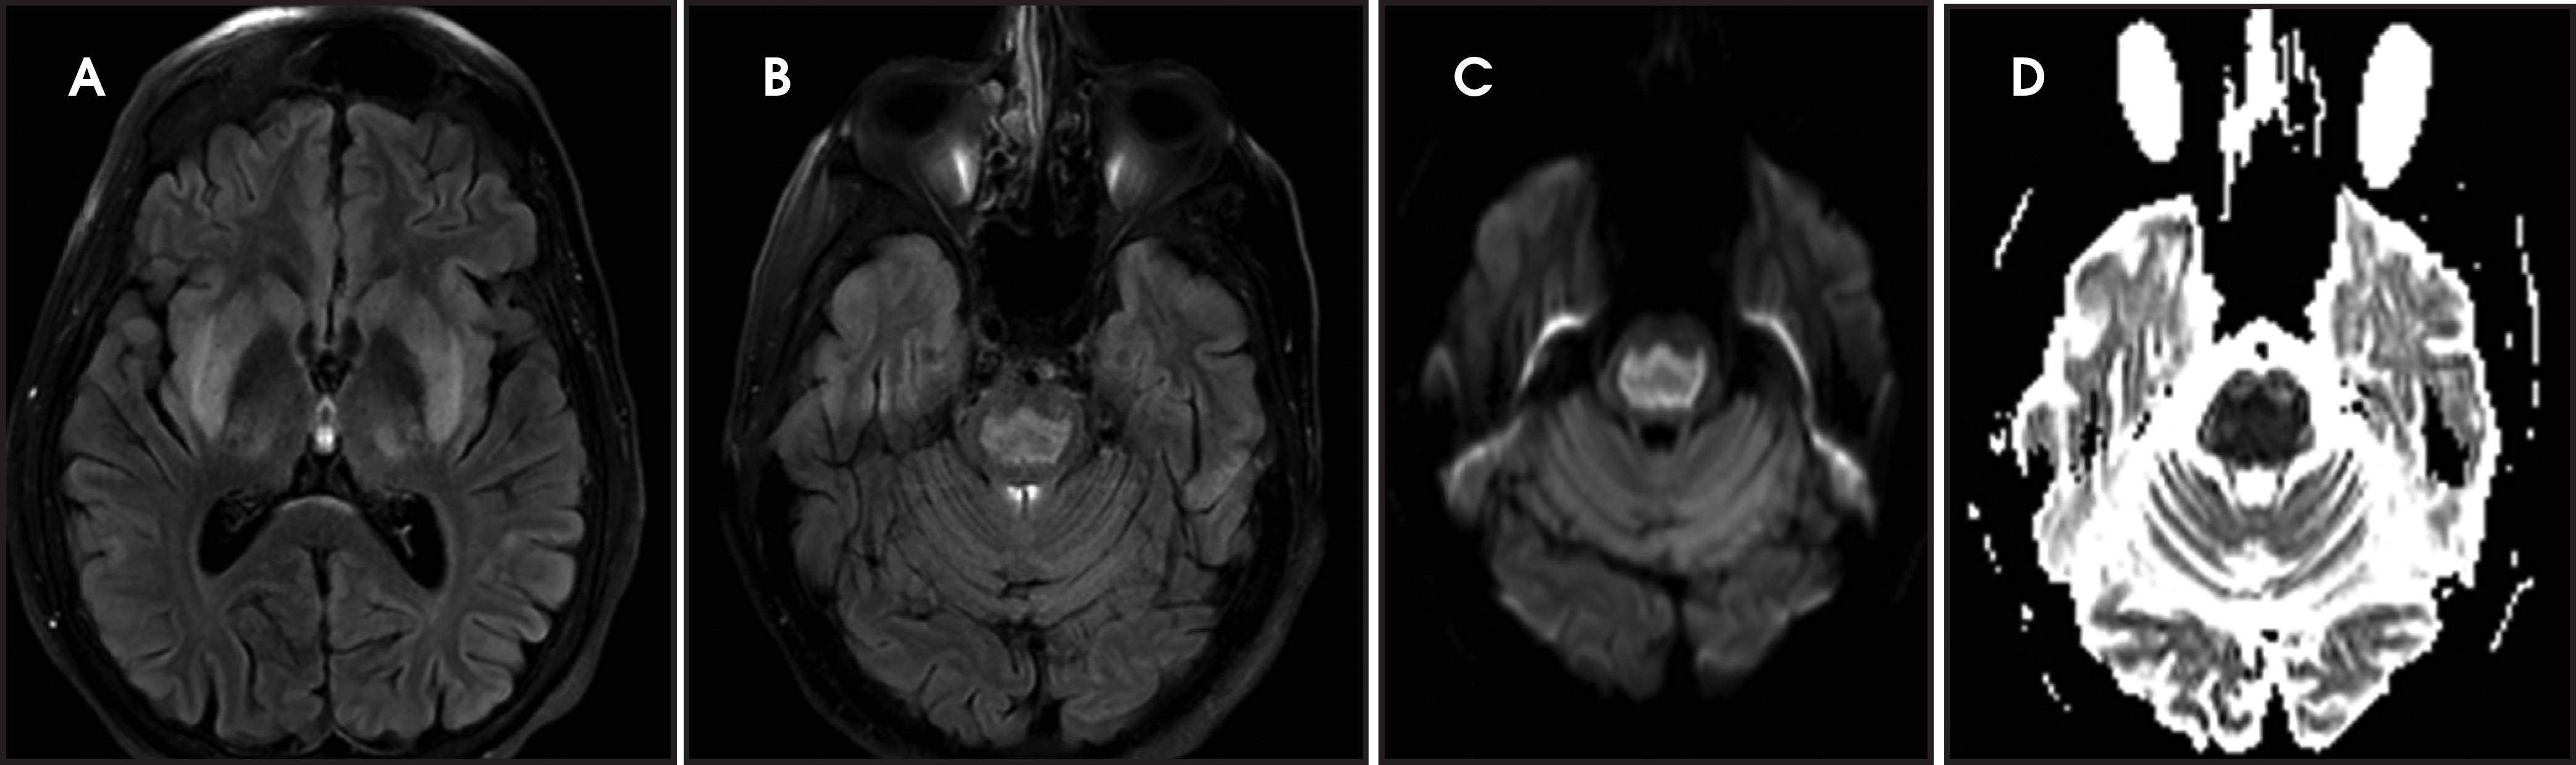
Osmotic myelinolysis is most often due to rapid correction of hyponatremia, but it can be seen with malnourishment, chronic alcoholism, hyperosmolar conditions, such as hyperglycemia, and in liver transplant patients. Patients typically present with pseudobulbar palsy and spastic quadriplegia. It can present with central pontine and/or extrapontine myelinolysis (Figure 13).117 The pontine lesion is centrally located and spares the corticospinal tracts.118 The extrapontine lesions are symmetric and involve the thalamus, basal ganglia and lateral geniculate body and cerebellar white matter.118 The T2 hyperintensity may lag up to 2 weeks, but restricted diffusion appears within the first 24 hours and may persist up to 3 weeks.118-120 The pathogenesis of diffusion restriction in is not fully elucidated, but it may be related to the shift of the extracellular water into the cells or intramyelin splitting, vacuolization, and rupture of myelin sheaths due to osmotic effects.118
Vigabatrin toxicity
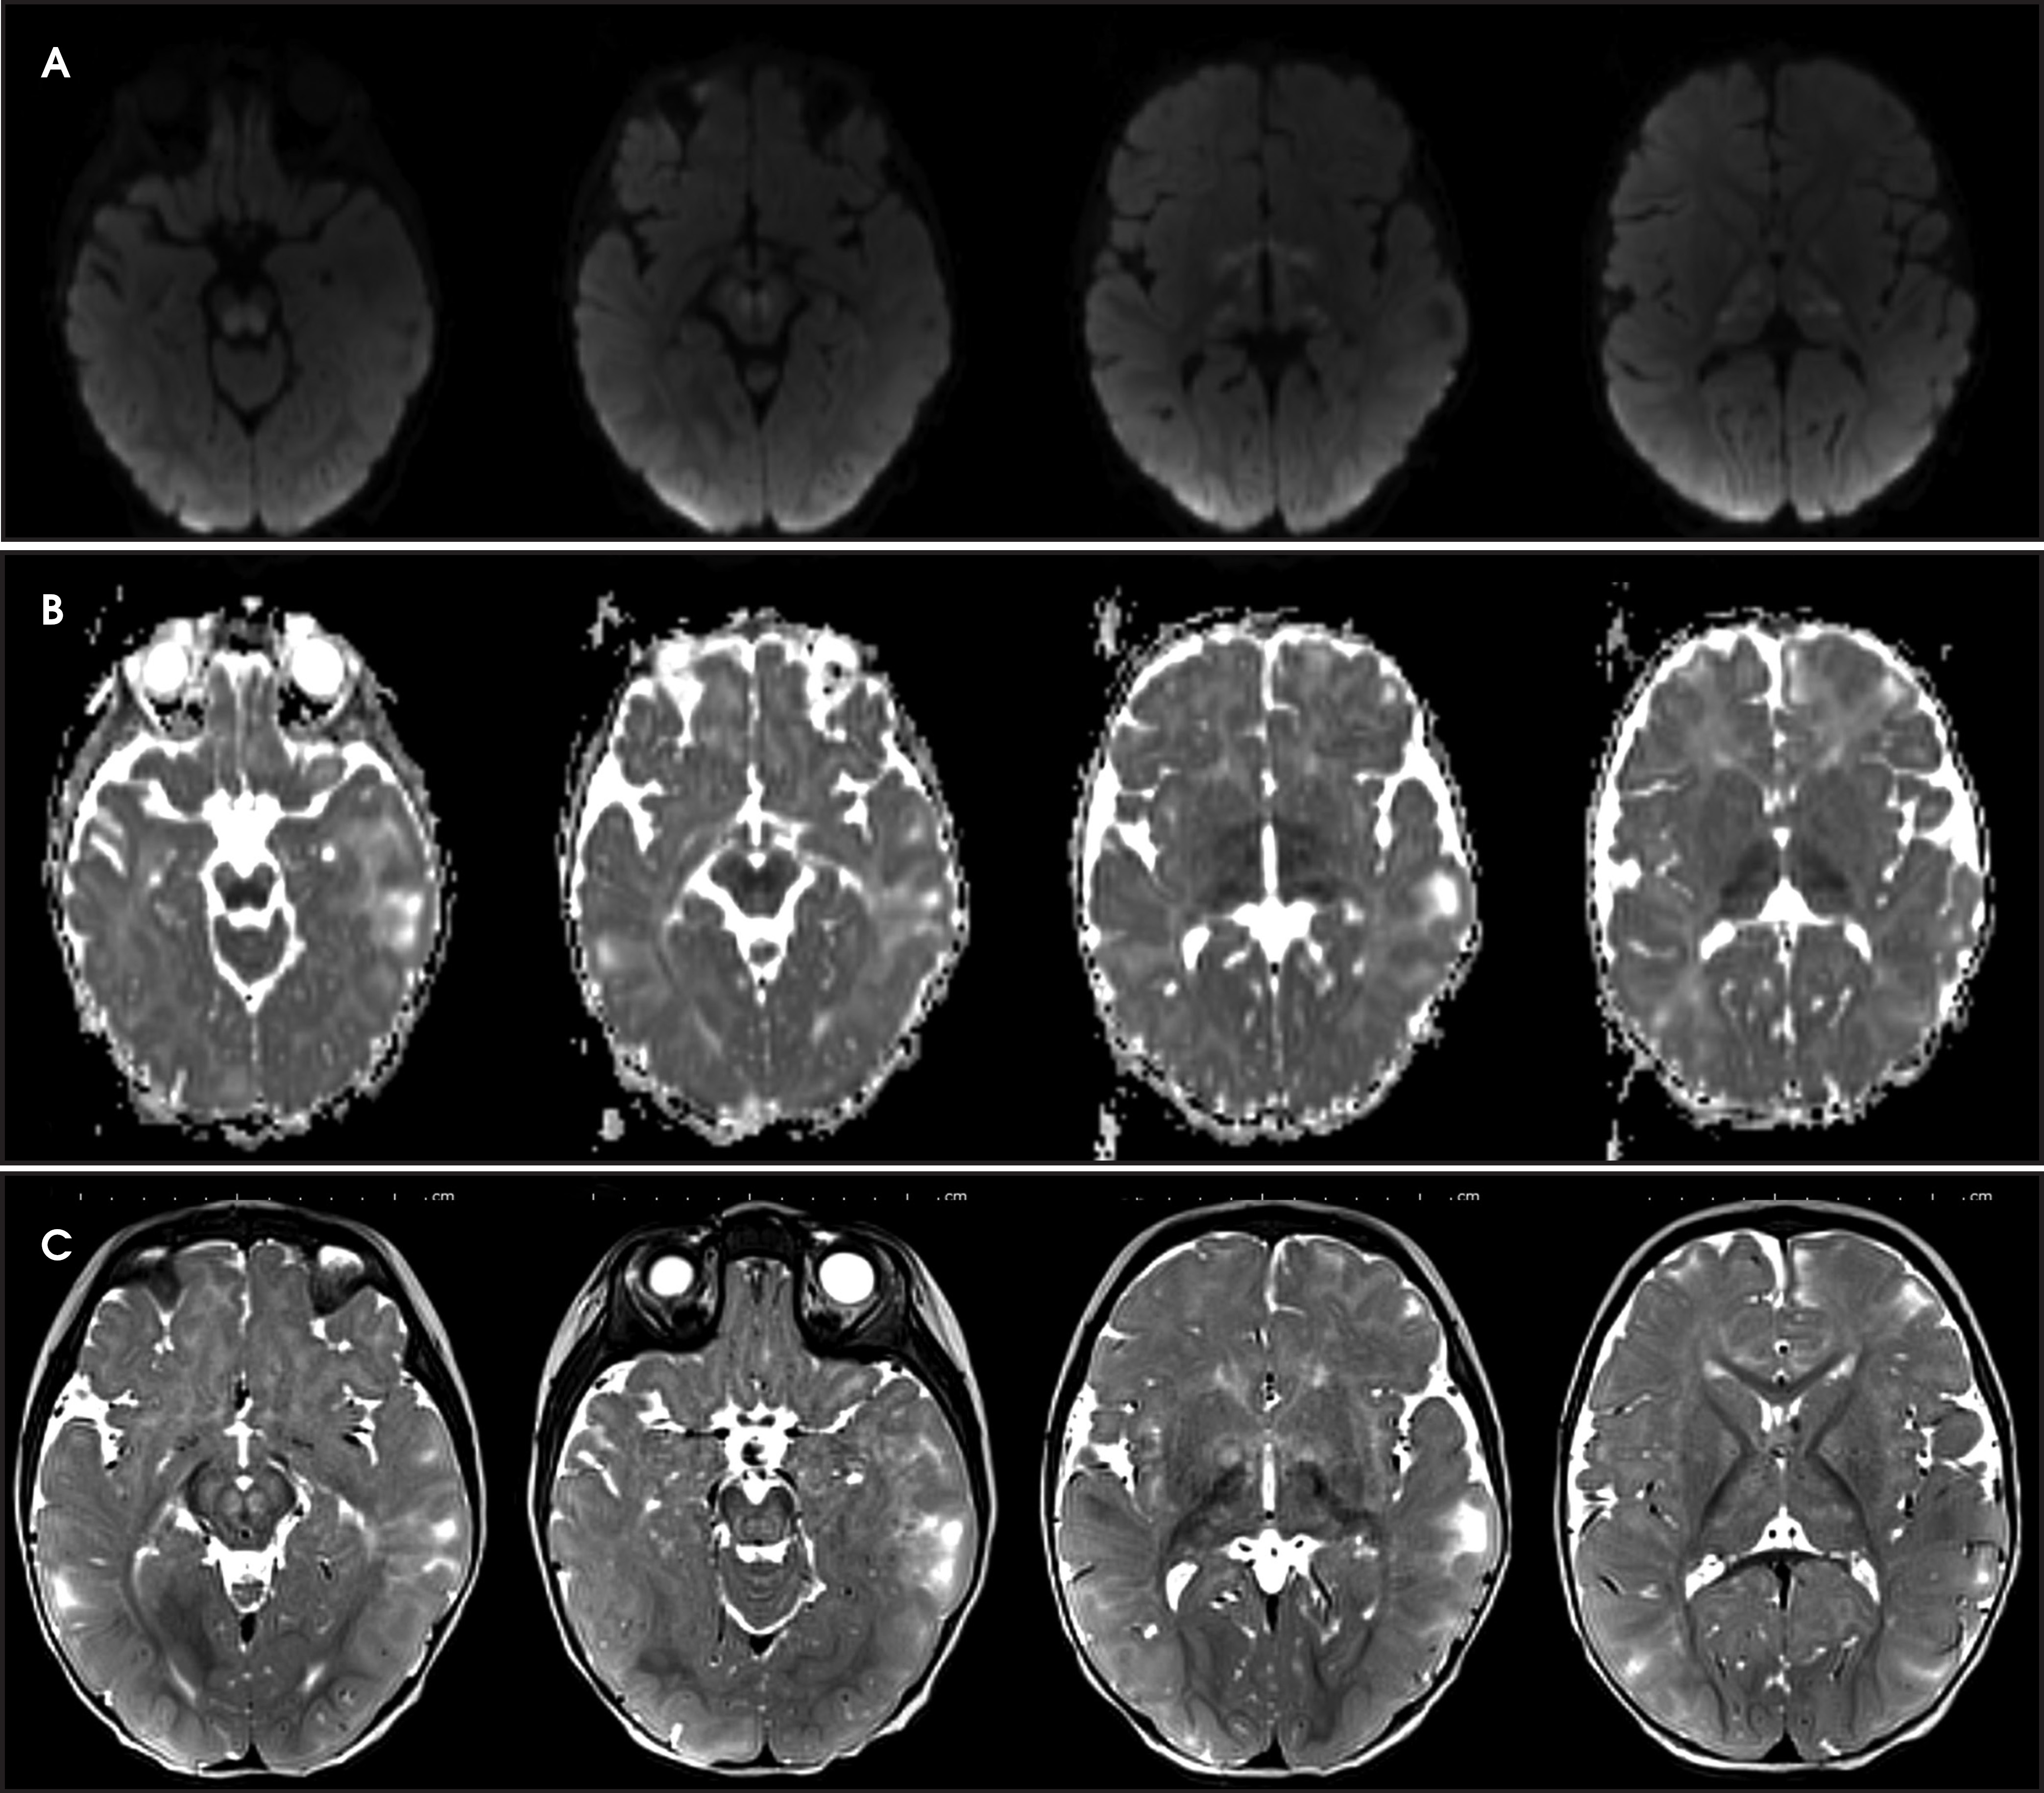
Vigabatrin is used for treatment of infantile spasms and refractory complex partial epilepsy and is associated with asymptomatic transient MRI abnormalities (Figure 14) especially in younger ages.121,122 Toxicity is characterized by symmetric T2 hyperintensity and restricted diffusion in the basal ganglia, thalami, anterior commissure, corpus callosum and midbrain.122,123 The MRI abnormalities typically resolve even without cessation of treatment.122-124 The cause for the T2 and diffusion abnormalities is unclear, although it is suggested that it may be related to intramyelin edema.125
Nonketotic hyperglycemia
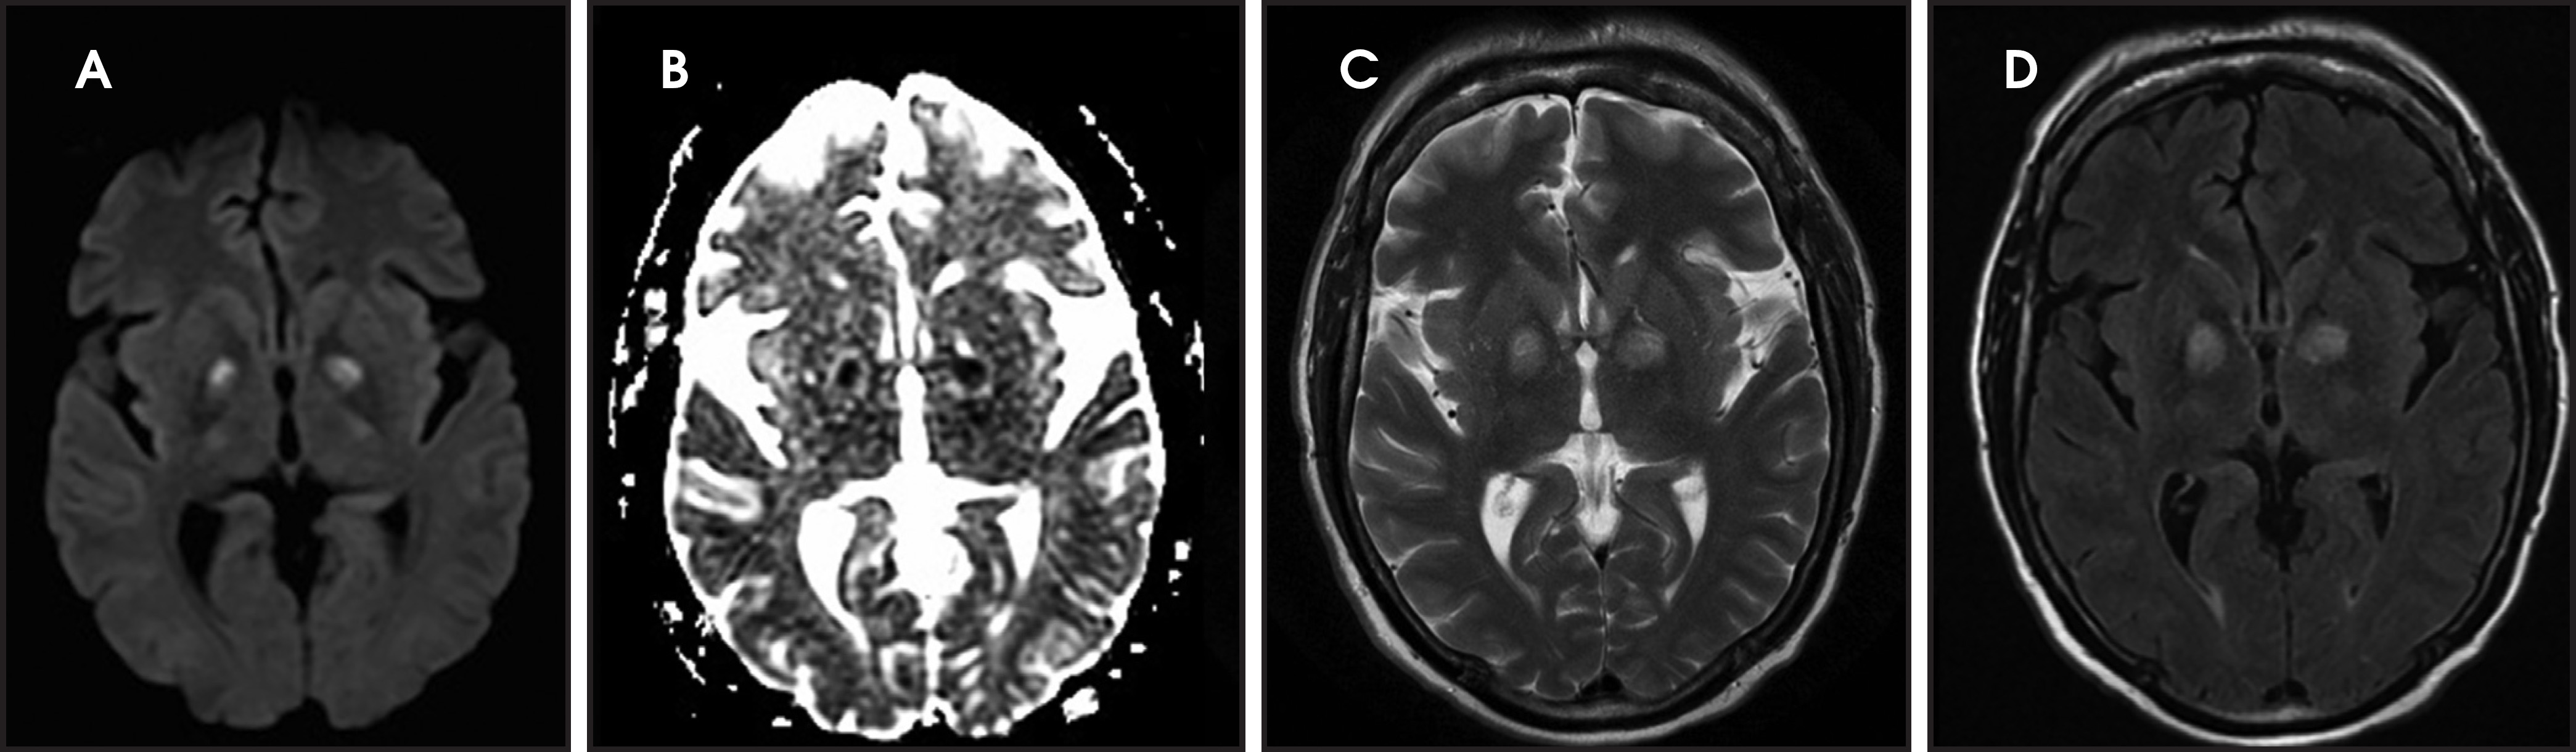
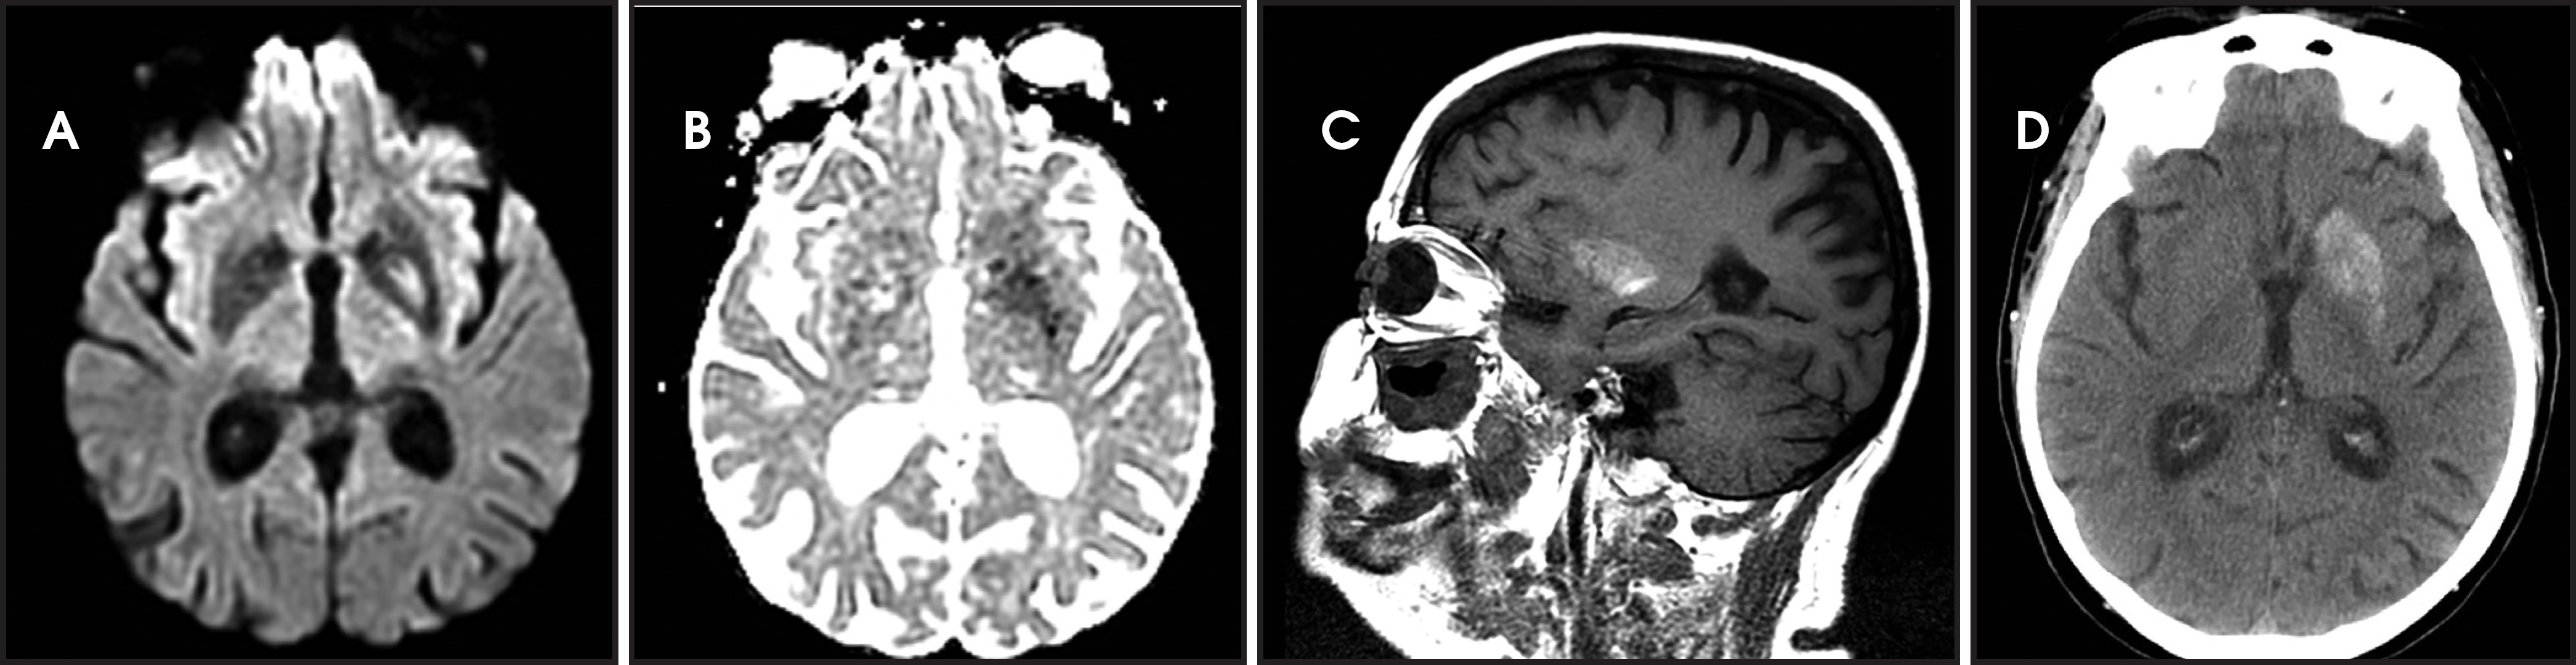
Nonketotic hyperglycemia occurs in patients with diabetes mellitus type 2 and is associated with new-onset chorea, seizures and focal neurologic deficits.126-129 The findings on imaging studies can be either unilateral or bilateral130 and maybe mistaken for a lenticulostriate ischemic stroke (Figure 15). On CT, the basal ganglia appear dense. The MRI findings are T1 hyperintensity, T2 hypointensity, and restricted diffusion with no associated susceptibility effect. The T1 hyperintensity may be related to manganese in reactive astrocytes.130 The pathophysiologic mechanisms for restricted diffusion remain controversial and include protein desiccation, myelin breakdown, hyperviscosity, microcalcification, and microhemorrhage.130-132
Conclusion
Stroke mimics are common in the emergency department and some of these patients may be treated with intravenous tPA. Despite many clinical and imaging overlaps, a pattern-based approach provides a reasonably accurate method to diagnose of many of these conditions and facilitate appropriate and timely management.
Part 2 of this article may be found online at www.appliedradiology.com.
References
- Hand P, Kwan J, Lindley R, Dennis M, Wardlaw J. Distinguishing between stroke and mimic at the bedside: The brain attack study.. Stroke.. 2006;37:769-775.
- Hemmen T, Meyer B, McClean T, Lyden P. Identification of nonischemic stroke mimics among 411 code strokes at the university of california, san diego, stroke center.. J Stroke Cerebrovasc Dis.. 2008;17:23-25.
- Libman R, Wirkowski E, Alvir J, Rao T. Conditions that mimic stroke in the emergency department. Implications for acute stroke trials.. Arch Neurol.. 1995;52:1119-1122.
- Allder S, Moody A, Martel A, Morgan P, Delay G, Gladman J. Limitations of clinical diagnosis in acute stroke.. Lancet.;354.
- Merino J, Luby M, Benson R, Davis L, Hsia A, Latour L. Predictors of acute stroke mimics in 8187 patients referred to a stroke service.. J Stroke Cerebrovasc Dis.. 2013;22.
- Winkler D, Fluri F, Fuhr P, Wetzel S, Lyrer P, Ruegg S. Thrombolysis in stroke mimics: Frequency, clinical characteristics, and outcome.. Stroke.. 2009;40:1522-1525.
- The multicenter acute stroke trial–europe study group. New Engl J Med.. 1996;335:145-150.
- Forster A, Griebe M, Wolf M, Szabo K, Hennerici M, Kern R. How to identify stroke mimics in patients eligible for intravenous thrombolysis?. J Neurol. 2012;259:1347-1353.
- Ay H, Buonanno F, Rordorf G, Schaefer P, Schwamm L, Wu O. Normal diffusion-weighted MRI during stroke-like deficits.. Neurology.. 1999;52:1784-1792.
- Moritani T, Smoker W, Sato Y, Numaguchi Y, Westesson P. Diffusion-weighted imaging of acute excitotoxic brain injury.. AJNR Am J Neuroradiol.. 2005;26:216-228.
- Kang E, Jeon S, Choi S, Song C, Yu I. Diffusion MR imaging of hypoglycemic encephalopathy.. AJNR Am J Neuroradiol.. 2010;31:559-564.
- Moritani T, Shrier D, Numaguchi Y, Takase Y, Takahashi C, Wang H. Diffusion-weighted echo-planar MR imaging: Clinical applications and pitfalls — a pictorial essay.. Clin imaging.. 2000;24:181-192.
- Lim C, Tan K, Verma K, Yin H, Venketasubramanian N. Combined diffusion-weighted and spectroscopic MR imaging in Creutzfeldt-Jakob disease.. Magn Res Imaging.. 2004;22:625-629.
- Glaser N, Ngo C, Anderson S, Yuen N, Trifu A, O’Donnell M. Effects of hyperglycemia and effects of ketosis on cerebral perfusion, cerebral water distribution, and cerebral metabolism.. Diabetes.. 2012;61:1837-1831.
- Winbeck K, Etgen T, von Einsiedel H, Rottinger M, Sander D. Dwi in transient global amnesia and tia: Proposal for an ischaemic origin of tga.. J Neuro, Neurosurg, Psych.. 2005;76:438-441.
- Wolters E, van Wijngaarden G, Stam F, Rengelink H, Lousberg R, Schipper M. Leucoencephalopathy after inhaling “heroin” pyrolysate.. Lancet.. 1982;2:1233-1237.
- Muccio C, De Simone M, Esposito G, De Blasio E, Vittori C, Cerase A. Reversible post-traumatic bilateral extensive restricted diffusion of the brain. A case study and review of the literature.. Brain injury : [BI]. 2009;23:466-472.
- Leys D, Pruvo J, Godefroy O, Rondepierre P, Leclerc X. Prevalence and significance of hyperdense middle cerebral artery in acute stroke.. Stroke.. 1992;23:317-324.
- Goldmakher G, Camargo E, Furie K, Singhal A, Roccatagliata L, Halpern E. Hyperdense basilar artery sign on unenhanced ct predicts thrombus and outcome in acute posterior circulation stroke.. Stroke.. 2009;40:134-139.
- Wardlaw J, Mielke O. Early signs of brain infarction at ct: Observer reliability and outcome after thrombolytic treatment–systematic review.. Radiology.. 2005;235:444-453.
- Mullins M, Schaefer P, Sorensen A, Halpern E, Ay H, He J. Ct and conventional and diffusion-weighted MR imaging in acute stroke: Study in 691 patients at presentation to the emergency department.. Radiology.. 2002;224:353-360.
- Ebinger M, Galinovic I, Rozanski M, Brunecker P, Endres M, Fiebach J. Fluid-attenuated inversion recovery evolution within 12 hours from stroke onset: A reliable tissue clock?. Stroke. 2010;41:250-255.
- Schlaug G, Siewert B, Benfield A, Edelman R, Warach S. Time course of the apparent diffusion coefficient (adc) abnormality in human stroke.. Neurology.. 1997;49:113-119.
- Ng Y, Stein J, Ning M, Black-Schaffer R. Comparison of clinical characteristics and functional outcomes of ischemic stroke in different vascular territories.. Stroke.. 2007;38:2309-2314.
- Brunser A, Illanes S, Lavados P, Munoz P, Carcamo D, Hoppe A. Exclusion criteria for intravenous thrombolysis in stroke mimics: An observational study.. J Stroke Cerebrovasc Dis.. 2013;22:1140-1145.
- Zinkstok S, Engelter S, Gensicke H, Lyrer P, Ringleb P, Artto V. Safety of thrombolysis in stroke mimics: Results from a multicenter cohort study.. Stroke.. 2013;44:1080-1084.
- Cianfoni A, Caulo M, Cerase A, Della Marca G, Falcone C, Di Lella G. Seizure-induced brain lesions: A wide spectrum of variably reversible MRI abnormalities.. Eur J Radiol.. 2013;82:1972-1964.
- Hasegawa D, Orima H, Fujita M, Nakamura S, Takahashi K, Ohkubo S. Diffusion-weighted imaging in kainic acid-induced complex partial status epilepticus in dogs.. Brain Res.. 2003;983:115-127.
- Di Bonaventura C, Bonini F, Fattouch J, Mari F, Petrucci S, Carni M. Diffusion-weighted magnetic resonance imaging in patients with partial status epilepticus.. Epilepsia.. 2009:45-52.
- Righini A, Pierpaoli C, Alger J, Di Chiro G. Brain parenchyma apparent diffusion coefficient alterations associated with experimental complex partial status epilepticus.. Magn Res Imaging.. 1994;12:865-871.
- Lansberg M, O’Brien M, Norbash A, Moseley M, Morrell M, Albers G. MRI abnormalities associated with partial status epilepticus.. Neurology.. 1999;52:1021-1027.
- Sagiuchi T, Ishii K, Asano Y, Aoki Y, Woodhams R, Yanaihara H. Transient seizure activity demonstrated by tc-99m hmpao spect and diffusion-weighted MR imaging.. Ann Nucl Med.. 2001;15:267-270.
- Wieshmann U, Symms M, Shorvon S. Diffusion changes in status epilepticus.. Lancet.. 1997;350:493-494.
- Huang Y, Weng H, Tsai Y, Huang Y, Hsiao M, Wu C. Periictal magnetic resonance imaging in status epilepticus.. Epilepsy Res.. 2009;86:72-81.
- Grant P, He J, Halpern E, Wu O, Schaefer P, Schwamm L. Frequency and clinical context of decreased apparent diffusion coefficient reversal in the human brain.. Radiology.. 2001;221:43-50.
- Kim J, Chung J, Yoon P, Kim D, Chung T, Kim E. Transient mr signal changes in patients with generalized tonicoclonic seizure or status epilepticus: Periictal diffusion-weighted imaging.. AJNR Am J Neuroradiol.. 2001;22:1149-1160.
- Hong K, Cho Y, Lee S, Jeong S, Kim W, Oh E. Diffusion changes suggesting predominant vasogenic oedema during partial status epilepticus.. Seizure.. 2004;13:317-321.
- Milligan T, Zamani A, Bromfield E. Frequency and patterns of MRI abnormalities due to status epilepticus.. Seizure.. 2009;18:104-108.
- Spokoyny I, Raman R, Ernstrom K, Meyer B, Hemmen T. Imaging negative stroke: Diagnoses and outcomes in intravenous tissue plasminogen activator-treated patients.. J Stroke Cerebrovasc Dis.. 2013.
- Floery D, Vosko M, Fellner F, Fellner C, Ginthoer C, Gruber F. Acute-onset migrainous aura mimicking acute stroke: MR perfusion imaging features.. AJNR Am J Neuroradiol.. 2012;33:1546-1552.
- Belvis R, Ramos R, Villa C, Segura C, Pagonabarraga J, Ormazabal I. Brain apparent water diffusion coefficient magnetic resonance image during a prolonged visual aura.. Headache.. 2010;50:1045-1049.
- Toldo I, Cecchin D, Sartori S, Calderone M, Mardari R, Cattelan F. Multimodal neuroimaging in a child with sporadic hemiplegic migraine: A contribution to understanding pathogenesis.. Cephalalgia.. 2011;31:751-756.
- Kumar G, Topper L, Maytal J. Familial hemiplegic migraine with prolonged aura and multimodality imaging: A case report.. Headache.. 2009;49:142-139.
- Arboix A, Massons J, Garcia-Eroles L, Oliveres M, Balcells M, Targa C. Migrainous cerebral infarction in the sagrat cor hospital of barcelona stroke registry.. Cephalalgia.. 2003;23:389-394.
- Liu X, Almast J, Ekholm S. Lesions masquerading as acute stroke.. J Magn Res Imaging.. 2013;37:15-34.
- Shalchi Z, Bennett A, Hargroves D, Nash J. Diagnostic delay in a case of herpes simplex encephalitis.. BMJ Case Rep.. 2009.
- Townend B, Hanson J, Sturm J, Whyte S. Stroke or encephalitis?. Emerg Med Australas. 2005;17:401-404.
- Whitley R. Viral encephalitis.. New Engl J Med.. 1990;323:242-250.
- Heiner L, Demaerel P. Diffusion-weighted MR imaging findings in a patient with herpes simplex encephalitis.. Eur J Radiol.. 2003;45:195-198.
- Kapur N, Barker S, Burrows E, Ellison D, Brice J, Illis L. Herpes simplex encephalitis: Long term magnetic resonance imaging and neuropsychological profile.. J Neuro, Neurosurg, Psych.. 1994;57:1334-1342.
- Bulakbasi N, Kocaoglu M. Central nervous system infections of herpesvirus family.. Neuroimag Clin Am.. 2008;18:53-84.
- Tsuchiya K, Katase S, Yoshino A, Hachiya J. Diffusion-weighted MR imaging of encephalitis.. AJR Am J Roentgenol.. 1999;173:1097-1099.
- Kuker W, Nagele T, Schmidt F, Heckl S, Herrlinger U. Diffusion-weighted MRI in herpes simplex encephalitis: A report of three cases.. Neuroradiology.. 2004;46:122-125.
- Montgomery B, Pinner C. Transient hypoglycemic hemiplegia.. Arch Intern Med.. 1964;114:680-684.
- Foster J, Hart R. Hypoglycemic hemiplegia: Two cases and a clinical review.. Stroke.. 1987;18:944-946.
- Koike S, Sasaki R. Multi-modal brain imaging showing brain damage to the orbitofrontal cortex and left hemisphere, in a case of prolonged hypoglycemia-induced transient hemiplegia followed by persistent encephalopathy.. Psychiatry Clin Neurosci.. 2013;67:360-362.
- Bottcher J, Kunze A, Kurrat C, Schmidt P, Hagemann G, Witte O. Localized reversible reduction of apparent diffusion coefficient in transient hypoglycemia-induced hemiparesis.. Stroke.. 2005;36.
- Finelli P. Diffusion-weighted mr in hypoglycemic coma.. Neurology.. 2001;57:933.
- Shirayama H, Ohshiro Y, Kinjo Y, Taira S, Teruya I, Nakachi K. Acute brain injury in hypoglycaemia-induced hemiplegia.. Diabet Med.. 2004;21:623-624.
- Maekawa S, Aibiki M, Kikuchi K, Kikuchi S, Umakoshi K. Time related changes in reversible MRI findings after prolonged hypoglycemia.. Clin Neurol Neurosurg.. 2006;108:511-513.
- Lo L, Tan A, Umapathi T, Lim C. Diffusion-weighted MR imaging in early diagnosis and prognosis of hypoglycemia.. AJNR Am J Neuroradiol.. 2006;27:1222-1224.
- Aoki T, Sato T, Hasegawa K, Ishizaki R, Saiki M. Reversible hyperintensity lesion on diffusion-weighted MRI in hypoglycemic coma.. Neurology.. 2004;63:392-393.
- Mori F, Nishie M, Houzen H, Yamaguchi J, Wakabayashi K. Hypoglycemic encephalopathy with extensive lesions in the cerebral white matter.. Neuropathology.. 2006;26:147-152.
- Albayram S, Ozer H, Gokdemir S, Gulsen F, Kiziltan G, Kocer N. Reversible reduction of apparent diffusion coefficient values in bilateral internal capsules in transient hypoglycemia-induced hemiparesis.. AJNR Am J Neuroradiol.. 2006;27:1760-1762.
- Terakawa Y, Tsuyuguchi N, Nunomura K, Murayama N, Fujishige M, Yamamura A. Reversible diffusion-weighted imaging changes in the splenium of the corpus callosum and internal capsule associated with hypoglycemia: Case report.. Neurol Med Chir (Tokyo). 2007;47:486-488.
- Boeve B, Bell D, Noseworthy J. Bilateral temporal lobe MRI changes in uncomplicated hypoglycemic coma.. Can J Neurol Sci.. 1995;22:56-58.
- Auer R, Siesjo B. Hypoglycaemia: Brain neurochemistry and neuropathology.. Baillieres Clin Endocrinol Metab. 1993;7:611-625.
- Kiessling M, Xie Y, Kleihues P. Regionally selective inhibition of cerebral protein synthesis in the rat during hypoglycemia and recovery.. J Neurochem.. 1984;43:1507-1514.
- Hodges J, Warlow C. The aetiology of transient global amnesia. A case-control study of 114 cases with prospective follow-up.. Brain.. 1990;113:639-657.
- Tong D, Grossman M. What causes transient global amnesia? New insights from DWI.. Neurology.. 2004;62:2154-2155.
- Sander K, Sander D. New insights into transient global amnesia: Recent imaging and clinical findings.. Lancet neurology.. 2005;4:437-444.
- Pantoni L, Lamassa M, Inzitari D. Transient global amnesia: A review emphasizing pathogenic aspects.. Acta Neurol Scand.. 2000;102:275-283.
- Quinette P, Guillery-Girard B, Dayan J, de la Sayette V, Marquis S, Viader F. What does transient global amnesia really mean? Review of the literature and thorough study of 142 cases.. Brain.. 2006;129:1640-1658.
- Sedlaczek O, Hirsch J, Grips E, Peters C, Gass A, Wohrle J. Detection of delayed focal MR changes in the lateral hippocampus in transient global amnesia.. Neurology.. 2004;62:2165-2170.
- Weon Y, Kim J, Lee J, Kim S. Optimal diffusion-weighted imaging protocol for lesion detection in transient global amnesia.. AJNR Am J Neuroradiol.. 2008;29:1324-1328.
- Abe K, Yoshimura H, Tanaka H, Fujita N, Hikita T, Sakoda S. Comparison of conventional and diffusion-weighted MRI and proton mr spectroscopy in patients with mitochondrial encephalomyopathy, lactic acidosis, and stroke-like events.. Neuroradiology.. 2004;46:113-117.
- Ohshita T, Oka M, Imon Y, Watanabe C, Katayama S, Yamaguchi S. Serial diffusion-weighted imaging in melas.. Neuroradiology.. 2000;42:651-656.
- Rosen L, Phillips S, Enzmann D. Magnetic resonance imaging in melas syndrome.. Neuroradiology.. 1990;32:168-171.
- Bousser M, Ferro J. Cerebral venous thrombosis: An update.. Lancet neurology.. 2007;6:162-170.
- Yuh W, Simonson T, Wang A, Koci T, Tali E, Fisher D. Venous sinus occlusive disease: MR findings.. AJNR Am J Neuroradiol.. 1994;15:309-316.
- Mullins M, Grant P, Wang B, Gonzalez R, Schaefer P. Parenchymal abnormalities associated with cerebral venous sinus thrombosis: Assessment with diffusion-weighted MR imaging.. AJNR Am J Neuroradiol.. 2004;25:1666-1675.
- Ducreux D, Oppenheim C, Vandamme X, Dormont D, Samson Y, Rancurel G. Diffusion-weighted imaging patterns of brain damage associated with cerebral venous thrombosis.. AJNR Am J Neuroradiol.. 2001;22:261-268.
- McKinney A, Teksam M, Felice R, Casey S, Cranford R, Truwit C. Diffusion-weighted imaging in the setting of diffuse cortical laminar necrosis and hypoxic-ischemic encephalopathy.. AJNR Am J Neuroradiol.. 2004;25:1659-1665.
- Regli L, Held M, Anderson R, Meyer F. Nitric oxide synthase inhibition by l-name prevents brain acidosis during focal cerebral ischemia in rabbits.. J Cereb Blood Flow Metab.. 1996;16:988-995.
- Arbelaez A, Castillo M, Mukherji S. Diffusion-weighted MR imaging of global cerebral anoxia.. AJNR Am J Neuroradiol.. 1999;20:999-1007.
- Huang B, Castillo M. Hypoxic-ischemic brain injury: Imaging findings from birth to adulthood.. Radiographics: A review publication of the Radiological Society of North America, Inc.. 2008;28:417-439.
- Zuccoli G, Pipitone N. Neuroimaging findings in acute wernicke’s encephalopathy: Review of the literature.. AJR Am J Roentgenol.. 2009;192:501-508.
- Fei G, Zhong C, Jin L, Wang J, Zhang Y, Zheng X. Clinical characteristics and MR imaging features of nonalcoholic wernicke encephalopathy.. AJNR Am J Neuroradiol.. 2008;29:164-169.
- Zuccoli G, Pipitone N. MR imaging: An increasingly important tool in the early diagnosis of wernicke encephalopathy.. AJNR Am J Neuroradiol.. 2012;33.
- Ha N, Weon Y, Jang J, Kang B, Choi S. Spectrum of MR imaging findings in wernicke encephalopathy: Are atypical areas of involvement only present in nonalcoholic patients?. AJNR Am J Neuroradiol. 2012;33:1398-1402.
- Zuccoli G, Santa Cruz D, Bertolini M, Rovira A, Gallucci M, Carollo C. MR imaging findings in 56 patients with wernicke encephalopathy: Nonalcoholics may differ from alcoholics.. AJNR Am J Neuroradiol. 2009;30:171-176.
- Rosario M, McMahon K, Finelli P. Diffusion-weighted imaging in acute hyperammonemic encephalopathy.. Neurohospitalist.. 2013;3:125-130.
- Morgan M. Cerebral magnetic resonance imaging in patients with chronic liver disease.. Metab Brain Dis.. 1998;13:273-290.
- Arnold S, Els T, Spreer J, Schumacher M. Acute hepatic encephalopathy with diffuse cortical lesions.. Neuroradiology.. 2001;43:551-554.
- Yu E, Bartlett E, Soobrah R, Kucharczyk W. Acute hyperammonemic encephalopathy in adults: Imaging findings.. AJNR Am J Neuroradiol.. 2011;32:413-418.
- McKinney A, Lohman B, Sarikaya B, Uhlmann E, Spanbauer J, Singewald T. Acute hepatic encephalopathy: Diffusion-weighted and fluid-attenuated inversion recovery findings, and correlation with plasma ammonia level and clinical outcome.. AJNR Am J Neuroradiol.. 2010;31:1471-1479.
- Bjerring P, Eefsen M, Hansen B, Larsen F. The brain in acute liver failure. A tortuous path from hyperammonemia to cerebral edema.. Metab Brain Dis.. 2009;24:5-14.
- Vaquero J, Chung C, Blei A. Brain edema in acute liver failure. A window to the pathogenesis of hepatic encephalopathy.. Ann Hepatol.. 2003;2:12-22.
- Prusiner S. Prions.. Proc Natl Acad Sci U S A. 1998;95:13363-13383.
- Brown K, Mastrianni J. The prion diseases.. J Geriatr Psychiatry Neurol.. 2010;23:277-298.
- Kallenberg K, Schulz-Schaeffer W, Jastrow U, Poser S, Meissner B, Tschampa H. Creutzfeldt-jakob disease: Comparative analysis of MR imaging sequences.. AJNR Am J Neuroradiol.. 2006;27:1459-1462.
- Demaerel P, Sciot R, Robberecht W, Dom R, Vandermeulen D, Maes F. Accuracy of diffusion-weighted MR imaging in the diagnosis of sporadic Creutzfeldt-Jakob disease.. J Neurol.. 2003;250:222-225.
- Matoba M, Tonami H, Miyaji H, Yokota H, Yamamoto I. Creutzfeldt-Jakob disease: Serial changes on diffusion-weighted MRI.. Journal of computer assisted tomography. 2001;25:274-277.
- Nitrini R, Mendonca R, Huang N, LeBlanc A, Livramento J, Marie S. Diffusion-weighted MRI in two cases of familial Creutzfeldt—Jakob disease.. J Neurolog Sci.. 2001;184:163-167.
- Mittal S, Farmer P, Kalina P, Kingsley P, Halperin J. Correlation of diffusion-weighted magnetic resonance imaging with neuropathology in Creutzfeldt-Jakob disease.. Arch Neurol.. 2002;59:128-134.
- Tribl G, Strasser G, Zeitlhofer J, Asenbaum S, Jarius C, Wessely P. Sequential MRI in a case of Creutzfeldt-Jakob disease.. Neuroradiology.. 2002;44:223-226.
- Rabinstein A, Whiteman M, Shebert R. Abnormal diffusion-weighted magnetic resonance imaging in Creutzfeldt-Jakob disease following corneal transplantations.. Arch Neurol.. 2002;59:637-639.
- Deresiewicz R, Thaler S, Hsu L, Zamani A. Clinical and neuroradiographic manifestations of eastern equine encephalitis.. New Engl J Med.. 1997;336:1874-1867.
- Lury K, Castillo M. Eastern equine encephalitis: Ct and MRI findings in one case.. Emergency radiology.. 2004;11:46-48.
- Chamorro A, Sacco R, Mohr J, Foulkes M, Kase C, Tatemichi T. Clinical-computed tomographic correlations of lacunar infarction in the stroke data bank.. Stroke.. 1991;22:175-181.
- Fisher C. The arterial lesions underlying lacunes.. Acta neuropathologica.. 1968;12:1-15.
- Gan R, Sacco R, Kargman D, Roberts J, Boden-Albala B, Gu Q. Testing the validity of the lacunar hypothesis: The northern manhattan stroke study experience.. Neurology.. 1997;48:1204-1211.
- Kinoshita T, Sugihara S, Matsusue E, Fujii S, Ametani M, Ogawa T. Pallidoreticular damage in acute carbon monoxide poisoning: Diffusion-weighted MR imaging findings.. AJNR Am J Neuroradiol.. 2005;26:1848-1845.
- Sener R. Acute carbon monoxide poisoning: Diffusion MR imaging findings.. AJNR Am J Neuroradiol.. 2003;24:1475-1477.
- Singhal A, Topcuoglu M, Koroshetz W. Diffusion MRI in three types of anoxic encephalopathy.. J Neurolog Sci.. 2002;196:37-40.
- Kim J, Chang K, Song I, Kim K, Kwon B, Kim H. Delayed encephalopathy of acute carbon monoxide intoxication: Diffusivity of cerebral white matter lesions.. AJNR Am J Neuroradiol.. 2003;24:1592-1597.
- Martin R. Central pontine and extrapontine myelinolysis: The osmotic demyelination syndromes.. J Neuro, Neurosurg, Psych.. 2004;75(3):iii22-28.
- Ruzek K, Campeau N, Miller G. Early diagnosis of central pontine myelinolysis with diffusion-weighted imaging.. AJNR Am J Neuroradiol.. 2004;25:210-213.
- Laureno R, Karp B. Myelinolysis after correction of hyponatremia.. Ann Int Med... 1997;126:57-62.
- Cramer S, Stegbauer K, Schneider A, Mukai J, Maravilla K. Decreased diffusion in central pontine myelinolysis.. AJNR Am J Neuroradiol.. 2001;22:1476-1479.
- Willmore L, Abelson M, Ben-Menachem E, Pellock J, Shields W. Epilepsia.. 2009;50:163-173.
- Pearl P, Vezina L, Saneto R, McCarter R, Molloy-Wells E, Heffron A. Cerebral MRI abnormalities associated with vigabatrin therapy.. Epilepsia.. 2009;50:184-194.
- Desguerre I, Marti I, Valayannopoulos V, Bahi-Buisson N, Dulac O, Plouin P. Transient magnetic resonance diffusion abnormalities in west syndrome: The radiological expression of non-convulsive status epilepticus?. Dev Med Child Neurol.
- Wheless J, Carmant L, Bebin M, Conry J, Chiron C, Elterman R. Magnetic resonance imaging abnormalities associated with vigabatrin in patients with epilepsy.. Epilepsia.. 2009;50:195-205.
- Simao G, Zarei Mahmoodabadi S, Snead O, Go C, Widjaja E. Abnormal axial diffusivity in the deep gray nuclei and dorsal brain stem in infantile spasm treated with vigabatrin.. AJNR Am J Neuroradiol. 2011;32:199-203.
- Oh S, Lee K, Im J, Lee M. Chorea associated with non-ketotic hyperglycemia and hyperintensity basal ganglia lesion on t1-weighted brain MRI study: A meta-analysis of 53 cases including four present cases.. J Neurolog Sci.. 2002;200:57-62.
- Freedman K, Polepalle S. Transient homonymous hemianopia and positive visual phenomena in nonketotic hyperglycemic patients.. Am J Ophthalmol.. 2004;137:1122-1124.
- Ozer F, Mutlu A, Ozkayran T. Reflex epilepsy and non-ketotic hyperglycemia.. Epileptic Disord.. 2003;5:165-168.
- Chen C, Chai J, Wu C, Chen W, Hung H, Lee S. Neuroimaging in seizure patients associated with nonketotic hyperglycemia.. Neuroradiol J.. 2011;24:215-220.
- Wintermark M, Fischbein N, Mukherjee P, Yuh E, Dillon W. Unilateral putaminal ct, mr, and diffusion abnormalities secondary to nonketotic hyperglycemia in the setting of acute neurologic symptoms mimicking stroke.. AJNR Am J Neuroradiol.. 2004;25:975-976.
- Chu K, Kang D, Kim D, Park S, Roh J. Diffusion-weighted and gradient echo magnetic resonance findings of hemichorea-hemiballismus associated with diabetic hyperglycemia: A hyperviscosity syndrome?. Arch Neurol. 2002;59:448-452.
- Shan D. An explanation for putaminal ct, mr, and diffusion abnormalities secondary to nonketotic hyperglycemia.. AJNR Am J Neuroradiol.. 2005;26(194):194-195.
Citation
. Stroke differential diagnosis and mimics: Part 1. Applied Radiology. 2015;44(11):26-39. doi:10.37549/AR2227.