The utility of dual-energy computed tomography in abdominal imaging
Applied Radiology — Vol. 43 , Issue 1 , pp. 12 -19
DOI: 10.37549/AR2048
Published: January 1, 2014
Categories
With continued advances in computed tomography (CT), dual-energy CT (DECT) has emerged as a promising technologic development with numerous applications pertinent to abdominal imaging. With DECT, 2 data sets of the same anatomic location are acquired at different energy settings. By exploiting the differences in energy-related attenuation of tissues within the body, DECT potentially can characterize tissue composition to a greater extent than that possible with single-energy techniques.1
With the introduction of DECT in the late 1970s, early investigators recognized its potential for improving tissue characterization.2-10However, the approach was abandoned quickly because of inherent limitations of older-generation CT scanners. The immature technology required 2 separate scans, which often resulted in poor image registration because of movement of abdominal structures.11 Furthermore, the inefficiency of early detectors led to excessive image noise at low-energy settings.2,11-13
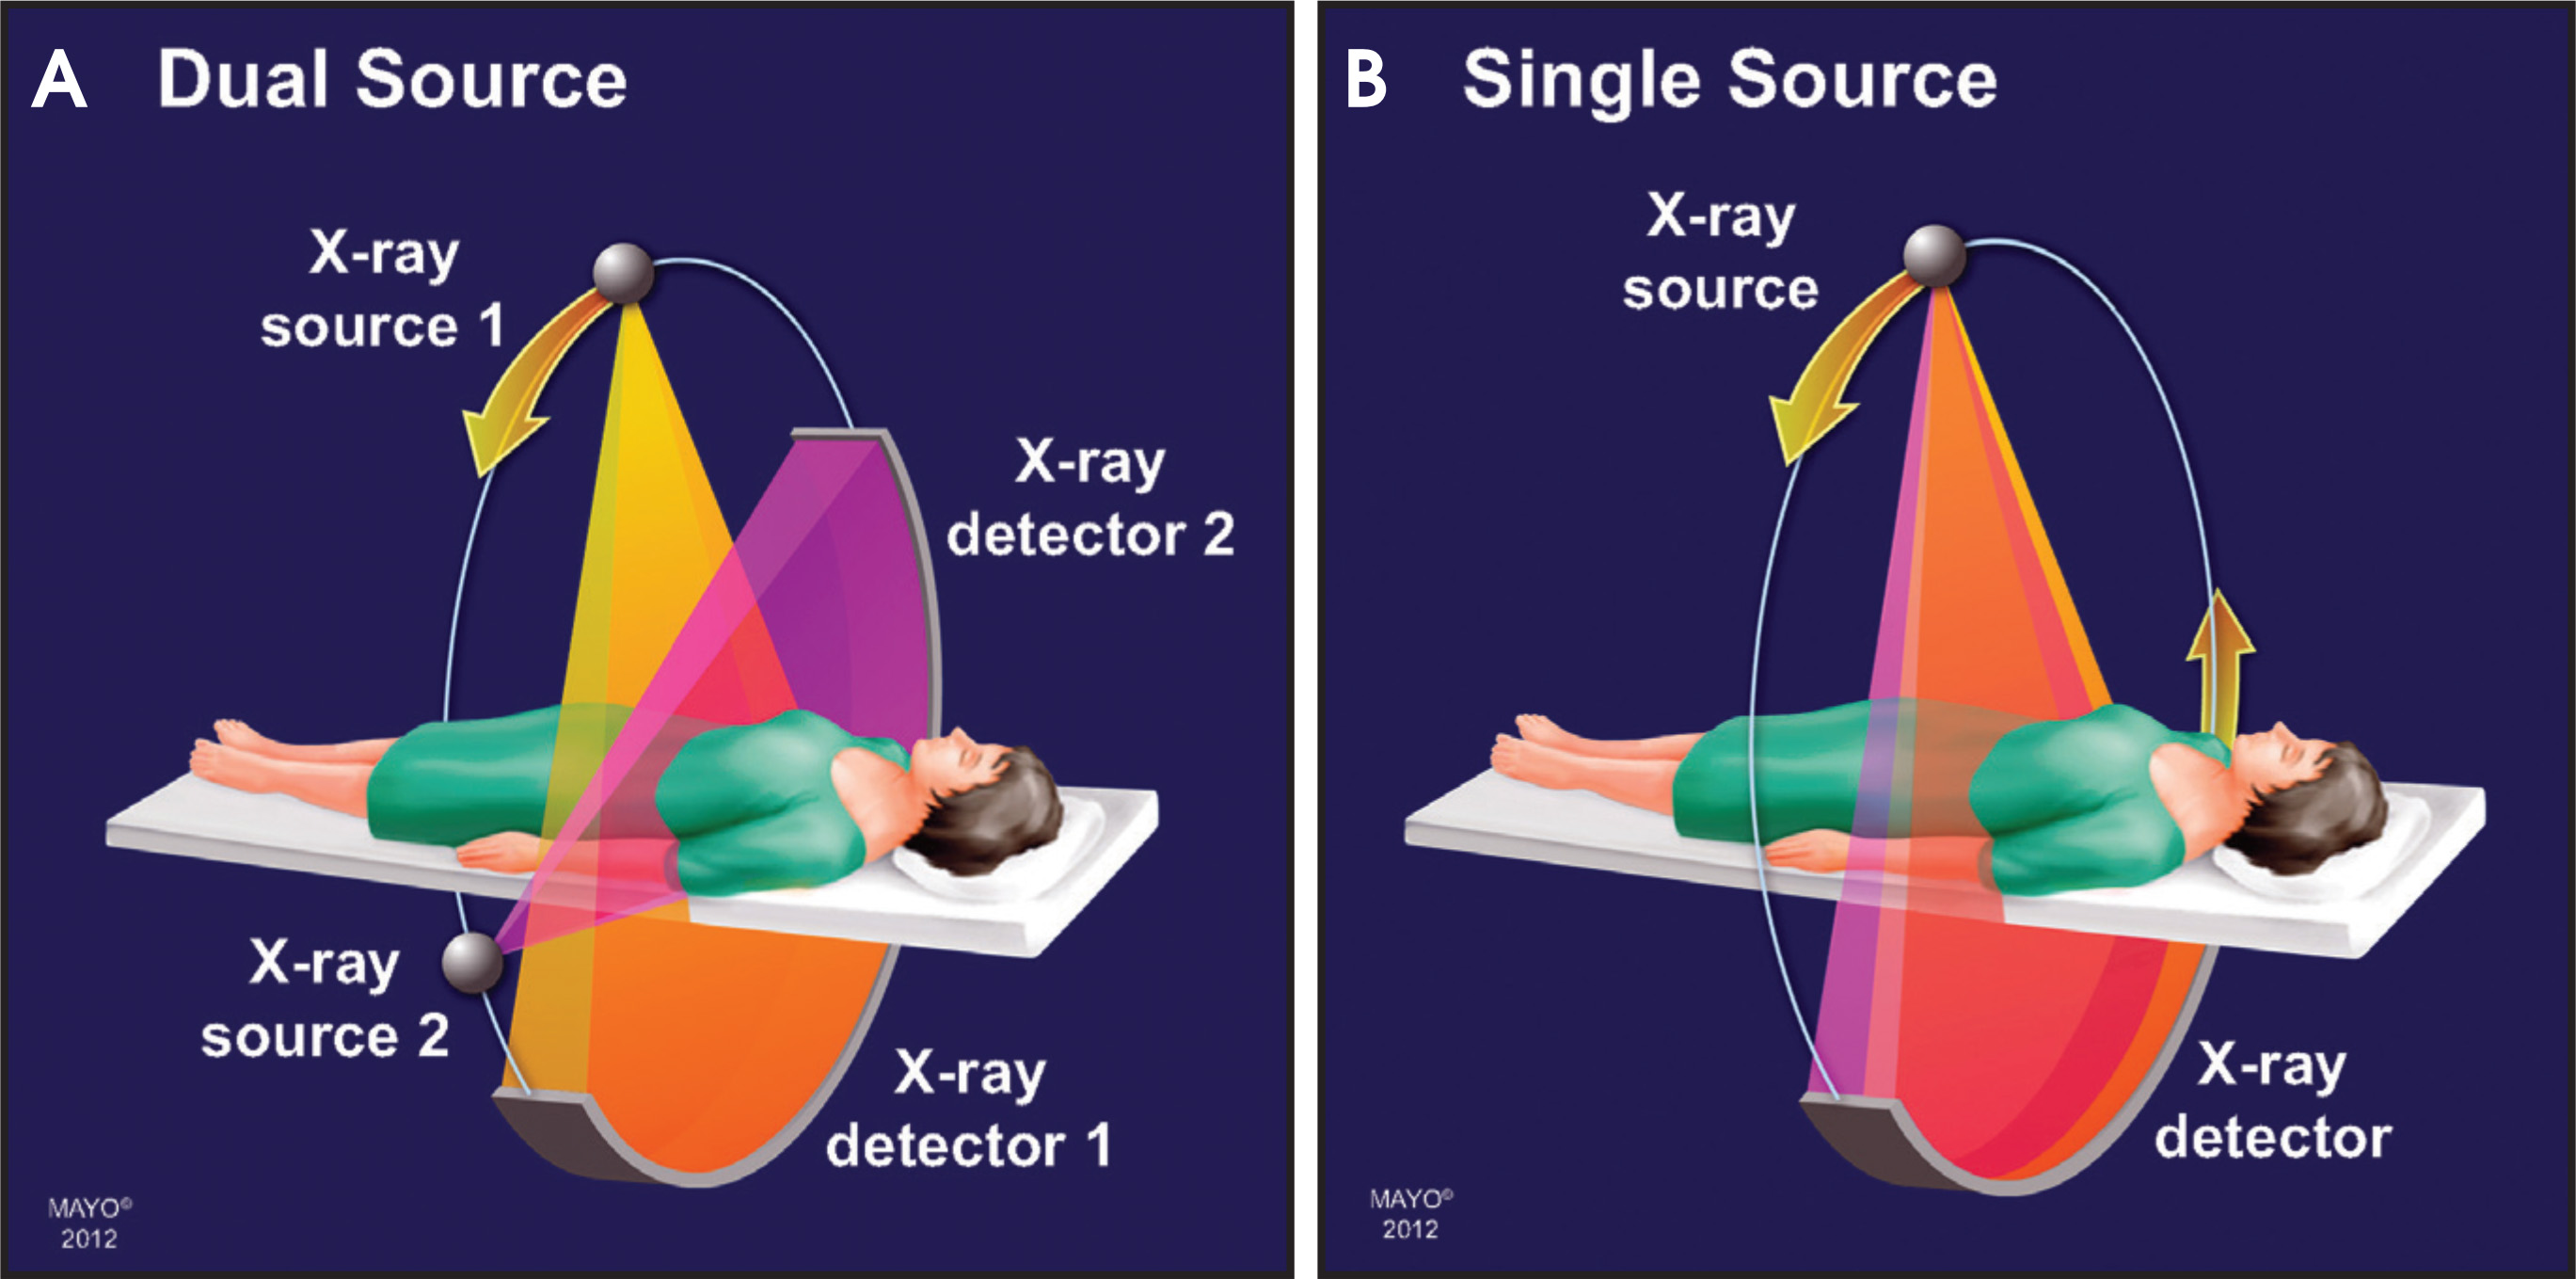
Subsequent hardware and software modifications to CT scanners, including alterations to CT gantry rotation, x-ray source, and detector arrays, have made DECT data acquisition more practical.1,11,12 Although many modifications are manufacturer specific, the goal of the various approaches is similar—to allow for simultaneous or near-simultaneous dual-energy image acquisition. Commercially available techniques include a single-source system (ssDECT) with rapidly fluctuating energies (rapid kVp switch) and a dual-source system (ds-DECT) with 2 independent x-ray tubes (dual-source dual-energy) (Figure 1).
Technical considerations
The upper limit of the energy spectrum produced by an x-ray tube is determined by the peak tube voltage (kVp).11With conventional (single-energy) CT, the energy level is typically set to 120 or 140 kVp. With DECT, the energy settings are typically 80 kVp and140 kVp, creating low-energy and high-energy data sets, respectively. The inherent energy of an x-ray photon and the atomic number of the interacting matter will impact the degree of attenuation. A spike in attenuation, termed the K-edge, occurs when the x-ray energy level is just greater than the electron-binding energy of the interacting matter.11,14 K-edge differs for each element and increases with atomic number.DECT capitalizes on the variable K-edges and on the differences in attenuation among tissues at different x-ray energies.12,15As kVp represents the peak energy of a selected photon spectrum, the number of keV photons at lower kVp is higher than that generated at a higher kVp because of the inherent bell shape of the distribution curve. Therefore, at 80 kVp, more photons will be near 33.2 keV (the K-edge of iodine)than at 140kVp.1
By applying these concepts, DECT can provide information about tissue composition and behavior at different energy levels. It can differentiate between tissues containing different substances (eg, iodine at 33.2 keV or calcium at 4.0 keV versus other soft tissues) because certain substances have higher attenuation with the lower kVp settings. Furthermore, by using complex (and often vendor-specific) postprocessing techniques, the change in attenuation at different kVp values after intravenous administration of iodinated contrast material can be used to create a virtual unenhanced data set by excluding iodine-containing pixels.1,12 The applications of abdominal DECT vary by organsystem, as outlined below.
Renal applications
Renal mass versus cyst
Renal lesions are frequently and often incidentally encountered with CT imaging.1,16 A benign cyst can be confidently diagnosed if the lesion shows CT attenuation (measured in Hounsfield units [HU]) equivalent to water, lacks enhancement, and contains a thin or imperceptible wall.1,17 However, due to artifacts, not all benign cysts identified with conventional CT meet all these requirements. Multiple phases (eg, unenhanced, venous, and excretory) may be necessary to exclude enhancement, and even then, differentiating true enhancement from beam hardening (pseudoenhancement) may not be possible for smaller lesions.
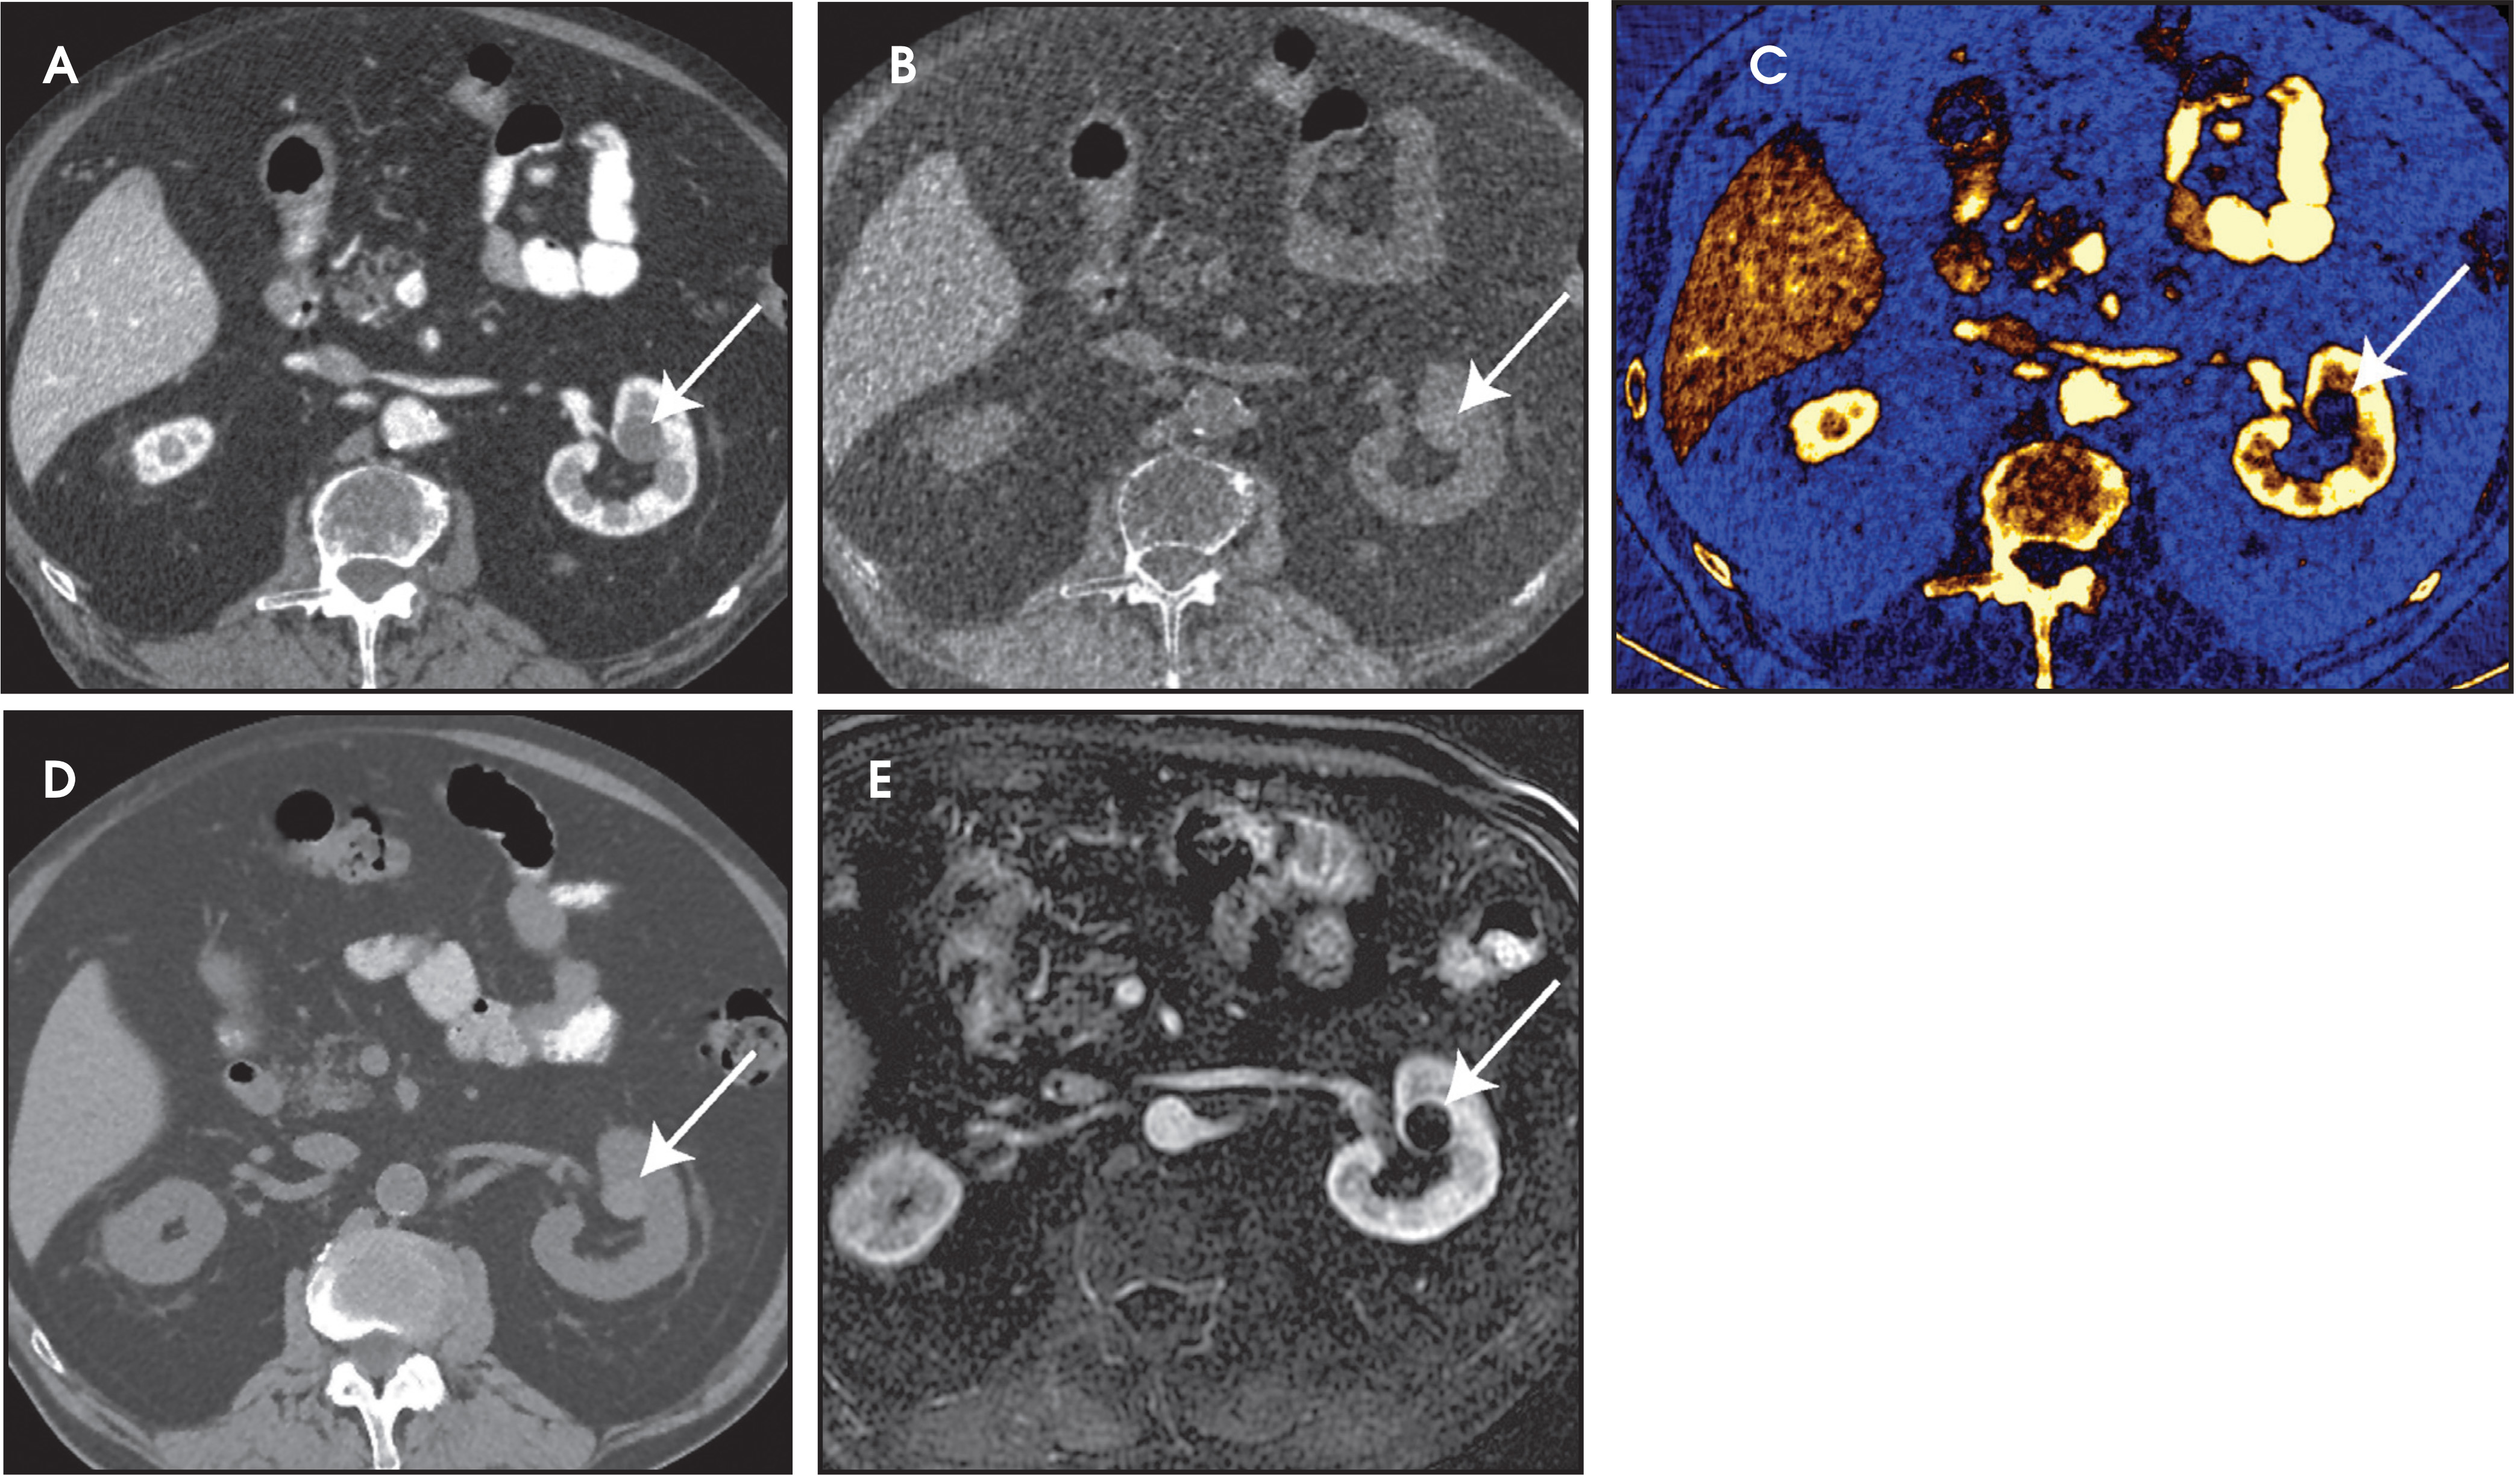
With the construction of a virtual unenhanced data set with DECT, scanning the patient in a single phase may be adequate for evaluation of enhancement. Preliminary studies have shown no statistically significant difference in attenuation values between unenhanced and virtual unenhanced images.1,18In addition, vendor-specific postprocessing algorithms can be used to generate an “iodine material density” display,in which iodine-containing tissues (eg, an enhancing renal mass or parenchyma) are depicted by shades of gray, with values determined by the amount of iodine present within the tissue.12 This display is similar to a magnetic resonance subtraction image with respect to evaluating enhancement (Figure 2), but an important difference is that a material with a similar attenuation curve (eg, calcium) will still be depicted.12
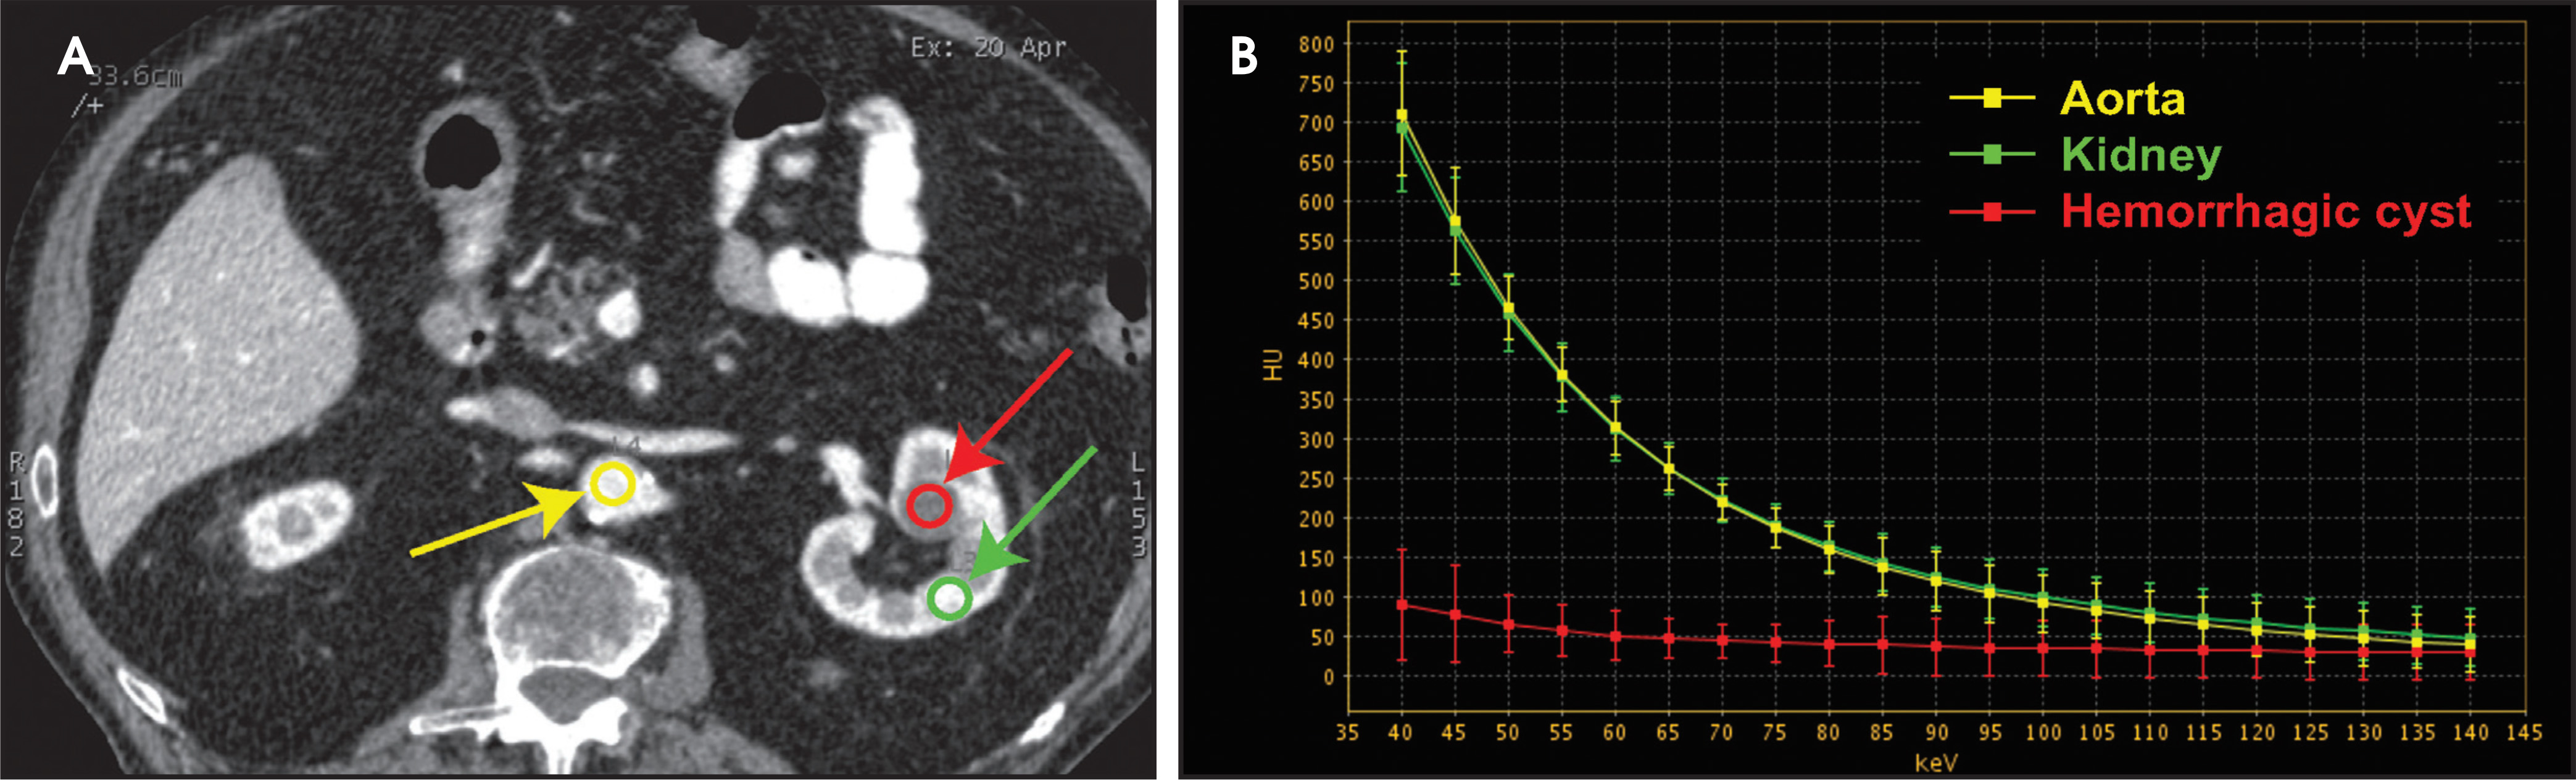
With ssDECT, generation of computed monochromatic images has the benefit of decreased pseudoenhancement artifact,12,19which potentially allows for more accurate and reproducible HU measurements. In addition, the so-called spectral HU curves may be useful because theycan depict the different attenuation characteristics of iodine-containing lesions (eg, enhancing masses) versus noniodine-containing lesions (eg,avascular masses) (Figure 3).12
Renal stones
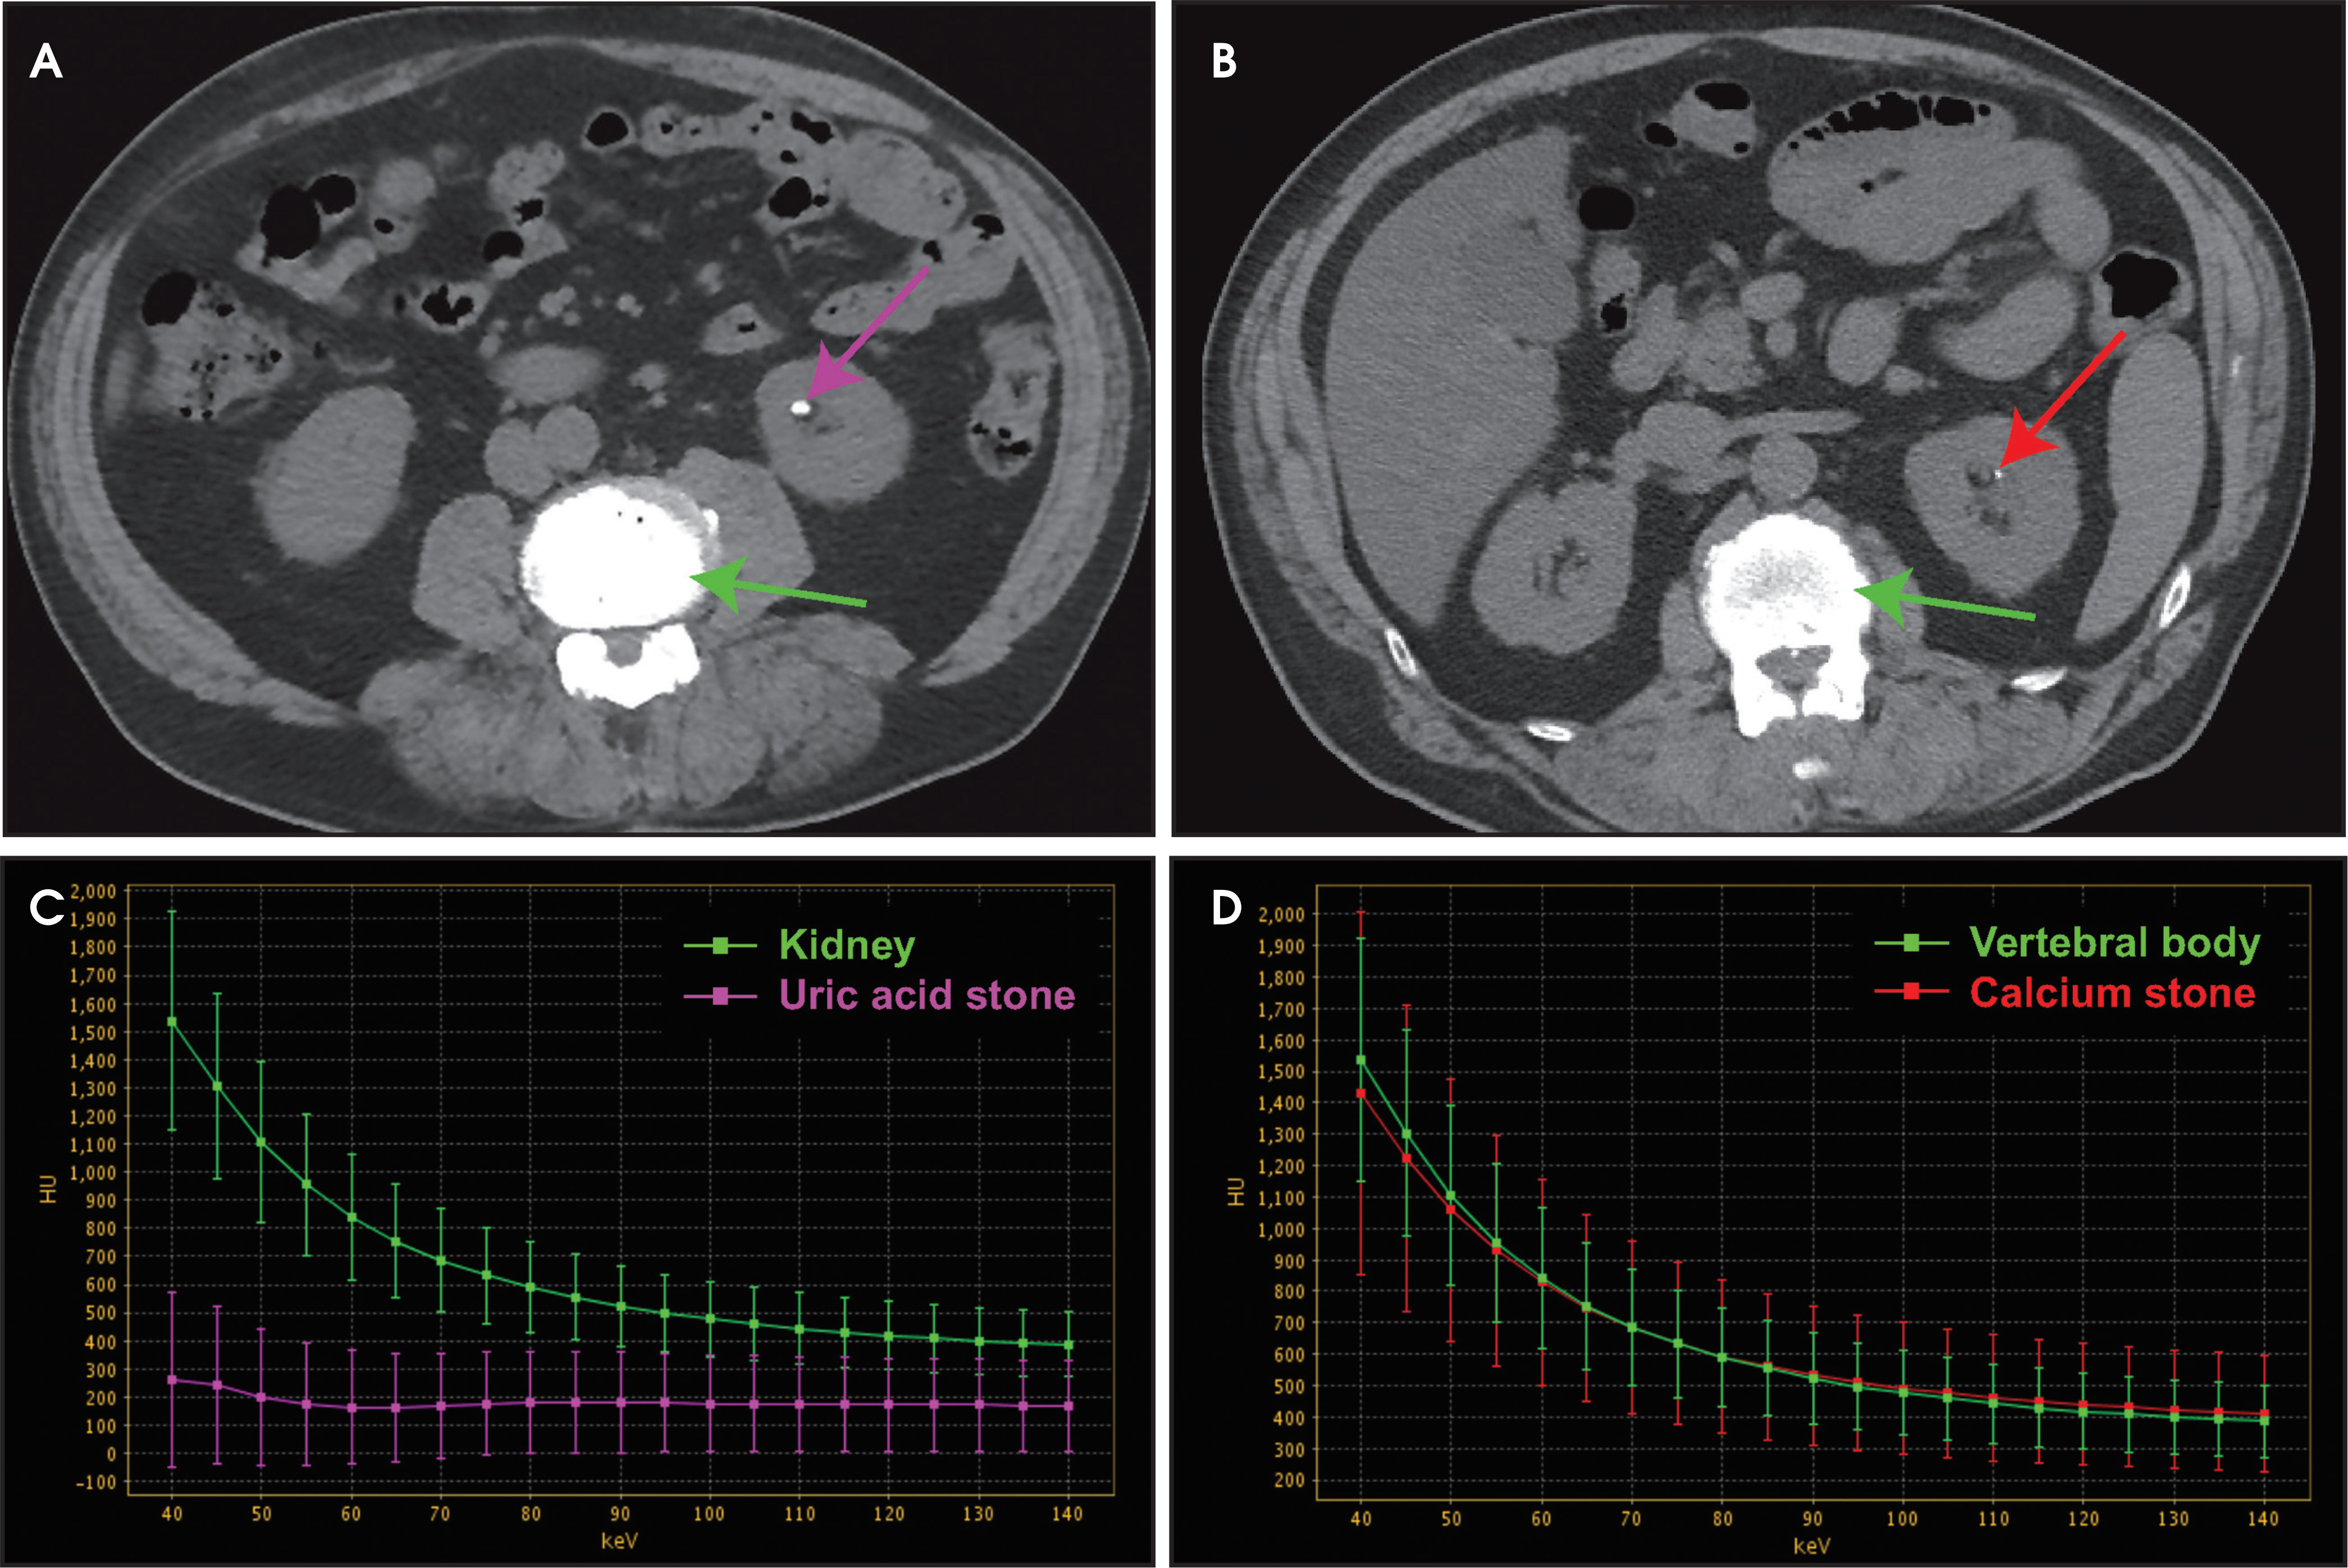
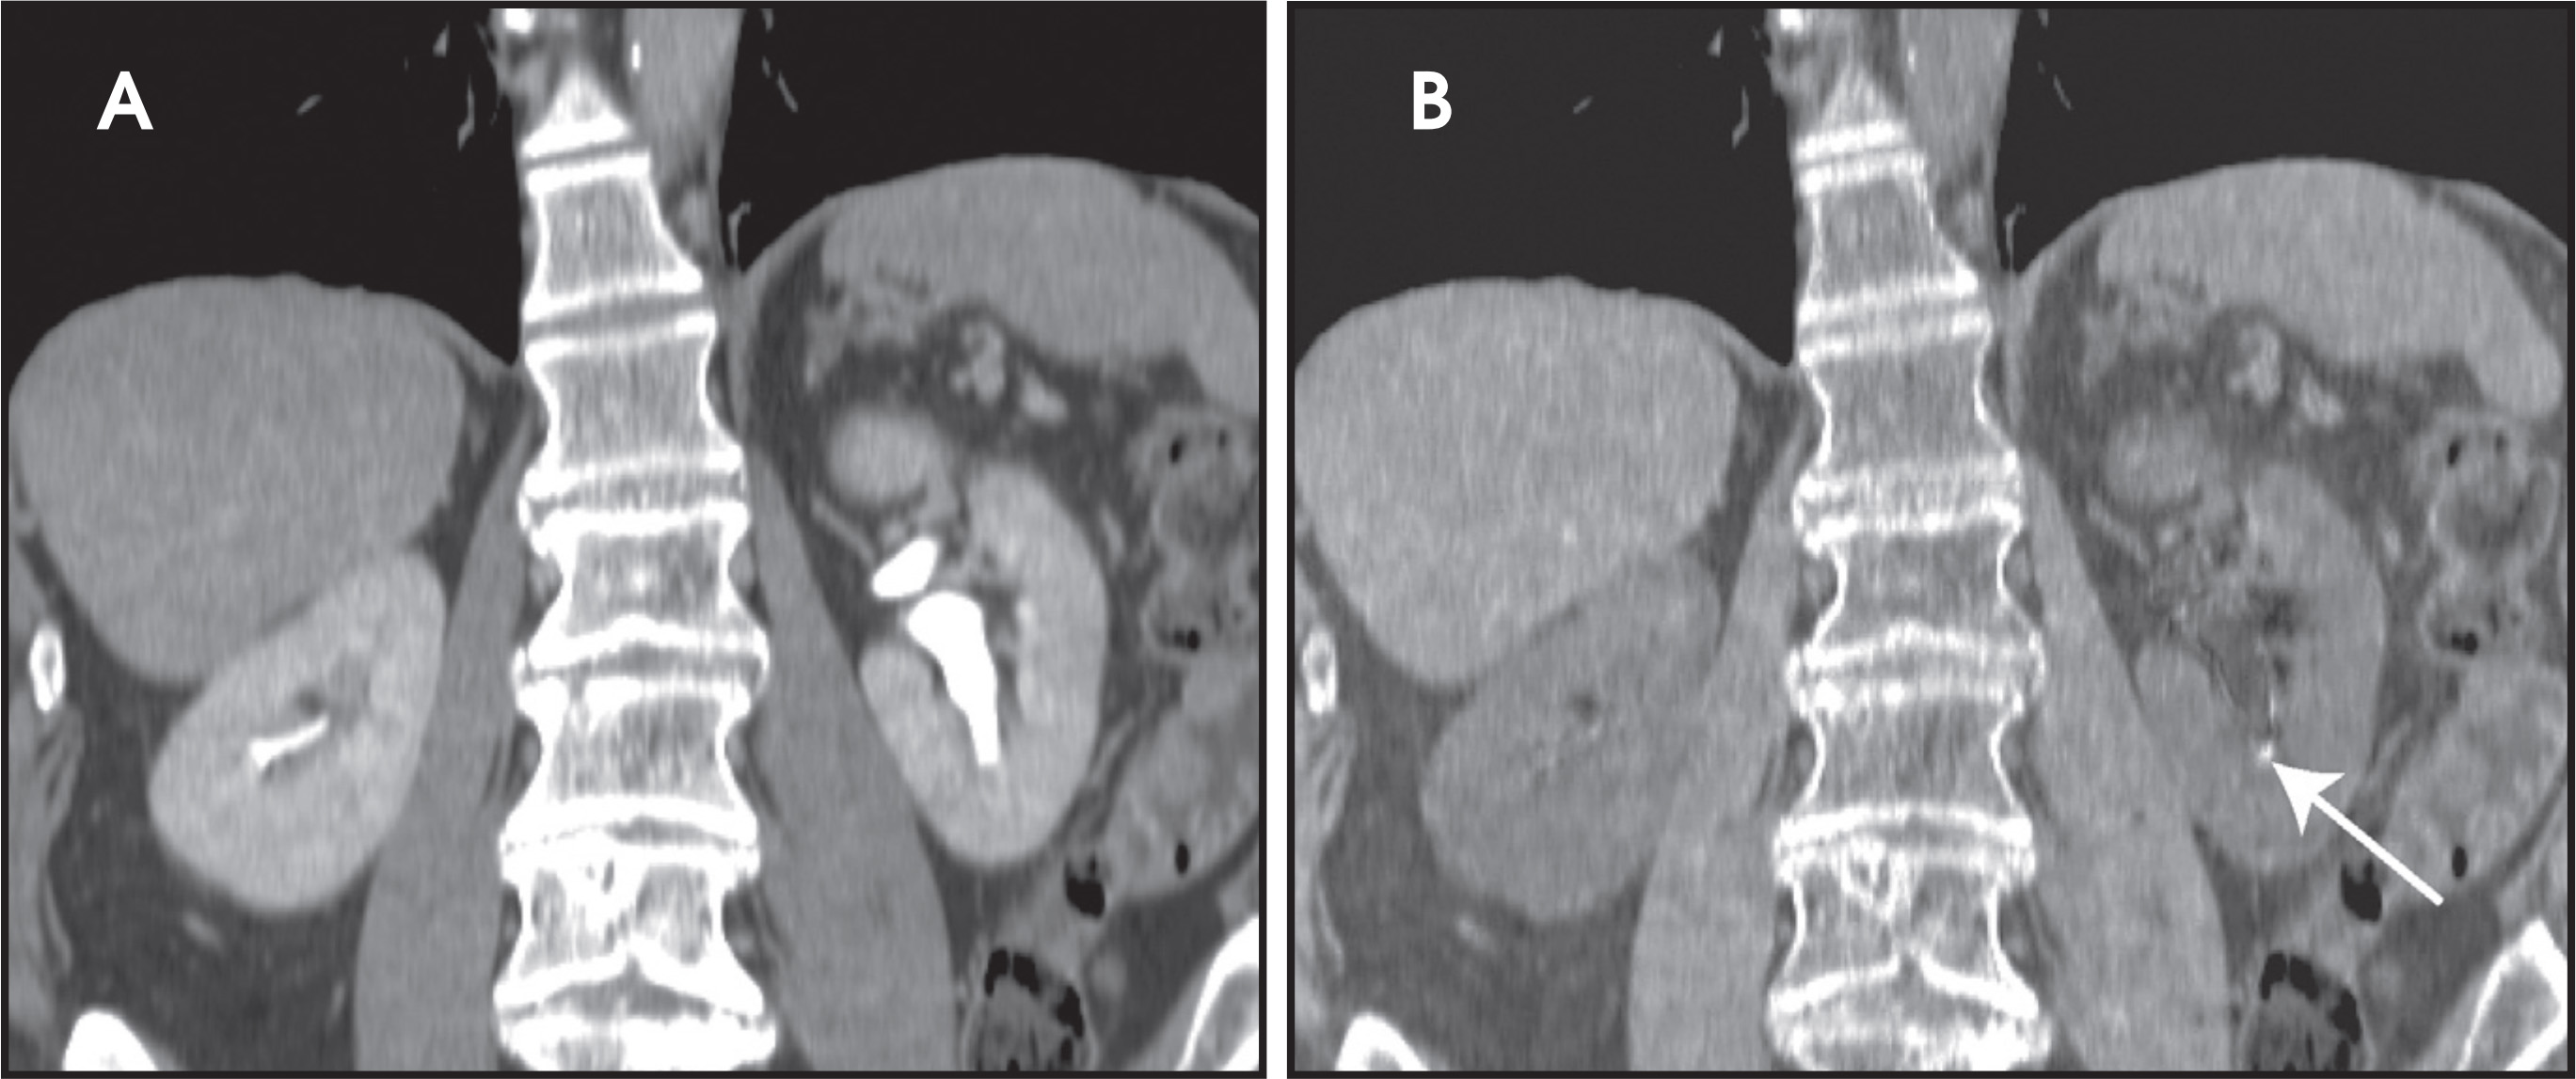
Unenhanced CT is widely accepted as the preferred imaging technique for the diagnosis of acute nephrolithiasis and ureterolithiasis.20,21 Although most collecting-system stones contain calcium, conventional CT is limited with regard to determining specific stone composition.Composition is important in certain scenarios because it may alter patient management—for example, an obstructing uric acid stone is more likely to respond to aggressive medical expulsive therapy than other types of stones.11 In addition, high-density stones, such as those containing brushite, may be relatively resistant to fragmentation with extracorporeal shock wave lithotripsy and may require more invasive intervention.1Multiple in vitro and in vivo studies have shown DECT to be accurate in differentiating uric acid stones from other stones.20,22-27With a relatively low effective atomic number, uric acid stones show little change in x-ray attenuation compared with other stones (Figure4).11,28 Differentiating among nonuric acid stones presents a greater diagnostic challenge, with overlap in attenuation ratios of components such as calcium and struvite. However, second-generation, dual-energy, dual-source scanners, equipped with additional spectral filtration,show promising results for improved differentiation.20,29
An additional benefit of DECT applies to renal stone detection on excretory-phase imaging.30,31 By creating virtual unenhanced images,DECT has been shown in phantom studies to decipher calculi that otherwise would be obscured by the density of iodinated contrast (Figure 5).31 If proven applicable in vivo, the virtual data set could replace the need for the unenhanced scan typically performed with a CT urogram examination.
Adrenal application
The adrenal nodule is another frequently, and often incidentally, encountered lesion on CT examinations. Conventional CT parameters needed to differentiate an adenoma (or other benign lesions) from a metastasis are well documented.1,32,33Unfortunately, when an initial, enhanced-CT study shows an indeterminate adrenal lesion, further examination with an adrenal protocol CT or magnetic resonance imaging is often necessary.A virtual unenhanced DECT data set may eventually replace the unenhanced scan currently required with an adrenal protocol CT examination.However, an adrenal protocol also requires image acquisition in the portal-venous phase and 10- to 15-minute delayed phase. The goal of DECTis to answer the diagnostic question with a single acquisition. Early results have been mixed regarding DECT’s ability to differentiate adrenal lesions on the basis of differences in attenuation at low versus high kVp.1,34 Preliminary data suggest that adenomas may have decreased attenuation at 80 kVp compared with 140 kVp, but this pattern is not uniformly observed; therefore, the finding is specific but not sensitive.34 The variable attenuation among adenomas may be due to different quantities of intracellular lipid.34
Hepatic applications
Lesion conspicuity and assessment
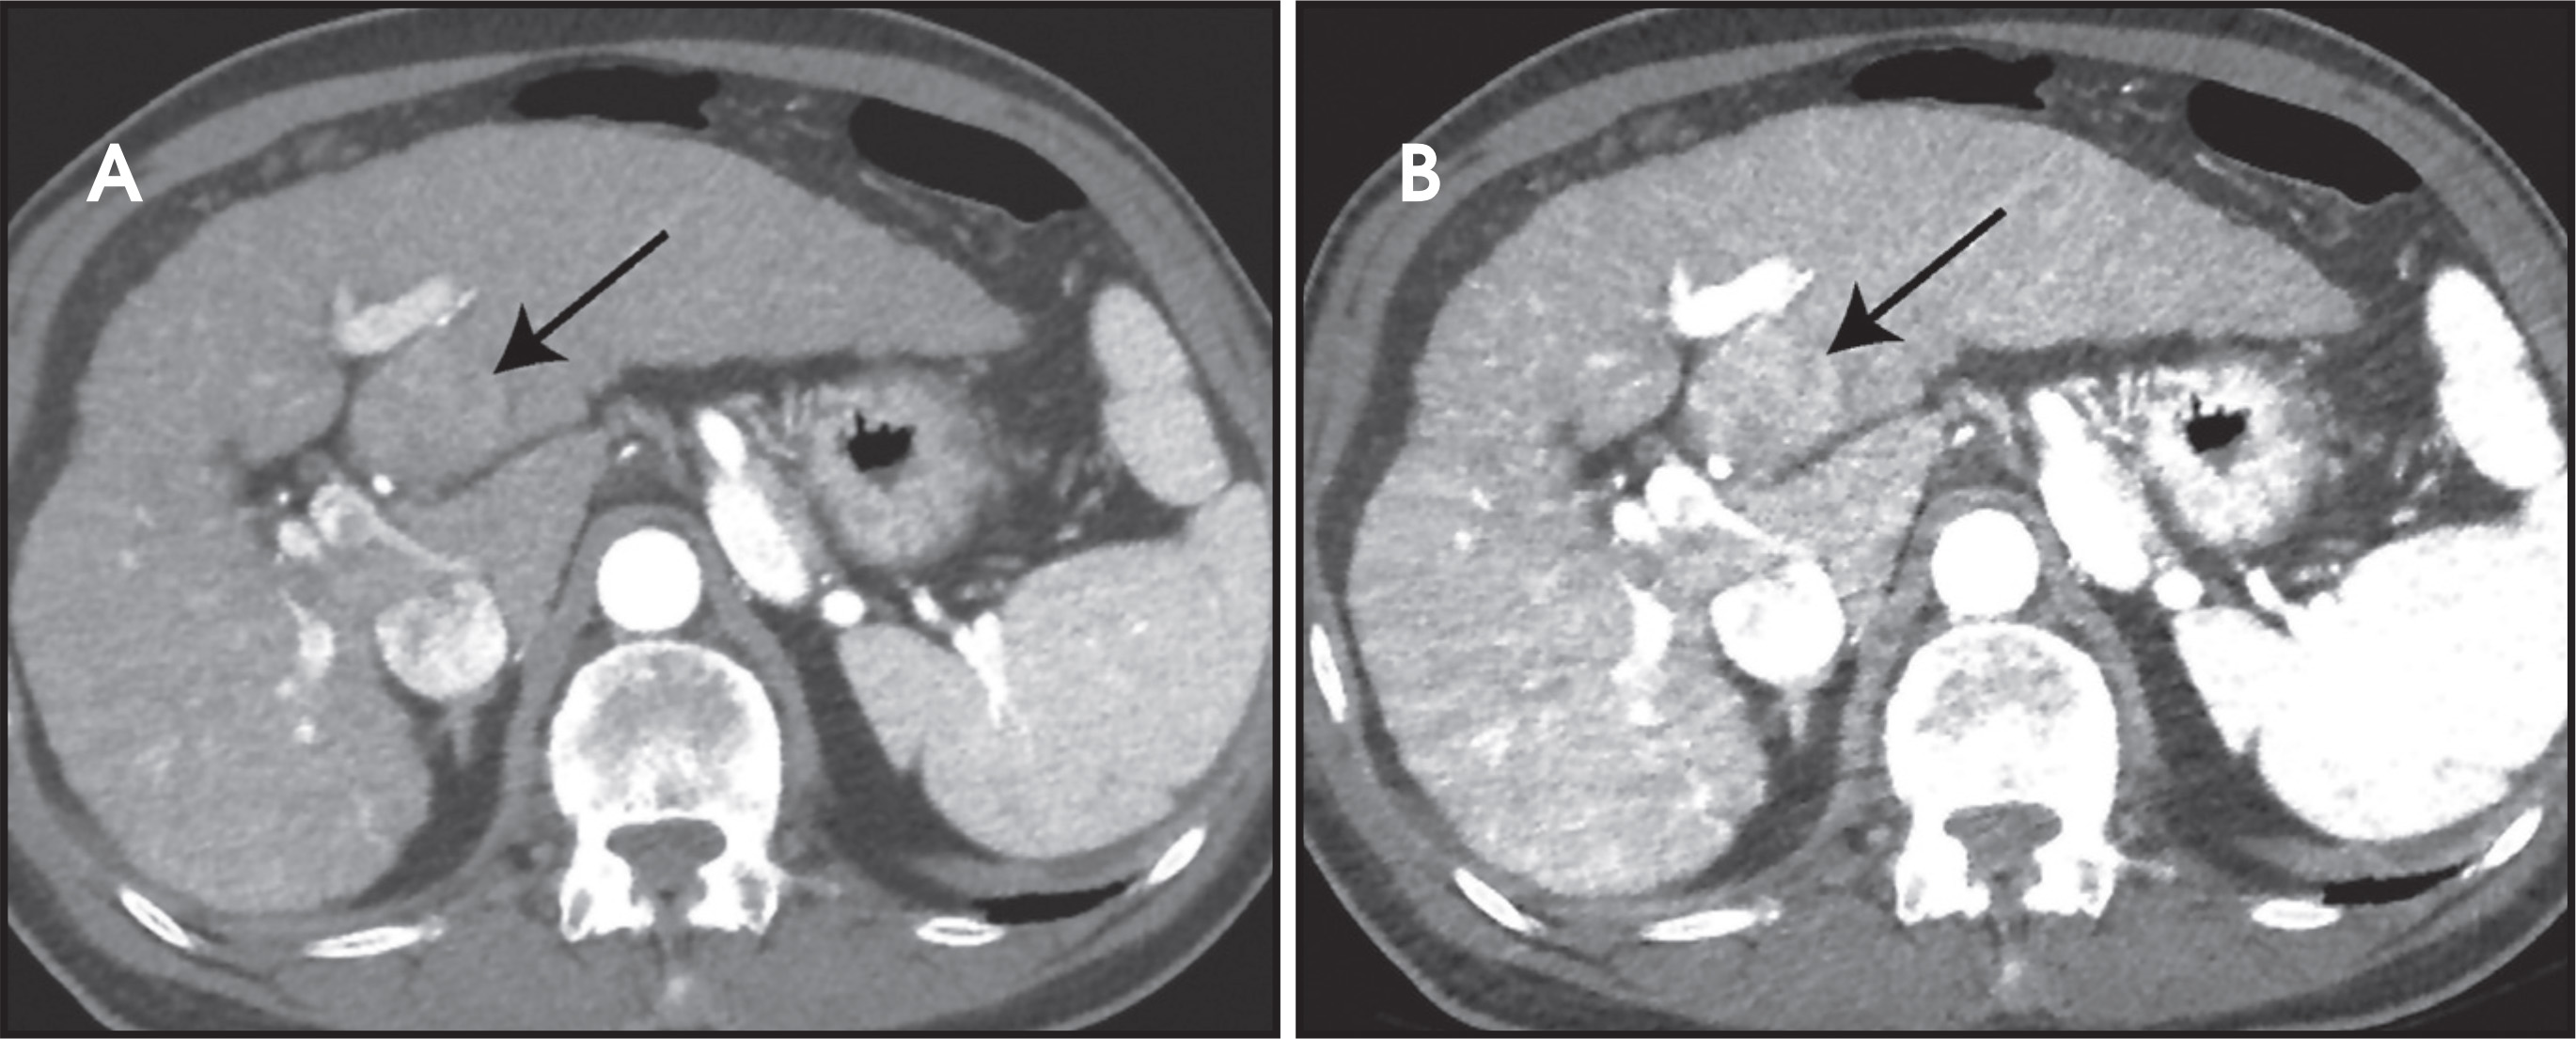
Hypervascular liver lesions, including hypervascular metastases and most primary hepatocellular carcinomas, show increased conspicuity with contrast-enhanced imaging at lower energies (eg, 80 kVp) compared with higher energies (eg, 120 or 140 kVp) because of the inherent properties of iodine.11,35,38Unfortunately, unless the tube current (and, therefore, the radiation dose) is increased, the lower kVp setting can often be affected by increased noise.11,35With dsDECT, a nonlinear blending algorithm or variable “weighted average” can be used to emphasize the benefits of each energy setting. This creates a combined DECT image that maximizes contrast resolution (achieved with a lower kVp) while maintaining optimal anatomic detail (achieved with a higher kVp).11,39With ssDECT, this can be accomplished with real-time adjustment of the computed virtual monochromatic data set (Figure 6) from low to high keVs.12
The application of DECT in the evaluation of hypovascular liver lesions is evolving. However, a preliminary study that examined hypo-vascular liver-lesion conspicuity by comparing the weighted average data set with the pure low-energy (80 kVp) acquisition failed to show improved detection.40 As with kidney lesion evaluation, the virtual unenhanced data set and iodine-only display potentially have roles in characterizing liver lesions.
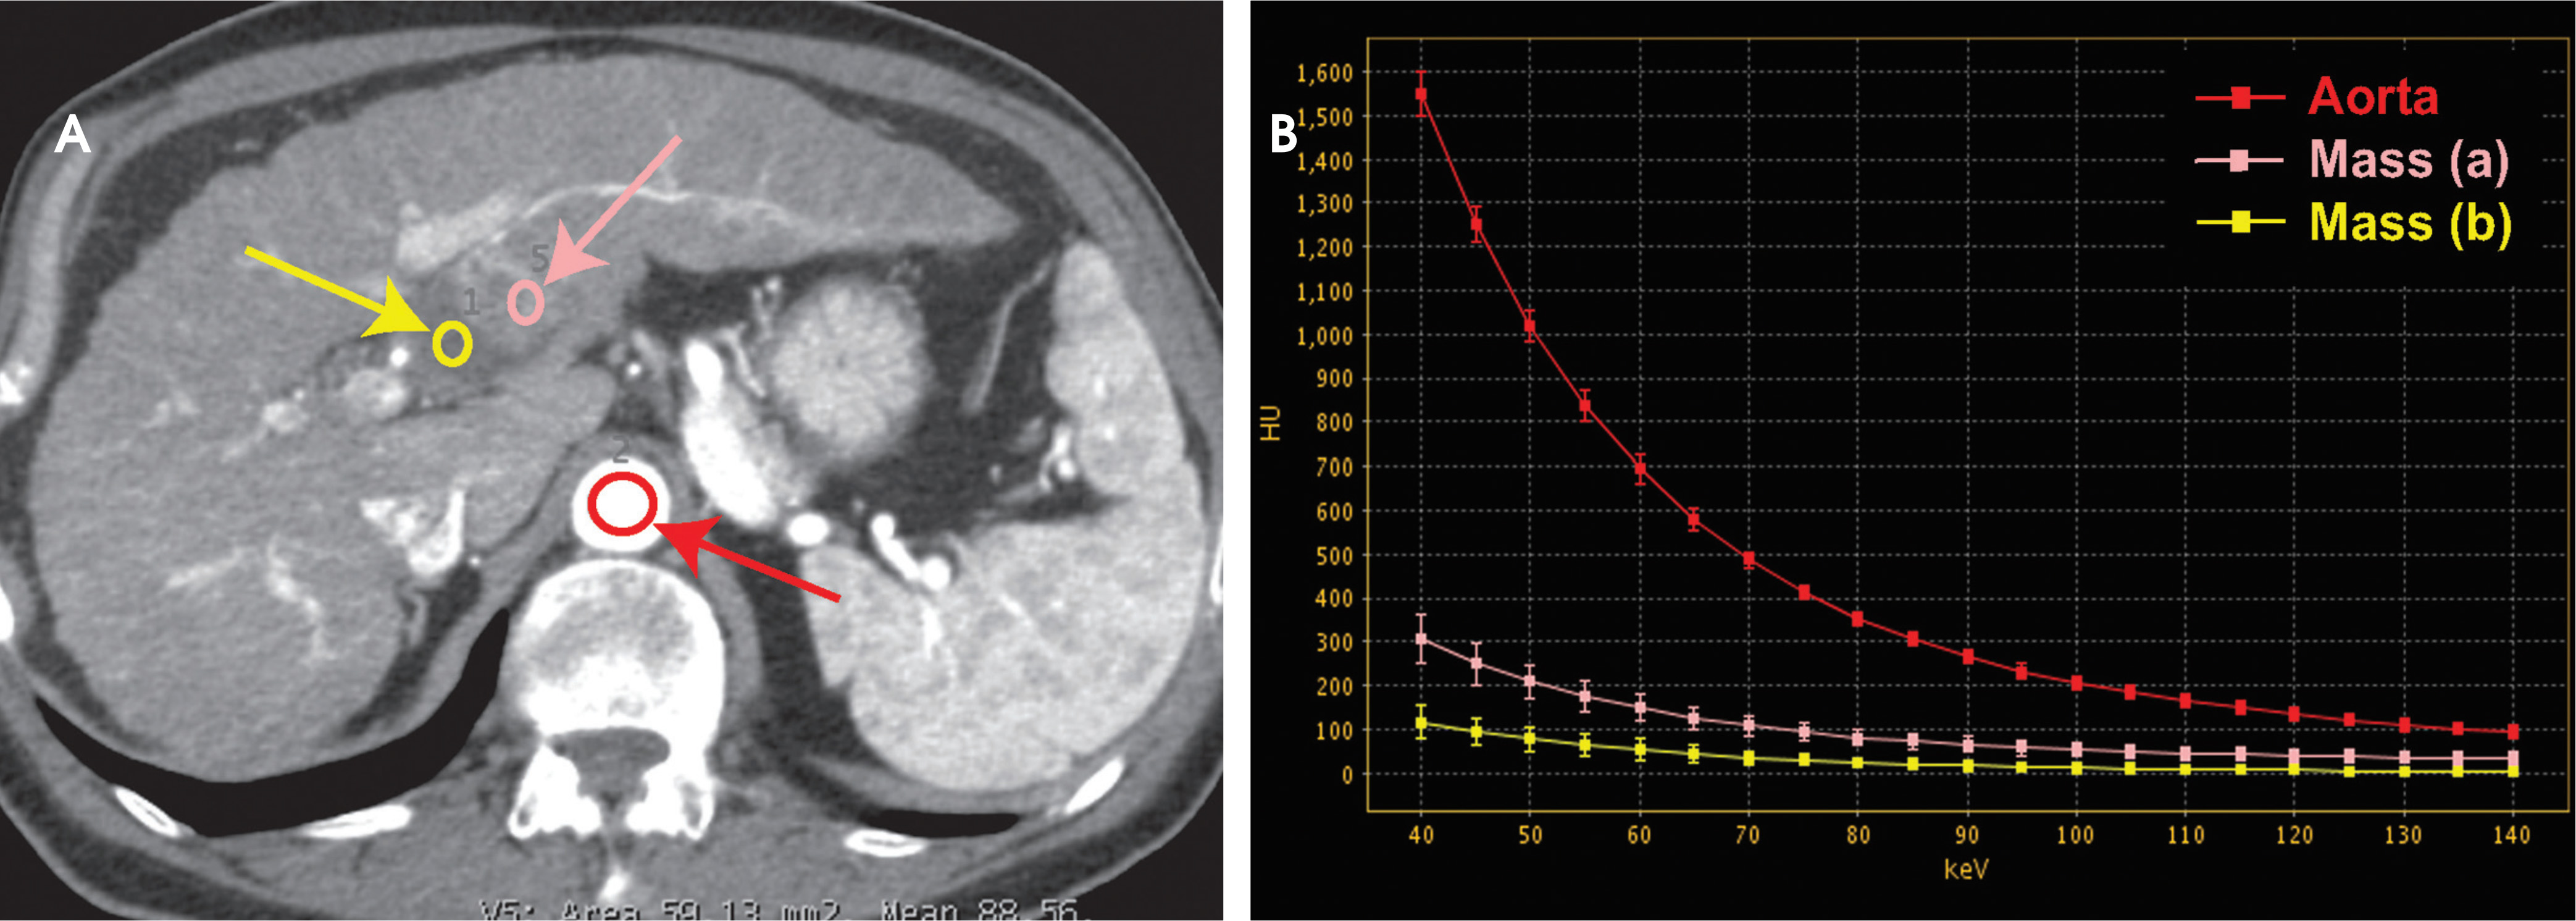
An intriguing future application is the assessment of tumor response to treatment (eg, after radiofrequency ablation). A recent study of residual tumor after ablation suggests improved lesion-to-liver contrast-to-noise ratios on the iodine display compared with standard imaging.41 In addition, there is exciting potential for earlier, more accurate assessment with various novel quantitative displays, such ashistogram, effective-Z (based on the atomic number) and spectral HU curves (based on attenuation characteristics over a range of energy values; 40 keV to 140 keV) (Figure 7).12,42
Iron or fat quantification
In a liver with iron overload, attenuation increases with decreasing kVp. Alternatively, in a steatotic liver, attenuation decreases with decreasing kVp. In vivo and in vitro studies of DECT’s ability to quantify hepatic iron or fat deposition have shown promising results.8,11,43-46Unfortunately, these conditions are not mutually exclusive; in fact, they frequently coexist in vivo and may confound findings.1,8,47,48In a recent phantom study that used DECT and a dedicated algorithm, liver fat was quantified accurately, despite the presence of iron or iodinated contrast material.49
Biliary applications
Gallstones
As with renal stones, gallstone composition influences decisions in clinical management. For instance, the dissolution of cholesterol gallstones by various medical therapies is well documented,50,51 but symptomatic gallstones containing calcium often require invasive management. Phantom trials have shown that DECT can reliably characterize gallstones containing a high percentage of cholesterol with no calcium component.45,52,53 Whether the characterization is better than that achievable with conventional single-energy CT is still unknown.
Cholangiography
CT cholangiography is a well-accepted although rarely used technique, in which an intravenous contrast agent with a biliary excretory profile is administered to delineate the biliary tree.54-57 A recent study using DECT cholangiography in potential, living-related, liver transplantation donors showed improved bile duct visualization and size measurements with blended (contrast-optimized) and iodine-only images.54
Pancreatic application
Lesion conspicuity
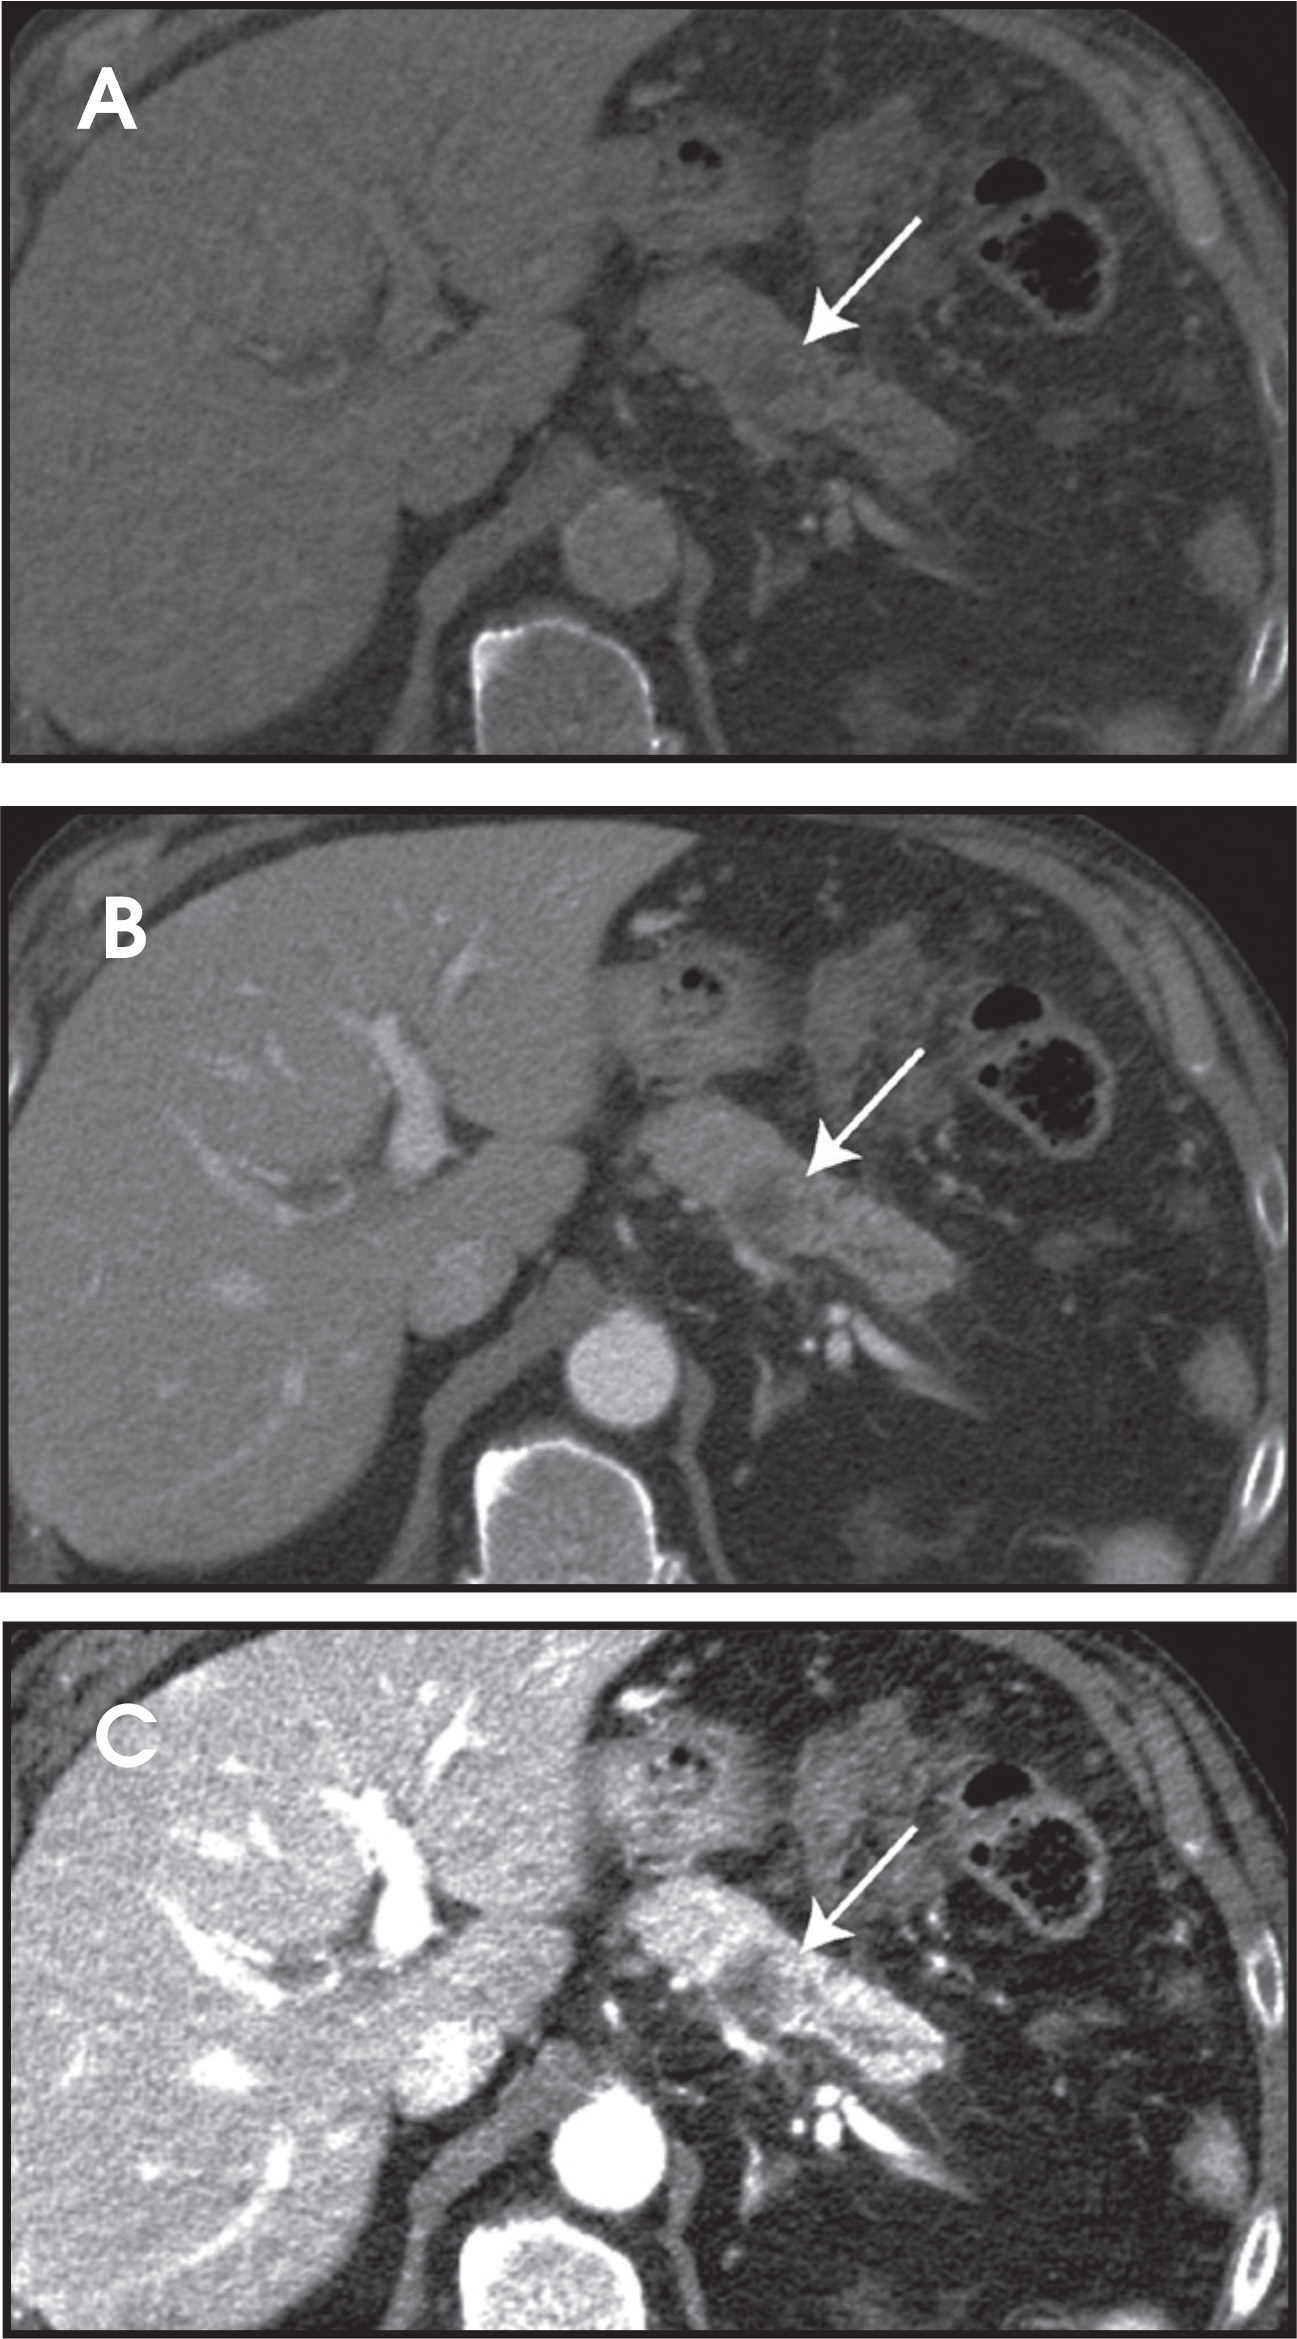
Although pancreatic adenocarcinoma is a highly lethal malignancy, its appearance on CT images can be extremely subtle. Even when imaged during the pancreatic phase (40- to 70-second delay after intravenous contrast injection infused at 3 mL/second), approximately10% of lesions will be isoattenuating to normal surrounding parenchyma.1,58-62 In a recent pilot study, the conspicuity of pancreatic adenocarcinoma was investigated with dsDECT.61Significant attenuation differences and improved conspicuity between tumors and normal parenchyma were observed at 80 kVp as compared to a 120 kVp weighted average dataset. With ssDECT, the differential attenuation of pancreatic lesions relative to normal parenchymal tissue can be exploited by examining low keV images from the computed monochromatic display (Figure 8).12
Bowel application
Colonography
CT colonography is a noninvasive and effective option for colorectal cancer screening.63A standard protocol requires complete bowel cleansing and fecal tagging (oral iodinated contrast) before the examination, and images must be acquired in the supine and prone positions.In a preliminary study with intravenous contrast enhancement, virtual unenhanced images and iodine map images were obtained to differentiate enhancing polyps from stool.45,64The data suggest DECT colonography may be technically feasible in a single acquisition, obviating the need for prone images.45Furthermore, noncathartic or reduced-catharsis DECT colonoscopy may be possible. With fecal tagging, electronic “spectral cleansing” is performed by postprocessing software to remove iodine-containing material, including tagged residual fecal material.65
Vasculature application
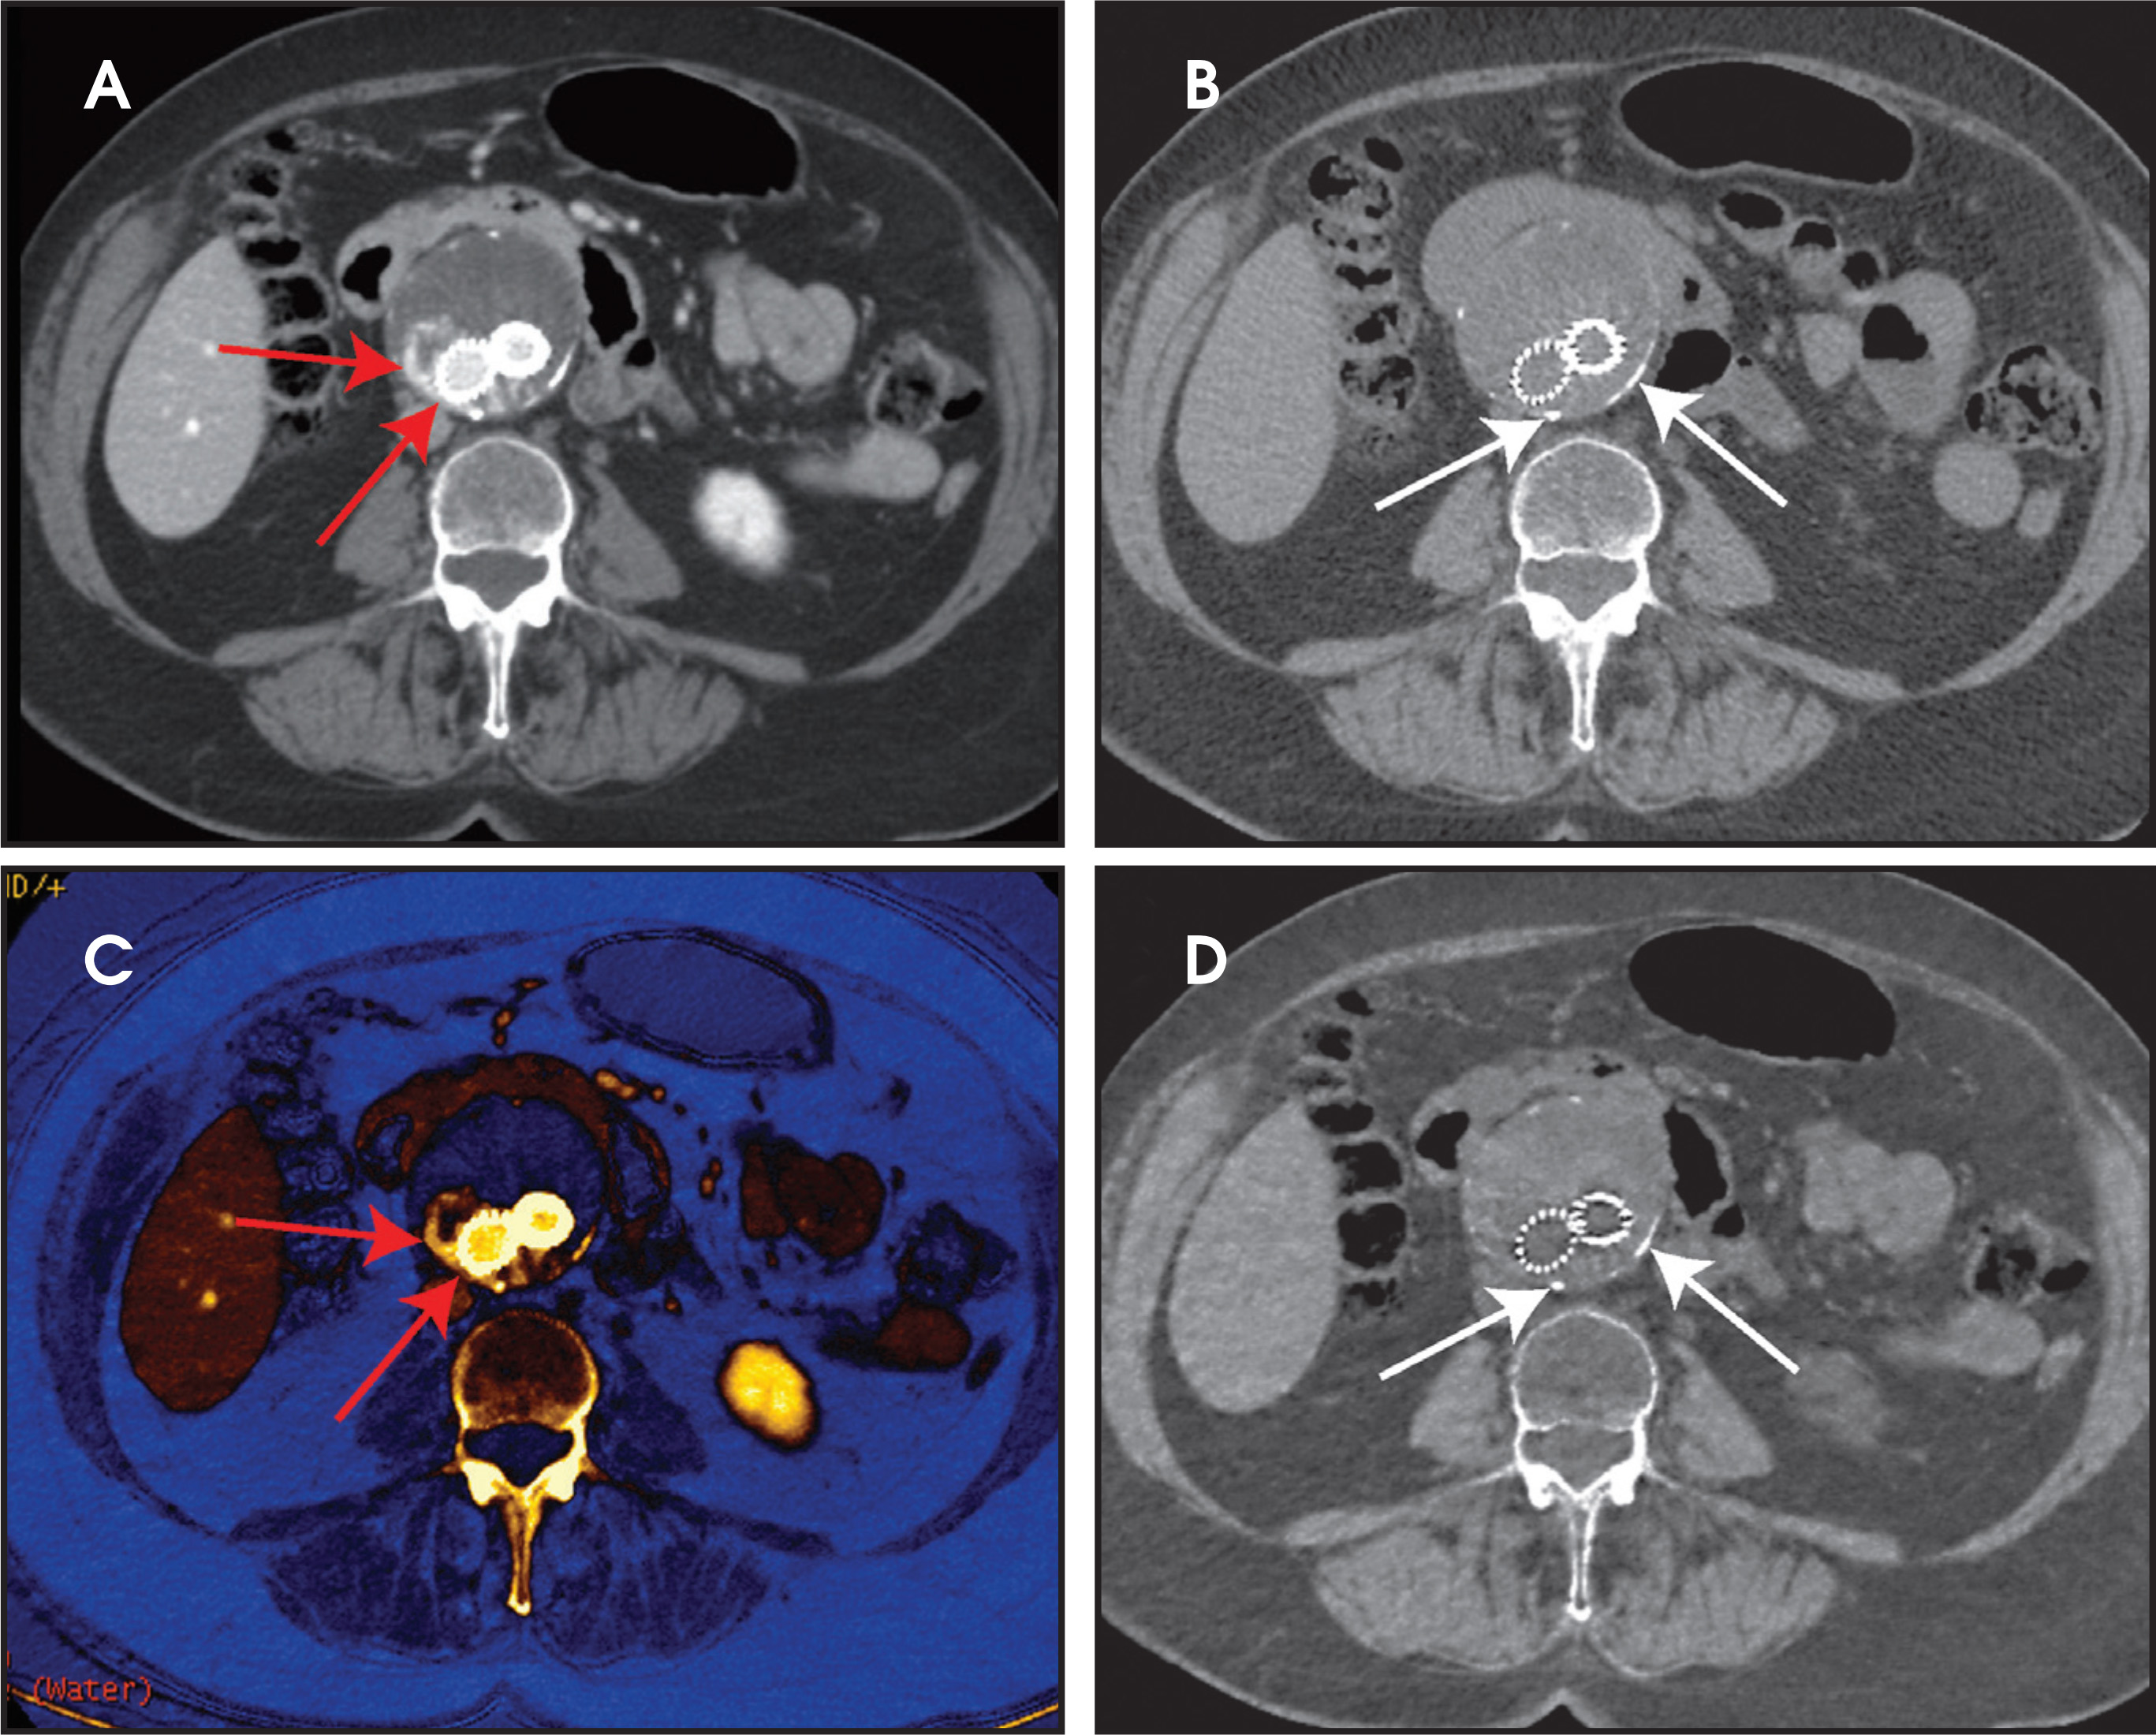
CT angiography requires separate acquisitions (unenhanced and enhanced) to differentiate high attenuation regions (eg, intramural hematoma, plaque, calcification) from intraluminal contrast. Typically, enhanced images are acquired in the arterial phase (with or without venous-phase images) after intravenous contrast administration at a high injection rate. Arterial DECT has 2 primary technical advantages over conventional CT angiography, stemming from the acquisition of low kVp spectral data and the ability to construct material-specific images.66By exploiting the increased contrast conspicuity achieved with low kVp data, detection of smaller vessels or subtle enhancement maybe improved while also allowing a 30% to 50% reduction in injection volume.66-69 Material-specific imaging allows for iodine only, virtual noncontrast, and virtual angiographic images.66This is of particular benefit after endovascular aortic repair because DECT may provide comparable diagnostic information in a single acquisition, thereby eliminating the need for separate unenhanced and arterial acquisitions (Figure 9).12,66,69-72
Radiation dose
CT radiation dose depends on many specific parameters, including tube current, pitch, and energy. DECT dose is further influenced bythe different dual-energy techniques and manufacturer variations.1 In general, the 2 acquisitions required for DECT result in an increased total effective radiation dose compared with conventional CT, if all other parameters are equal.73However, the 2 acquisitions do not translate into twice the radiation of a conventional CT because the lower kVp imaging used in DECT lowers the total radiation dose.66 Furthermore,newer-generation DECT scanners with optimized protocols and reconstructions permit DECT acquisition with minimal (if any) additional effective dose compared with a standard 120 kVp scan.74,75
In cases requiring multiple phases, DECT potentially can reduce the radiation dose considerably by acquiring comparable data in one phase and creating iodine-only or virtual unenhanced images. Furthermore, the potential for improved characterization of lesions previously too small to characterize may obviate the need for follow-up imaging and further radiation exposure.76
Limitations
Several limitations of DECT impede its implementation into daily clinical practice. Currently, DECT data sets require an extended processing time and are much larger than data sets of conventional CT, creating challenges regarding workflow and storage, respectively.12
Low kVp data can potentially have problems from excessive inherent noise.75 Unless the tube current (and therefore the radiation dose) is simultaneously increased, the diagnostic quality can decrease. This is of particular consequence in patients of large body habitus, for whom field-of-view limitations and image quality may affect dual-energy postprocessing.76 Improved noise reduction strategies (eg, iterative reconstruction algorithms) show promise for future applications.75
Finally, the clinical use of virtual unenhanced sequences requires further validation. As highlighted by the inconsistent characterization of adrenal adenomas, definitive studies have not yet shown the virtual unenhanced values to be consistently reproducible.11,75
Conclusion
Although many of its clinical applications are still in the investigative stage, DECT shows great promise as a powerful tool in abdominopelvic imaging. With improved lesion detection and the ability to exploit differences in tissue behavior at different energy levels, DECT hasa potential role in each organ system. The generation of virtual data sets (eg, virtual unenhanced images) may eventually obviate the need for multiphase examinations and drastically reduce the total radiation dose. However, continued advances in equipment and processing software are needed to increase the feasibility of widespread application.
References
- Coursey C, Nelson R, Boll D. Dual-energy multidetector CT: How does it work, what can it tell us, and when can we use it in abdominopelvic imaging?. Radiographics. 2010;30:1037-1051.
- Kelcz F, Joseph P, Hilal S. Noise considerations in dual energy CT scanning. Med Phys. 1979;6:418-425.
- Takai M, Kaneko M. Discrimination between thoro-trast and iodine contrast medium by means of dual-energy CT scanning. Phys Med Biol. 1984;29:959-967.
- Rutherford R, Pullan B, Isherwood I. Measurement of effective atomic number and electron density using an EMI scanner. Neuroradiology. 1976;11:15-21.
- Rutherford R, Pullan B, Isherwood I. X-ray energies for effective atomic number determination. Neuroradiology. 1976;11:23-28.
- Millner M, McDavid W, Waggener R. Extraction of information from CT scans at different energies. Med Phys. 1979;6:70-71.
- Genant H, Boyd D. Quantitative bone mineral analysis using dual energy computed tomography. Invest Radiol. 1977;12:545-551.
- Goldberg H, Cann C, Moss A. Noninvasive quantitation of liver iron in dogs with hemochromatosis using dual-energy CT scanning. Invest Radiol. 1982;17:375-380.
- Cann C, Gamsu G, Birnberg F, Webb W. Quantification of calcium in solitary pulmonary nodules using single- and dual-energy CT. Radiology. 1982;145:493-496.
- Chiro G, Brooks R, Kessler R. Tissue signatures with dual-energy computed tomography. Radiology. 1979;131:521-523.
- Yeh B, Shepherd J, Wang Z. Dual-energy and low-kVp CT in the abdomen. AJR Am J Roentgenol. 2009;193:47-54.
- Silva A, Morse B, Hara A. Dual-energy (spectral) CT: Applications in abdominal imaging. Radiographics. 2011;31:1031-1046.
- Hidas G, Eliahou R, Duvdevani M. Determination of renal stone composition with dual-energy CT: in vivo analysis and comparison with x-ray diffraction. Radiology. 2010;257:394-401.
- Johnson T, Krauss B, Sedlmair M. Material differentiation by dual energy CT: Initial experience. Eur Radiol. 2007;17:1510-1517.
- Avrin D, Macovski A, Zatz L. Clinical application of Compton and photo-electric reconstruction in computed tomography: preliminary results. Invest Radiol. 1978;13:217-222.
- Tada S, Yamagishi J, Kobayashi H. The incidence of simple renal cyst by computed tomography. Clin Radiol. 1983;34:437-439.
- McClennan B, Stanley R, Melson G. CT of the renal cyst: Is cyst aspiration necessary?. AJR Am J Roentgenol. 1979;133:671-675.
- Graser A, Johnson T, Hecht E. Dual-energy CT in patients suspected of having renal masses: Can virtual non-enhanced images replace true non-enhanced images?. Radiology. 2009;252:433-440.
- Tkaczyk J, Langan D, Wu X, Samei E, Hsieh J. Quantization of liver tissue in fast-switched dual kVp computed tomography using linear discriminant analysis. 2009;7258.
- Qu M, Ramirez-Giraldo J, Leng S. Dual-energy dual-source CT with additional spectral filtration can improve the differentiation of non-uric acid renal stones: An ex vivo phantom study. AJR Am J Roentgenol. 2011;196:1279-1287.
- Smith R, Rosenfield A, Choe K. Acute flank pain: Comparison of non-contrast-enhanced CT and intravenous urography. Radiology. 1995;194:789-794.
- Primak A, Fletcher J, Vrtiska T. Noninvasive differentiation of uric acid versus non-uric acid kidney stones using dual-energy CT. Acad Radiol. 2007;14:1441-1447.
- Graser A, Johnson T, Bader M. Dual energy CT characterization of urinary calculi: Initial in vitro and clinical experience. Invest Radiol. 2008;43:112-119.
- Stolzmann P, Scheffel H, Rentsch K. Dual energy computed tomography for the differentiation of uric acid stones: Ex vivo performance evaluation. Urol Res. 2008;36:133-138.
- Stolzmann P, Kozomara M, Chuck N. In vivo identification of uric acid stones with dualenergy CT: diagnostic performance evaluation in patients. Abdom Imaging. 2010;35:629-635.
- Matlaga B, Kawamoto S, Fishman E. Dual source computed tomography: A novel technique to determine stone composition. Urology. 2008;72:1164-1168.
- Boll D, Patil N, Paulson E. Renal stone assessment with dual-energy multidetector CT and advanced postprocessing techniques: improved characterization of renal stone composition—pilot study. Radiology. 2009;250:813-820.
- Silva A, Bollepalli S, Hara A. Differentiating enhancing vs nonenhancing lesions in the liver and kidney: comparison of single- and dual-energy CT. Radiological Society of North American 96th Scientific Assembly and Annual Meeting. 2011.
- Primak A, Giraldo J, Eusemann C. Dual-source dual-energy CT with additional tin filtration: Dose and image quality evaluation in phantoms and in-vivo. AJR Am J Roentgenol. 2010;195:1164-1174.
- Scheffel H, Stolzmann P, Frauenfelder T. Dual-energy contrast-enhanced computed tomography for the detection of urinary stone disease. Invest Radiol. 2007;42:823-829.
- Takahashi N, Hartman R, Vrtiska T. Dual-energy CT iodine-subtraction virtual unenhanced technique to detect urinary stones in an iodine-filled collecting system: A phantom study. AJR Am J Roentgenol. 2008;190:1169-1173.
- Song J, Chaudhry F, Mayo-Smith W. The incidental adrenal mass on CT: Prevalence of adrenal disease in 1,049 consecutive adrenal masses in patients with no known malignancy. AJR Am J Roentgenol. 2008;190:1163-1168.
- Boland G, Lee M, Gazelle G. Characterization of adrenal masses using unenhanced CT: An analysis of the CT literature. AJR Am J Roentgenol. 1998;171:201-204.
- Gupta R, Ho L, Marin D. Dual energy CT for characterization of adrenal nodules: initial experience. AJR Am J Roentgenol;194:1479-1483.
- Schindera S, Nelson R, Mukundan S. Hypervascular liver tumors: low tube voltage, high tube current multi-detector row CT for enhanced detection—phantom study. Radiology. 2008;246:125-132.
- Marin D, Nelson R, Samei E. Hypervascular liver tumors: Low tube voltage, high tube current multidetector CT during late hepatic arterial phase for detection—initial clinical experience. Radiology. 2009;251:771-779.
- Schindera S, Nelson R, Mukundan S. Hypervascular liver tumors: Low tube voltage, high tube current multi-detector row CT for enhanced detection—phantom study. Radiology. 2008;246:125-132.
- Altenbernd J, Heusner T, Ringelstein A. Dual-energy-CT of hypervascular liver lesions in patients with HCC: Investigation of image quality and sensitivity. Eur J Radiol. 2011;21:738-743.
- Kim K, Lee J, Kim S. Image fusion in dual energy computed tomography for detection of hypervascular liver hepatocellular carcinoma: Phantom and preliminary studies. Invest Radiol. 2010;45:149-157.
- Holmes D, Fletcher J, Apel A. Evaluation of non-linear blending in dual-energy computed tomography. Eur J Radiol. 2008;68:409-413.
- Robinson E, Babb J, Chandarana H, Macari M. Dual source dual energy MDCT:comparison of 80 kVp and weighted average 120 kVp data for conspicuity of hypo-vascular liver metastases. Invest Radiol. 2010;45:413-418.
- Lee S, Lee J, Kim K. Dual-energy computed tomography to assess tumor response to hepatic radiofrequency ablation: potential diagnostic value of virtual noncontrast images and iodine maps. Invest Radiol. 2010;46:77-84.
- Silva A, Robinette A, Hara A. Quantitative imaging with single source dual energy CT (ssDECT): potential applications and how we do it.
- Raptopoulos V, Karellas A, Bernstein J. Value of dual-energy CT in differentiating focal fatty infiltration of the liver from low-density masses. AJR Am J Roentgenol. 1991;157:721-725.
- Mendler M, Bouillet P, Le Sidaner A. Dual-energy CT in the diagnosis and quantification of fatty liver: Limited clinical value in comparison to ultrasound scan and single energy CT—with special reference to iron overload. J Hepatol. 1998;28:785-794.
- Karcaaltincaba M, Aktas A. Dual-Energy CT revistited with multidetector CT: review of principles and clinical applications. Diagn Interv Radiol. 2011;17:181-194.
- Bhotika R, Pavlicek W, Kriston A. Liver fat quantification using fast kVp-switching dual energy CT. 2011:7962-139.
- Sephton R. The potential accuracy of dual-energy computed tomography for the determination of hepatic iron. Br J Radiol. 1986;59:351-353.
- Chapman R, Williams G, Bydder G. Computed tomography for determining liver iron content in primary haemochromatosis. Br Med J. 1980;280:440-442.
- Fischer M, Gnannt R, Raptis D. Quantification of liver fat in the presence of iron and iodine: an ex-vivo dual-energy CT study. Invest Radiol. 2011;46:351-358.
- Danzinger R, Hofmann A, Schoenfield L, Thistle J. Dissolution of cholesterol gallstones by chenodeoxycholic acid. N Engl J Med. 1972;286:1-8.
- Nakagawa S, Makino I, Ishizaki T, Dohi I. Dissolution of cholesterol gallstones by ursodeoxycholic acid. Lancet. 1977;310:367-369.
- Bauer R, Schulz J, Zedler B. Compound analysis of gallstones using dual energy computed tomography--results in a phantom model. Eur J Radiol. 2010;75.
- Voit H, Krauss B, Heinrich M. Dual-source CT: In vitro characterization of gallstones using dual energy analysis. Rofo. 2009;181:367-373.
- Sommer C, Schwarzwaelder C, Stiller W. Dual-energy computed-tomography cholangiography in potential donors for living-related liver transplantation: initial experience. Invest Radiol. 2010;45:406-412.
- Okada M, Fukada J, Toya K. The value of drip infusion cholangiography using multidetector-row helical CT in patients with choledocholithiasis. Eur Radiol. 2005;15:2140-2145.
- Gibson R, Vincent J, Speer T. Accuracy of computed tomography intravenous cholangiography (CT-IVC) with iotroxate in the detection of choledocholithiasis. Eur Radiol. 2005;15:1634-1642.
- Kitami M, Takase K, Murakami G. Types and frequencies of biliary tract variations associated with a major portal venous anomaly: analysis with multi-detector row CT cholangiography. Radiology. 2006;238:156-166.
- Lu D, Vedantham S, Krasny R. Two-phase helical CT for pancreatic tumors: Pancreatic versus hepatic phase en-hancement of tumor, pancreas, and vascular structures. Radiology. 1996;199:697-701.
- Boland G, O’Malley M, Saez M. Pancreatic-phase versus portal vein–phase helical CT of the pancreas: Optimal temporal window for evaluation of pancreatic adenocarcinoma. AJR Am J Roentgenol. 1999;172:605-608.
- Prokesch R, Chow L, Beaulieu C. Isoattenuating pancreatic adenocarcinoma at multi–detector row CT: secondary signs. Radiology. 2002;224:764-768.
- Macari M, Spieler B, Kim D. Dualsource dual-energy MDCT of pancreatic adenocarcinoma: Initial observations with data generated at 80 kVp and at simulated weighted-average 120 kVp. AJR Am J Roentgenol. 2010;194:W27-32.
- Ichikawa T, Ertuk S, Sou H. MDCT of pancreatic adenocarcinoma: Optimal imaging phases and multiplanar reformatted imaging. AJR Am J Roentgenol. 2006;187:1513-1520.
- Johnson C, Chen M, Toledano A. Accuracy of CT colonography for detection of large adenomas and cancers. N Engl J Med. 2008;359:1207-1217.
- Karcaaltincaba M, Karaosmanoglu D, Akata D. Dual energy virtual CT colonoscopy with dual source computed tomography: Initial experience. Rofo. 2009;181:859-862.
- Eliahou R, Azraq Y, Carmi R. Dual-energy based spectral electronic cleansing in non-cathartic computed tomography colonography: An emerging novel technique. Semin Ultrasound CT MR. 2010;31:309-314.
- Vlahos I, Godoy M, Naidich D. Dual-energy computed tomography imaging of the aorta. J Thorac Imaging. 2010;25:289-300.
- Sigal-Cinqualbre A, Hennequin R, Abada H. Low kilovoltage multi-detector row chest CT in adults: Feasibility and effect on image quality and iodine dose. Radiology. 2004;231:169-174.
- Godoy M, Naidich D, Marchiori E. Single-acquisition dual-energy multidetector computed tomography: Analysis of vascular enhancement and postprocessing techniques for evaluating the thoracic aorta. J Comput Assist Tomogr. 2010;34:670-677.
- Holmquist F, Hansson K, Pasquariello F. Minimizing contrast medium doses to diagnose pulmonary embolism with 80-kVp multidetector computed tomography in azotemic patients. Acta Radiologica. 2009;50:181-193.
- Stolzmann P, Frauenfelder T, Pfammatter T. Endoleaks after endovascular abdominal aortic aneurysm repair: Detection with dual-energy dual-source CT. Radiology. 2008;249:682-691.
- Chandarana H, Godoy M, Vlahos I. Abdominal aorta:evaluation with dual-source dual-energy multidetector CT after endovascular repair of aneurysms—initial observations. Radiology. 2008;249:692-700.
- Numburi U, Schoenhagen P, Flamm S. Feasibility of dual-energy CT in the arterial phase: Imaging after endovascular aortic repair. AJR Am J Roentgenol. 2010;195:486-493.
- De Zordo T, von Lutterotti K, Dejaco C. Comparison of image quality and radiation dose of different pulmonary CTA protocols on a 128-slice CT: High-pitch dual source CT, dual energy CT and conventional spiral CT. Eur Radiol. 2012;22:279-286.
- Schenzle J, Sommer W, Neumaier K. Dual energy CT of the chest: How about the dose?. Invest Radiol. 2010;45:347-353.
- Macari M, Graser A, Katz D. Invited commentary of Dual-energy multidetector CT: How does it work, what can it tell us, and when can we use it in abdominopelvic imaging?. Radiographics. 2010;30:1052-1055.
- Blake M. Invited commentary of dual-energy (spectral) CT: Applications in abdominal imaging. Radiographics. 2011;31:1047-1050.
Citation
. The utility of dual-energy computed tomography in abdominal imaging. Applied Radiology. 2014;43(1):12-19. doi:10.37549/AR2048.