Things that go bump in the night: Neuroradiology emergencies
Applied Radiology — Vol. 36 , Issue 8 , pp. 10 -23
DOI: 10.37549/AR1539
Published: August 1, 2007
Categories
Acute ischemic infarction, subarachnoid hemorrhage (SAH), and cerebral venous thrombosis are 3 common central nervous system (CNS) diseases for which radiologists may play a major role in both diagnosis and treatment. Medical advances such as intravenous (IV) or intra-arterial (IA) thrombolysis, endovascular aneurysm surgery, and IA vasospasm treatment have improved the outcomes for these patients when diagnosis and management occur early after presentation. While MRI has proven invaluable in the diagnosis of these disease entities, multichannel CT is often more readily available in emergent and “on-call” circumstances and has fewer contraindications and safety concerns for unstable patients (who may need IV poles or ventilators). With the proliferation of multichannel CT scanners and readily available manufacturer postprocessing software, newer imaging techniques, such as computed tomographic angiography (CTA) and computed tomographic perfusion (CTP), are increasingly used to emergently evaluate patients with suspected CNS thrombo-embolic ischemia, aneurysmal SAH, and cerebral venous thrombosis. For the general radiologist, relative unfamiliarity with these newer CT imaging techniques and a foreboding sense of “brain attack” urgency may create significant anxiety during solo on-call responsibilities. This article will briefly review noncontrast head CT findings in addition to newer CT imaging techniques and strategies that the radiologist may use to evaluate patients with these emergent intracranial diseases.
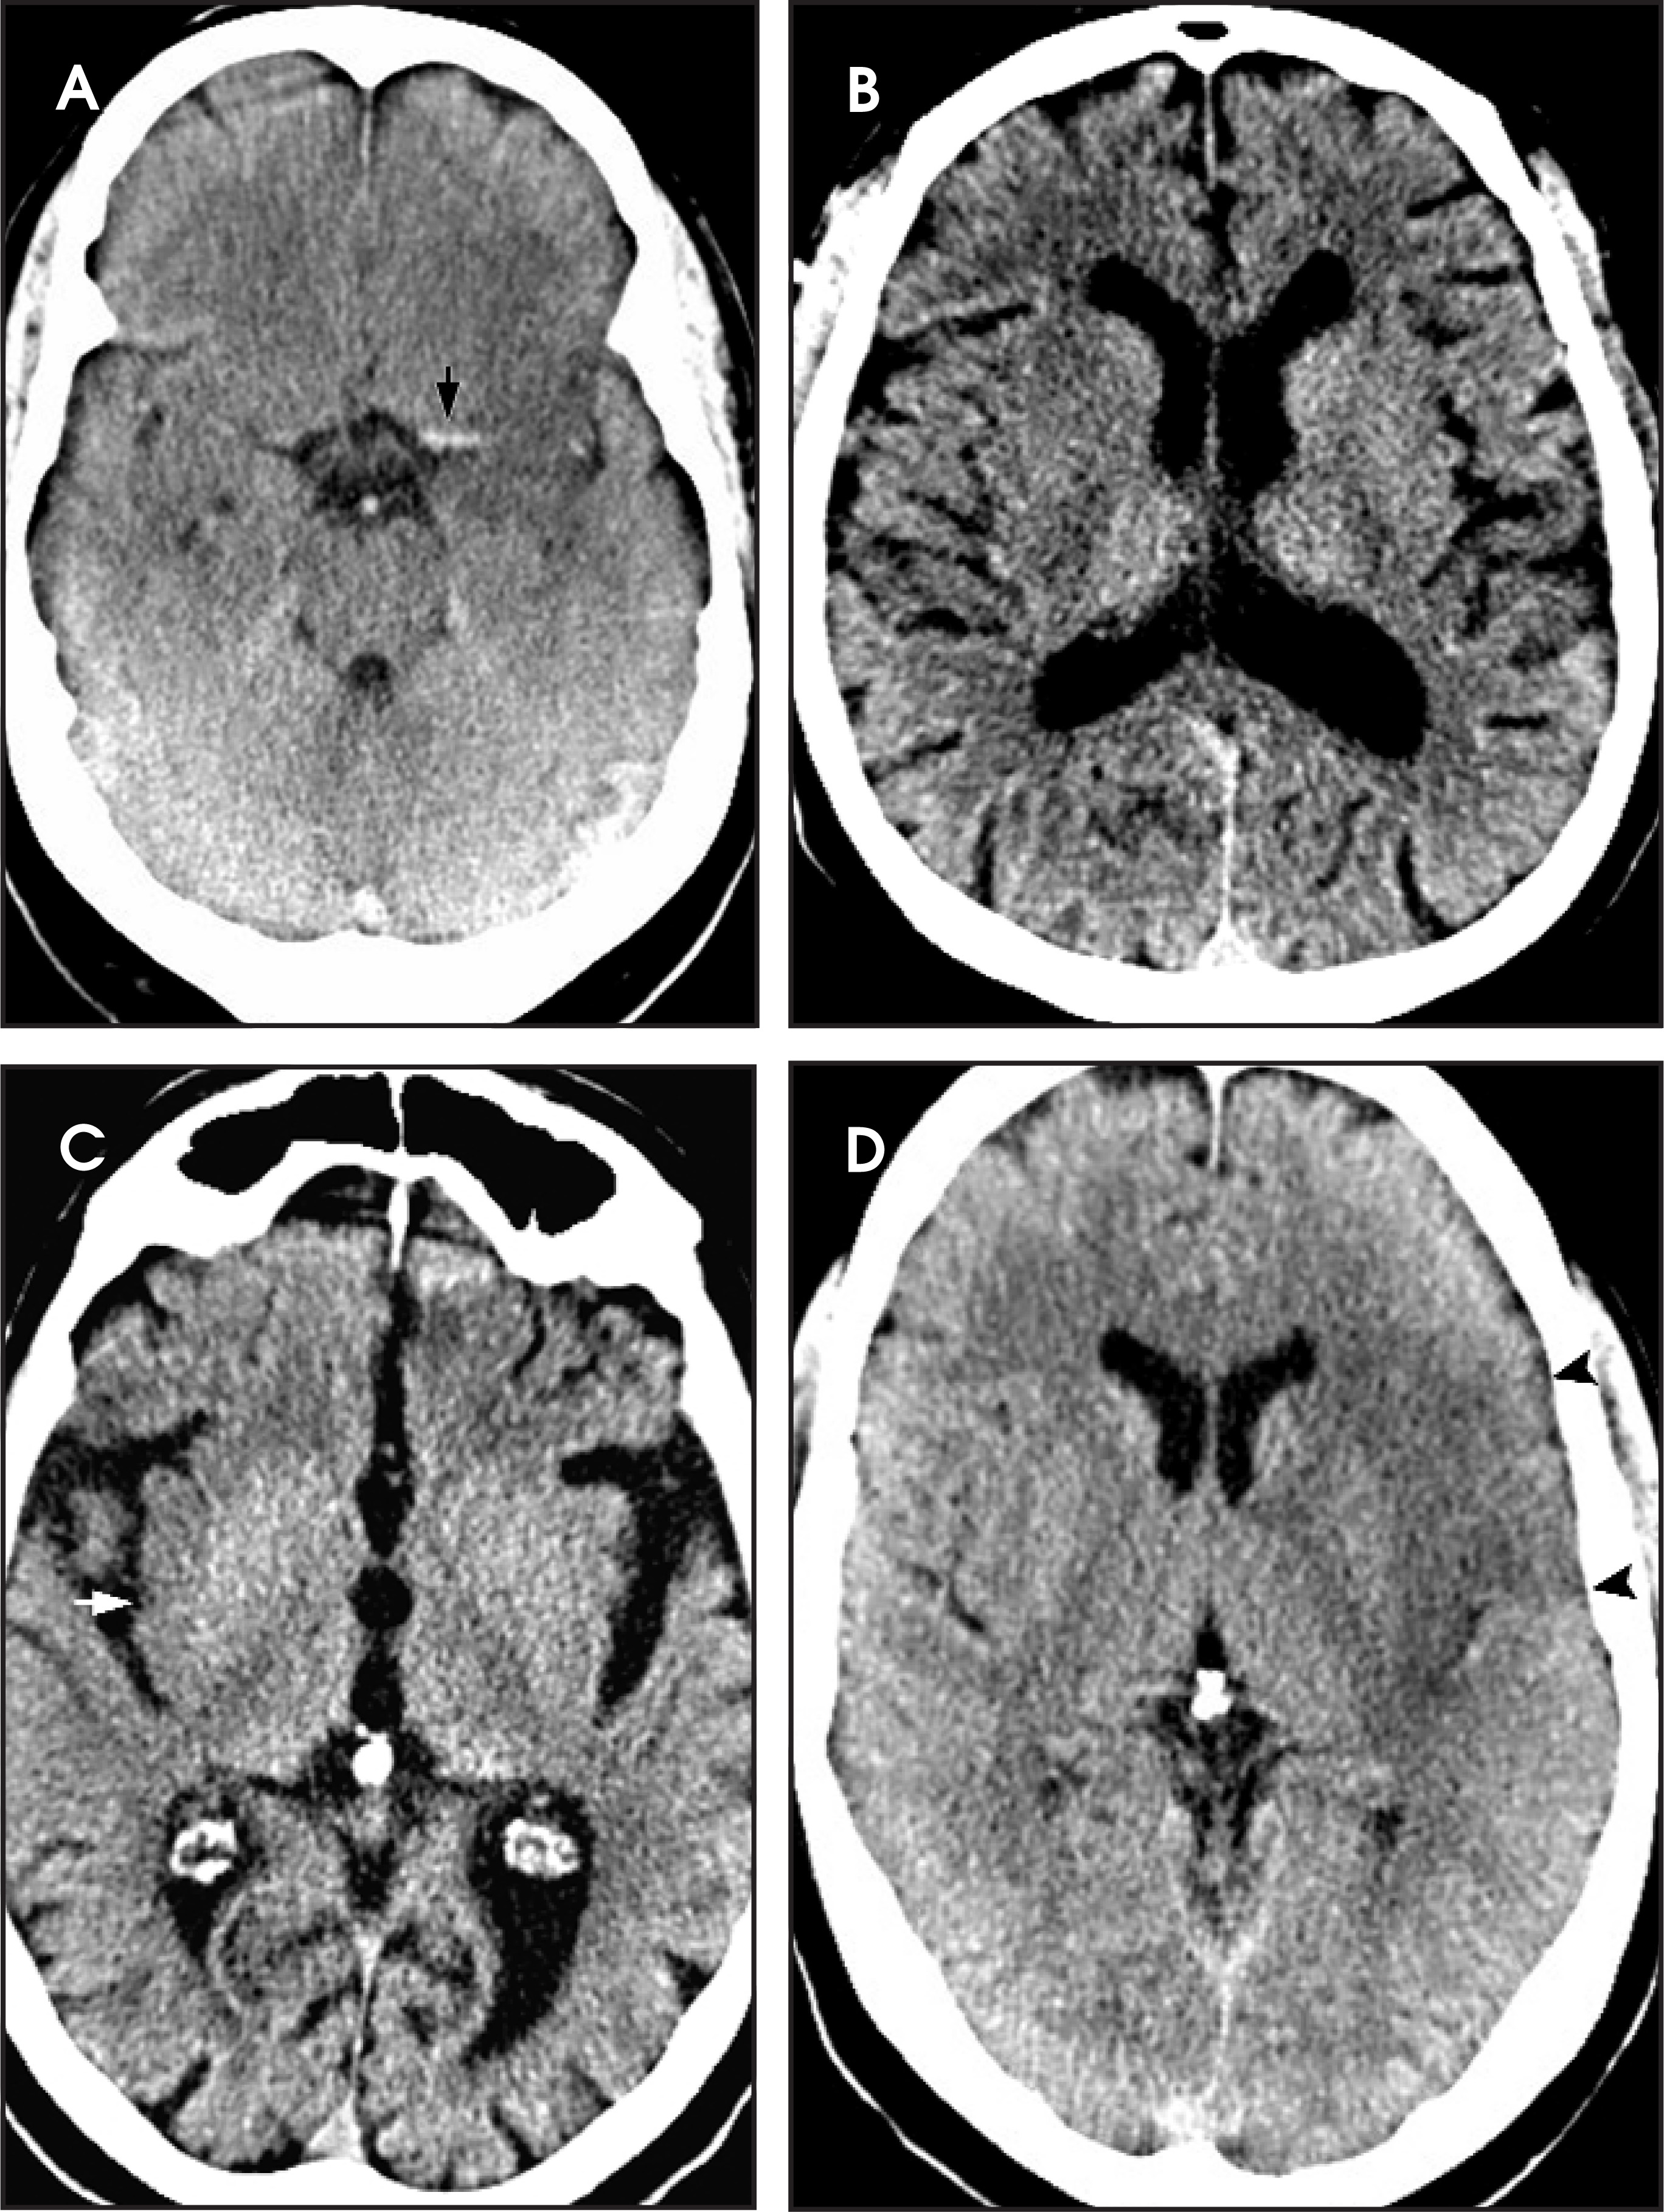
Until the late 1980s, noncontrast CT was used acutely in clinical stroke primarily to exclude intracranial hemorrhage and tumor. Federal Drug Administration approval of the intravenous thrombolytic agent tissue plasminogen activator (TPA) and growing “off-label” use of IA thrombolytic and/or anti-platelet agents for treatment of CNS thromboembolic ischemia has brought renewed interest in identifying CT findings during the hyperacute phase (<6 hours) of cerebral infarction. Well-described acute ischemic findings on noncontrast head CT include a hyperdense middle cerebral artery (MCA)1 parenchymal hypodensity within a vascular territory, loss of the gray-white matter junction including obscuration of the lentiform nucleus2 and loss of the insular ribbon,3 and sulcal effacement (Figure 1).
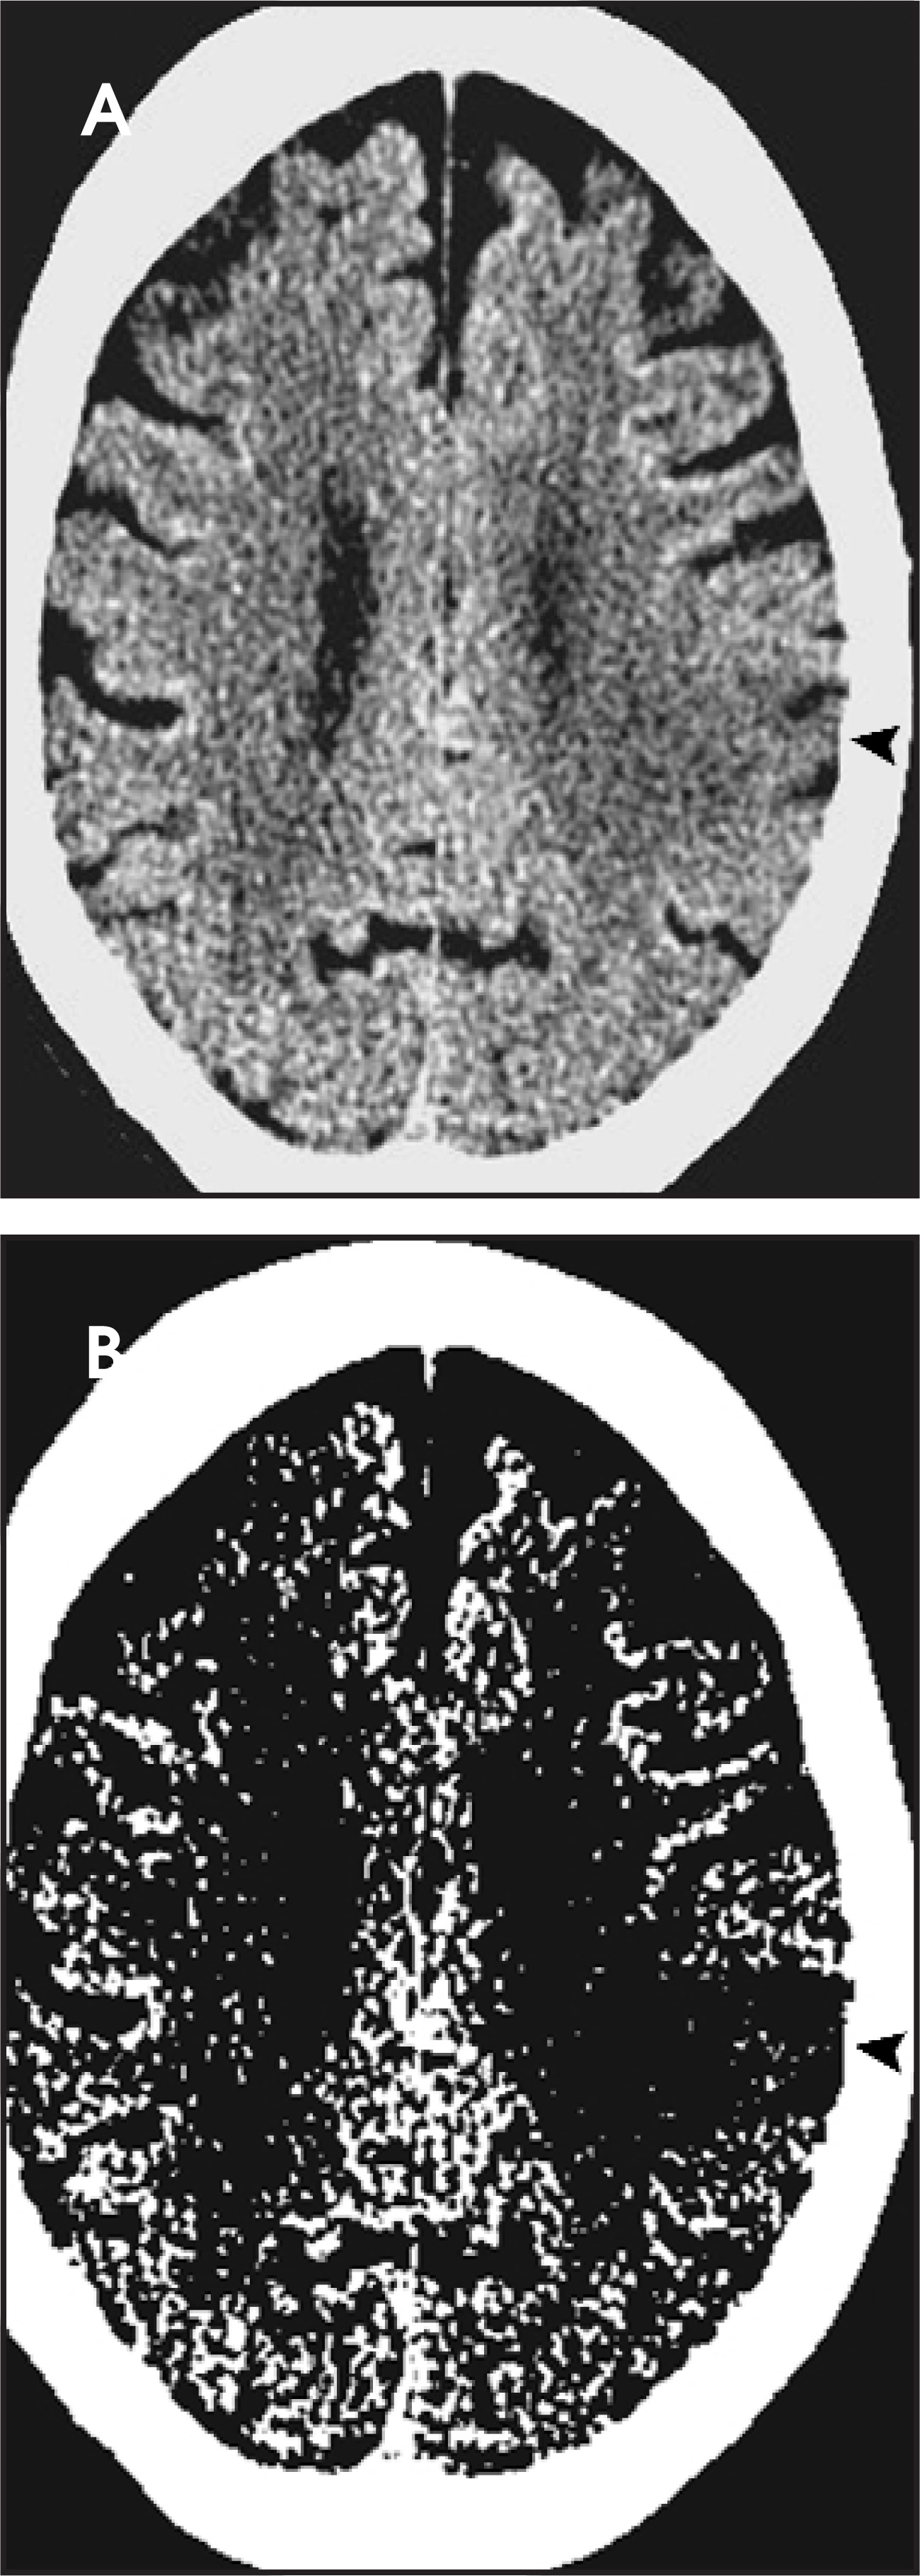
Historically, up to 60% of head CT examinations that are obtained within the first few hours following stroke onset are “normal.”4 Compared with hyperacute stroke patients with normal CT examinations, those patients with CT parenchymal hypodensity at <6 hours have less favorable clinical outcomes, with a higher incidence of intracranial hemorrhage (ICH) and death.5 In the NINDS study, patients treated with IV TPA had a 10-fold increased incidence in ICH yet only a 12% absolute improved clinical outcome at 3 months.6 As a result, IV TPA is not recommended for patients with parenchymal hypodensity greater than one third of the MCA vascular distribution for fear of infarct hemorrhagic conversion.7 Radiologists at medical centers utilizing IV TPA must carefully scrutinize noncontrast head CT examinations for both possible hemorrhage and early MCA distribution parenchymal hypodensity volume. Image review on a picture archiving and communication system (PACS) using narrow width and level adjustments has been shown to facilitate the visualization of intraparenchymal hypodense lesions (Figure 2).8
With a modest rate of clinical improvement and a significant risk of secondary ICH, the key to successful emergent stroke thrombolytic therapy is appropriate patient selection. Patients with complicated migraine, conversion reaction, or a postictal state may clinically mimic acute ischemia upon presentation to the emergency room. Since noncontrast head CT is generally normal in these individuals, thrombolytic therapy, with its concomitant hemorrhage risks, may be inappropriately instituted for lack of ischemia confirmation. For patients with true acute cerebral ischemia, the volume of potentially salvageable, nonirreversibly injured ischemic tissue (penumbra) is central to thrombolysis risk-benefit ratio evaluation. While no CT or MRI parameter has yet proven sufficient to absolutely quantify the penumbra volume, CTA and CTP are now well-described techniques that have been shown to improve sensitivity in correctly identifying those patients with acute cerebral ischemia and in estimating penumbra volume.
The details of these CT techniques, which are beyond the scope of this article, are well reviewed elsewhere.9-12 Briefly, CTP utilizes sequential scanning of contiguous tissue slices during dynamic IV contrast administration to create contrast time-concentration curves during the first pass of contrast media through the cerebral vasculature. Adjacent tissue slice locations for CTP selected at the basal ganglia/internal capsule level enable perfusion evaluation within all 3 supratentorial (anterior, middle, and posterior cerebral artery) vascular distributions.
The commercial software application of a deconvolution mathematical model to the contrast time-concentration curves, performed on an offline workstation in as little as 5 minutes, allows the creation of color perfusion maps that are based on the central volume principal: cerebral blood flow (CBF) = cerebral blood volume (CBV)/mean transit time (MTT). A time-to-peak (TTP) color map, which indicates the time interval from contrast injection to maximal density within a given tissue voxel, is another useful perfusion parameter readily derived from this data.
The stroke team anticipating urgent thrombolysis may use these perfusion color maps to confirm ischemia and to estimate penumbra volume. Both ischemic and infarcted tissue will have elevated MTT and TTP. Infarcted tissue (infarction core) will have decreased CBF and CBV. The penumbra, with preserved CNS vascular autoregulation, has been proposed to have decreased CBF and normal or elevated CBV.13 Thus, a gross estimate of penumbra volume (penumbra ≈ MTT (or TTP) elevation – CBV reduction) may help identify those patients with penumbra volumes large enough to justify inherent treatment risks.
One preliminary study of stroke patients who were evaluated within 6 hours of ischemia onset reported that TTP and CBV volumes were equivalent on CTP and MRI perfusion studies.14 Thus, visual estimation of CTP penumbra volume by comparing TTP and CBV maps provides important information regarding thrombolytic treatment risk/benefit ratio (Figure 3).
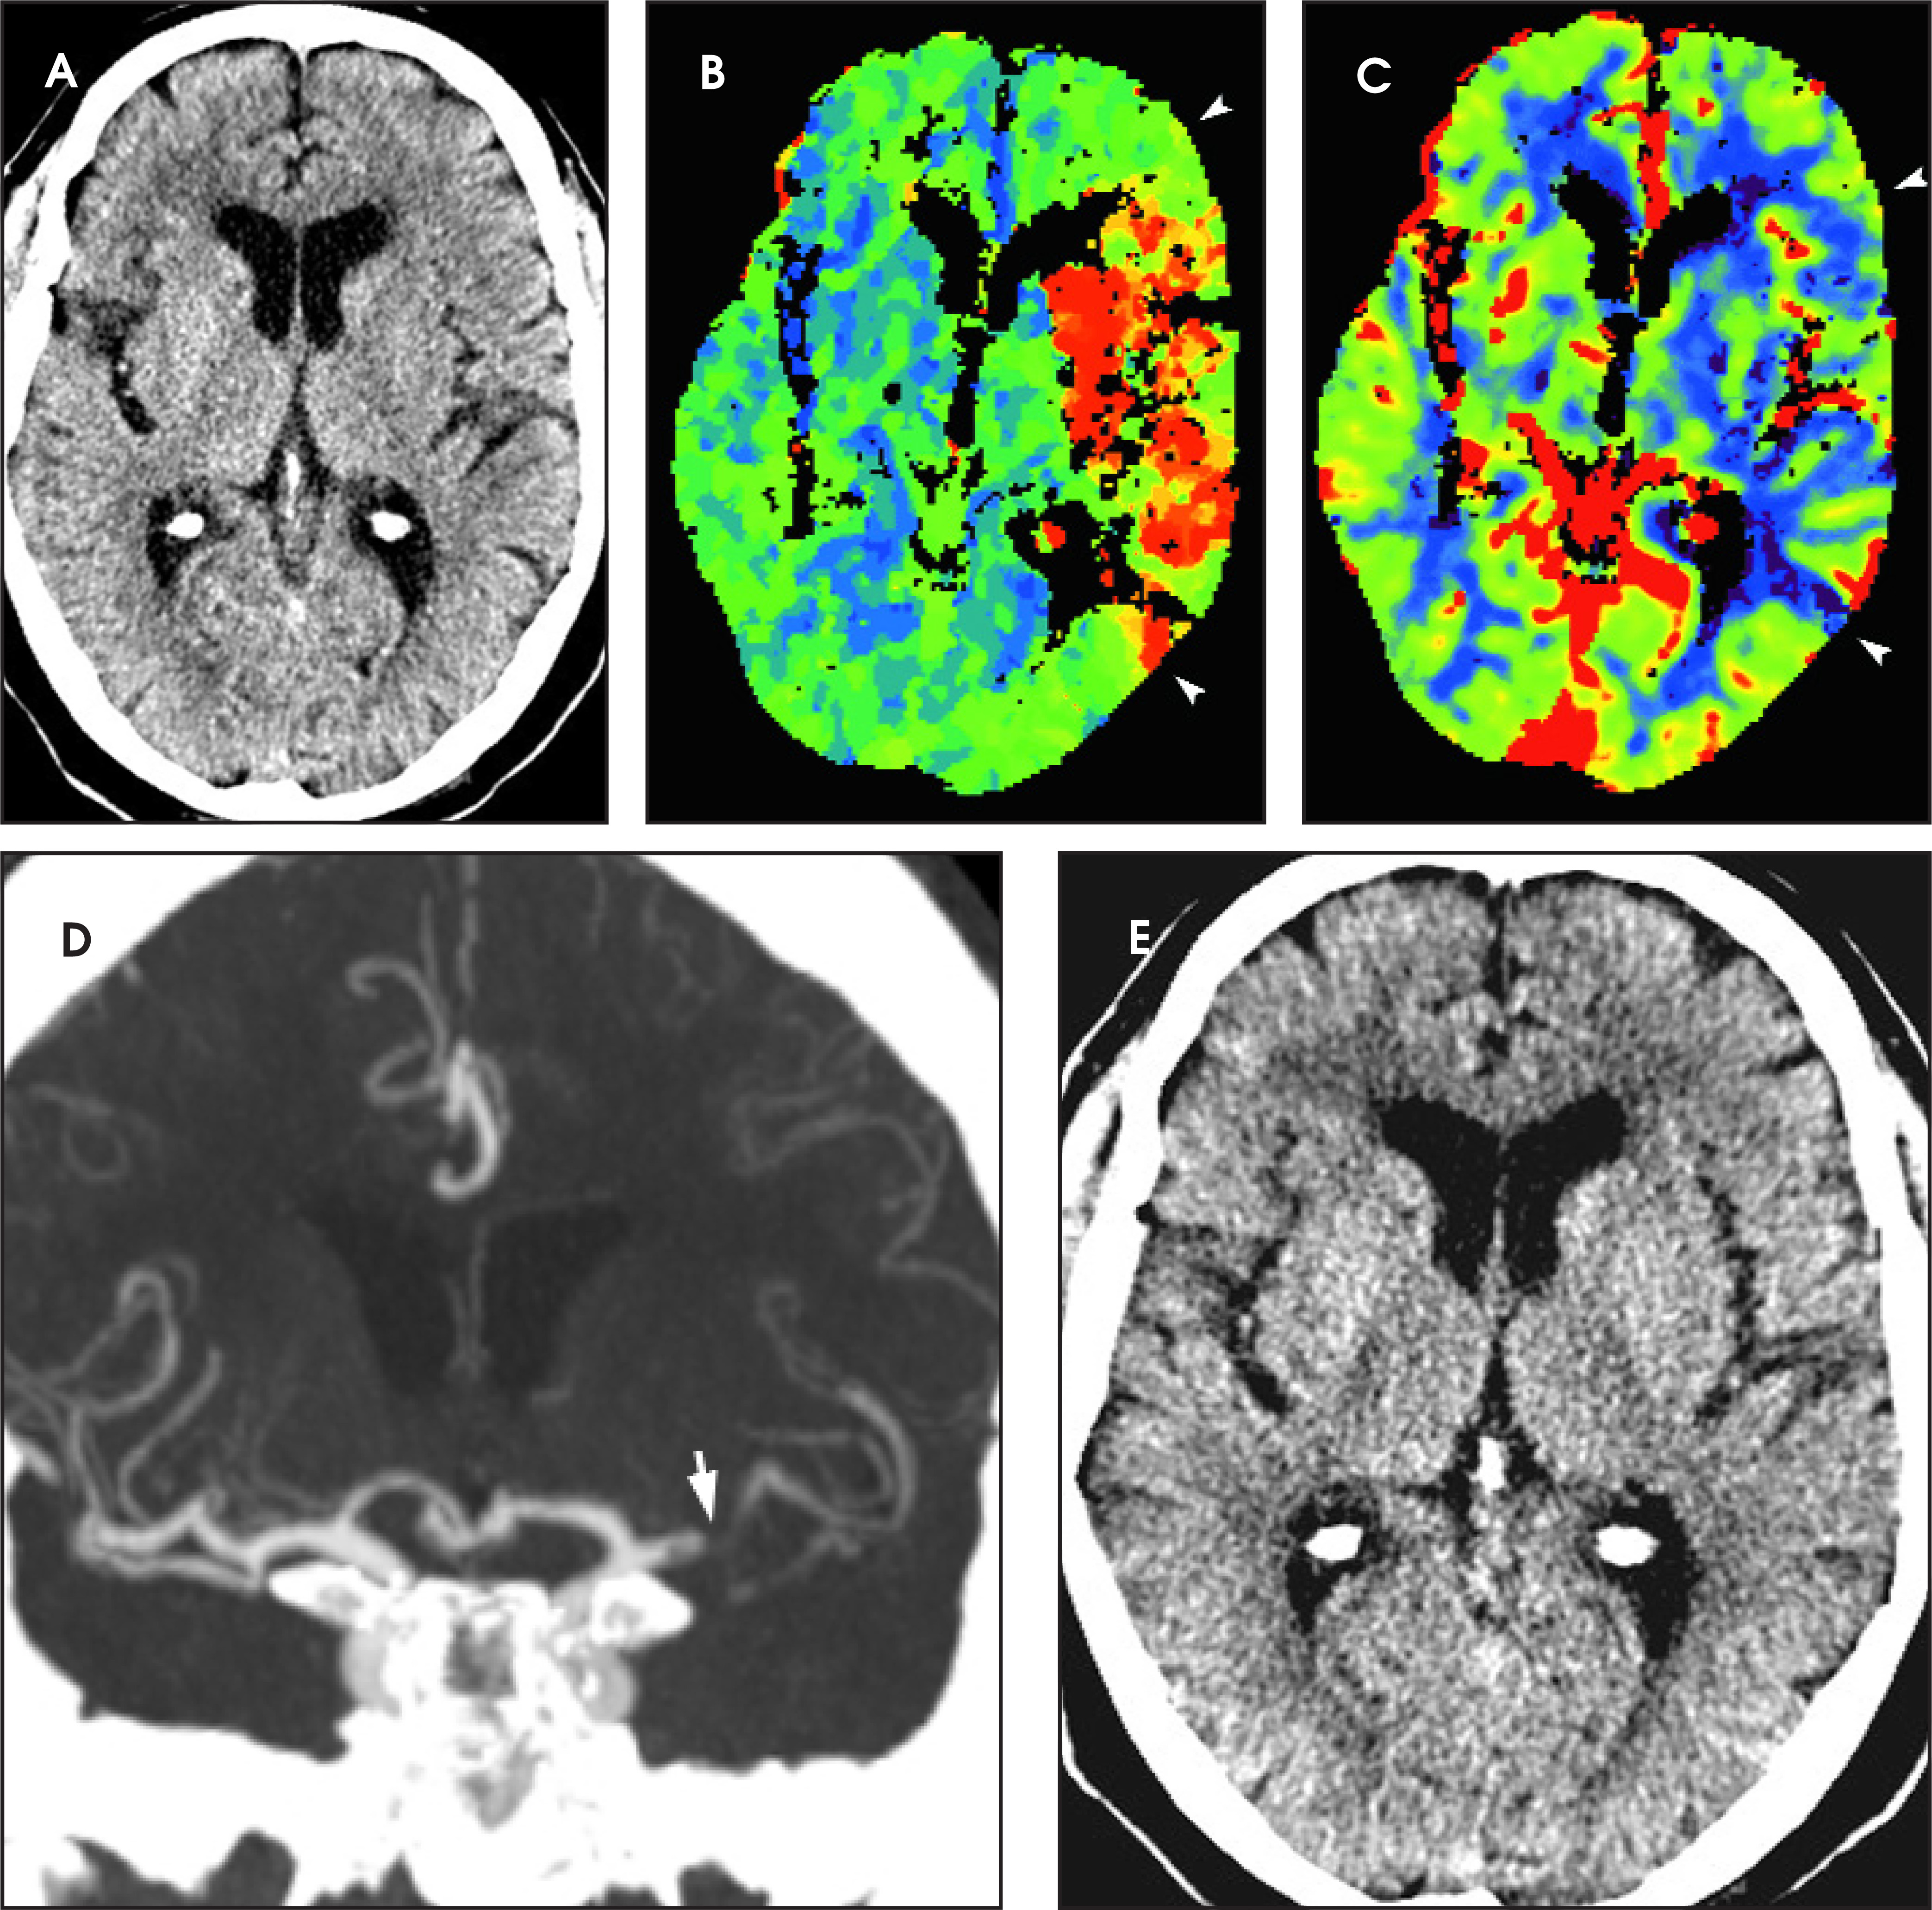
While it is currently common practice to administer IV TPA to those patients with a stroke-onset–to–treatment interval of <3 hours, thrombolytic therapy is probably not warranted in patients in whom penumbra volume does not significantly exceed the infarction core, as reperfusion hemorrhage risk outweighs the possible clinical outcome improvement likely to result from the salvage of a very modest tissue volume (Figure 4).14,15 Two recent acute stroke thrombolysis studies have suggested that CTP penumbra estimates may allow selection of patients with significant penumbra for whom the IV thrombolytic treatment window may be successfully extended up to 9 hours.14,15 Since only 4% of acute stroke patients present to a hospital within the conventional 3-hour TPA treatment window,16 it is hoped that evolving the acute thrombolytic therapy criteria to the physiologic penumbra rather than the time from onset may allow the inclusion of a greater number of patients in future treatment protocols.
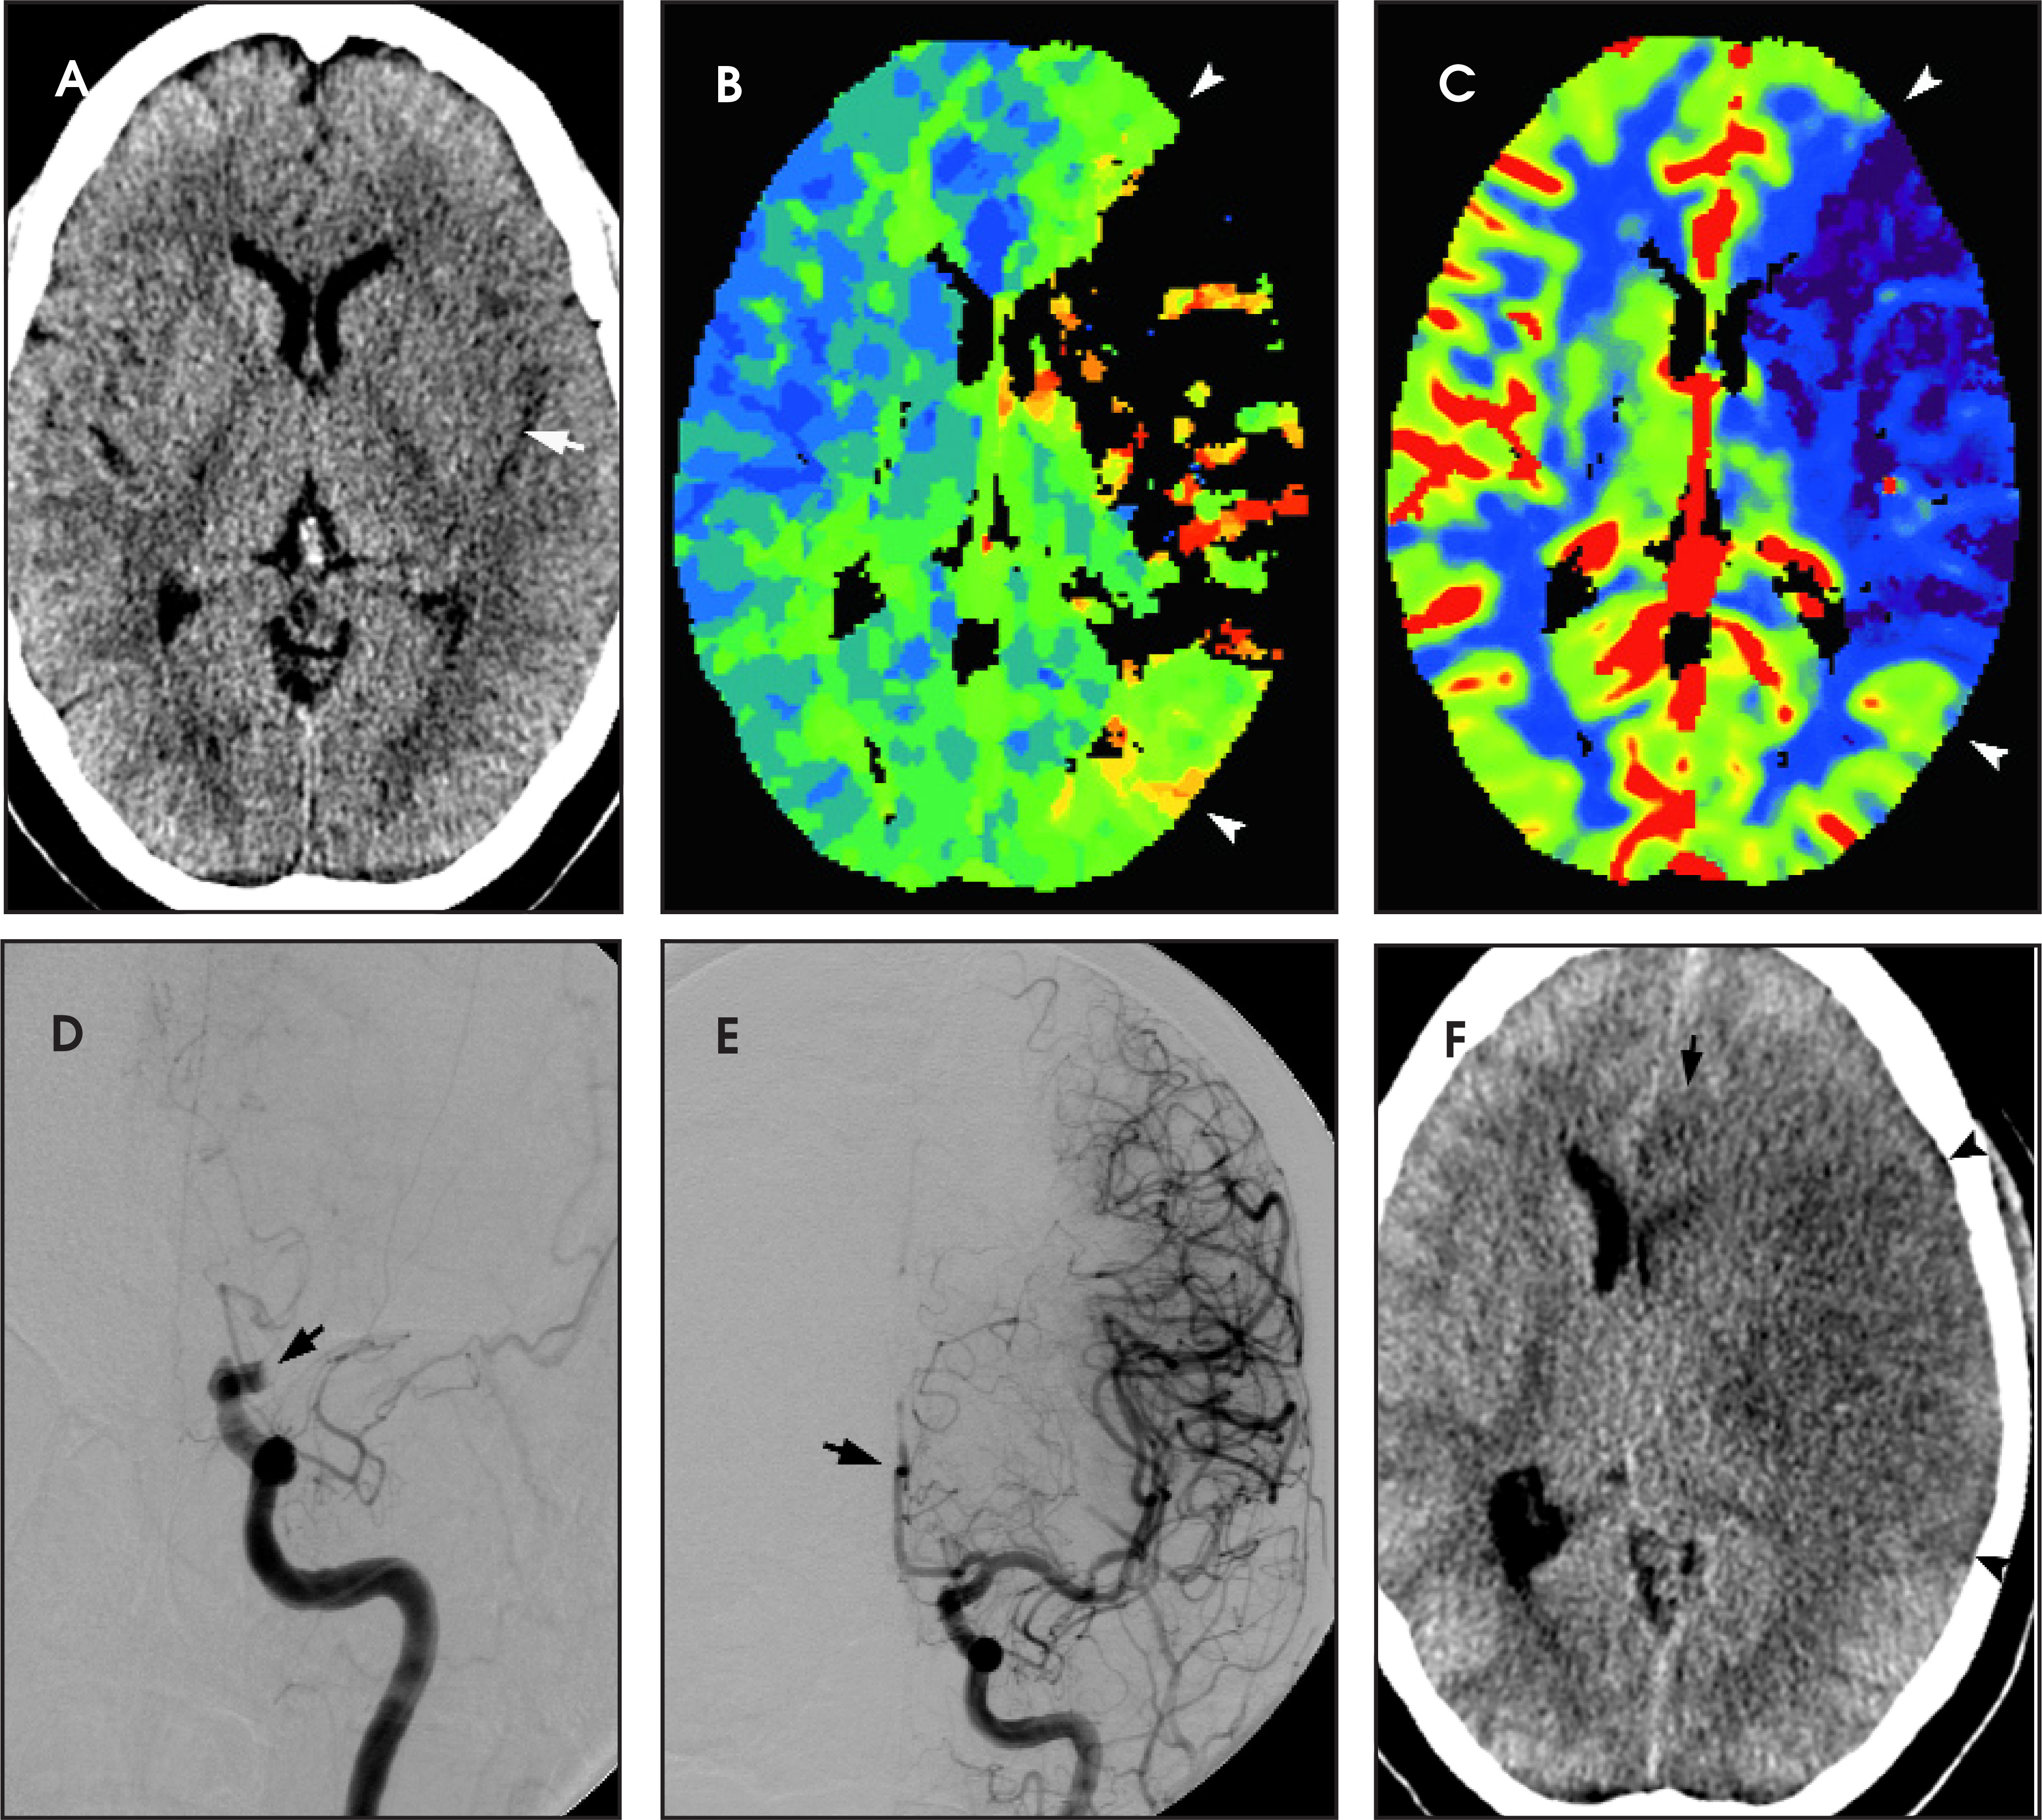
CT angiography is most commonly performed immediately following CTP. CT angiography source images and rapidly created axial, coronal, and sagittal multiplanar reconstructions (MPRs) help elucidate thromboembolism location, volume, and collateral blood flow that correlate with recanalization rate and incidence of hemorrhagic transformation.17,18 Information from CTA may, therefore, directly impact treatment risk-benefit analysis for the selection of conservative medical management, or IV or IA thrombolysis. Furthermore, in the absence of CTP color maps, the lack of peripheral arterial and cortical enhancement on CTA source images can confirm the location and estimate the volume of the infarction core.14
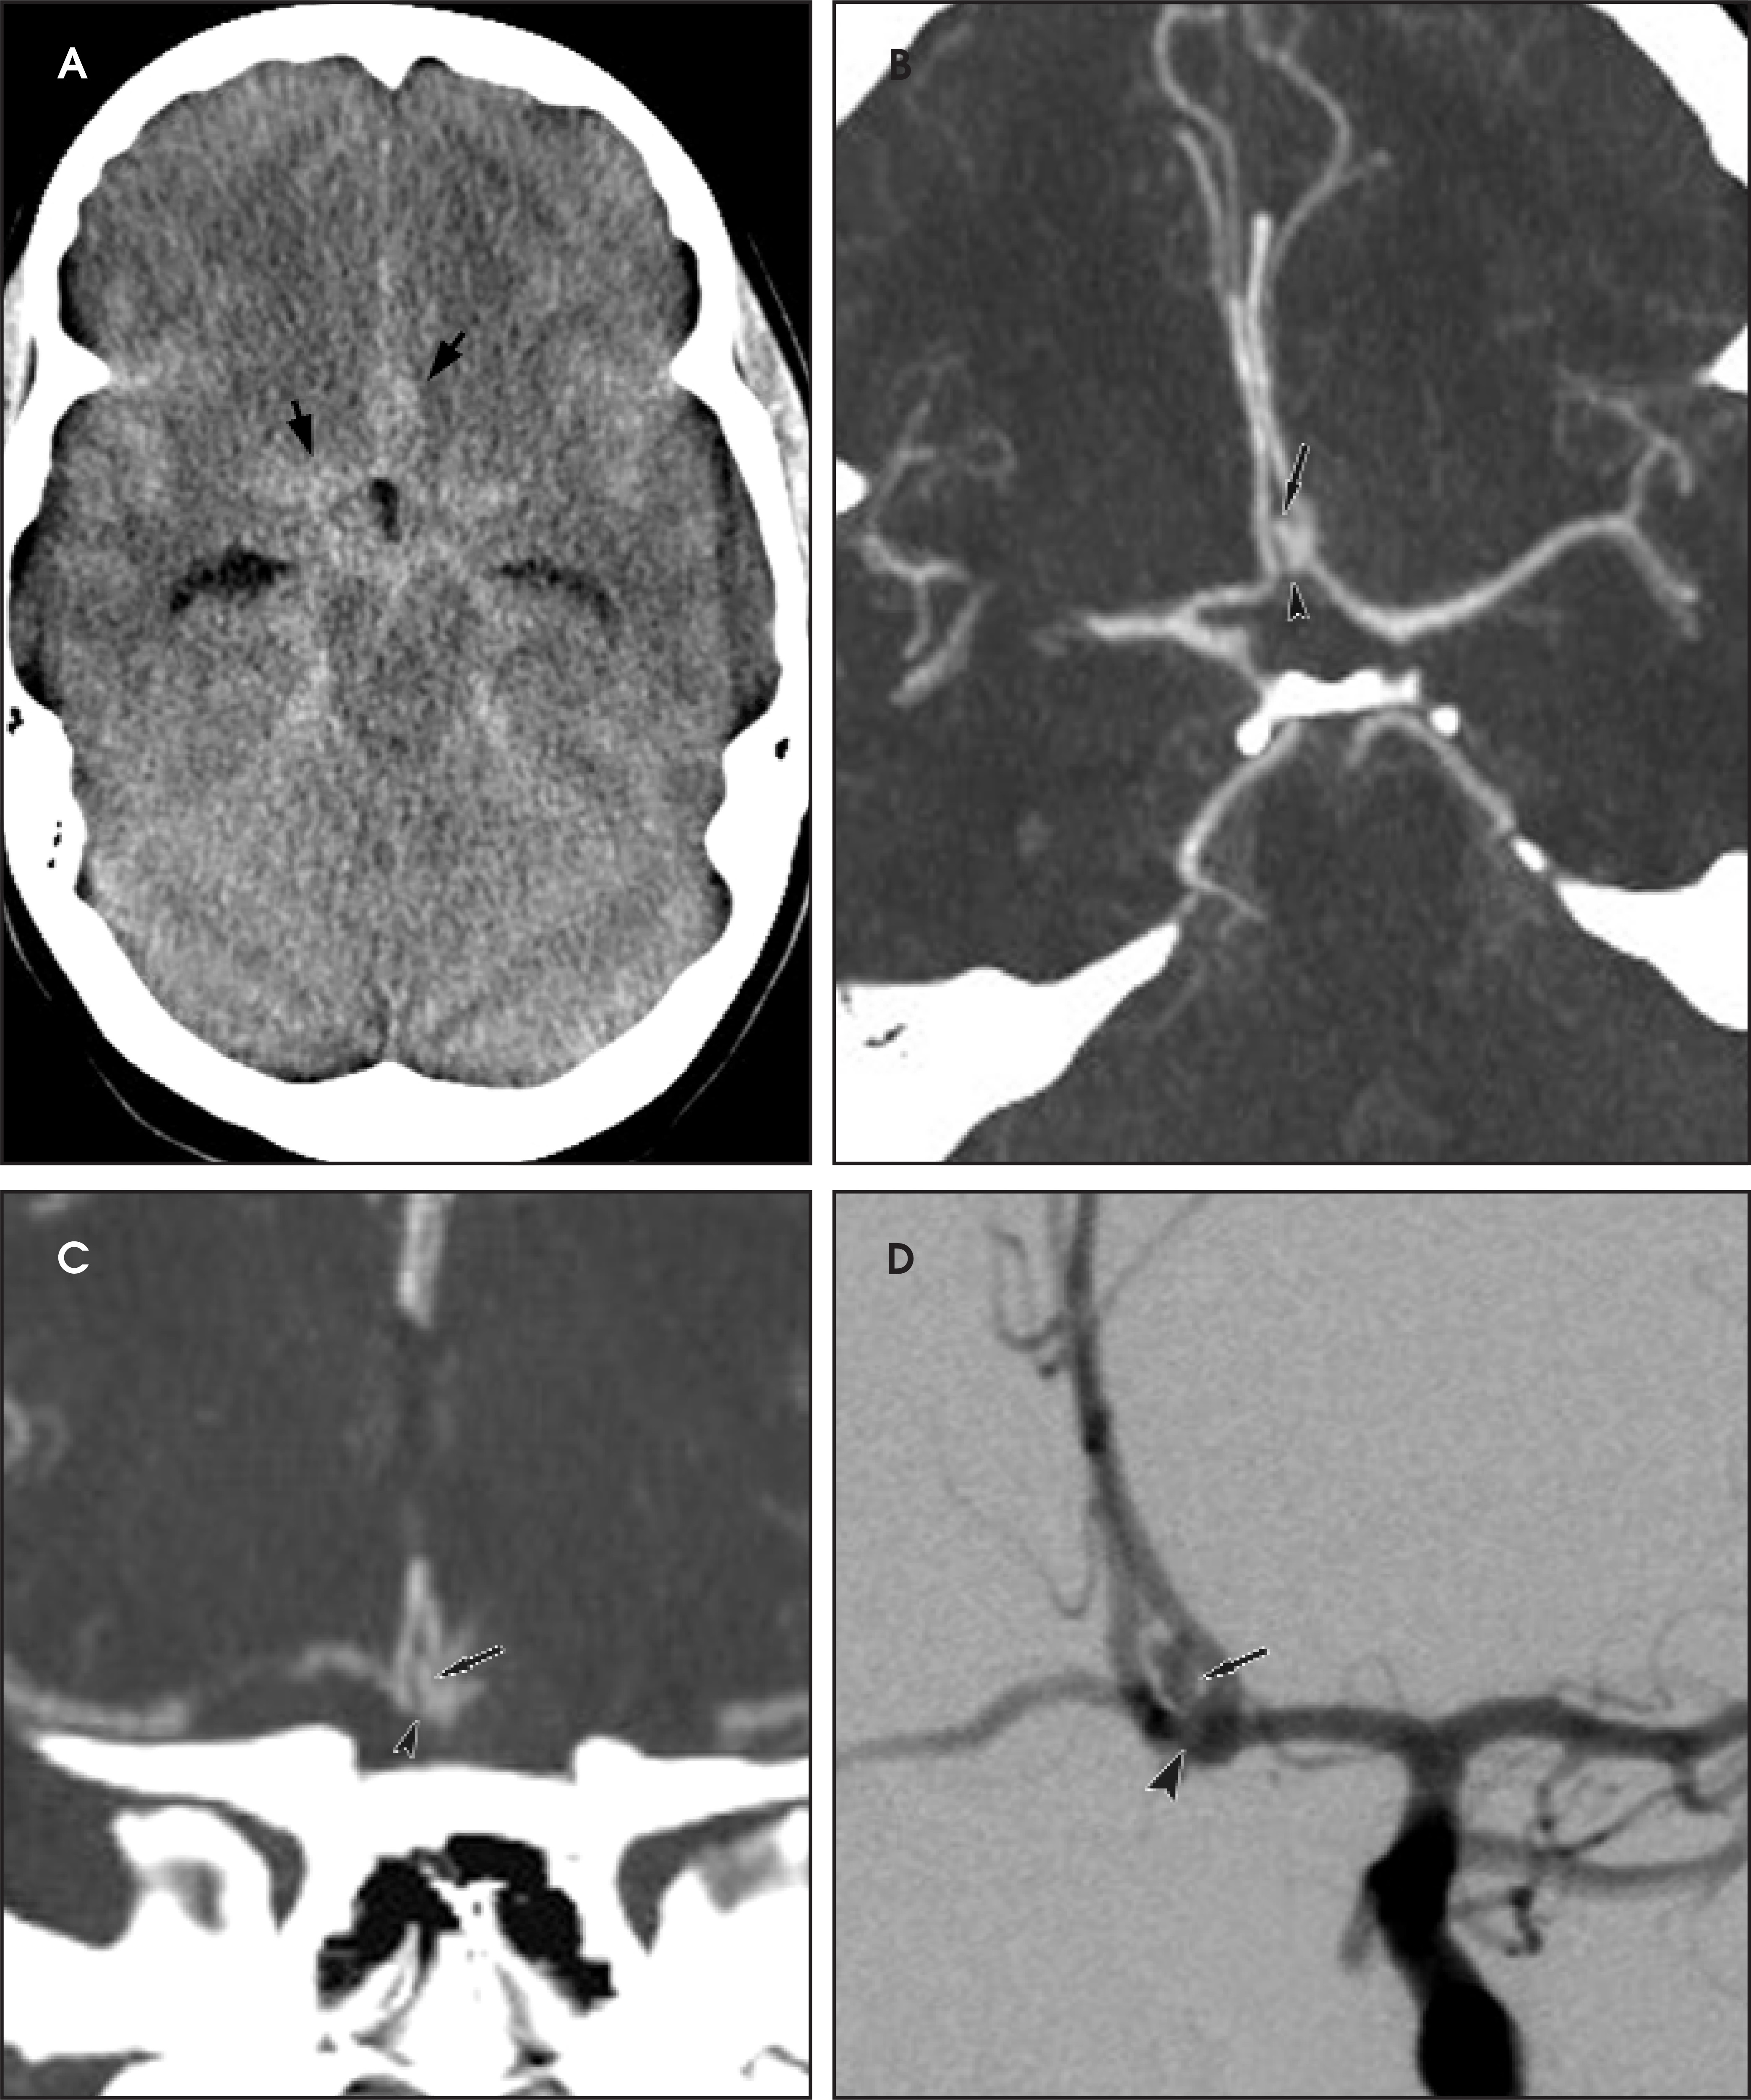
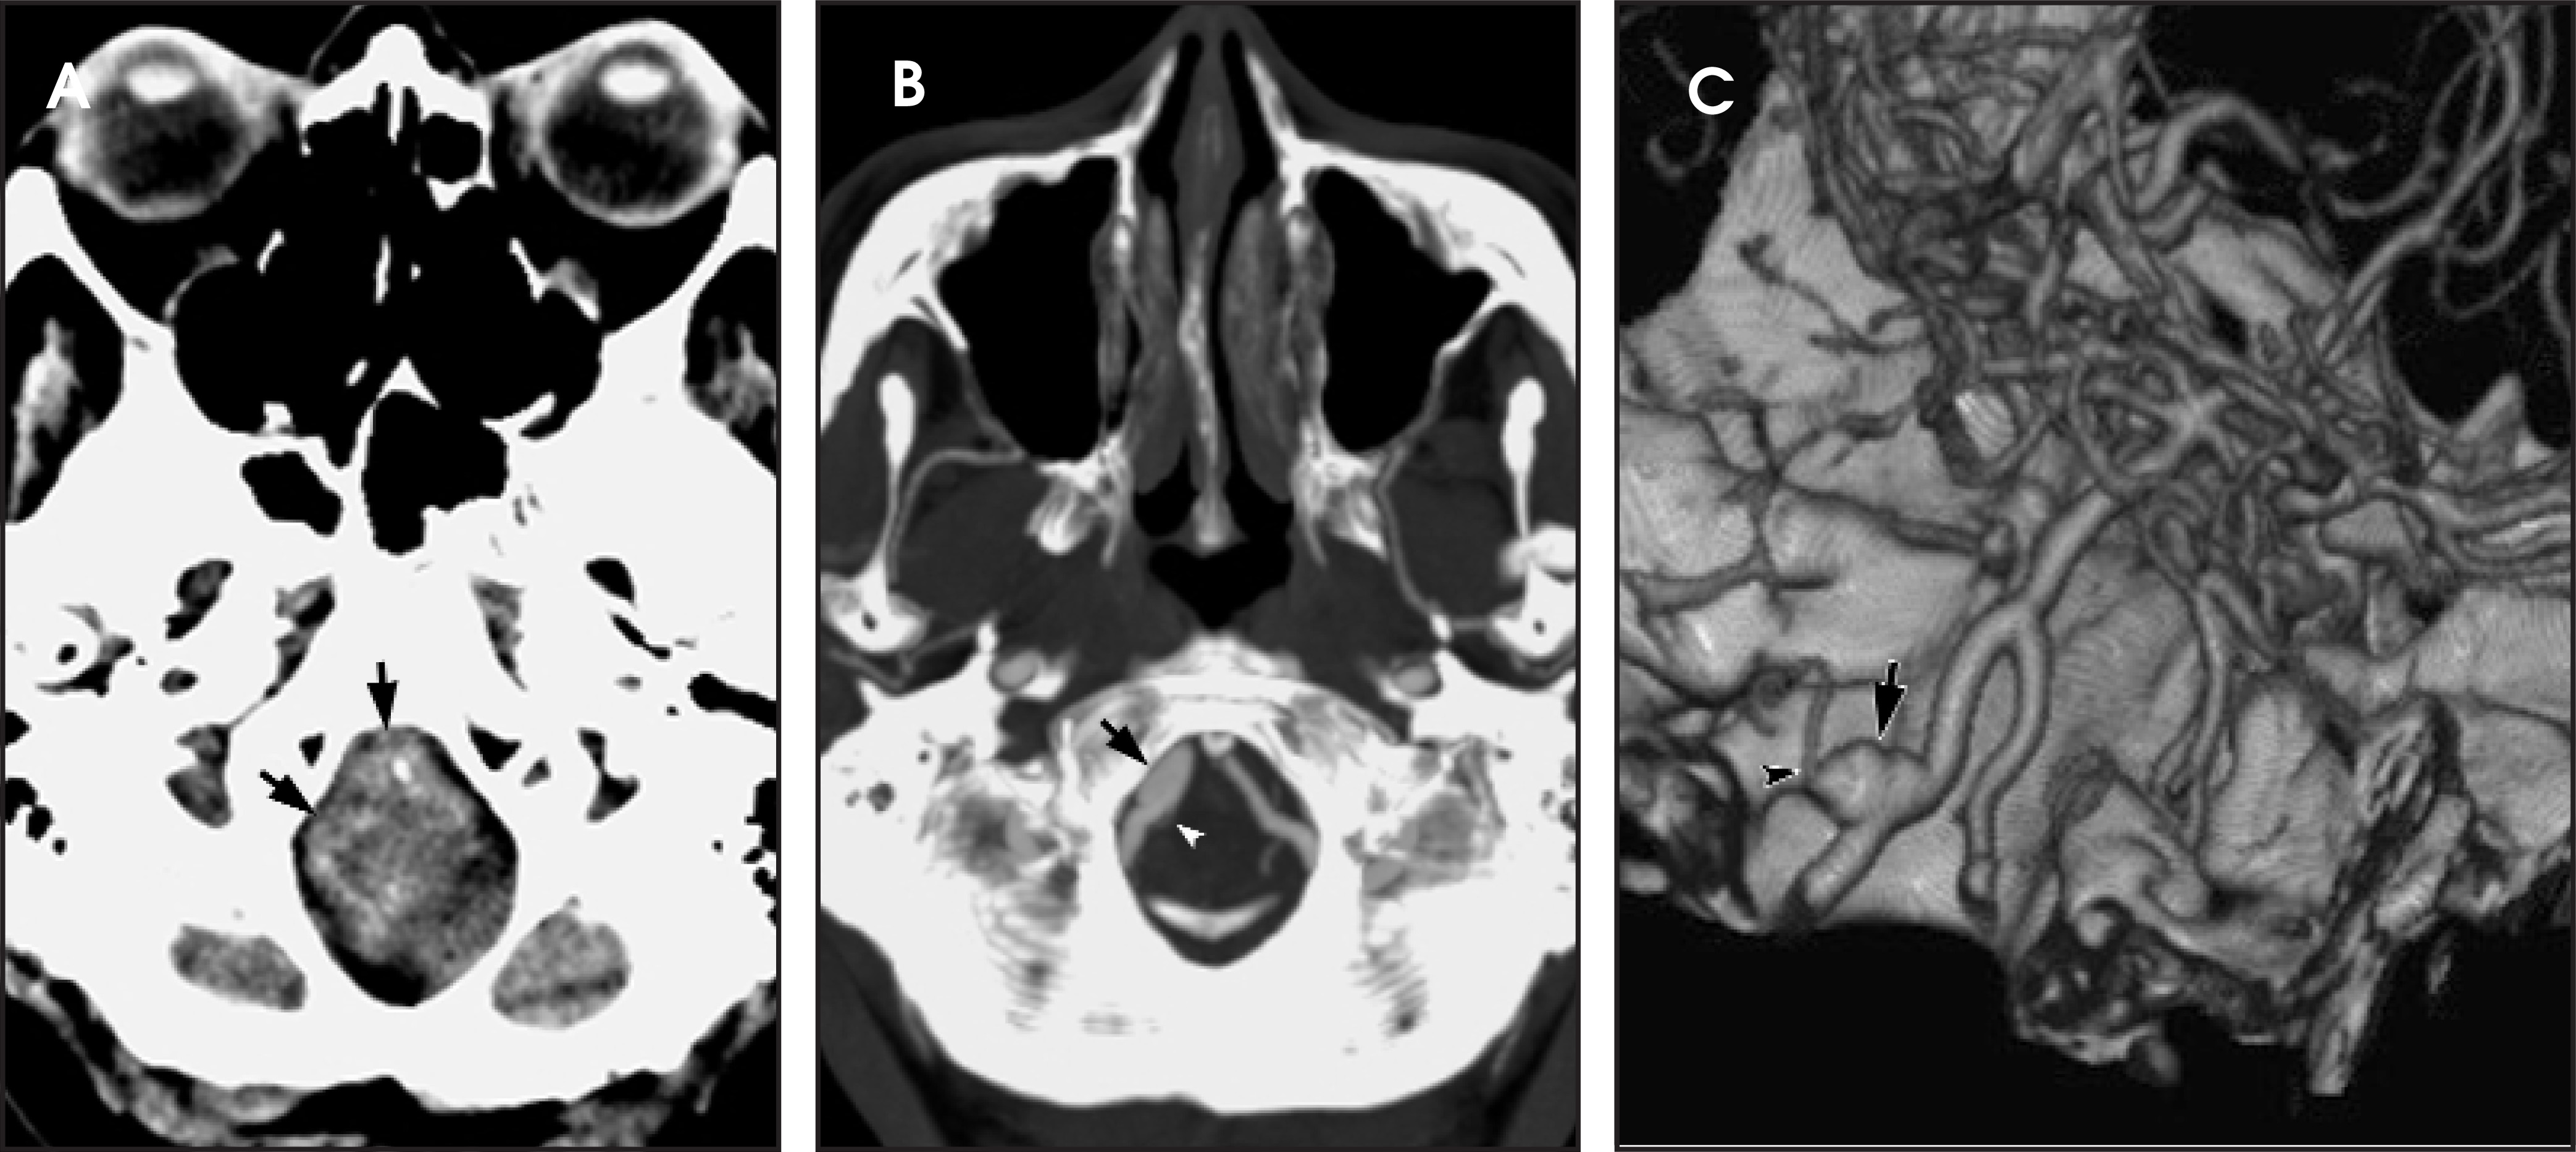
Noncontrast CT is approximately 95% to 98% sensitive for demonstrating aneurysmal SAH within the first 24 hours.19,20 Aneurysms account for 80% of nontraumatic SAH and should be considered the underlying cause of acute basal cistern blood until proven otherwise. Historically, atraumatic patients with signs of SAH on CT proceeded directly to cerebral catheter digital subtraction angiography (DSA) for underlying aneurysm identification prior to endovascular surgery or conventional neurosurgical clipping. Increasingly, institutions are utilizing the capabilities of newer multichannel CT scanners to evaluate patients with suspected aneurysmal SAH. While DSA remains the gold standard for detecting intracranial aneurysms, its limitations include a 0.5% risk of permanent neurologic complication and a 5% to 10% false-negative rate for aneurysm identification. Sixteen and 64 multichannel CTA protocols requiring as little as 50 to 75 milliliters of iodinated contrast allow noninvasive CTA data acquisition in <1 minute and, according to several recent studies, have sensitivities >90% in all aneurysms and up to 100% in ruptured aneurysms.21-24 Multichannel CTA that is performed immediately following the noncontrast CT findings of SAH facilitates patient triage to an optimal care location during CTA postprocessing and neurosurgical consultation. Using CTA source images and orthogonal multiplanar reformations that are produced at the CT console in 5 to 10 minutes, the radiologist may confirm the presence and location of an underlying intracranial aneurysm as well as provide aneurysm morphology information (Figure 5). Myriad CTA workstation postprocessing techniques (including maximum intensity projections [MIPs], shaded 3D volume renderings, and bone subtraction) can further assist presurgical planning and improve detection of aneurysms <3 mm and/or those that are adjacent to bone (Figure 6).25,26 Similarly, in the days following SAH, multichannel intracranial CTA, with or without CTP, may be used for the evaluation of possible intracranial arterial vasospasm in patients who develop delayed neurologic deficit.27,28
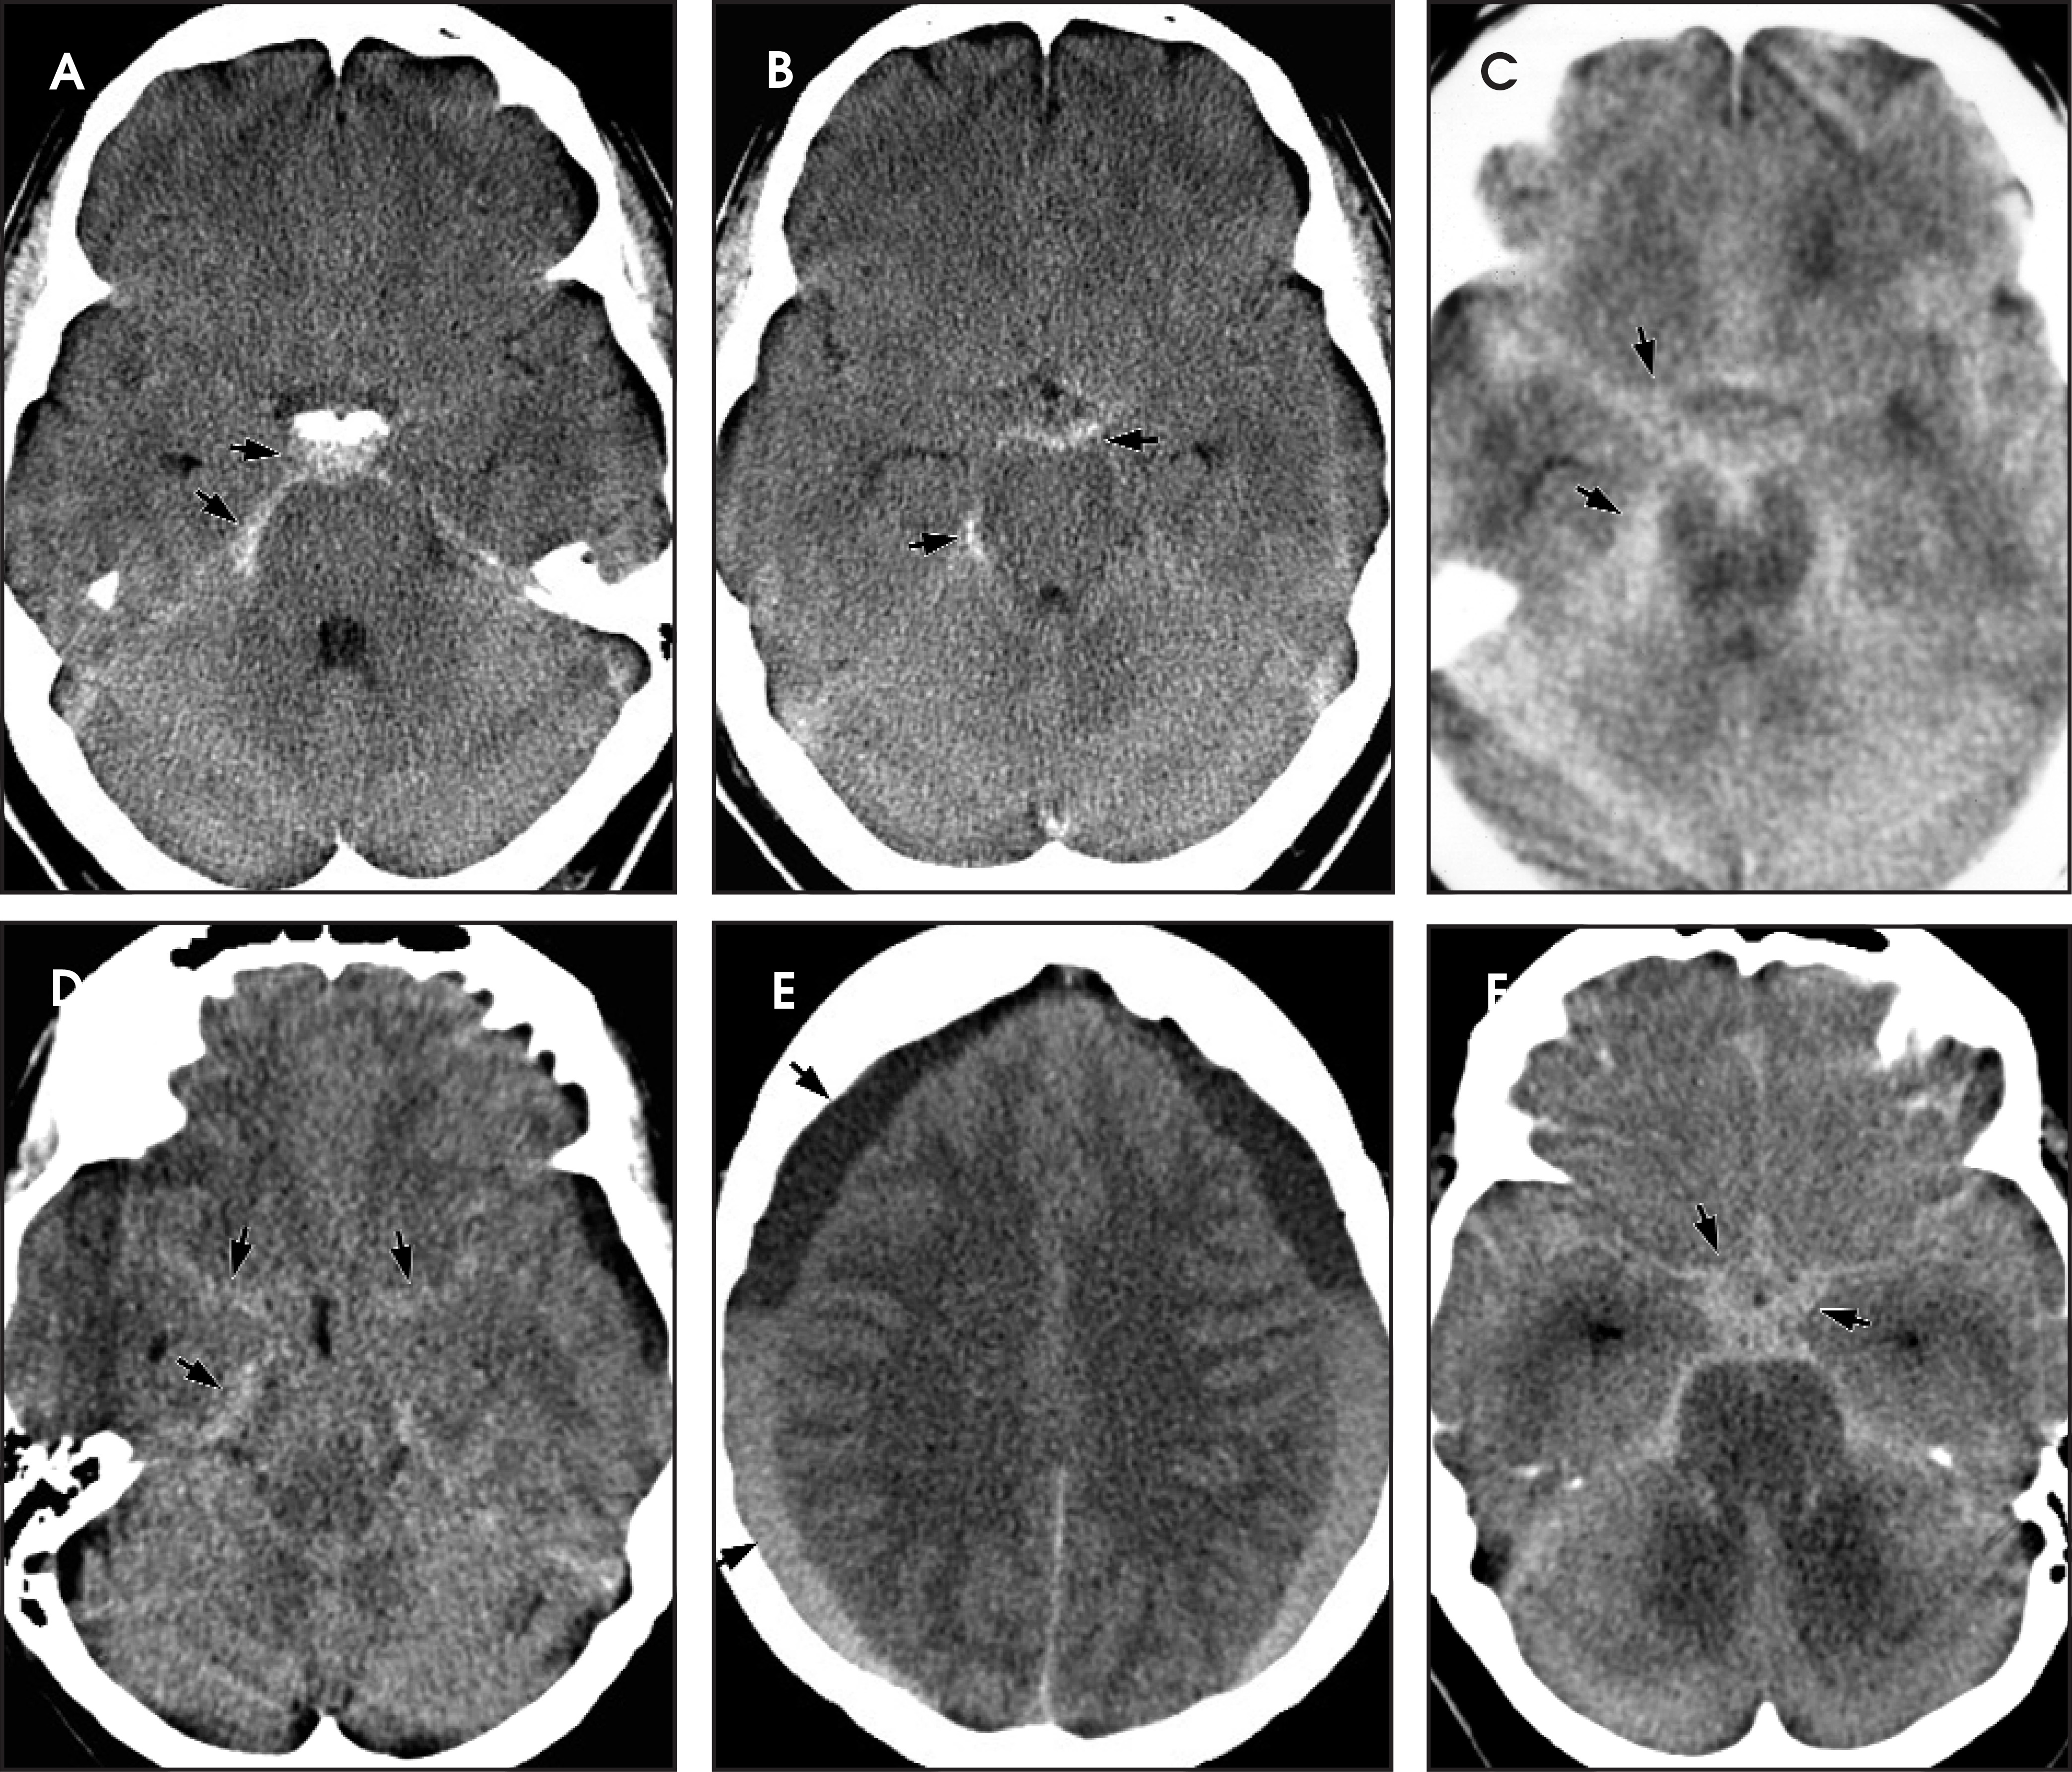
Other entities such as benign perimesencephalic SAH,29,30 cerebral venous thrombosis,31 basal infectious/inflammatory and carcinomatous meningitis, diffuse cerebral edema,32 and recent intrathecal contrast examination may mimic aneurysmal SAH on noncontrast CT (Figure 7). Benign perimesencephalic SAH, which is thought to be secondary to the rupture of perimesencephalic or prepontine veins, may account for up to 68% of angiogram-negative SAH. On noncontrast CT, SAH that is localized within the prepontine, interpeduncular, and ambient cisterns is characteristic. However, since the likelihood of this SAH distribution is 4% for vertebrobasilar aneurysms, intracranial CTA has been proposed as the preferred imaging modality in suspected benign perimesencephalic patients to obviate the risks of catheter angiography.33
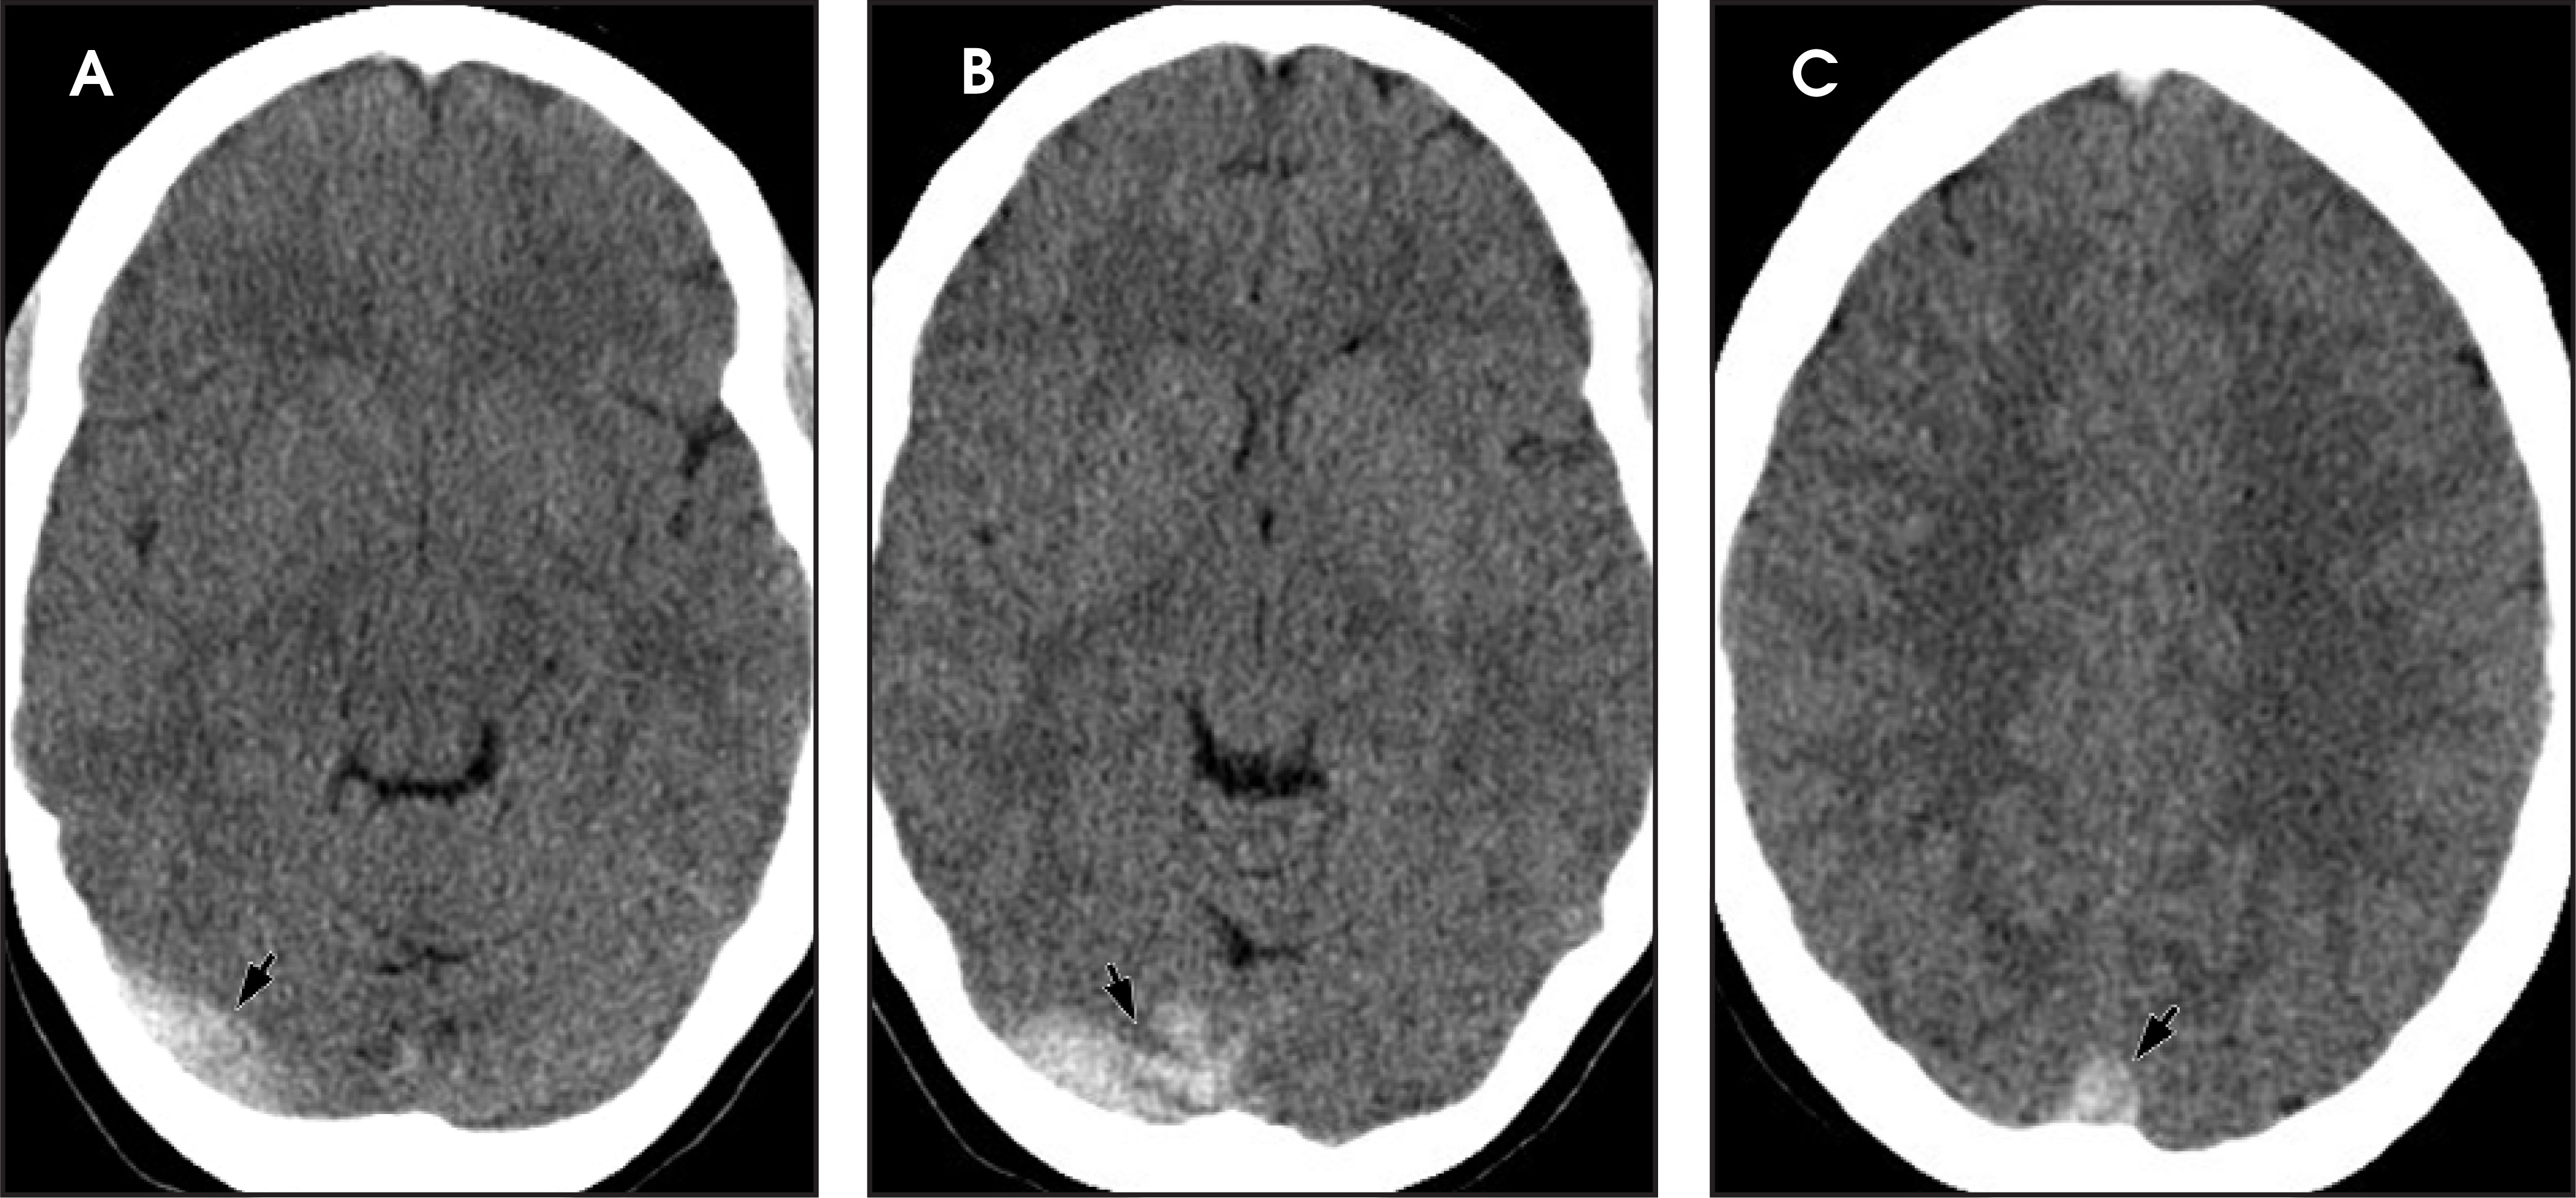
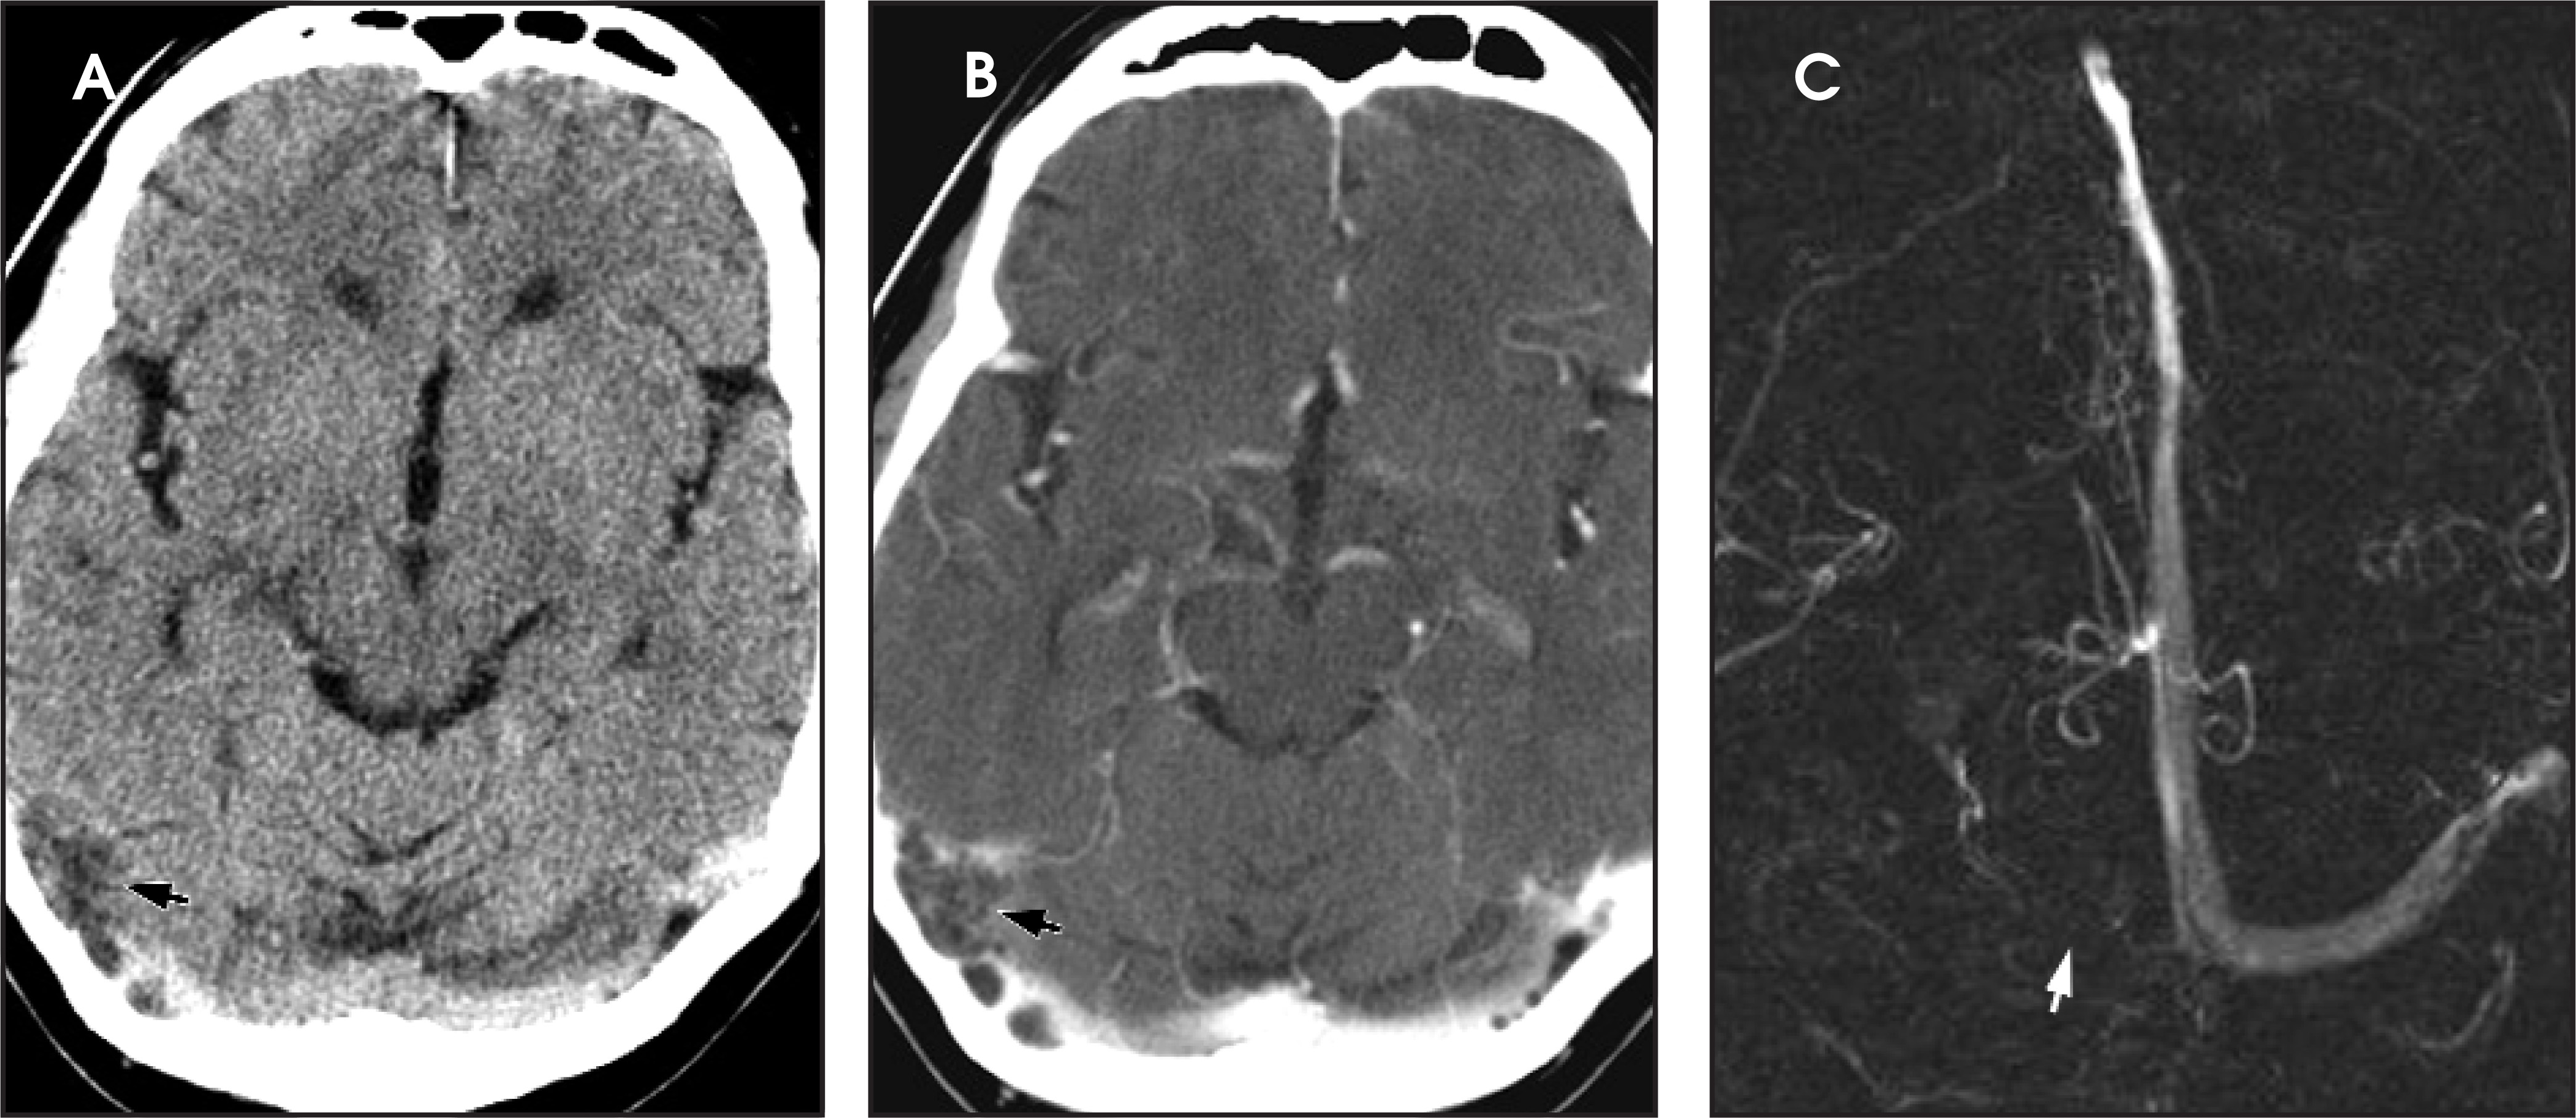
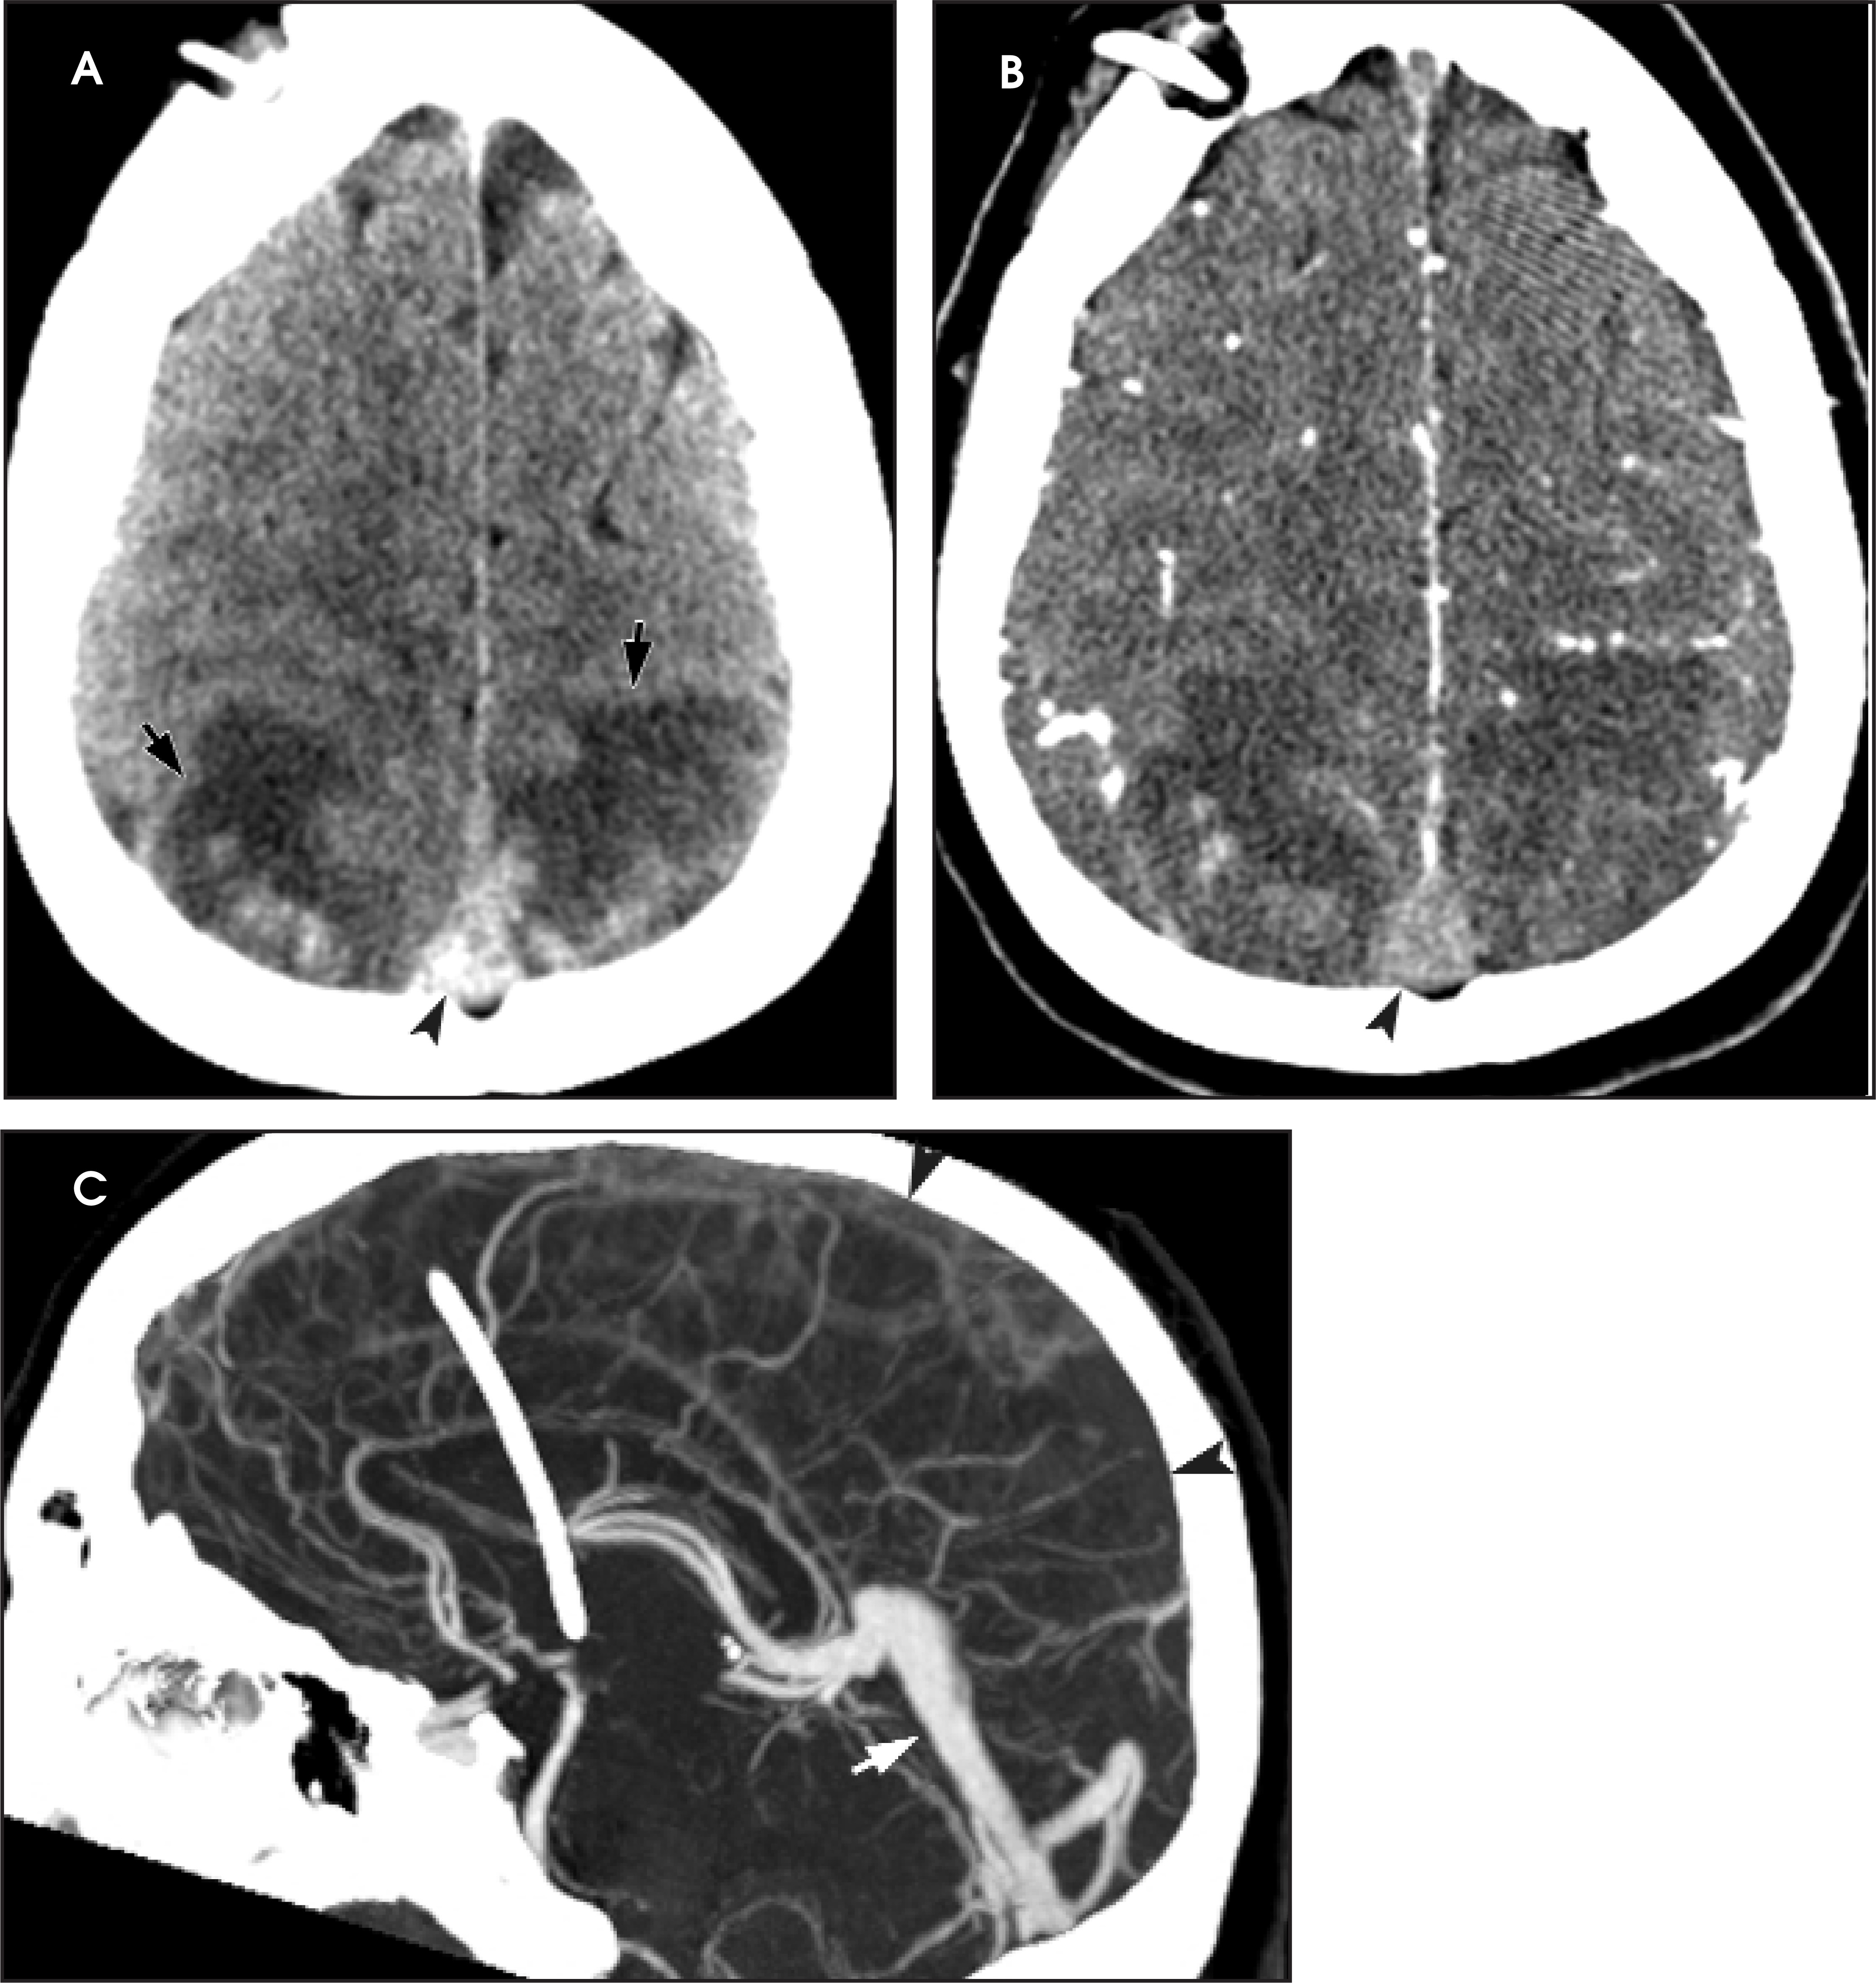
Radiologists must be vigilant to suggest the diagnosis of intracranial sinus thrombosis on head CT. Acute sinus thrombosis findings on noncontrast CT include a distended, hyperdense sinus or cortical vein,34 which is often referred to as the cord sign (Figure 8).35 Since intravascular blood may appear mildly hyperdense in normal and dehydrated individuals, a lack of venous distension may help prevent overcalling acute sinus thrombosis. Parenchymal edema and/or hemorrhage are secondary findings that may result from progressive venous hypertension. In the subacute and chronic phases, iso- to hypodense sinus thrombus is more difficult to appreciate on CT without IV contrast. On enhanced CT, the thrombosed sinus may exhibit an empty delta sign,36 a triangular contrast enhancement that is presumed to represent dilated collateral peridural and dural venous channels surrounding lower attenuation central thrombus (Figure 9). If intracranial sinus thrombosis is suspected clinically or on findings of noncontrast CT, multichannel CT venography (CTV) can quickly be performed during dynamic contrast administration by triggering automatic bolus tracking or by measuring a scan delay at the upper cervical internal jugular vein. Sagittal, coronal, and axial MPRs may quickly be created at the CT console, and together with source images, are usually sufficient for confirming the diagnosis of central venous thrombosis (Figure 10). Maximum-intensity projections and bone subtraction techniques37 may be performed on an off-line workstation if deemed necessary.
Conclusion
Compared with MRI, CT has fewer contraindications, affords easier observation of unstable patients, and is more readily available during nights and weekends. Newer multichannel CT scanners using spiral techniques provide rapid acquisition of intracranial CTA and CTP data, which permits the patient to return to more intensively monitored hospital locations during data postprocessing. CT perfusion maps and CTA MPRs can be created rapidly with commercially available software. These advanced CT techniques, together with noncontrast CT studies, may assist the radiologist in expediting the diagnosis of common intracranial emergencies, including acute thromboembolic ischemia, aneurysmal SAH, and venous sinus occlusion.
References
- Pressman B, Tourje E, Thompson J. An early CT sign of ischemic infarction: Increased density in a cerebral artery. AJNR Am J Neuroradiol. 1987;8:645-648.
- Tomura N, Uemura K, Inugami A. Early CT finding in cerebral infarction: Obscuration of the lentiform nucleus. Radiology. 1988;168:463-467.
- Truwit C, Barkovich A, Gean-Marton A. Loss of the insular ribbon: Another early CT sign of acute middle cerebral artery infarction. Radiology. 1990;176:801-806.
- Beauchamp N, Barker P, Wang P, van Ziji P. Imaging of acute cerebral ischemia. Radiology. 1999;212:307-324.
- von Kummer R, Bourquain H, Basxtianello S. Early prediction of irreversible brain damage after ischemic stroke at CT. Radiology. 2001;219:95-100.
- Tissue plasminogen activator for acute ischemic stroke. N Engl J Med. 1995;333:1581-1587.
- von Kummer R, Allen K, Holle R. Acute stroke: Usefulness of early CT findings before thrombolytic therapy. Radiology. 1997;205:327-333.
- Lev M, Farkas J, Gemmete J. Acute stroke: Improved nonenhanced CT detection—Benefits of soft-copy interpretation by using variable window width and center level settings. Radiology. 1999;213:150-155.
- Tomandl B, Klotz E, Handschu R. Comprehensive imaging of ischemic stroke with multisection CT. RadioGraphics. 2003;23:565-592.
- Eastwood J, Lev M, Provenzale J. Perspective: Perfusion CT with iodinated contrast material. AJR Am J Roentgenol. 2003;180:3-12.
- Hoeffner E, Case I, Jain R. Cerebral perfusion CT: Technique and clinical applications. Radiology. 2004;231:632-644.
- Gonzalez R. Imaging-guided acute ischemic stroke therapy: From “time is brain” to “physiology is brain.”. AJNR Am J Neuroradiol. 2006;27:728-735.
- Nabavi D, Cenic A, Craen R. CT assessment of cerebral perfusion: Experimental validation and initial clinical experience. Radiology. 1999;213:141-149.
- Schramm P, Schellinger P, Klotz E. Comparison of perfusion computed tomography and computed tomography angiography source images with perfusion-weighed imaging and diffusion-weighted imaging in patients with acute stroke of less than 6 hours’ duration. Stroke. 2004;35:1652-1658.
- Hacke W, Albers G, Al-Rawi Y. The Desmoteplase in Acute Ischemic Stroke Trial (DIAS): A Phase II MRI-based 9-hour window acute stroke thrombolysis trial with intravenous des-moteplase. Stroke. 2005;36:66-73.
- Study design of the International Stroke Trial (IST), baseline data and outcome in 984 randomised patients in the pilot study. J Neurol Neurosurg Psychiatry. 1996;60:371-376.
- Jahan R, Duckwiler G, Kidwell C. Intraarterial thrombolysis for treatment of acute stroke: Experience in 26 patients with long-term follow-up. AJNR Am J Neuroradiol. 1999;20:1291-1299.
- Wolpert S, Bruckmann H, Greenlee R. Neuroradiologic evaluation of patients with acute stroke treated with recombinant tissue plasminogen activator. The rt-PA Acute Stroke Study Group. AJNR Am J Neuroradiol. 1993;14:3-13.
- van der Wee N, Rinkel G, Hasan D, van Gijn J. Detection of subarachnoid haemorrhage on early CT: Is lumbar puncture still needed after a negative scan?. J Neurol Neurosurg Psychiatry. 1995;58:357-359.
- Mortgenstern L, Luna-Gonzales H, Huber J. Worst headache and subarachnoid hemorrhage: Prospective, modern computed tomography and spinal fluid analysis. Ann Emerg Med. 1998;32:297-304.
- Teksam M, McKinney A, Casey S. Multi-section CT angiography for detection of cerebral aneurysms. AJNR Am J Neuroradiol. 2004;25:1485-1492.
- Kouskouras C, Charitanti A, Giavroglou C. Intracranial aneurysms:evaluation using CTA and MRA. Correlation with DSA and intraoperative findings. Neuroradiology. 2004;46:842-850.
- Karamessini M, Kagadis G, Petsas T. CT angiography with three-dimensional techniques for the early diagnosis of intracranial aneurysms. Comparison with intra-arterial DSA and the surgi- cal findings. Eur J Radiol. 2004;49:212-223.
- Hoh B, Cheung A, Rabinov J. Results of a prospective protocol of computed tomographic angiography in place of catheter angiography as the only diagnostic and pretreatment planning study for cerebral aneurysms by a combined neurovascular team. Neurosurg. 2004;54:1329-1342.
- Tomandl B, Köstner N, Schempershofe M. CT angiography of intracranial aneurysms: A focus on postprocessing. RadioGraphics. 2004;24:637-655.
- Tomandl B, Hammen T, Klotz E. Bone-subtraction CT angiography for the evaluation of intracranial aneurysms. AJNR Am J Neuroradiol. 2006;27:55-59.
- Yoon D, Choi C, Kim K, Cho B. Multidetector-row CT angiography of cerebral vasospasm after aneurysmal subarachnoid hemorrhage: Comparison of volume-rendered images and digital subtraction angiography. AJNR Am J Neuroradiol. 2006;27:370-377.
- Wintermark M, Ko N, Smith W. Vasospasm after subarachnoid hemorrhage: Utility of perfusion CT and CT angiography on diagnosis and management. AJNR Am J Neuroradiol. 2006;27:26-34.
- Rinkel G, Wijdicks E, Vermeulen M. Nonaneurysmal perimesencephalic subarachnoid hemorrhage: CT and MR patterns that differ from aneurysmal rupture. AJNR Am J Neuroradiol. 1991;12:829-834.
- Schwartz T, Solomon R. Perimesencephalic nonaneurysmal subarachnoid hemorrhage: Review of the literature. Neurosurgery. 1996;39:433-439.
- Chang R, Friedman D. Isolated cortical venous thrombosis presenting as subarachnoid hemorrhage: A report of three cases. AJNR Am J Neuroradiol. 2004;25:1676-1679.
- Given C, Burdette J, Elster A, Williams D. Pseudo-subarachnoid hemorrhage: A potential imaging pitfall associated with diffuse cerebral edema. AJNR Am J Neuroradiol. 2003;24:254-256.
- Ruigrok Y, Rinkel G, Buskens E. Perimesencephalic hemorrhage and CT angiography: A decision analysis. Stroke. 2000;31:2976-2983.
- Wendling L. Intracranial venous sinus thrombosis: Diagnosis suggested by computed tomography. AJR Am J Roentgenol. 1978;130:978-980.
- Vijay R. The cord sign. Radiology. 2006;240:299-300.
- Lee E. The empty delta sign. Radiology. 2002;224:788-789.
- Majoie C, van Straten M, Venema H, den Heeten G. Multisection CT venography of the dural sinuses and cerebral veins by using matched mask bone elimination. AJNR Am J Neuroradiol. 2004;25:787-791.
Citation
. Things that go bump in the night: Neuroradiology emergencies. Applied Radiology. 2007;36(8):10-23. doi:10.37549/AR1539.